Abstract
The potential applications of cellulose nanomaterials in advanced composites and biomedicine makes it imperative to understand their pulmonary exposure to human health. Here, we report the results on the biodurability of three cellulose nanocrystal (CNC), two cellulose nanofibril (CNF) and a benchmark cellulose microcrystal (CMC) when exposed to artificial lung airway lining fluid (SUF, pH 7.3) for up to 7 days and alveolar macrophage phagolysosomal fluid (PSF, pH 4.5) for up to 9 months. X-ray diffraction analysis was used to monitor biodurability and thermogravimetry, surface area, hydrodynamic diameter, zeta potential and free radical generation capacity of the samples were determined (in vitro cell-free and RAW 264.7 cell line models). The CMC showed no measurable changes in crystallinity (xCR) or crystallite size D in either SUF or PSF. For one CNC, a slight decrease in xCR and D in SUF was observed. In acidic PSF, a slight increase in xCR with exposure time was observed, possibly due to dissolution of the amorphous component. In a cell-free reaction with H2O2, radicals were observed; the CNCs and a CNF generated significantly more ●OH radicals than the CMC (p<0.05). The ●OH radical production correlates with particle decomposition temperature and is explained by the higher surface area to volume ratio of the CNCs. Based on their biodurability, mechanical clearance would be the primary mechanism for lung clearance of cellulose materials. The production of ●OH radicals indicates the need for additional studies to characterize the potential inhalation hazards of cellulose.
Keywords: Biodurability, cellulose nanocrystals and nanofibrils, free radicals, microcrystalline cellulose, pulmonary inflammation, X-ray diffraction
Introduction
Increasingly, there is demand for products made of nonpetroleum based materials with low-environmental impact and low-health risk to humans. Cellulose nanomaterials could be a building block for developing such materials (Moon et al., 2011). Cellulose (C6H10O5)n is one of the main molecules in the cell walls of trees and plants and is also formed by some fungi, bacteria, algae and marine tunicates. Cellulose is a biopolymer consisting of a linear chain of several hundred to thousands of glucose (C6H12O6) molecules. Each glucose molecule contains a carboxyl functional group and a hydroxyl functional group which undergo nucleophilic addition to form a hemiacetal ring (Figure 1). During biosynthesis, adjacent glucose molecules bond with each other via 1,4-β-glycoside linkages (i.e. the hydroxyl group at carbon in position 1 of a molecule bonds with the carbon at position 4 of the next molecule) so that neighboring units are corkscrewed 180° with hydroxyl groups in the ring plane (Habibi et al., 2010; Moon et al., 2011). Hydrogen bonding of adjacent glucose molecules results in stacking of cellulose chains to form elementary fibrils which in turn form larger microfibrils, the latter which have diameters up to 50 nm and lengths of several micrometer (Moon et al., 2011). Within elementary fibrils, highly ordered repeating patterns of glucose molecules form regions of crystalline cellulose.
Figure 1.
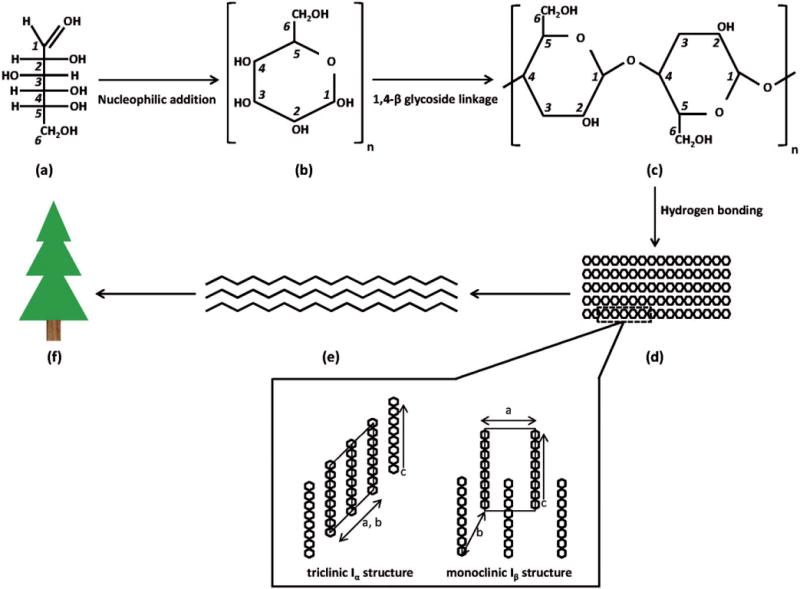
(a) Individual glucose molecules contain a carboxyl functional group at the C1 position and a hydroxyl functional group at the C5 position which undergo (b) nucleophilic addition to form a hemiacetal ring; (c) bonding of adjacent glucose ring molecules via 1,4-β-glycoside linkages forms cellulose chains; (d) hydrogen bonding of adjacent glucose molecules in cellulose chains forms elementary fibrils; (e) which in turn form larger microfibrils, and eventually (f) plant structures. Within elementary fibrils, highly ordered repeating patterns of glucose units form crystalline regions (denoted by dotted box) which can have triclinic Iα structure or, as in the case of cellulose I and II, a monoclinic Iβ structure (where a, b and c denote crystalline planes). In the Iβ structure, the chains are displaced by c/4.
Cellulose nanomaterials are derived by extracting the crystalline regions of microfibrils. Depending upon the method of biosynthesis of the cellulose microfibrils (CMF) and the extraction process used to isolate the crystals, the type of cellulose obtained can be cellulose nanocrystals (CNC), cellulose nanofibrils (CNF) or CMF. Extraction of wood fibers, non-wood plant fibers and CMF by acid hydrolysis of amorphous domains yields whisker-shaped CNCs (Bai et al., 2009). Generally, CNCs possess a high degree of crystallinity (~54–88%) and high aspect ratios (Moon et al., 2011). Extraction of purified wood and non-wood plant fibers via mechanical (e.g. homogenizers to shear microfibrils) processing, often with chemical pre-treatment, yields high aspect ratio CNF (Moon et al., 2011; Saito et al., 2009). Mechanical refining of wood pulp or non-wood plant pulp yields high aspect ratio CMF having nanoscale width and micron-scale length. In addition to cellulose nanomaterials, purified wood pulp can also be pulverized and subjected to acid hydrolysis to form cellulose microcrystals (CMC). These fibers typically have widths of 10–50 μm and crystallinity of ~80–85% (Moon et al., 2011; Seehra et al., 2012). Cellulose nanomaterials possess high strength and directional rigidity, high surface area, high aspect ratio, low density and good thermal stability which make them ideal for use in advanced composites (Habibi et al., 2010; Lee et al., 2012; Ruiz et al., 2000), electronic storage devices (Hubbe et al., 2008), and as biocompatible and biodegradable scaffolds to direct tissue or bone growth (Future Markets Inc., 2012; Mathew et al., 2013; Sehaqui et al., 2011; Siqueira et al., 2013; Zoppe et al., 2009). CMC is used as a low-calorie substitute for fat and fillers in some foods and an excipient agent in pharmaceutical tablet drugs administered via ingestion (French et al., 2003).
Inhalation of CMC is associated with adverse effects in rats. Under overload conditions in the lungs, rats instilled with cellulose were observed to have transient inflammation (Cullen et al., 2000) and engulfment by alveolar macrophage cells followed by formation of granulomas (Muhle et al., 1997; Tatrai et al., 1995) and long-term retention (clearance half-time of >500 days). Understanding of potential adverse effects from exposure to cellulose nanomaterials is limited. Male et al. (2012) observed that CNC derived from flax, hemp and other biomass materials did not cause significant cytotoxicity in vitro. Vartiainen et al. (2011) reported that birch wood CMF did not induce release of inflammatory cytokines or cause significant in vitro cytotoxicity to mouse macrophages and human monocyte-derived macrophage cells. Studies by Pereira et al. (2013) and Alexandrescu et al. (2013) suggest that cotton- and wood-derived CNF do not cause significant cytotoxicity to fibroblast cells in vitro, though viability and altered expression of genes associated with cell stress are observed at high CNF concentrations.
With the rapid interest in commercial applications of cellulose nanomaterials and recent efforts to scale production from laboratory scale to pilot plant, there may be opportunity for inhalation exposure to workers. Vartiainen et al. (2011) evaluated friction grinding and spray drying of birch wood CMF using non-specific real-time particle counting instruments. During wet grinding of CMF suspensions, the concentration of airborne nanoparticles in workplace air was above background though total airborne particle number concentration was generally low. During spray drying of CMF suspensions, total particle number concentration in workplace air was a factor of three higher than background levels. Martinez et al. (2013) monitored exposure to airborne CNCs at a pilot-scale production facility. In that study, CNCs were tagged with cesium metal which allowed for their collection onto filters and subsequent analysis for cesium content using inductively coupled plasma-atomic emission spectroscopy. Cesium was detected on filter samples which indicated that CNCs were aerosolized during centrifugation of product slurry and subsequent removal of dry product from a freeze dryer. The morphology of airborne particles generated these tasks was not reported so it is unknown whether the cesium tag corresponded to dispersed nanoscale CNCs or aggregated micron-scale CNCs.
While cellulose nanomaterials hold great commercial promise, data are needed to understand their potential safety. The purpose of this study was to evaluate the lung biodurability and free radical generation capacity (as a precursor of inflammation responses) of CNC and CNF powders and compare data to a commercially available benchmark CMC material. The hypothesis of this research was that because of their higher surface areas, inhaled dispersed CNC and CNF materials will have different biodurability than CMC in artificial lung fluids.
Materials and methods
Six materials were evaluated in this study: three CNC, two CNF and one CMC (used as a benchmark because it is made of cellulose and has high crystallinity but different physical dimensions than the test materials). CNC and CNF were chosen for this study as these are the most commercially produced types of cellulose nanomaterials (Future Markets Inc., 2012). Two private sector companies each donated a CNC material in powder form. One CNC and two CNF materials were donated by the US Department of Agriculture, Forest Products Laboratory. A CMC powder material was purchased on the open market (Product No. 8-01018; Carbomer Inc., San Diego, CA) for use as a benchmark. For purposes of our study, the CNC powders are designated A, B or C. The CNC-A powder was made by acid hydrolysis using sulfuric acid followed by spray drying and was in the Na+ salt form. The CNC-B powder was prepared by physical processing without sulfur and was in the Na+ salt form. The CNC-C (6.6% by weight suspension) was produced by acid hydrolysis using sulfuric acid followed by counter-ion exchange to yield a Na+ salt form. One CNF material (0.84% by weight suspension) was made by pre-treatment with 2,2,6,6-tetramethylpiperidine-1-oxyl radical (TEMPO) and herein referred to as CNF-T. The other CNF (0.5% by weight suspension) was made by mechanical homogenization (referred to as CNF-H).
Characterization
Characterization of cellulose nanomaterials included investigations of their physical properties [specific surface area (SSA), density, physical dimensions, hydrodynamic diameter and zeta potential] and chemical properties (crystallinity, composition, thermal stability and impurities).
SSA
The Brunauer–Emmett–Teller (BET) surface area of each as-received aggregated powder material was measured using nitrogen gas adsorption (Nova 2200e, Quantachrome Corporation, Boynton Beach, FL). This technique is only applicable for solid materials which precluded measurement of the materials in suspension. For each material, two samples were prepared and analyzed in replicate for a total of four measurements. The powders were degassed under light vacuum while raising the temperature from ambient to 80 °C within ~30 min, holding at 80 °C overnight, and allowing to cool slowly back to ambient. A value of 1.62×10⁻¹⁹ m2 was used for the molecular cross-sectional area of N2 at77 K. The BET surface area was calculated from at least six adsorption points in the range p/p0 = 0.01–0.3; values were normalized to dry sample masses to calculate SSA in units of square meter per gram.
Powder density
Density of the powder materials was determined using a helium pycnometer (Multipycnometer, Quantachrome Corporation). This technique is only applicable for solid materials which precluded measurement of the materials in suspension. A sample of powder was placed in a pre-weighed sample cup, dried in an oven at 60 °C overnight, and placed in a dessicator to cool. The sample cup with powder was reweighed to 0.1 mg to determine the mass of dry powder. The sample was purged in the pycnometer using dry helium. The volume data was normalized by dry sample mass to calculate density in units of gram per centimeter cubed.
Physical dimensions by electron microscopy
Each study material received in powder form was suspended in 0.02-μm filtered deionized water (0.01% w/w), sonicated for 15 s and an aliquot placed onto a pre-cleaned glass microscope slide. Each slide was mounted on an aluminum stub using carbon tape, sputter coated with gold/palladium and imaged using field-emission scanning electron microscopy (S-4800; Hitachi, Tokyo, Japan). For study materials received in suspension form, the liquid was briefly subjected to ultrasonic agitation and a drop of suspension (25 μL) pipetted onto a grid with a positively charged coating (SMART grid; Dune Sciences Inc., Eugene, OR) and allowed to incubate for 10 min. Subsequently, the grid was removed from the suspension, excess liquid was wicked away with a lint-free wipe, and the grid floated on a drop of 2% (w/w) aqueous uranyl acetate solution for 10 min to stain the cellulose and enhance contrast. Grids were analyzed using transmission electron microscopy (JEM-1220; JEOL, Tokyo, Japan).
Hydrodynamic diameter
The hydrodynamic (DH) diameter of each material was determined using photon correlation spectroscopy (PCS). This technique expresses size as an equivalent spherical diameter and hence does not represent the actual physical dimensions of high aspect ratio particles such as CNC; however, values can be used for relative comparison purposes (Beck et al., 2012). A 0.1% weight suspension of each material was prepared in an aluminum sample container using 0.02-μm filtered 18-MΩcm distilled and deionized water. Next, the suspension was agitated using a probe sonicator (XL 2000; QSonica, Newtown, CT) fitted with a 3-mm titanium probe for 1 min using a cycle of 10 s ON followed by 5 s OFF (repeated four times). The delivered energy, as verified calorimetrically (Taurozzi et al., 2011), was 250 J. For analysis, 5 mL a clean borosilicate glass vial, diluted with 5 mL of 0.02-μm filtered 10 mM sodium chloride solution and passed through a 0.7-μm pore glass fiber syringe filter. The parameters for the materials and dispersant for analysis were: refractive index of material = 1.530, absorbance of material = 0.01, refractive index of dispersant = 1.332 and viscosity of dispersant = 0.8872cP. All measurements were performed at 25 °C (Zetasizer Nano ZS90; Malvern Instruments, Worcestershire, UK) equipped with a 633-nm laser at a 90° scattering angle. Note that the physical dimensions of the CMC were larger than the reliable size limit for the PCS instrument which precluded accurate measurements of this material.
Zeta potential
The electrophoretic mobility of each study material was determined using the same suspensions from determination of DH (a fresh suspension was prepared for the CMC using the same dispersant). The pH of the samples was determined before measurement using a calibrated electrode. The refractive index and viscosity for the 5 mM sodium chloride dispersant were the same as given above and the dielectric constant = 78.6 and Smoluchowski approximation, f(κa) value = 1.5; all measurements were performed at 25 °C (Zetasizer Nano ZS90, Malvern Instruments).
Crystallinity and crystallite size
To identify crystalline properties of study materials, X-ray diffraction (XRD) patterns were obtained and the d-spacings and 2θ positions of the observed lines were compared to published reference patterns for cellulose. The room temperature patterns were acquired with a Rigaku diffractometer (D/Max-B) equipped with CuKα source (λ= 1.54185 Å). After hand-grinding the samples with mortar and pestle, each sample was loaded onto a special silicon plate (with negligible background XRD signal of its own) using a few drops of ethanol for adhesion and then mounted vertically into the diffractometer. Typically, scans covered the 2θ range of 5–60° where most of the strong lines from cellulose are expected. Each scan was done at a step size of 0.06° with a counting time of 5 s at each step. These measurements were done at West Virginia University.
To determine the crystallinity (xCR) of cellulose materials, the Segal method was employed which defines xCR in terms of the peak height I200 of the (200) Bragg line near 2θ = 22.5° and amorphous component Iam near 2θ = 18.5° (Agarwal et al., 2010; Park et al., 2010; Segal et al., 1959) as:
| (1) |
The crystallite size, D, of cellulose was determined from the Scherrer relation:
| (2) |
where, β is the peak full-width at half-maximum of the strong (200) line in radians.
Thermogravimetric analysis
All the study samples were tested for their thermal stability using thermogravimetric (TGA) analysis (Q50; TA Instruments, New Castle, DE) at West Virginia University. Each sample was mounted in a balance and heated in flowing nitrogen gas at a rate of 10 °C/min from room temperature to 600 °C while simultaneously measuring the changes in sample weight. From the peak position of the computed plots of sample weight change versus temperature (dW/dT), the decomposition temperature (Tp) for each sample was determined.
Bulk composition
Carbon, hydrogen, oxygen and sulfur content of cellulose materials were assayed to determine bulk elemental composition (Galbraith Laboratories Inc., Knoxville, TN). For the materials in suspension, samples were first dried in a glass mortar and the particles removed by scraping with a Teflon® rod. Total carbon and hydrogen content were determined by combustion using American Society of Testing Materials (ASTM) Method D5373 (ASTM International, 2008a), sulfur content was determined by combustion using ASTM Method D4239 (ASTM International, 2008b) and oxygen content was assayed by pyrolysis.
Biodurability studies
Biodurability was evaluated by monitoring DH, zeta potential, xCR and D with time exposed to artificial lung fluids. Each material was evaluated in artificial airway epithelial lining fluid using serum ultrafiltrate (SUF) (Finch et al., 1988; Kanapilly et al., 1973) and artificial alveolar macrophage phagolysosomal simulant fluid (PSF) (Stefaniak et al., 2005). The pH of SUF was maintained at 7.3 ± 0.1 by passing flowing CO2 (5%) and air (95%) across the solvent. The pH of PSF was maintained at 4.5 ± 0.1 using potassium hydrogen phthalate buffer. All samples were maintained at 37 °C for the duration of the study period using an incubator.
For each experiment, 0.09 g of a cellulose material was placed in an aluminum bottle with 0.06 L of artificial lung fluid and subjected to ultrasonic agitation with a 3-mm probe tip in ice bath for 8 min (delivered energy = 4000 J). The dispersed cellulose suspension was split equally into three labeled sterile centrifuge tubes, capped and placed on a platform rocker (model: ROCAA115S; Stovall Life Sciences, Greensboro, NC) in an incubator (15 cpm, 5° tilt). Separate suspensions were prepared for each material and solvent at each sample collection time point (described below).
To mimic the short-term residence time of particles in the conducting airways, cellulose samples in SUF were collected at Hour 3, 6, 12, 24, Day 3, 4 and 7. To mimic the long-term residence time of cellulose particles in alveolar macrophages (Muhle et al., 1997), samples in PSF were collected at Hour 3, 6, 12, 24, Day 2, 4, 7, 14, 21, 28 and at 2, 3, 4, 5, 6 and 9 months. For each experiment, field blank samples (centrifuge tubes with artificial lung fluid only) were prepared and handled in the same manner as experimental samples. Note that CNF-H was not included in the PSF study because of the unstable nature of the material which precluded reliable measurement of its characteristics in the as-received form and in the initial SUF study.
At each pre-designated time point, three samples of each study material and one field blank were removed from the incubator. The pH of lung fluid in all samples was measured using a calibrated electrode connected to a multimeter. Depending upon the time point, values of DH, zeta potential, xCR and/or D were determined as described previously. Prior to analysis of DH and zeta potential, cellulose lung fluid suspensions were manually shaken to mix and an aliquot withdrawn and diluted with water prior to analysis. The remaining suspension was centrifuged for 10 min at ~640 g. The remaining supernatant was decanted and discarded. In the studies with SUF, residual salts from the fluid produced high intensity diffraction peaks which masked the weaker cellulose peaks. To reduce the salt signals, subsequently each cellulose pellet was re-suspended in 5–10 mL of deionized water, centrifuged and the supernatant discarded. This wash procedure was repeated three times for each sample. After the last wash procedure, the cellulose pellet was re-suspended in a few milliters of deionized water, transferred to a plastic weigh dish and placed in an oven overnight to dry prior to analysis by XRD.
Free radical generation studies
Electron spin resonance (ESR) spin trapping was used to detect short-lived free radical intermediates. Hydroxyl radicals (●OH) were measured using the addition-type reaction of a short-lived radical with a compound (spin trap) to form a relatively long-lived free radical product (spin adduct), which can then be studied using conventional ESR. Macrophages attack and engulf foreign bodies (including particles) that invade the lung where they can react with H2O2 as one of their defense mechanisms. This H2O2 can react with particles in a Fenton-like manner and generate more damaging free radicals. Modeling this respiratory burst defense system with H2O2 provides a source of preliminary data on the biologic reactivity of the particles involved (Dahlgren et al., 2007). Thus, particles were reacted with H2O2 in order to measure their potential to generate reactive radical species when inhaled and exposed to an organism’s defense systems.
The choice of appropriate dose metric for poorly soluble nanomaterials (mass, number and surface area) is being debated in the literature (Wittmaack, 2006). Surface area can be estimated from external dimensions of particles measured using electron microscopy or by gas adsorption, though both techniques require expensive instrumentation. Determination of number concentration for particles in suspension can be problematic because common techniques such as our dynamic light scattering instrument have a practical upper size limit of range of a few micrometers which is below the dimensions of the CMC. In this situation, multiple techniques would be needed to determine number concentration which could introduce error because of different instrument measurement principles. Hence, for the free radical generation studies, we used mass as the metric because gravimetric determination of powder mass would allow for easy replication of our studies. For H2O2 Fenton-like reaction measurements, reactants were mixed in test tubes at a final volume of 1.0 mL of phosphate-buffered saline (PBS), particles in the presence of 10 mM H2O2 and 100 mM of 5,5-dimethyl-1-pyrroline-N-oxide (DMPO) (final particle concentration of 1 mg/mL) and vortexed for 10 s. In this system, a high dose was required to observe a reaction within the short exposure time necessitated by the use of ESR. The reaction mixture was transferred to a flat cell for ESR measurement at room temperature under ambient air.
Free radical generation potential was also evaluated using the RAW 264.7 monocyte macrophage cell line. RAW 264.7 cells (3×10⁶), DMPO (200 mM) and cellulose materials were mixed in test tubes with PBS to a final volume of 1.0 mL. This system allows the monocyte macrophages to react to the particle exposure and measures respiratory burst and free radical generation. The reaction mixture was allowed to incubate at 37 °C for 10 min and then transferred to a flat cell for ESR measurement at room temperature under ambient air.
The intensity of the ESR signal was used to measure the amount of short-lived radicals trapped, and the hyperfine couplings of the spin adduct were characteristic of the original trapped radicals. Spin trapping was the method of choice for detection and identification of free radical generation due to its specificity and sensitivity. All ESR measurements were conducted using a Bruker EMX spectrometer (Bruker Instruments Inc., Billerica, MA). Hyperfine couplings were measured (to 0.1 G) directly from magnetic field separation using potassium tetraperoxochromate and 1,1-diphenyl-2-picrylhydrazyl as reference standards (Buettner, 1987; Janzen & Blackburn, 1968). Min-U-Sil silica (<5 μm) was used as a particle control. The relative radical concentration was estimated by multiplying half of the peak height by ; where, ΔHpp represents peak-to-peak width. The Acquisit program (Bruker Instruments Inc.) was used for data acquisitions and analyses.
Results
Table 1 summarizes the physical characteristics of the as-received cellulose materials. Values of SSA for the as-received cellulose powders ranged from 0.6 to 1.4 m2/g. During manufacturing, CNC suspensions are dried for storage and transport which results in the formation of large aggregates via hydrogen bonding (Beck et al., 2012). Hence, because of their nanoscale physical dimensions, the individual CNCs are expected to have significantly higher SSA than measured for the aggregated material. Measured densities (1.6 g/cm3) match published values (Moon et al., 2011). Values of DH ranged from 80 (CNC-C) to 417 nm (CNF-H). Generally, the zeta potential of cellulose materials ranged from −30 to −50 mV, except for CNF-H which had potential of −11 mV. A summary of the measured values of carbon, hydrogen, oxygen and sulfur content for the cellulose materials is provided in Appendix A.
Table 1.
Physical properties of the as-received cellulose materials (average ± standard deviation).
| Material | Description | SSA (m2/g) | Density (g/cm3) | DH (nm) | Zeta (mV)a |
|---|---|---|---|---|---|
| CMC | Benchmark | 1.23 ± 0.07 | 1.57 ± 0.14 | – | −37.5 ± 0.9 |
| CNC-A | Sulfated | 0.55 ± 0.03 | 1.56 ± 0.31 | 105.4 ± 1.4 | −37.5 ± 1.5 |
| CNC-B | Unsulfated | 1.36 ± 0.10 | 1.63 ± 0.16 | 194.1 ± 6.1 | −32.4 ± 1.6 |
| CNC-C | Sulfated | N/A | N/A | 80.3 ± 0.5 | −40.1 ± 2.1 |
| CNF-T | TEMPO | N/A | N/A | 88.4 ± 1.7 | −48.3 ± 5.0 |
| CNF-H | Homogenizer | N/A | N/A | 417.1 ± 38.7 | −10.7 ± 2.8 |
pH of suspensions: 7.8 (CMC, CNC-A), 7.4 (CNC-B), 7.3 (CNC-C), 7.2 (CNF-T) and 3.7 (CNF-H). N/A = analysis not applicable for materials in suspension form, and dash (–) denotes measurement not performed because the physical dimensions of the CMC were larger than the reliable size limit for the instrument.
Figure 2 is micrographs of the as-received materials. The benchmark CMC powder was elongated flat particles that had physical length <10 μm and diameter <2 μm (mean aspect ratio = 7; orientation-averaged aerodynamic diameter, Dae = 3 ± 1 μm). CNC-A powder was aggregates of semi-spherical particles with average Dae = 9 μm). CNC-B powder was a mixture of aggregates of semi-spherical particles and elongated flat particles; the mean AR of all particles was 2.5 (Dae = 10 μm). The CNC-C was ellipse-shaped elongated particles with average diameters of ~10 nm (at widest cross-section) and average lengths of ~105 nm (aspect ratio = 12; orientation-averaged Dae = 25 nm). CNF-T was relatively straight elongated particles with average diameter of ~11 nm and length of ~165 nm (aspect ratio = 14; orientation-averaged Dae = 32 nm). An image that was clear enough to discern external dimensions could not be obtained for the CNF-H material.
Figure 2.
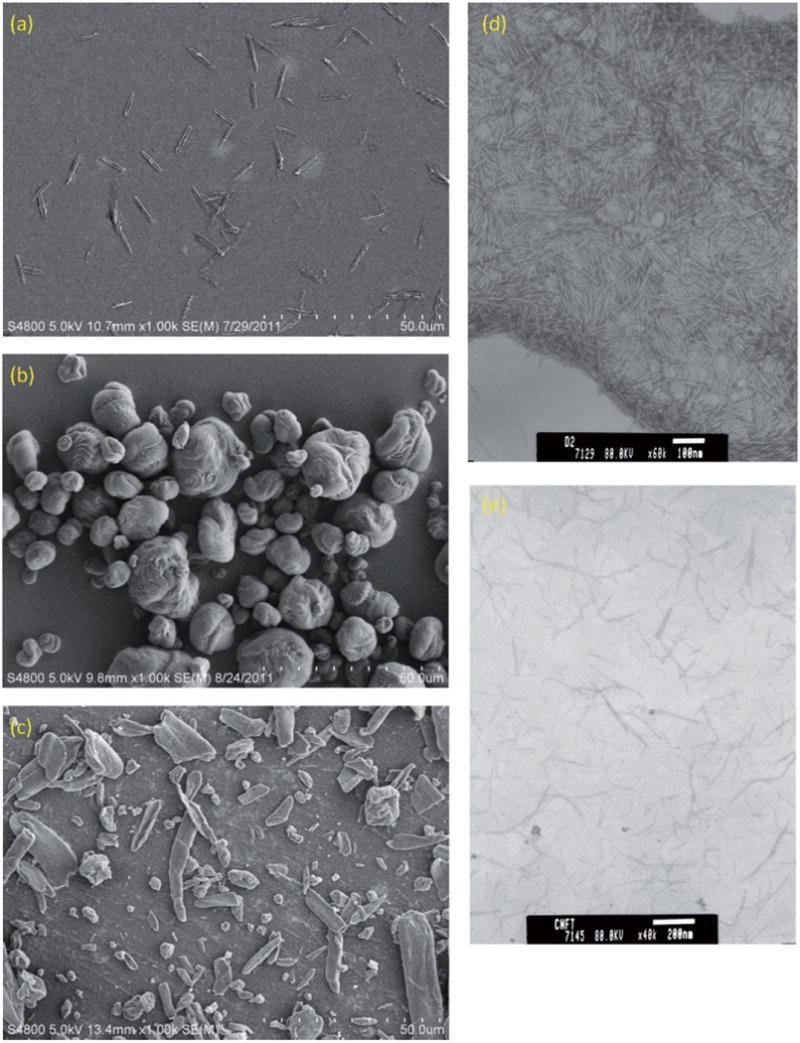
Electron micrographs of the as-received cellulose materials: (a) CMC (benchmark material), (b) CNC-A, (c) CNC-B, (d) CNC-C and (e) CNF-T. Scanning electron microscopy was used to image the larger aggregated powder materials and transmission electron microscopy was used to image the smaller individual particles received as aqueous dispersions. A clear image could not be obtained for the CNF-T material.
Figure 3 shows the baseline powder XRD patterns of each of the study materials before exposure to artificial lung fluids. A reliable spectrum could not be obtained from the CNF-H material. Following the discussion in the article by Mansikkamaki et al. (2007), the structure of CNC-C corresponds to cellulose II, whereas the spectra for the other four samples correspond to cellulose I. For CNF-T, the lines are broader because of the smaller crystallite size. Both cellulose I and cellulose II have monoclinic structures but different unit cell parameters. An important signature of cellulose II is the strong Bragg line at 2θ ~ 12° which is absent in the cellulose I structure. Since the length of the c-axis is nearly the same in cellulose I and cellulose II, the (004) line is a common feature of the two structures. However, the Miller indices of the remaining lines are quite different as evident in the spectra.
Figure 3.
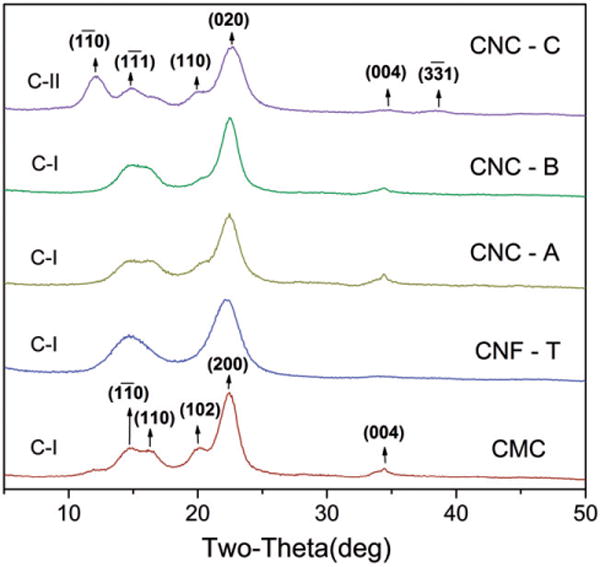
Comparison of the X-ray diffraction patterns of the as-received cellulose materials indicating that the structure of CNC-C corresponds to cellulose II whereas the spectra for CNC-A, CNC-B, CNF-T and CMC correspond to cellulose I. The numbers on the peak positions are the Miller indices of the cellulose I and cellulose II structures.
Biodurability in SUF
The XRD patterns for the cellulose materials exposed to SUF for 7 days are provided in Appendix B. The spectra indicate that the crystalline structure of the materials remained intact while immersed in SUF although there are small changes in the XRD patterns especially for CNC-A in which the weaker (102) and (004) lines are not observed in the exposed samples. There were no apparent trends in changes of xCR or D with exposure to SUF, with the possible exception of CNC-A for which systematic slight decrease in these parameters with increase in exposure time is indicated (Appendix B). Plots of the measured values of DH and zeta potential for all cellulose materials in SUF are provided in Appendix B. Within each material, values of DH were generally constant within the error of the measurements which indicated no significant change in particle size (becoming smaller from dissolution or larger from agglomeration) in SUF over 7 days. Measured values of zeta potential were between −30 to −60 mV which indicated that the cellulose materials in SUF had fairly good dispersion stability.
Biodurability in PSF
As representative of the XRD patterns of the samples exposed to PSF for up to 9 months, Figure 4 shows the spectra of the CMC benchmark material for up to 28 days and a representative CNC material (CNC-B) for exposure from 3 to 9 months. Additional XRD patterns of samples exposed to PSF are provided in Appendix C. For all CNF-T samples and a few of the CNC and CMC samples, no useful information on exposure to PSF could be obtained because the XRD patterns were dominated by Bragg lines from the PSF salts that remained adhered to the cellulose after repeated washings with deionized water. The spectra indicate that the crystalline structure of the materials remained intact while immersed in PSF. The overall changes in xCR and D for four samples namely CMC, CNC-A, CNC-B and CNC-C following exposure to PSF for up to 9 months are shown in Figure 5. For the benchmark CMC material, there were no measurable changes in xCR and D with exposure time to PSF. For CNCs, there appeared to be a slight, but not significant, increase in the magnitude of xCR with exposure time. No systematic trends in changes of D with exposure time were observed for any of the CNC samples. Interestingly, for CNC-C, both xCR and D were comparatively smaller which may be related to the different crystal structure of this material (cellulose II) as compared to the structure of the other samples (cellulose I).
Figure 4.
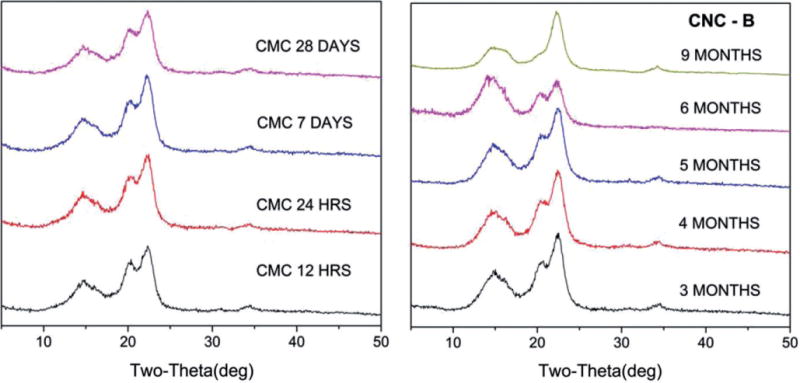
X-ray diffraction patterns for representative CMC (benchmark material) and CNC-B exposed to artificial macrophage PSF for specific times listed on the patterns.
Figure 5.
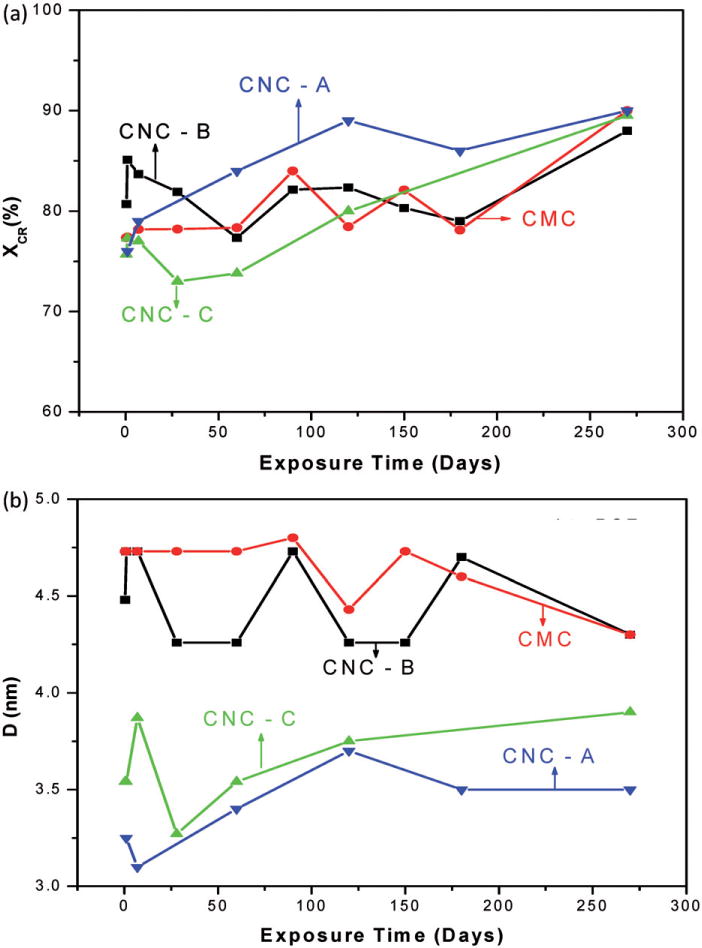
Plots of (a) crystallinity (xCR) and (b) crystallite size (D) for the CNCs and the CMC benchmark material exposed to artificial macrophage PSF for up to 9 months (lines connecting the points are drawn as visual guides).
Plots of measured values of DH and zeta potential for all cellulose materials in PSF are shown in Appendix C. Values of DH for CNC-A indicated agglomeration during exposure to PSF, whereas DH for CNC-B and CNC-C was generally constant with time over 9 months. For the CNF-T material, values of DH were 150–200 nm during the first 14 days and decreased to ~90 nm thereafter indicating some deagglomeration. Among materials, values of zeta potential in PSF ranged from −7 to −30mV, which is about half the corresponding values observed for SUF.
TGA
The decomposition of the cellulose materials was investigated to evaluate whether any correlation existed between the thermal decomposition of the cellulose samples and their biodurability. Figure 6(a) is a plot of the change in the weight, W, of the samples with temperature obtained at a heating rate of 10 °C/min in flowing N2 gas. The loss of a few weight percent near 100 °C in all the samples is attributed to the loss of adsorbed water with additional weight loss occurring at higher temperatures. For the CMC sample, decomposition begins near 300 °C with the maximum Tp in dW/dT occurring at 350 °C as also reported previously in CMC (Seehra et al., 2012); for the CNC and CNF samples, values of Tp are lower by up to ~50 °C. Figure 6(b) is a plot of values of Tp determined from the position of the maximum in dW/dT for each cellulose sample. The observed lower values of Tp for the CNC samples as compared to that for the CMC sample are designated by ΔTp (Figure 6c) which have implications for the intensities of free radicals generated by these samples (see below).
Figure 6.
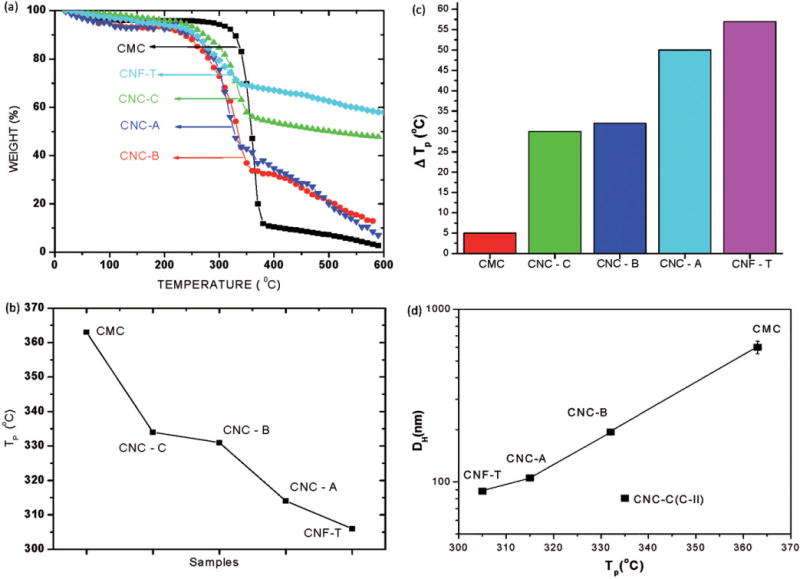
Plots of (a) percentage changes in weight of the CMC benchmark material and cellulose nanomaterials with changes in temperature (all samples were heated at a rate of 10 °C/min in flowing nitrogen gas from ambient to 600 °C), (b) the decomposition temperature Tp for the CMC benchmark material and cellulose nanomaterial samples (lines connecting the data points are visual guides), (c) bar plot of the change in Tp for different samples relative to Tp for the CMC sample and (d) hydrodynamic diameter (DH) versus the decomposition temperature (Tp) determined using TGA indicating that the data for the CNCs with the cellulose I structure have a good correlation between the two quantities (understandably CNC-C with the more stable cellulose II structure does not fit this pattern in that its decomposition is higher for its smaller size).
Free radical generation
The potential of these cellulose materials to generate free radicals was measured using ESR spectroscopy with DMPO as a spin trap. Figure 7 illustrate that free radicals were generated in vitro when reacting cellulose materials (the CNC-A material formed a viscous gel upon dispersion in PBS which precluded measurement of its ESR signal) with H2O2 using the classic Fenton reaction:
which can also be represented as a “Fenton-like” reaction, where M represents a transition metal:
Figure 7.
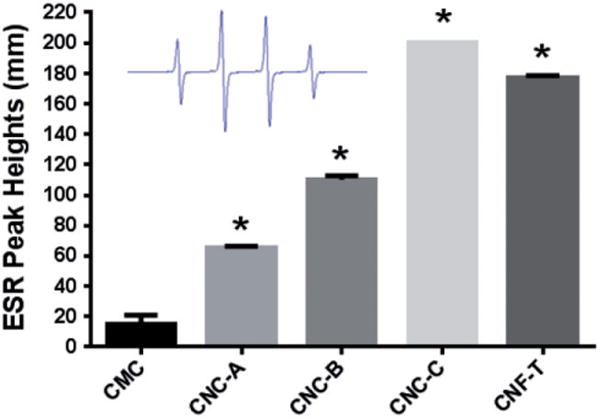
Measured hydroxyl peak heights from the generation of short-lived ●OH radicals by cellulose particles upon reaction with H2O2. ESR spectrum recorded 3 min after reaction was initiated in PBS (pH 7.4) containing H2O2 (10 Mm) and DMPO (100 mM) vortexed for 10 s. ESR settings were center field, 3470 G; scan width, 100 G; time constant, 0.40 s; modulation amplitude, 1G; receiver gain, 2.52 × 10⁴; frequency, 9.754 GHz and power, 63 mW. Inset is a typical ●OH spectra observed. Asterisk denotes response significantly different from CMC.
All tested cellulose nanomaterials generated significantly more ●OH radicals than the CMC benchmark material; the NFC-H and NFC-T samples were the most reactive among all samples. The PBS control sample generated no radicals. Interestingly, the cellular reaction to the cellulose materials was negligible with no measurable ESR peaks generated. The positive control Min-U-Sil generated high levels of ●OH radicals and the soluble Cr6+ generated even greater levels of ●OH radicals in the RAW cell line.
The similarity of ΔTp for different samples in Figure 6(c), and the ESR signal intensity in Figure 7 are related to the overall size of the cellulose nanomaterials since surface area per unit volume of a particle varies inversely with its size. Figure 6(d) illustrates a close correlation between the magnitudes of the hydrodynamic diameters DH (Table 1) and ΔTp. Note that CNC-C and CNF-T have not only the smallest DH but also the smallest crystallite size as measured by XRD (Figure 5) and these two samples also produced the highest ESR response (Figure 7). Thus, the magnitude of ESR intensity observed in these cellulose nanomaterials is interpreted to be largely a surface area effect with smaller particles with higher surface area yielding higher ESR intensity. The lower values of Tp for the particles with smaller values of DH is also a surface effect because atoms on the surface of a particle have lower cohesive energy as compared to atoms in the bulk of a particle. These observed correlations between DH, ΔTp and ESR intensity are important results of this work.
Discussion
The as-received CMC and cellulose nanomaterials had distinctly different physicochemical properties, including DH and zeta potential (Table 1), morphology and size (Figure 2), xCR and D (Appendix B and Figure 5), and Tp (Figure 6). Of particular interest are the crystalline properties (structure, xCR and D) and values of Tp. Values of Tp were ~50 °C lower for the CNC and CNF relative to the benchmark CMC material. The lower values of Tp of the cellulose nanomaterials vis-a-vis CMC in TGA and their correlation with ESR intensity and DH (Figure 5) are interpreted in terms of the surface area effect which increases inversely with the decrease in particle size. The atoms on the surface are weakly bound as compared to those in the bulk of a particle and they often have unsaturated bonds. These effects lead to lower Tp and higher ESR activity with decrease in particle size. The surface areas of the dispersed CNCs in artificial lung fluids are expected to be significantly higher than measured for the as-received aggregated powder material because of their smaller external dimensions.
Generally, it can be stated that both CMC and the cellulose nanomaterials investigated here were quite biodurable in SUF and PSF. All study materials except CNC-C were observed to have the cellulose I structure of cellulose; CNC-C was determined to have cellulose II structure. There was no observed change in crystal structure with exposure to either SUF for up to 7 days or PSF for up to 9 months; in essence, the cellulose I or cellulose II structure remained unchanged with exposure time. For the benchmark CMC material, there were no measurable changes in xCR and D with exposure time to either SUF (Appendix B) or PSF (Figure 5). In SUF, there were no dramatic changes of xCR or D (Appendix B) for cellulose nanomaterials, though a slight decrease in these parameters with increase in exposure time was indicated for CNC-A. In the acidic PSF, there appeared to be a slight increase in the magnitude of xCR of CNCs with exposure time. Acid hydrolysis of CMF preferentially degrades amorphous domains to yield whisker-shaped CNCs (Bai et al., 2009). Hence, this observed increase in xCR with exposure to PSF could be understandable in terms of the acidic nature of the fluid which could have dissolved some of the amorphous components of cellulose. In PSF, there were no systematic trends in changes of D with exposure time for any of the CNC samples.
The observed lung biodurability of our CMC is consistent with previous in vivo studies. Tatrai et al. (1995) reported that rats instilled with a single dose of CMC dust developed granulomas (macrophage cells that group tightly together to sequester and wall off foreign bodies to protect lung tissue) in their alveoli. Muhle et al. (1997) investigated the biodurability of two types of CMC fibers in rat lungs following intratracheal installation. The instilled fibers were phagocytized by alveolar macrophages and by 3 and 6 months, fiber-associated granulomas had formed in exposed rat lungs; fiber clearance half-times from the alveoli were on the order of hundreds of days to years. In our study, cellulose nanomaterials (CNCs and CNF-T) were observed to have biodurability similar to that of a benchmark CMC in both SUF and PSF. Upon inhalation, large particles such as the CMC and aggregated CNCs would deposit in the conducting airways and be immersed in airway lining fluid which we modeled using SUF. Given the prolonged biodurability observed in this study, the CMC and CNCs would not undergo rapid biodegradation in airway lining fluid; rather mechanical clearance via the mucocilliary escalator to the gastrointestinal tract would be dominant transport mechanism. Clearance via the mucocilliary escalator occurs on the order of several hours. In contrast, small particles (e.g. dispersed CNCs or CNFs) that are inhaled will deposit in the non-ciliated alveolar region of the lung where gas exchange occurs. Upon deposition in the alveoli, foreign bodies are rapidly phagocytized by macrophage cells (Lehnert & Morrow, 1985) and sequestered in vesicles called phagolysosomes wherein the cells attempt to degrade the foreign material in an acidic milieu. Results from this study indicate that cellulose nanomaterials that reach the lung alveoli and are engulfed by macrophages would persist for hundreds of days to years. The observed biodurability indicates that the acidic pH of the macrophage phaoglysosome is insufficient to degrade cellulose. Hence, in the alveoli, cellulose nanomaterials are likely to be cleared by mechanical movement of macrophage cells out of the alveoli and eventually to the mucocilliary escalator, a process that can take month to years. This comparison of existing literature on the in vivo toxicity of CMC fibers to our in vitro data suggests that the hazard potential of high aspect ratio cellulose nanomaterials could reasonably be expected to be at least equivalent to micron-scale cellulose fibers. No data is available on the long-term persistence of CNCs in vivo, though our in vitro data indicate that in a simulant of macrophage phagolysosomal fluid (PSF), CNCs are just as biodurable as CMC fibers. Given this similarity, it is likely that CNCs will have higher biodurability than some ceramic fibers (Muhle et al., 1997) but have less inflammatory potential than crocidolite asbestos (Cullen et al., 2000).
Prolonged retention of biopersistent, long, high aspect ratio particles in the lung is of interest for potential pulmonary inflammation toxicity. As such, we evaluated the potential for the benchmark CMC and the cellulose nanomaterials to generate ●OH radicals, which are important for pulmonary inflammatory responses. Cullen et al. (2000) reported that rats exposed to CMC via inhalation exhibited an inflammatory response in the lungs after the first exposure; however, this response declined during the remainder of the 14-day exposure regimen. Vartiainen et al. (2011) reported that in vitro birch wood CMF did not induce secretion of inflammatory cytokines by mouse macrophages and human monocyte-derived macrophage cells. In our study, using a cell-free H2O2 reaction system the CNCs and CNF-T materials produced significantly more free radicals than that of the essentially inert CMC (Figure 6). Further studies are required to determine if these cellulose nanomaterials could be quenching some of their own radical production as seen in previous studies of other nanomaterials (Fenoglio et al., 2006; Krusic et al., 1991). Exposing particles to H2O2 directly models what would happen once the particles were engulfed by lung macrophages and is a first step in measuring particle potential for generation of reactive oxygen species (ROS). If the particle surface has transition metal present, such as Fe, then it may generate radicals through a Fenton-like reaction. Silica particles, chromium and welding fumes all generated free radical production under similar exposure conditions (Leonard et al., 2000, 2010; Vallyathan et al., 1999). In order for particles to generate free radicals in a cellular system, the cell must first recognize and react with the particles. Roser et al. (1998) reported that in vitro the phagocytosis of nanoparticles by U-937 monocyte macrophage-like cells and primary peritoneal mouse macrophages was increased as zeta potential became more negative or more positive and was minimal for nanoparticles with zeta potential near 0 mV. Our measured values of zeta potential for the cellulose materials (Table 1) spanned from −10 to −48 mV, which is favorable for phagocytosis. However, our short exposure time in the cellular experiment did not lead to measurable radical generation. The absence of a cellular reaction may indicate a slower reaction with the RAW cells or lack of cellular interaction. Hence, longer-term exposure times may be needed to elucidate whether cellulose nanomaterials can lead to engulfment and intracellular ●OH radical production. Additionally, though outside the scope of our study, it may be useful to evaluate DNA fragmentation by COMET assay and cellular membrane damage by lipid peroxidation as measures of cellular ROS damage. Results from workplace monitoring indicate that cellulose nanomaterials can become airborne during production and handling (Martinez et al., 2013; Vartiainen et al., 2011). This evidence of inhalation exposure potential coupled with our data indicating that cellulose nanomaterials have prolonged lung biodurability and potential to generate ●OH radicals suggests that in vivo studies could be helpful to more fully evaluate whether their inhalation presents an important health hazard.
A potentially significant contribution of this work to understanding potential health effects from inhalation of cellulose nanomaterials is the linkage of a specific particle property, Tp, to an observed toxicologic endpoint, ●OH radical production. As shown in Figure 6(c), a direct correlation appears to be valid between the free radical density in the ESR response and the shift in the TGA-based values of Tp of the cellulose nanomaterials relative to that of the inert CMC. The underlying physical relationship between Tp and ●OH radical production can be understood in terms of particle surface area as noted earlier because the surface area per unit volume increases inversely with particle diameter. Compared to the atoms in the interior of a nanoparticle, the atoms on the surface have fewer neighboring atoms to bind with resulting in lower cohesive energy of the surface atoms. Thus, the average cohesive energy per atom of a nanoparticle decreases with decreasing particle size (Qi & Wang, 2002) leading to size-dependent lower melting points of nanoscale solids (Sun et al., 2002). It is suggested that the lower magnitudes of Tp for the CNCs in Figure 6(a) are likely related to a similar surface effect. Values of DH of the CNCs having cellulose I structure scale well with measured values of Tp (Figure 6d). For the CNC-C with cellulose II structure, Tp is higher than those for the other CNCs with cellulose I structure because the cellulose II structure is known to be somewhat more stable (Mansikkamaki et al., 2007).
The features of micron-scale fibers that dictate their pathogenicity as developed in the traditional fiber pathogenicity paradigm (narrow width, long length and prolonged durability) may need to be modified for high aspect ratio nanomaterials (Donaldson et al., 2011, 2013). For nanofibers such as CNCs or CNF, high aspect ratio may represent the biologically effective dose because their small aerodynamic diameter permits greater lung deposition in the alveoli. Even if a particle has length on the order of a few microns but still has a nanoscale diameter, it is a high aspect ratio nanomaterial that can be engulfed by macrophages. If the material is durable and not cleared effectively, the high aspect ratio nanomaterial may still be able to penetrate the lung lining and cause pathogenicity. Hence, quantitative data on nanoscale fiber biopersistence such as that provided herein is needed to augment the traditional fiber pathogenicity paradigm for nanomaterials, which in turn may help to develop high aspect ratio nanomaterials that are safe by design.
Conclusions
Powder XRD was observed to be a powerful tool for characterizing cellulosic materials, distinguishing between the different structures and for monitoring changes in xCR and D with exposure time in SUF and PSF. A direct correlation was observed between free radical density and the shift in Tp of cellulose nanomaterials relative to that of the inert CMC, which indicates that TGA might be a useful technique for characterizing cellulose nanomaterials in toxicology studies. Measures of DH and zeta potential were useful for monitoring agglomeration state and particle charge in suspension over time. These latter metrics are important considerations for future in vitro cellular studies of uptake and intracellular reactivity (Roser et al., 1998).
All cellulose materials were biodurable in SUF and PSF. The benchmark CMC material was essentially inert and there were no measurable changes in xCR and D with exposure time to either SUF or PSF. In SUF, a slight decrease in values of xCR and D were observed for CNC-A. In the acidic PSF, there was a slight increase in the magnitude of xCR of CNCs with exposure time which is attributed to the acidic pH of this model lung fluid. Using a cell-free H2O2 reaction system, the CNCs and CNF-T materials produced significantly more ●OH radicals than the benchmark CMC material. Hence, the hazard potential of high aspect ratio cellulose nanomaterials is expected to be at least equivalent to that reported for CMC fibers in vivo (Cullen et al., 2000; Muhle et al., 1997). An important outcome of this work was the observation that increased radical production was correlated with particle Tp and can be explained in terms of the particle surface area to volume ratio which increases as nanoparticle diameter decreases. With more atoms on the surface of a nanoparticle relative to the interior, the atoms on the surface have lower cohesive energy leading to size-dependent lower melting points. Our data suggest that cellulose nanomaterials may be biodurable in the human lung. Further studies are warranted to assess the potential of these nanomaterials to contribute to pulmonary inflammation.
Acknowledgments
The authors wish to thank the two companies that donated CNCs and Drs R. Sabo and A. Rudie at the US Department of Agriculture Forest Products Laboratory who donated some of the cellulose nanomaterials used in these studies. The authors also thank Drs M. Keane and R. Wells of NIOSH for critical review of this article. The research at NIOSH/CDC was funded by the US National Toxicology Program under Inter-Agency Agreement #11-NS11-04-M01. The research at West Virginia University was supported under contracts #212-2011-M-40726 and #212-2012-M-52337 from NIOSH/CDC. A.B.S. acknowledges the experimental assistance of M. G. Duling and R. B. Lawrence in carrying out the biodurability studies and associated measurements. M.S.S. acknowledges the experimental assistance of S. K. Pyapalli and U. Geddam in carrying out the X-ray diffraction and TGA measurements reported in this work.
Appendix A
Physicochemical properties of cellulose study materials
The carbon (C), hydrogen (H) and oxygen (O) content of each sample was measured to establish purity and sulfur (S) were measured to estimate impurity content (Table A1). Theoretical elemental fractions for cellulose based on stoichiometry are: carbon (44.4%), hydrogen (6.22%) and oxygen (49.3%).
Table A1.
Chemistry of the cellulose materials (average ± standard deviation).
| Material | Type | Carbon (%) | Hydrogen (%) | Oxygen (%) | Sulfur (%) |
|---|---|---|---|---|---|
| CMC | Benchmark | 41.5 ± 0.1 | 6.4 ± 0.1 | 52.3 ± 0.2 | n.d. |
| CNC-A | Sulfated | 40.0 ± 0.1 | 6.2 ± 0.1 | 51.6 ± 0.1 | 0.6 ± 0.0 |
| CNC-B | Unsulfated | 41.0±0.1 | 6.2 ± 0.0 | 52.2 ± 0.3 | n.d. |
| CNC-C | Sulfated | 39.0 ± 0.3 | 6.1 ± 0.1 | 53.3 ± 0.2 | n.d. |
| CNF-T | TEMPO | 39.2 ± 0.1 | 5.7 ± 0.0 | 53.9 ± 0.5 | n.d. |
| CNF-H | Homogenizer | – | – | – | – |
n.d. = non-detectable, and dash (−) denotes property could not be determined due to nature of sample.
Appendix B
Biodurability of cellulose study materials in SUF
For CNC-A, the (102) and (004) lines which are clearly evident in unexposed sample are almost absent in the exposed samples (Figure A1). For the unexposed CNF-T material, the (102) line is not observed and the doublet (1ī0) and (110) is not resolved; both of these effects are related to the small crystallite size, D, of CNF-T as evidenced by the broader (200) line. As shown in Figure A2, the CNC-A material showed a systematic slight decrease in xCR and D with exposure to SUF; there were no apparent trends in changes of these parameters in SUF for any other study materials.
Measured values of DH indicated no significant change in particle size from dissolution or from agglomeration in SUF over 7 days (Figure A3). Zeta potential is a useful property for describing the dispersion stability of a suspension (Riddick, 1968) and is important for particle uptake by cells (Roser et al., 1998). Calculated values of zeta potential (all measurements made at pH 7.5–7.8) in SUF were between −30 and 60 −mV (Figure A3). Based on the categories to describe the stability of dispersions developed by Riddick (1968), the cellulose materials in SUF have fairly good stability.
Figure A1.
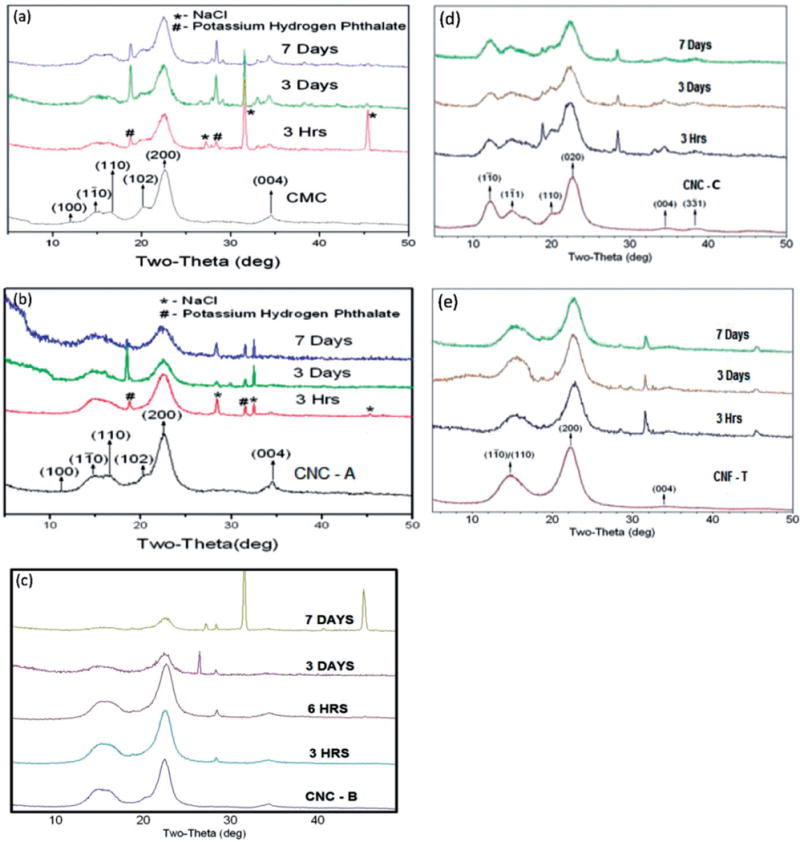
X-ray diffraction patterns for (a) CMC (benchmark material), (b) CNC-A, (c) CNC-B, (d) CNC-C and (e) CNF-T exposed to artificial airway lining fluid (SUF) for up to 7 days. A reliable spectrum could not be obtained for CNF-H due to the nature of the sample. The sharp lines in the patterns are the Bragg lines of residual salts from SUF that remained adhered to the samples despite repeated washings with deionized water.
Figure A2.

Plots of (a) Segal crystallinity (xCR) and (b) crystallite size (D) for each cellulose material after exposure to artificial airway lining fluid (SUF) for up to 7 days (lines joining data points are visual guides).
Figure A3.
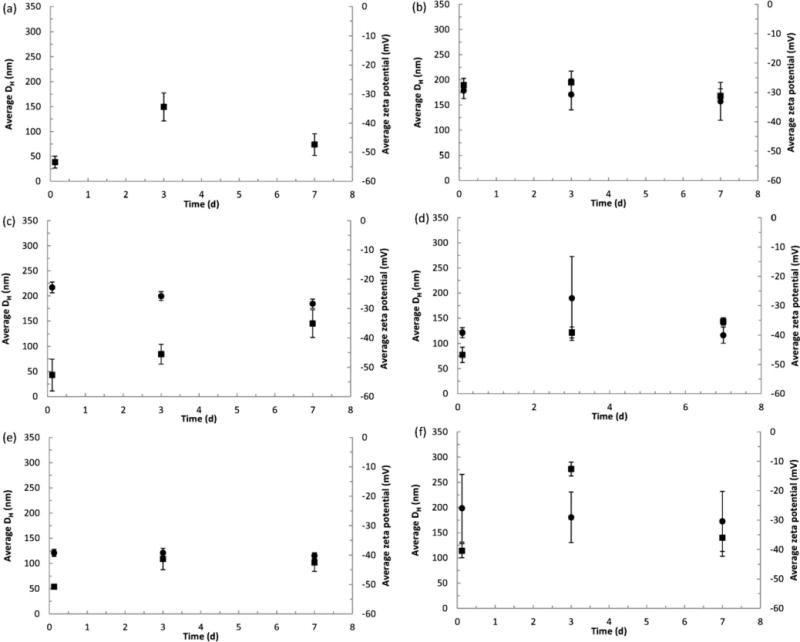
Hydrodynamic diameter (●) and zeta potential (■) of cellulose materials in artificial lung airway epithelial lining fluid (SUF): (a) CMC (benchmark material), (b) CNC-A, (c) CNC-B, (d) CNC-C, (e) CNF-T and (f) CNF-H. All data points are the mean ± one standard deviation for n = 3 samples (in some cases error bars are smaller than the symbols). Values of DH are not reported for the CMC material because the large particle size yielded highly variable results.
Appendix C
Biodurability of cellulose study materials in PSF
As shown in Figure A4, the X-ray diffraction patterns for CNC-A and CNC-C indicate that the crystalline structure of the materials remained intact while immersed in the acidic (pH 4.5) PSF lung fluid for 9 months.
As shown in Figure A5, values of DH for CNC-B and CNC-C were generally constant with time over 9 months. For CNC-A, DH was ~100 nm during the first 28 days of exposure but increased to ~200 nm thereafter indicating agglomeration. For the CNF-T material, values of DH were 150–200 nm during the first 14 days and decreased to ~90 nm thereafter. Values of zeta potential in PSF were about half the corresponding values observed for SUF and indicates the dispersions were on the threshold of agglomeration (−10 to −15 mV) to the threshold of delicate dispersion (−16 to −30 mV) (Riddick, 1968).
Figure A4.
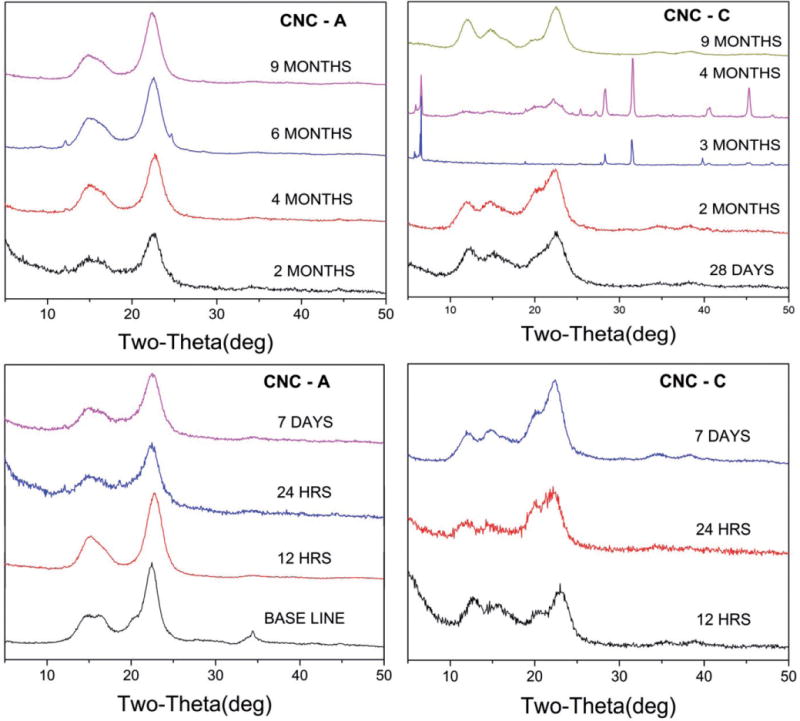
X-ray diffraction patterns for (a) CNC-A and (b) CNC-C exposed to artificial macrophage PSF for up to 9 months. In some cases, sharp Bragg lines due to the residual salts of PSF still adhered to the samples are observed. The sharp lines in the patterns are the Bragg lines of residual salts from PSF that remained adhered to the samples despite repeated washings with deionized water.
Figure A5.
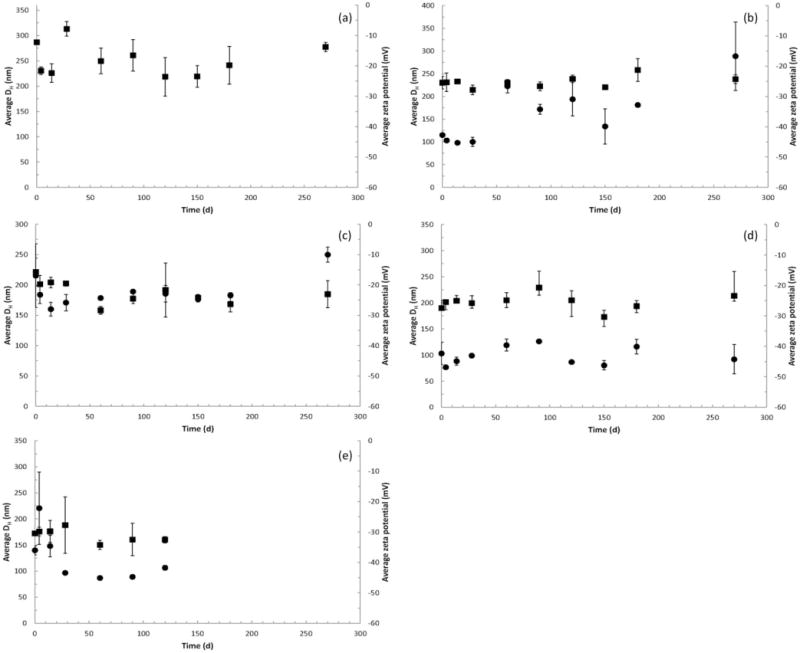
Hydrodynamic diameter (●) and zeta potential (■) of cellulose materials in artificial alveolar macrophage PSF: (a) CMC (benchmark material), (b) CNC-A, (c) CNC-B, (d) CNC-C and (e) CNF-T. All data points are the mean ± one standard deviation for n = 3 samples (in some cases error bars are smaller than the symbols). Values of DH are not reported for the CMC material because the large particle size yielded highly variable results. CNF-H was excluded from the PSF study due to the nature of the sample. Data for CNF-T only plotted to 4 months; subsequent mold growth in the samples precluded further measurements of DH or zeta potential for this material. Zeta potential measurements were made at pH 4.7–4.9 for all materials.
Footnotes
Declaration of interest
The authors declare that they have no competing interests, financial or otherwise. The authors alone are responsible for the content and writing of this article. Mention of a specific product or company does not constitute endorsement by the Centers for Disease Control and Prevention. The findings and conclusions in this report are those of the authors and do not necessarily represent the views of NIOSH.
References
- Agarwal UP, Reiner RS, Ralph SA. Cellulose I crystallinity determination using FT-Raman spectroscopy: univariate and multivariate methods. Cellulose. 2010;17:721–33. [Google Scholar]
- Alexandrescu L, Syverud K, Gatti A, Chinga-Carrasco G. Cytotoxicity tests of cellulose nanofibril-based structures. Cellulose. 2013;20:1765–75. [Google Scholar]
- ASTM International. D4239-08: standard test method for sulfur in the analysis sample of coal and coke using high-temperature tube furnace combustion methods. West Conshohocken, PA: ASTM standards and publications; 2008a. [Google Scholar]
- ASTM International. D5373-08: standard test methods for instrumental determination of carbon, hydrogen, and nitrogen in laboratory samples of coal. West Conshohocken, PA: ASTM standards and publications; 2008b. [Google Scholar]
- Bai W, Holbery J, Li KC. A technique for production of nanocrystalline cellulose with a narrow size distribution. Cellulose. 2009;16:455–65. [Google Scholar]
- Beck S, Bouchard J, Berry R. Dispersibility in water of dried nanocrystalline cellulose. Biomacromolecules. 2012;13:1486–94. doi: 10.1021/bm300191k. [DOI] [PubMed] [Google Scholar]
- Buettner GR. Spin trapping: ESR parameters of spin adducts. Free Radic Biol Med. 1987;3:259–303. doi: 10.1016/s0891-5849(87)80033-3. [DOI] [PubMed] [Google Scholar]
- Cullen RT, Searl A, Miller BG, et al. Pulmonary and intra-peritoneal inflammation induced by cellulose fibres. J Appl Toxicol. 2000;20:49–60. doi: 10.1002/(sici)1099-1263(200001/02)20:1<49::aid-jat627>3.0.co;2-l. [DOI] [PubMed] [Google Scholar]
- Dahlgren C, Karlsson A, Bylund J. Measurement of respiratory burst products generated by professional phagocytes. Methods Mol Biol. 2007;412:349–63. doi: 10.1007/978-1-59745-467-4_23. [DOI] [PubMed] [Google Scholar]
- Donaldson K, Murphy F, Schinwald A, et al. Identifying the pulmonary hazard of high aspect ratio nanoparticles to enable their safety-by-design. Nanomedicine. 2011;6:43–156. doi: 10.2217/nnm.10.139. [DOI] [PubMed] [Google Scholar]
- Donaldson K, Schinwald A, Murphy F, et al. The biologically effective dose in inhalation nanotoxicology. Acc Chem Res. 2013;46:723–32. doi: 10.1021/ar300092y. [DOI] [PubMed] [Google Scholar]
- Fenoglio I, Tomatis M, Lison D, et al. Reactivity of carbon nanotubes: free radical generation or scavenging activity? Free Radic Biol Med. 2006;40:1227–33. doi: 10.1016/j.freeradbiomed.2005.11.010. [DOI] [PubMed] [Google Scholar]
- Finch GL, Mewhinney JA, Eidson AF, et al. In vitro dissolution characteristics of beryllium oxide and beryllium metal aerosols. J Aerosol Sci. 1988;19:333–42. [Google Scholar]
- French AD, Bertoniere NR, Brown RM, et al. Cellulose. In: Kroschwitz JI, editor. Kirk-Othmer encyclopedia of chemical technology. Hoboken, NJ: John Wiley & Sons, Inc; 2003. pp. 360–94. [Google Scholar]
- Future Markets Inc. Nanocellulose: a technology and market study. Belfast, UK: Future Markets Inc; 2012. [Google Scholar]
- Habibi Y, Lucia LA, Rojas OJ. Cellulose nanocrystals: chemistry, self-assembly, and applications. Chem Rev. 2010;110:3479–500. doi: 10.1021/cr900339w. [DOI] [PubMed] [Google Scholar]
- Hubbe M, Rojas O, Lucia L, Sain M. Cellulosic nanocomposites: a review. BioResources. 2008;3:929–80. [Google Scholar]
- Janzen EG, Blackburn BJ. Detection and identification of short-lived free radicals by an electron spin resonance trapping technique. J Am Chem Soc. 1968;90:5909–10. [Google Scholar]
- Kanapilly GM, Raabe OG, Goh CH, Chimenti RA. Measurement of in vitro dissolution of aerosol particles for comparison to in vivo dissolution in the lower respiratory tract after inhalation. Health Phys. 1973;24:497–507. doi: 10.1097/00004032-197305000-00004. [DOI] [PubMed] [Google Scholar]
- Krusic PJ, Wasserman E, Keizer PN, et al. Radical reactions of C60. Science. 1991;254:1183–5. doi: 10.1126/science.254.5035.1183. [DOI] [PubMed] [Google Scholar]
- Lee KY, Tammelin T, Schulfter K, et al. High performance cellulose nanocomposites: comparing the reinforcing ability of bacterial cellulose and nanofibrillated cellulose. ACS Appl Mater Interfaces. 2012;4:4078–86. doi: 10.1021/am300852a. [DOI] [PubMed] [Google Scholar]
- Lehnert BE, Morrow PE. Association of 59iron oxide with alveolar macrophages during alveolar clearance. Exp Lung Res. 1985;9:1–16. doi: 10.3109/01902148509061524. [DOI] [PubMed] [Google Scholar]
- Leonard SS, Chen BT, Stone SG, et al. Comparison of stainless and mild steel welding fumes in generation of reactive oxygen species. Part Fibre Toxicol. 2010;7:32. doi: 10.1186/1743-8977-7-32. [DOI] [PMC free article] [PubMed] [Google Scholar]
- Leonard SS, Wang S, Zang L, et al. Role of molecular oxygen in the generation of hydroxyl and superoxide anion radicals during enzymatic Cr (IV) reduction and its implication to Cr (VI)-induced carcinogenesis. J Environ Pathol Toxicol Oncol. 2000;19:49–60. [PubMed] [Google Scholar]
- Male KB, Leung ACW, Montes J, et al. Probing inhibitory effects of nanocrystalline cellulose: inhibition versus surface charge. Nanoscale. 2012;4:1373–9. doi: 10.1039/c2nr11886f. [DOI] [PubMed] [Google Scholar]
- Mansikkamaki P, Lahtinen M, Rissanen K. The conversion from cellulose I to cellulose II in NaOH mercerization performed in alcohol-water systems: an X-ray powder diffraction study. Carbohydr Polym. 2007;68:35–43. [Google Scholar]
- Martinez KF, Eastlak A, Rudie A, Geraci C. Occupational exposure characterization during the manufacture of cellulose nanomaterials. In: Postek M, Moon RJ, Rudie AW, Bilodeau MA, editors. Production and applications of cellulose nanomaterials. Peachtree Corners, GA: TAPPI Press; 2013. pp. 61–4. [Google Scholar]
- Mathew AP, Oksman K, Pierron D, Harmand MF. Biocompatible fibrous networks of cellulose nanofibres and collagen crosslinked using genipin: potential as artificial lgament/tendons. Macromol Biosci. 2013;13:289–98. doi: 10.1002/mabi.201200317. [DOI] [PubMed] [Google Scholar]
- Moon RJ, Martini A, Nairn J, et al. Cellulose nanomaterials review: structure, properties and nanocomposites. Chem Soc Rev. 2011;40:3941–94. doi: 10.1039/c0cs00108b. [DOI] [PubMed] [Google Scholar]
- Muhle H, Ernst H, Bellmann B. Investigation of the durability of cellulose fibres in rat lungs. Ann Occup Hyg. 1997;41:184–8. [Google Scholar]
- Park S, Baker JO, Himmel ME, et al. Cellulose crystallinity index: measurement techniques and their impact on interpreting cellulase performance. Biotechnol Biofuels. 2010;3:10. doi: 10.1186/1754-6834-3-10. [DOI] [PMC free article] [PubMed] [Google Scholar]
- Pereira MM, Raposo NR, Brayner R, et al. Cytotoxicity and expression of genes involved in the cellular stress response and apoptosis in mammalian fibroblast exposed to cotton cellulose nanofibers. Nanotechnology. 2013;24:075103. doi: 10.1088/0957-4484/24/7/075103. [DOI] [PubMed] [Google Scholar]
- Qi WH, Wang MP. Size effect on the cohesive energy of nanoparticle. J Mater Sci Lett. 2002;21:1743–5. [Google Scholar]
- Riddick T. Control of colloid stability through zeta potential: with a closing chapter on its relationship to cardiovascular disease. Wynnewood, PA: Livingston Publishing Company; 1968. [Google Scholar]
- Roser M, Fischer D, Kissel T. Surface-modified biodegradable albumin nano- and microspheres. II: effect of surface charges on in vitro phagocytosis and biodistribution in rats. Eur J Pharm Biopharm. 1998;46:255–63. doi: 10.1016/s0939-6411(98)00038-1. [DOI] [PubMed] [Google Scholar]
- Ruiz MM, Cavaille JY, Dufresne A, et al. Processing and characterization of new thermoset nanocomposites based on cellulose whiskers. Composite Interf. 2000;7:117–31. [Google Scholar]
- Saito T, Hirota M, Tamura N, et al. Individualization of nanosized plant cellulose fibrils by direct surface carboxylation using TEMPO catalyst under neutral conditions. Biomacromolecules. 2009;10:1992–6. doi: 10.1021/bm900414t. [DOI] [PubMed] [Google Scholar]
- Seehra MS, Akkineni LP, Yalamanchi M, et al. Structural characteristics of nanoparticles produced by hydrothermal pretreatment of cellulose and their applications for electrochemical hydrogen generation. Int J Hydrogen Energy. 2012;37:9514–23. [Google Scholar]
- Segal L, Creely JJ, Martin AE, Conrad CM. An empirical method for estimating the degree of crystallinity of native cellulose using the X-ray diffractometer. Textile Res J. 1959;29:786–94. [Google Scholar]
- Sehaqui H, Zhou Q, Ikkala O, Berglund LA. Strong and tough cellulose nanopaper with high specific surface area and porosity. Biomacromolecules. 2011;12:3638–44. doi: 10.1021/bm2008907. [DOI] [PubMed] [Google Scholar]
- Siqueira G, Bras J, Follain N, et al. Thermal and mechanical properties of bio-nanocomposites reinforced by Luffa cylindrica cellulose nanocrystals. Carbohydr Polym. 2013;91:711–17. doi: 10.1016/j.carbpol.2012.08.057. [DOI] [PubMed] [Google Scholar]
- Stefaniak AB, Guilmette RA, Day GA, et al. Characterization of phagolysosomal simulant fluid for study of beryllium aerosol particle dissolution. Toxicol In Vitro. 2005;19:123–34. doi: 10.1016/j.tiv.2004.08.001. [DOI] [PubMed] [Google Scholar]
- Sun CQ, Wang Y, Tay BK, et al. Correlation between the melting point of a nanosolid and the cohesive energy of a surface atom. J Phys Chem B. 2002;106:10701–5. [Google Scholar]
- Tatrai E, Adamis Z, Bohm U, et al. Role of cellulose in wood dust-induced fibrosing alveo-bronchiolitis in rat. J Appl Toxicol. 1995;15:45–8. doi: 10.1002/jat.2550150110. [DOI] [PubMed] [Google Scholar]
- Taurozzi JS, Hackley VA, Wiesner MR. Ultrasonic dispersion of nanoparticles for environmental, health and safety assessment – issues and recommendations. Nanotoxicology. 2011;5:711–29. doi: 10.3109/17435390.2010.528846. [DOI] [PubMed] [Google Scholar]
- Vallyathan V, Blake T, Leonard S, et al. In vitro toxicity of silica substitutes used for abrasive blasting. Am J Ind Med. 1999;(Suppl. 1):158–60. doi: 10.1002/(sici)1097-0274(199909)36:1+<158::aid-ajim56>3.0.co;2-r. [DOI] [PubMed] [Google Scholar]
- Vartiainen J, Pohler T, Sirola K, et al. Health and environmental safety aspects of friction grinding and spray drying of microfibrillated cellulose. Cellulose. 2011;18:775–86. [Google Scholar]
- Wittmaack K. In search of the most relevant parameter for quantifying lung inflammatory response to nanoparticle exposure: particle number, surface area, or what? Environ Health Perspect. 2006;114:187–94. doi: 10.1289/ehp.9254. [DOI] [PMC free article] [PubMed] [Google Scholar]
- Zoppe JO, Peresin MS, Habibi Y, et al. Reinforcing poly(epsilon-caprolactone) nanofibers with cellulose nanocrystals. ACS Appl Mater Interfaces. 2009;1:1996–2004. doi: 10.1021/am9003705. [DOI] [PubMed] [Google Scholar]


