Abstract
A new Structures for Lossless lon Manipulations (SUM) module, having electrode arrays patterned on a pair of parallel printed circuit boards (PCB), was constructed and utilized to investigate capabilities for ion trapping at a pressure of 4 Torr. Positive ions were confined by application of RF voltages to a series of inner rung electrodes with alternating phase on adjacent electrodes, in conjunction with positive DC potentials on surrounding guard electrodes on each PCB. An axial DC :field was also introduced by stepwise varying the DC potentials applied to the inner rung electrodes to control the ion transport and accumulation inside the ion trapping region. We show that ions can be trapped and accumulated with up to 100% efficiency, stored for at least 5 h with no significant losses, and then could be rapidly ejected from the SUM trap. The present results provide a foundation for the development of much more complex SUM devices that facilitate extended ion manipulations.
Ion traps are a widely used element of mass spectrometry (MS) instrumentation, usually operating at low pressures (e.g., <5-10 mTorr) to conditions involving very high vacuum (particularly when trapping is conducted in conjunction with m/z analysis). Conventional ion traps, including Penning traps,1 quadrupole or multipole linear traps,2 Paul traps,3 electrostatic ion storage rings,4 and electrostatic ion beam traps,5-6 are generally operated at low pressures. For example, Penning traps typically operate at <10-5 Torr,7-9 whereas quadrupole traps 10-13 and multipole traps13 typically at 1-50 mTorr.14, 15 However, stacked-ring traps 16 and ion funnels17-19 have been utilized at higher (low Torr) pressures primarily to focus ions and minimize interface losses, but applications of ion trapping at such pressures have been less frequent.
Traps capable of functioning at Torr pressures have potential utility in a range of analytical platforms, and particularly those involving MS and ion mobility spectrometry (IMS). Higher pressures often accelerate ion-molecule reactions,20-24 improve ion fragmentation efficiencies in some situations,25 and increase ion-molecule collision frequency for damping ion motion more rapidly resulting in improved mass resolution and fragment ion transmission. 26 Furthermore, platforms that function at high pressures remain attractive by having, e.g., lower cost, reduced size, and power requirements of pumping systems,27 e.g., benefiting the development of miniature and portable MS.14-15 Despite these potential benefits, the trapping and storage of ions becomes progressively less effective with increasing pressure. 19
The basis for the extended manipulation and trapping of ions goes back to the 1950s and the development of the electrodynamic quadrupole ion trap by Paul and co-workers,3 and early reports of charged particle trapping being facilitated by gases.28-30 The subsequent invention of the quadrupole ion trap mass spectrometer required low pressure of a gas and the resulting “collisional focusing” to achieve good resolution, 31 and it was later found that two-dimensional quadrupoles could also display such collisional focusing properties and were used to, e.g., increase the efficiency of ion transport to a mass spectrometer.32 Another example is the electrodynamic ion funnel 18 that used similar principles to enable ion focusing and transmission at pressures as high as 25-50 Torr,19 cooling of intense radioactive ion beams,33 immobilizing biomolecules on plasma-modified surfaces,34 and more-efficient ion mobility separations with MS.35 Our laboratory developed an ion funnel trap that can effectively operate at pressures greater than 4 Torr in conjunction with IMS drift cells. The ion funnel trap operates using DC only grids inserted between ion funnel electrodes to construct a trapping region.36-39 However, the storage of ions at pressures >1 Torr has been largely unexplored; particularly, the storage efficiency for extended periods.
Recently, we developed new Structures for Lossless Ion Manipulations (SLIM) to enable more-complex gas phase ion manipulations.40-43 In SLIM, ions are confined by the combination of radio frequency (RF) and direct current (DC) fields. Furthermore, additional DC potentials are used for ion transport, trapping, turning, and switching between alternative paths, potentially enabling the construction of devices for executing complex and extended sequences of ion manipulations. Unlike the ion funnel trap, SLIM traps utilize a gridless design that eliminates ion losses (due to collisions of ions with grids during ion transfer). In addition, SLIM traps allow, e.g., for easy access of light beams for photochemical studies that otherwise cannot easily be performed.
In this work, we report on the initial development of lossless ion traps developed using SLIM technology and operated at 4 Torr, including the initial evaluation of SLIM trap ion capacity, trapping efficiency, storage over extended times, and ejection from such traps. The construction of the SLIM ion trap allows for flexibility in designing experiments and instruments as trapping can take place before, during, and after SLIM ion mobility separations, reactions, and other manipulations, as well as rapid prototyping.
EXPERIMENTAL SETUP
SLIM experimental modules were assembled from components fabricated using printed circuit board (PCB) technology. Each PCB board was 7.6 cm × 7.6 cm (3 in. × 3 in.) and could be easily mated to create modules of different desired lengths.40-43 Figure 1A shows four pairs of parallel PCB components assembled into the 30.5-cm-long SLIM module used for the present work. The gap between the parallel boards was fixed to 5.0 mm for this work. Figure 1B shows the inside of the mated SLIM components, and Figure 1C shows a detailed view of the rung and guard electrode arrangement. The rung electrodes, separated by 0.76 mm, had lengths of 5.6 mm and widths of 0.76 mm, while the guard electrodes were 5.3 mm wide (horizontal dimension) and 6.0 mm long (vertical dimension). 180° out-of-phase RF waveforms (170 Vp-p at 1.7 MHz) were applied to adjacent rung electrodes to create pseudo-potentials preventing ions from approaching the surfaces, while a DC bias of +6 V relative to the rung electrodes was applied to the guard electrodes for lateral confinement. An additional DC gradient was also applied to the rung electrodes (as well as the guard electrodes) superimposed on the RF waveforms to move ions through the SLIM device axialiy. All DC and RF voltages in SLIM were provided by home-built power supplies.
Figure 1.
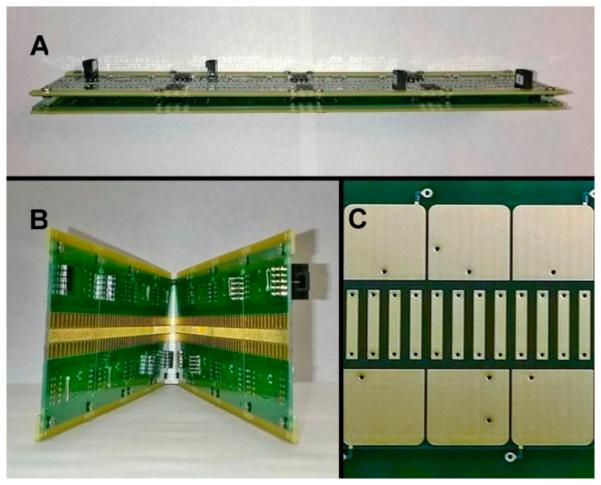
SLIM module developed for this work: (A) side view of the SLIM module (the two parallel SLIM PCBs were separated by 5 mm in this study); (B) the interior of the SLIM module; and (C) a detailed view of the electrodes, including rung (the inner parallel strip-like) electrodes and guard (the near-square top and bottom) electrodes.
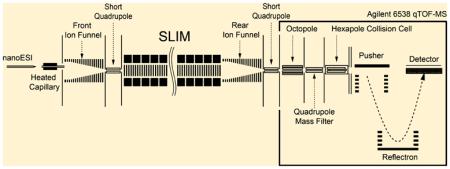
In this study, the SLIM-trap was integrated in a system incorporating a nanoESI source and ion funnel interface, and an Agilent QTOF mass spectrometer (Figure 2). The nanoESI source used a 20 µm inner diameter (i.d.) chemically etched fused-silica emitter and flow rate of 100 nL/min. Positive ions generated by ESI were transmitted through the 500-µm-i.d and 6-cm-long stainless steel inlet capillary heated to 120 °C. After exiting the capillary, ions were focused in the interface region using an ion funnel27 (acceptance diameter of ~25 mm). The inlet capillary was offset from the center axis of the ion funnel by 6 mm to minimize the transmission of neutrals through the ion funnel and conductance limiting orifice, as well as to effectively eliminate gas dynamic effects in the SLIM chamber. The ion funnel RF was 100 Vp-p at 1 MHz and the DC gradient was 15 V/cm. The interface ion funnel chamber was evacuated to 4.1 Torr utilizing a two-stage rotary pump (Model E2M28, BOC Edwards, Wilmington, MA, USA). Ions exited the ion funnel through a 2.5-mm-diameter conductance-limiting orifice and were then transmitted to the SLIM module through a short RF-only focusing quadrupole (6.4 mm diameter, 17.4 mm long, and 2.8 mm inscribed radius; 100 Vp-p RF and 1 MHz), maintained at the same pressure as the SLIM module. The SLIM chamber was supplied with high-purity nitrogen filtered through hydrocarbon and moisture traps, and was not pumped directly; instead, pressure was maintained at 4.3 Torr by balancing the flow rate of nitrogen into the chamber and the pumping speed of the source/ion funnel trap. Ions exiting the SLIM trap were transmitted through a rear ion funnel,36 a second conductance-limiting orifice 2.5 mm in diameter, a differentially pumped RF-only rear quadruple, a third conductance-limiting orifice, and then into the interface of an Agilent Q-TOF MS (Model 6538, Agilent Technologies, Santa Clara, CA) for detection, similar to previously described IMSMS instruments.36
Figure 2.
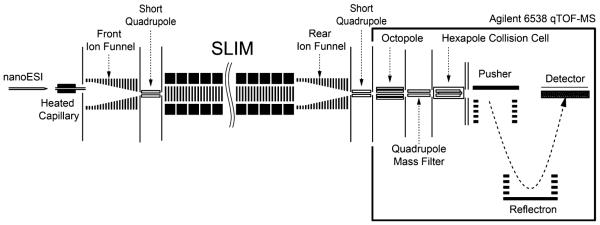
Schematic diagram of the instrumental arrangement, with the SLIM trapping module located in a region at 4 Torr of N2.
Two SLIM module arrangements were used to evaluate the trap performance. The first arrangement having four SLIM segments (each 7.6 cm long) was constructed to study ion storage. The two middle segments were used as the trapping region, while the first and last segments employed as entrance and exit gates, respectively. Trapping was accomplished with the voltages given in Figure 3A. Ions were introduced into the trap through the transmission-only quadrupole biased to 10 V higher than the voltage applied to the beginning of the first SLIM segment (point A in Figure 3A). A DC gradient of 2 V/cm was applied across the final SLIM segment (CD in Figure 3A). Following the ion introduction period, a DC gradient was applied to the first SLIM segment (AB) to trap ions for various storage times. Following storage, a 1.3 V/cm gradient was applied to the entire SLIM device for ion ejection. The beginning of the rear ion funnel was biased to 10 V lower than the voltage applied to end of the last SLIM segment (point D in Figure 3A).
Figure 3.
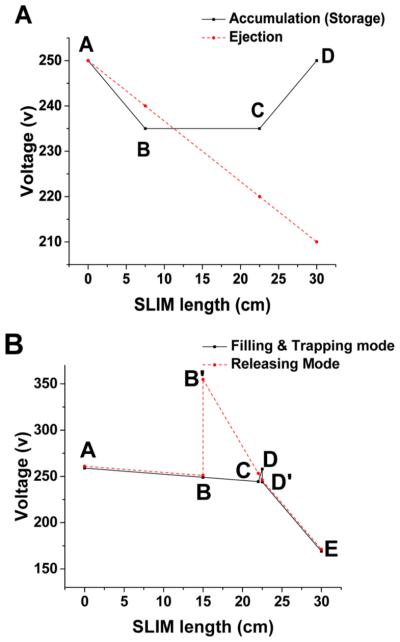
DC gradient arrangement used for the SLIM trap module for: (A) the ion storage and (B) ion release studies, with A−D and A− E indicating respective voltage control points. In panel B, the profiles for the accumulation and the ejection phases are offset by 2 V for the sake of clarity.
A second arrangement, where the trap region and exit gate were shortened to 7.1 and 0.5 cm, respectively, was used to study ion ejection from the trap. This arrangement included five DC control points (A–E in Figure 3B) as well as B′ and D′ to allow the gradients between AB, BC, CD, and DE to be adjusted in a completely independent fashion. During ion accumulation, a 0.7 V/cm gradient was applied to the ion trap and a 30 V/cm gradient was applied to the exit gate by biasing the transmission quadrupole to 270 V, A to 260 V, B to 250 V, B′ to 250 V, C to 244.33 V, D to 258 V, D′ to 244 V, and E to 170 V (see Figure 3B). The front of the rear ion funnel was biased to 160 V. To release ions, the DC gradient from B′ to E was changed to 14.5 V/cm by changing B′ to 354.75 V, C to 253.25 V, D to 246 V, and D′ to 246 V. Instrument control software was written in C# to enable communication with the power supplies and the analog-to-digital converter (ADC) (Model U1084 A, Keysight Technologies, Santa Rosa, CA, USA). Current measurements were performed at the rear quadrupole. The detected current was recorded on an oscilloscope (Model DPO 7254, Tektronix, Beaverton, OR, USA) through a current amplifier (model 428, Keithley Instruments, Cleveland, OH, USA).
Tetraoctylammonium bromide, tetradodecylammonium chloride, and acetonitrile were purchased from Sigma–Aldrich (St. Louis, MO), and acetic acid was purchased from Fisher Scientific (Pittsburgh, PA). All samples were made to 1 μM in acetonitrile/water/acetic acid (75:24:1 by volume) for producing singly charged ions at m/z of 466.3 and 690.5. Pseudo-potential Calculations. The net potential (φ) experienced by an ion with mass (m) and charge (q), in the presence of DC potential (ϕDC) and RF potential (ϕRF) with frequency (ω), was calculated using the effective potential (or pseudo-potential) well approximation:44,45
The calculations used the following parameters: charge, 1+; mass, 690; RF, 200 Vp-p at 800 kHz; and guard bias, +5 V. During ion transport, a DC gradient of 12 V/cm was assigned to the rung electrodes. Pseudo-potential calculations were performed using a custom code developed in-house (code was written using Matlab (Mathworks, Natick, MA, USA)).
RESULTS AND DISCUSSION
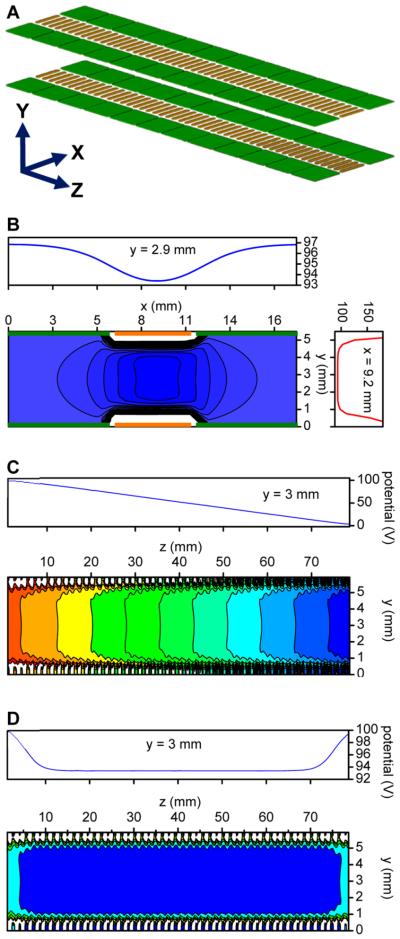
Previous simulations showed 100% transmission efficiency with rung electrodes 5.6 mm long, 0.76 mm wide, and spaced apart by 0.76 mm, and guard electrodes 6.0 mm long, 5.3 mm wide, and also spaced 0.76 mm apart, and this arrangement was selected for the present SLIM trap (Figure 4A).42 Calculations provided insights into the effective potential in the YX plane and the SLIM ion confinement (Figure 4B). The cross-sectional view of the calculated effective potential in Figure 4B shows the DC potential superimposed on the RF waveform that was applied to the rung electrodes, and in conjunction with the guard electrode bias DC (DCbias) potentials. The RF created a repulsive field for ions close to the rung electrodes (e.g., the potential profile at x = 9.2 mm), while the DCbi as was applied to the guard electrodes to provide the lateral confinement (see the potential profile at y = 2.9 mm). As indicated in Figure 4B, the overall effect is to create a central confining field in the XY-plane. Ions are injected into the central region of the SLIM device allowing confinement by the DC and RF voltages. Figure 4C shows the calculated effective potentials when the SLIM is operated in transmission mode. In this YZ view, an RF waveform is applied to rung electrodes with a DC gradient superimposed to move ions in the Z-direction (Figure 4C). To trap ions axially, potentials are applied to the SLIM termini, as shown in Figure 4D, forming a low-potential central region (see potential profile at y = 3 mm), to facilitate effective trapping and storage.
Figure 4.
Calculated effective potentials in the present SLIM module design. (A) Schematic of a basic SLIM unit along with coordinates (rung and guard electrodes are shown in brown and green, respectively). Note that positive ions move in the Z direction. SLIM effective potentials for (B) ion confinement in the XY plane, (C) ion transport mode, and (D) ion trapping mode.
Ion Accumulation and Charge Capacity
Figure 5A shows a series of current measurements (at the rear quadrupole; see Figure 2) for singly charged ions of tetraoctylammonium bromide (466.3 m/z), following confinement in the trap arrangement shown in Figure 3A. After ions were allowed to fill the trap, the DC gradient was changed to release the ions. Note, as shown in Figure 5A, that as filling times increased the ion packets exiting the trap displayed different distributions. We speculate that these differences arise from biases in ion losses with longer filling times, as the trap charge capacity is exceeded. The number of charges was calculated by integrating the peak area (eqs 1 and 2) of the ion current pulses released from the trap:
Figure 5.
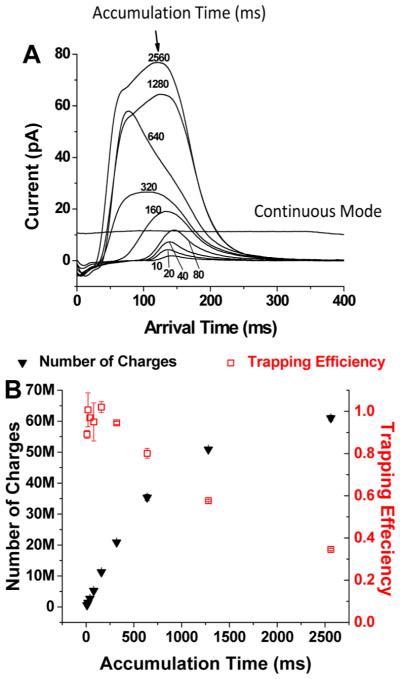
Measurement of the charge capacity and trapping efficiency of the SLIM trap. (A) The current detected from ion pulses released from the SUM trap for different filling times (indicated). (Also shown is the typical measured continuous ion current ( 10 pA) and its stability in transmission mode.) (B) The numbers of accumulated charges (solid black triangles) and the corresponding trapping efficiency (open red squares). Error bars represent ± one standard deviation from the mean of triplicate measurements.
| (1) |
| (2) |
In eq 1, Q,represents the accumulated charge (in Coulomb), I the current (in amperes) measured from accumulated ions released from the SLIM trap and t the time (in seconds) over which the peak was integrated. The number of accumulated charges (N) was calculated by eq 2. To calculate the trap efficiency, the charge released from the trap was compared to the charge from the continuous ion beam (Qc) as in eqs 3 and 4. Tf is the filling times, and Ic is the current of the continuous ion beam.
| (3) |
| (4) |
The results for the trap capacity and the related trapping efficiency are shown in Figure 5B. Within a filling time of <320 ms, the number of charges increased in a linear manner to 2 × 10⁷ charges, which indicates effectively lossless ion accumulation (and trapping). With longer fill times, more charges were accumulated but the increases were nonlinear and the trapping efficiency dropped, consistent with overfilling of the SLIM trap. After 320 ms, the trap was clearly overfilled, displaying decreased trapping efficiency (<40% after 2.5 s); however, the total number of charges trapped continued to increase to ~60 million after 2.5 s of ion accumulation.
The trap capacity has been evaluated using computational modeling of the electric fields confining the stored ion Coulombic effects.41 At equilibrium, the electric field produced by the stored ions at each point of the ion cloud boundary is counterbalanced by the combination of the DC electric field generated by the guard electrodes (EDC) and the field (Eeff), because of the effective potential generated by the RF electrodes. Generally, a complex nonuniform distribution of the two field components is produced, as analyzed previously.41 To a first approximation, the trap capacity is determined by the product of the trap length by its width, i.e., the surface area of the board. At a distance from guard electrodes, where the guard field EDC is reduced, the configuration of fields approaches a two-dimensional geometry, with ion cloud boundary facing the board surface, positioned such that the effective field Eeff offsets the Coulombic field Esc. Using the flat two-dimensional (2D) geometry as an approximation, the total ion charge can be evaluated, according to Gauss’s law, as a product of electric field Eeff and the surface area. This approximation allows estimation of the upper limit of the ion capacity; and calculations for experimental conditions produced the stored charge quantity of 108 e, which is consistent with the experiment.41 The decrease in trapping efficiency, and corresponding changes in ion ejection distributions, in conjunction with previous experimental and theoretical studies of space charge effects in “overfilled” ion traps,46 suggest that such overfilling should typically be avoided in most analytical applications.
Ion Storage
Once the trap capacity was measured, the utility of SLIM for extended trapping was also studied. For this, the SLIM trap described in Figure 3A was filled with tetroctylammonium (466.3 m/z) and tetradodecylammonium (690.6 m/z) ions for 2 ms (~1.3 × 10⁵ charges) to avoid undesirable effects of excessive charge, stored for various periods, and then released from the trap and detected using the QTOF MS. A range of storage times were evaluated based upon the normalized total integrated ion signals (Figure 6A). The data point at zero storage time was based on 2 ms ion filling, and then transmitted through SLIM in the continuous mode (i.e., where ions were not trapped), and all data points for both ions were normalized to the signal from 2 ms ion filling in the continuous mode. As shown in Figure 6A, no significant ion losses were observed for ion storage times from 1 s to as long as 5 h, and, although the experiments were not extended longer, we anticipate that lossless ion storage could be achieved for much longer times. Figures 6B and 6C show representative mass spectra for ions released and detected after storage for 1 s and for 5 h, respectively, demonstrating SLIM lossless ion storage, as well as the absence of significant bias effects.
Figure 6.
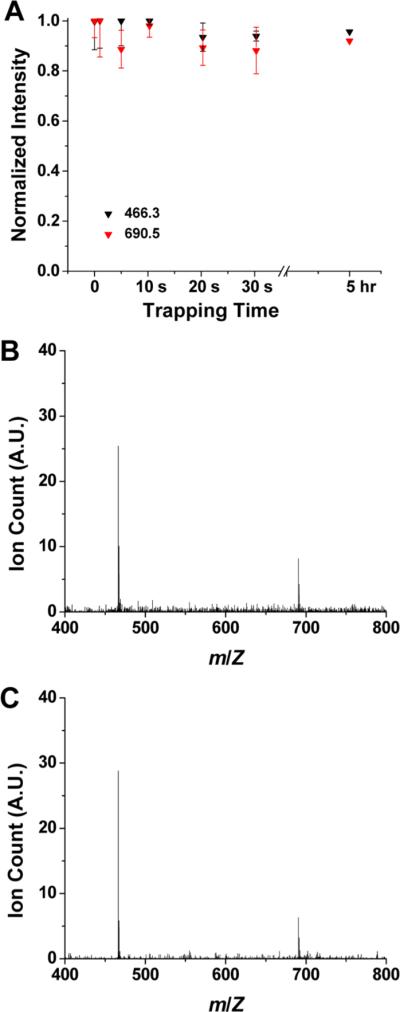
Ion storage efficiency and spectra for 2 ms trap fill times. (A) Normalized ion intensities for ions of 466.3 m/z (black boxes) and 690.5 m/z (red boxes) measured after ion storage for up to 5 h. Signals were normalized to the data point for continuous mode (i.e., at zero). The ion storage for 5 h represents a single run while the rest of the measurements were performed in triplicate. Error bars represent ± one standard deviation from the mean value. (B) Representative mass spectrum after 1 s of ion storage. (C) Representative mass spectrum after 5 h of ion storage.
Ion Ejection from the SLIM Trap
In addition to evaluating the SLIM trap capacity and trap storage, the ejection of ions from a SLIM trap was investigated utilizing the shorter exit gate and trap voltage profiles shown in Figure 3B. The shorter trapping region (7 cm compared to the 15 cm trap used in Figure 3A), along with a 0.7 V/cm gradient in the trap, reduced the charge capacity of the SLIM trap. Approximately 5 × 10⁶ charges were accumulated within 80 ms. As ion release time from the SLIM trap increased, the number of ions exiting the trap also increased (Figure 7A), indicating that not all ions were ejected for shorter time periods, likely due to the relatively low DC gradient inside the trap (0.7 V/cm) and the 0.5 cm width of the exit gate. In total, 1.2 ms was required for all ions to exit the trap (Figure 7A). While a narrow ion distribution for ejected ions was observed (Figure 7B), we expect that ejection can be significantly refined and optimized for a range of purposes, including injection for IMS separations after accumulation (and e.g. accomplished in conjunction with the SLIM switch and selective accumulation after a first stage of IMS).40,43
Figure 7.
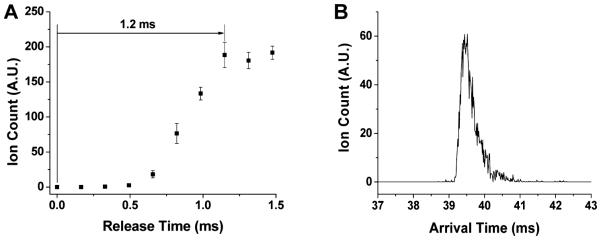
Ion release from a SLIM trap module: (A) ion count versus the ejection pulse width from the SLIM trap (error bars represent ± one standard deviation from the mean of triplicate measurements); and (B) a representative arrival time distribution of 466.3 m/z ions utilizing a release time of 1.2 ms.
CONCLUSIONS
Ion trapping is a core capability in mass spectrometry, and it has broad utility for facilitating more sophisticated manipulations and applications. In this initial evaluation, SLIM-based ion trapping, accumulation, storage, and release at a pressure of 4 Torr were investigated. Essentially lossless ion storage was achieved for periods as long as 5 h. The trap capacity for the design studied was found to be ~2 × 10⁷ charges for an unbiased trapping efficiency of 100%; the linear range of the trap. More charge (e.g., 6 × 10⁷) could be accumulated by overfilling the SLIM trap, but at the cost of increasingly significant ion bias effects. Measurements of the maximum trapped ion charge were consistent with theoretical calculations, based upon achieving a balance between Coulomb repulsion and the RF effective field.41 Accordingly, the trap capacity can be increased using longer and/or wider area SLIM designs for ion trapping. The effective potential magnitude also contributes to defining the maximum trap capacity, and its detailed dependence on m/z, RF voltage and frequency. In the present SLIM module, penetration of the guard DC potential creates orthogonal y-components of the electric field, which adds to the Coulomb repulsion and serves to reduce the trap capacity. This also contributes to the necessity of selecting an optimum value for the guard potential. The guard DC field penetration is reduced exponentially for smaller board spacing, and other factors, such as the width of the RF rungs, have an impact on the trap capacity.
This work has also shown that trapped ions could be rapidly and effectively ejected from the SLIM trap within ≤1.2 ms, and improvements are likely feasible for purposes that include IMS and its applications. More-refined SLIM trap designs, e.g., using shorter traps or improved exit gate voltage profiles will likely enable decreased trap release times and pulse profile, for applications that require shorter ion pulses. The present study demonstrates the capability of SLIM traps for lossless ion storage, ion accumulation, and quick ion release, and further optimization should enable a broad range of applications. Efficient ion trapping at high pressure allows for myriad SLIM applications34-37 that include a broad range of gas-phase ion manipulations, e.g., sorting and building up large ion populations, separations by m/z or ion mobility to facilitate detection of very low abundance species, gas-phase reactions with neutrals or other ions as well as interactions with photons, and gas-phase slow heating methods such as collisional activation. We also note the additional advantages of ion trapping for extremely long times and the low cost design and construction. Efficient and effective SLIM ion trapping capabilities constitute a major step toward enabling the moving of many conventional solution-phase laboratory manipulations to the gas phase and, more importantly, allowing a broad range of new applications exploiting unique capabilities of gas-phase environments and ion chemistry.
ACKNOWLEDGMENTS
Portions of this research were supported by grants from the National Institute of General Medical Sciences (P41 GM103493), the Laboratory Directed Research and Development Program at Pacific Northwest National Laboratory, and the U.S. Department of Energy Office of Biological and Environmental Research Genome Sciences Program under the Panomics program. This work was performed in the W. R. Wiley Environmental Molecular Sciences Laboratory (EMSL), a DOE national scientific user facility at the Pacific Northwest National Laboratory (PNNL). PNNL is operated by Battelle for the DOE, under Contract No. DE-AC05-76RL0 1830.
Footnotes
Notes
The authors declare no competing financial interest.
REFERENCES
- (1).Brown LS, Gabrielse G. Rev. Mod. Phys. 1986;58:233–311. [Google Scholar]
- (2).Bernhardt TM. Int. J. Mass Spectrom. 2005;243:1–29. [Google Scholar]
- (3).Paul W. Rev. Mod. Phys. 1990;62:531–540. [Google Scholar]
- (4).Andersen JU, Andersen LH, Hvelplund P, Lapierre A, Müller SP, Nielsen SB, Pedersen UV, Tomita S. Hyperfine Interact. 2003;146:283–291. [Google Scholar]
- (5).Diner A, Toker Y, Strasser D, Heber O, Ben-Itzhak I, Witte PD, Wolf A, Schwalm D, Rappaport ML, Bhushan KG, Zajfman D. Phys. Rev. Lett. 2004:93. doi: 10.1103/PhysRevLett.93.063402. [DOI] [PubMed] [Google Scholar]
- (6).Schmidt HT, Cederquist H, Jensen J, Pardi A. NucL Instrum. Methods Phys. Res., Sect. B. 2001;173:523–527. [Google Scholar]
- (7).Martinez F, Bandelow S, Breitenfeldt C, Marx G, Schweikhard L, Wienholtz F, Ziegler F. Int. J. Mass Spectrom. 2012;313:30–35. [Google Scholar]
- (8).Suess L, Finch CD, Parthasarathy R, Hill SB, Dunning FB. Rev. Sci. Instrum. 2002;73:2861–2866. [Google Scholar]
- (9).Tan JN, Brewer SM, Guise ND. Rev. Sci. Instrum. 2012:83. doi: 10.1063/1.3685246. [DOI] [PubMed] [Google Scholar]
- (10).Doktycz MJ, Habibigoudarzi S, Mcluckey SA. Anal. Chem. 1994;66:3416–3422. doi: 10.1021/ac00092a019. [DOI] [PubMed] [Google Scholar]
- (11).Gronert S. Mass Spectrom. Rev. 2005;24:100–120. doi: 10.1002/mas.20008. [DOI] [PubMed] [Google Scholar]
- (12).Michael SM, Chien BM, Lubman DM. Anal. Chem. 1993;65:2614–2620. [Google Scholar]
- (13).Myung S, Lee YJ, Moon MH, Taraszka J, Sowell R, Koeniger S, Hilderbrand AE, Valentine SJ, Cherbas L, Cherbas P, Kaufmann TC, Miller DF, Mechref Y, Novotny MV, Ewing MA, Sporleder CR, Clemmer DE. Anal. Chem. 2003;75:5137–5145. doi: 10.1021/ac030107f. [DOI] [PubMed] [Google Scholar]
- (14).Song QY, Xu W, Smith SA, Gao L, Chappell WJ, Cooks RG, Zheng OY. J. Mass Spectrom. 2010;45:26–34. doi: 10.1002/jms.1684. [DOI] [PubMed] [Google Scholar]
- (15).Xu W, Maas JB, Boudreau FJ, Chappell WJ, Ouyang Z. Anal. Chem. 2011;83:685–689. doi: 10.1021/ac1027808. [DOI] [PubMed] [Google Scholar]
- (16).Julian RR, Mabbett SR, Jarrold MF. J. Am Soc. Mass. Spectrom. 2005;16:1708–1712. doi: 10.1016/j.jasms.2005.06.012. [DOI] [PubMed] [Google Scholar]
- (17).Shaffer SA, Tang KQ, Anderson GA, Prior DC, Udseth HR, Smith RD. Rapid Commun. Mass Spectrom. 1997;11:1813–1817. [Google Scholar]
- (18).Shaffer SA, Prior DC, Anderson GA, Udseth HR, Smith RD. Anal. Chem. 1998;70:4111–4119. doi: 10.1021/ac9802170. [DOI] [PubMed] [Google Scholar]
- (19).Ibrahim YM, Tang K, Tolmachev AV, Shvartsburg AA, Smith RD. J. Am. Soc. Mass. Spectrom. 2006;17:1299–1305. doi: 10.1016/j.jasms.2006.06.005. [DOI] [PMC free article] [PubMed] [Google Scholar]
- (20).Field FHJ. Am Chem. Soc. 1961;83:1523. [Google Scholar]
- (21).Chong SL, Franklin JL. J. Chem Phys. 1971;54:1487–1495. [Google Scholar]
- (22).Bederski K, Wójcik L. Int. J. Mass Spectrom. Ion Processes. 1996;154:145–153. [Google Scholar]
- (23).Wójcik L, Markowski A. Vacuum. 2003;70:391–395. [Google Scholar]
- (24).Guo YZ, Siu KWM, Baranov VI. J. Am. Soc. Mass. Spectrom. 2005;16:957–966. doi: 10.1016/j.jasms.2005.03.010. [DOI] [PubMed] [Google Scholar]
- (25).Mansoori BA. Rapid Commun. Mass Spectrom. 1998;12:712–728. [Google Scholar]
- (26).Mansoori BA, Dyer EW, Lock CM, Bateman K, Boyd RK, Thomson BA. J. Am. Soc. Mass. Spectrom. 1998;9:775–788. [Google Scholar]
- (27).Ibrahim YM, Baker ES, Danielson WF, III, Norheim RV, Prior DC, Andeison GA, Belov ME, Smith RD. Int. J. Mass Spectrom. 2015;377:655–662. doi: 10.1016/j.ijms.2014.07.034. [DOI] [PMC free article] [PubMed] [Google Scholar]
- (28).Wuerker RF, Shelton H, Langmuir RV. J. Appl. Phys. 1959;30:342–349. [Google Scholar]
- (29).Major FG, Dehmelt HG. Phys. Rev. 1968;170:91–107. [Google Scholar]
- (30).Bonner RF, March RE, Durup J. Int. J. Mass Spectrom. Ion Processes. 1976;22:17–34. [Google Scholar]
- (31).Stafford GC, Kelley PE, Syka JEP, Reynolds WE, Todd JFJ. Int. J. Mass Spectrom. Ion Processes. 1984;60:85–98. [Google Scholar]
- (32).Douglas DJ, French JB. J. Am. Soc. Mass. Spectrom. 1992;3:398–408. doi: 10.1016/1044-0305(92)87067-9. [DOI] [PubMed] [Google Scholar]
- (33).Varentsov VL, Habs D. Nucl. Instrum. Methods A. 2002;490:16–29. [Google Scholar]
- (34).Kitching KJ, Lee HN, Elam WT, Johnston EE, MacGregor H, Miller RJ, Turecek F, Ratner BD. Rev. Sci. Instrum. 2003;74:4832–4839. [Google Scholar]
- (35).Tang K, Shvartsburg AA, Lee HN, Prior DC, Buschbach MA, Li FM, Tolmachev AV, Anderson GA, Smith RD. Anal. Chem. 2005;77:3330–3339. doi: 10.1021/ac048315a. [DOI] [PMC free article] [PubMed] [Google Scholar]
- (36).Baker ES, Clowers BH, Li FM, Tang K, Tolmachev AV, Prior DC, Belov ME, Smith RD. J. Am. Soc. Mass. Spectrom. 2007;18:1176–1187. doi: 10.1016/j.jasms.2007.03.031. [DOI] [PMC free article] [PubMed] [Google Scholar]
- (37).Clowers BH, Ibrahim YM, Prior DC, Danielson WF, Belov ME, Smith RD. Anal. Chem. 2008;80:612–623. doi: 10.1021/ac701648p. [DOI] [PMC free article] [PubMed] [Google Scholar]
- (38).Ibrahim YM, Belov ME, Tolmachev AV, Prior DC, Smith RD. Anal. Chem. 2007;79:7845–7852. doi: 10.1021/ac071091m. [DOI] [PMC free article] [PubMed] [Google Scholar]
- (39).Ibrahim YM, Belov ME, Liyu AV, Smith RD. Anal. Chem. 2008;80:5367–5376. doi: 10.1021/ac8003488. [DOI] [PMC free article] [PubMed] [Google Scholar]
- (40).Webb LK, Garimella SVB, Tolmachev AV, Chen TC, Zhang XY, Norheim RV, Prost SA, LaMarche B, Anderson GA, Ibrahim YM, Smith RD. Anal. Chem. 2014;86:9169–9176. doi: 10.1021/ac502055e. [DOI] [PMC free article] [PubMed] [Google Scholar]
- (41).Tolmachev AV, Webb LK, Ibrahim YM, Garimella SVB, Zhang XY, Anderson GA, Smith RD. Anal. Chem. 2014;86:9162–9168. doi: 10.1021/ac502054p. [DOI] [PMC free article] [PubMed] [Google Scholar]
- (42).Garimella SVB, Ibrahim YM, Webb IK, Tolmachev AV, Zhang XY, Prost SA, Andeison GA, Smith RD. J. Am. Soc. Mass. Spectrom. 2014;25:1890–1896. doi: 10.1007/s13361-014-0976-y. [DOI] [PMC free article] [PubMed] [Google Scholar]
- (43).Webb IK, Garimella SVB, Tolmachev AV, Chen TC, Zhang XY, Cox JT, Norheim RV, Prost SA, LaMarche B, Anderson GA, Ibrahim YM, Smith RD. Anal. Chem. 2014;86:9632–9637. doi: 10.1021/ac502139e. [DOI] [PMC free article] [PubMed] [Google Scholar]
- (44).Dehmelt HG. In: Advances in Atomic and Molecular Physics. Bates DR, Esterrnann L, editors. Academic Press; New York: 1968. pp. 53–72. [Google Scholar]
- (45).Pearson CE, Leibrandt DR, Bakr WS, Mallard WJ, Brown KR, Chuang IL. Phys. Rev. A: At. Mol. Opt. Phys. 2006;73:032307. [Google Scholar]
- (46).Tolmachev AV, Udseth HR, Smith RD. Rapid Commun. Mass Spectrom. 2000;14:1907–1913. doi: 10.1002/1097-0231(20001030)14:20<1907::AID-RCM111>3.0.CO;2-M. [DOI] [PubMed] [Google Scholar]


