Abstract
Lactate dehydrogenase A (LDHA) is the enzyme that converts pyruvate to lactate and oxidizes the reduced form of nicotinamide adenine dinucleotide (NADH) to NAD+. Several human cancers including the pancreas display elevated expression of LDHA. Because of its essential role in cancer metabolism, LDHA has been considered to be a potential target for cancer therapy. Recently, we have shown that a green tea extract significantly down-regulated LDHA in HPAF-II pancreatic cancer cells using global proteomics profiling. The present study is to investigate how EGCG, a major biological active constituent of green tea, targets the metabolism of human pancreatic adenocarcinoma MIA PaCa-2 cells. We compared the effect of EGCG to that of oxamate, an inhibitor of LDHA, on the multiple metabolic pathways as measured by extracellular lactate production, glucose consumption, as well as intracellular aspartate and glutamate production, fatty acid synthesis, acetyl-CoA, RNA ribose and deoxyribose. Specific metabolic pathways were studied using [1, 2-13C2]-d-glucose as the single precursor metabolic tracer. Isotope incorporations in metabolites were analyzed using gas chromatography/mass spectrometry (GC/MS) and stable isotope-based dynamic metabolic profiling (SiDMAP). We found that the EGCG treatment of MIA PaCa-2 cells significantly reduced lactate production, anaerobic glycolysis, glucose consumption and glycolytic rate that are comparable to the inhibition of LDHA by oxamate treatment. Significant changes in intracellular glucose carbon re-distribution among major glucose-utilizing macromolecule biosynthesis pathways in response to EGCG and oxamate treatment were observed. The inhibition of LDHA by EGCG or oxamate impacts on various pathways of the cellular metabolic network and significantly modifies the cancer metabolic phenotype. These results suggest that phytochemical EGCG and LDHA inhibitor oxamate confer their anti-cancer activities by disrupting the balance of flux throughout the cellular metabolic network.
Keywords: EGCG, oxamate, human pancreatic cancer MIA PaCa-2 cells, tracer based metabolomics
1 Introduction
The molecular pathogenesis of pancreatic cancer is associated with the aberrant activation on multiple ontogenetic signaling pathways and the defined mutations in KRAS, P53, SMAD4 and CDKN2A (Bardeesy and DePinho, 2002). The activation of oncogenes, such as MYC, RAS and AKT, and/or the loss of tumor suppressor gene P53 (Jones and Thompson, 2009; Hsu and Sabatini, 2008; Deberardinis et al., 2008) in cancer has been linked to metabolic alterations characterized by aerobic glycolysis in the presence of sufficient oxygen, which is sine qua non for the Warburg effect. Aerobic glycolysis in cancer cells may be a coordinated response to the relative hypoxic tumor microenvironment, and the hypoxia-inducible factor (HIF-1) is commonly increased. HIF-1 is a critical transcription factor for hypoxic adaptation which regulates the expression of glycolytic enzyme genes including the lactate dehydrogenase A (LDHA), an enzyme that catalyzes the conversion of pyruvate to lactate, and oxidizes the reduced form of nicotinamide adenine dinucleotide (NADH) to NAD+ (Semenza et al., 1996). Several human cancers including the pancreas display elevated expression of LDHA (Goldman et al., 1964; Rong et al., 2013). Recent studies have shown that LDHA is involved in tumor initiation, maintenance, and progression (Le et al., 2010; Fantin et al., 2006). A small molecule inhibitor of LDHA, FX11 (3-dihydroxy-6-methyl-7-(phenylmethyl)-4-propylnaphthalene-1-carboxylic acid), has been shown to inhibit the progression of pancreatic and lymphoma xenografts, suggesting a therapeutic approach to the Warburg effect (Le et al., 2010).
Green tea, with its major constituent epigallocatechin gallate (EGCG), has been shown to be potentially promising as a chemopreventive agent (Surh, 2003; Yang et al., 2009). Green tea and EGCG induce growth inhibition and apoptosis in various pancreatic cancer cell lines (Zhang et al., 2011; Takada et al., 2002). In particular, EGCG inhibits the growth of MIA PaCa-2 pancreatic adenocarcinoma cells with IC50 in the range of 25-50 μM and induces apoptosis in several studies (Takada et al., 2002; Qanungo et al., 2005; Li et al., 2009). In vivo studies have also demonstrated the inhibitory effect of green tea on tumorigenesis in the pancreas in nitrosamine-induced pancreatic tumors (Hiura et al., 1997; Majima et al., 1998; Shankar et al., 2008). EGCG was shown to significantly reduce tumor volume, proliferation, angiogenesis and metastasis in pancreatic xenograft tumors (Shankar et al., 2008).
The mechanism of green tea and EGCG on the tumor metabolism is poorly understood. Recently, we have reported that a green tea extract (GTE) significantly down-regulated LDHA in HPAF-II pancreatic cancer cells using global proteomics profiling (Zhang et al., 2011) Additionally, GTE concomitantly inhibited molecular chaperones heat shock proteins (Hsp) Hsp90, its mitochondrial localized homologue Trap1 (tumor necrosis factor receptor-associated protein 1), Hsp27, phosphor-Akt and induced apoptosis and growth suppression of the cells. These proteomic modifications are likely linked to the alterations in cellular metabolism. The present study is to investigate how EGCG targets the metabolism in the MIA PaCa-2 pancreatic adenocarcinoma cells. We compared the effect of EGCG to that of oxamate, an established pyruvate analog and inhibitor of LDHA (Granchi et al., 2011; Papaconstantinou and Colowick, 1961), on multiple metabolic pathways as measured by extracellular lactate production, glucose consumption, as well as intracellular aspartate and glutamate production, fatty acid synthesis, acetyl-CoA, RNA ribose and deoxyribose using [1, 2-13C2]-d-glucose as the single precursor metabolic tracer. Isotope incorporations in metabolites were analyzed using gas chromatography/mass spectrometry (GC/MS) and stable isotope-based dynamic metabolic profiling (SiDMAP). Our results show that the inhibition of LDHA by EGCG or oxamate impacts on a number of pathways of the cellular metabolic network and significantly modifies the cancer metabolic phenotype.
2 Materials and Methods
2.1 Chemicals and stable glucose isotopes
EGCG, sodium oxamate and unlabelled glucose were purchased from Sigma-Aldrich (St. Louis, MO). Stable [1, 2- 13C2]-d-glucose isotopes were purchased from Isotec, Inc. (Miamisburg, OH) with 99% purity and 99% isotope enrichment for each position. Recovery standards [U-13C6]-glucose and [U-13C3]-lactate were purchased from Cambridge Isotope Laboratories, Inc. (Tewksbury, MA). Isotope incubation and treatment were performed as described previously (Harris et al., 2012).
2.2 Cell culture
MIA PaCa-2 (ATCC CRL1420) cells were purchased from American Type Culture Collection (ATCC, Manassas, VA). The cells were incubated at 37°C, 5% CO2 and 95% humidity in DMEM with 10% FBS. Cells (1×10⁶) were seeded in 100 mm tissue culture petri dishes, and supplied with 50% naturally labeled d-glucose and 50% [1, 2-13C2]-d-glucose which were dissolved in otherwise glucose- and sodium pyruvate-free DMEM with 10% FBS (Life Technologies, Carlsbad, CA). The final glucose concentration is 450 mg/100 ml in each culture. Cells were treated with EGCG (50 μM) and oxamate (100 mM) for 48 h and then harvested for measurement of metabolic profiling. The concentrations of EGCG and oxamate used were chosen based on published studies (Harris et al., 2012; Thornburg et al., 2008).
2.3 Lactate production from glucose
For the glucose assay, 50 μL of medium (after 24 hour incubation) was mixed with 900 μL of methanol:water (8:1) to precipitate major proteins from the sample. [U-13C6]-glucose (50 μg) was added to each sample as a recovery standard for quantitative analysis. After centrifugation, the supernatant was dried and glucose was converted to its aldonitrile pentaacetate derivative for GC/MS analysis (Wahjudi et al., 2010). Spectral peaks at m/z 328, 330 and 334 were monitored. After correction of natural 13C abundance, m0, m2 and m6 peaks were used to calculate total glucose concentration and [1, 2-13C2]-glucose enrichment. Lactate from cell culture media (50 μL) was extracted with ethyl acetate after acidification with hydrochloric acid. [U-13C3]-lactate was added before extraction to serve as the recovery standard. The residue obtained after drying was treated with bis-trimethylsilyl trifluoroacetamide and trimethylchlorosilane (99:1, v/v) (Sulpelco) before GC/MS analysis as described (Jeoung et al., 2012). The ions around m/z 219 were monitored for isotopomer calculation. Molar enrichment of lactate with one 13C carbon (m1), two 13C carbons (m2) and three 13C carbons (m3) were determined. The fractions of m1 and m2 represent lactate generated from oxidative branch of the pentose cycle and from glycolysis, respectively (Lee et al., 1998). The m3 isotopomer represented the recovery standard for the purpose of calculating lactate concentrations. In this study, we recorded the m1/m2 ratios in lactate produced and released by MIA PaCa-2 cells in order to determine pentose cycle activity vs. anaerobic glycolysis in response to EGCG and oxamate treatment.
2.4 Glutamate and aspartate
Free amino acids were isolated from cell pellets after brief sonication. Cell debris and proteins were separated using 30% ethanol precipitation and centrifugation. Amino acids were collected in the supernatant fraction and dried under a stream of nitrogen. Glutamate and aspartate were converted to n-trifluoroacetyl-n-butyl ester (TAB) derivatives. GC/MS analysis was carried out on a Hewlett-Packard 5973N mass spectrometer connected to a model 6890 gas chromatograph. The TAB derivatives of glutamate and aspartate were separated on a 30 meter ZB5® (Phenomenex) capillary column (Lee et al., 1996). The GC conditions are as follows: injector temperature 250°C, initial oven temperature 170°C for 2 minutes. Oven temperature was then programmed to increase by 3°C/minute to 190°C and 40°C/min to final temperature of 270°C. Helium was used as the carrier gas at a flow rate of 1 mL/min. Under these conditions the retention time of TAB derivative of aspartate was at 6.3 min and glutamate at 9.0 min. Selected ion monitoring (SIM) was used for quantitative analysis of mass isotopomers. Electron impact (EI) ionization of TAB-glutamate produces two fragments, m/z 198 and 152, corresponding to C2–C5 and C2–C4 of glutamate (Leimer et al., 1977).
The isotopomer distribution of the glutamate fragments can be used to deduce the distribution of key isotopomers of glutamate as shown previously (Lee et al., 1996). Glutamate labeled on the 4–5 carbon positions indicates pyruvate dehydrogenase activity, while glutamate labeled on the 2–3 carbon positions indicates pyruvate carboxylase activity for the entry of glucose carbons into the TCA cycle. Enrichment of the doubly-labeled (m2) isotopomer of the C2-C4 fragment (m/z 152) of glutamate represents the incorporation of 13C via pyruvate carboxylase, and the m2 isotopomer of the C2-C5 fragment (m/z 198) represents the incorporation of 13C via pyruvate carboxylase and pyruvate dehydrogenase. The pyruvate carboxylase/pyruvate dehydrogenase (PC/PDH) ratio was thus determined by the formula (m2 of m/z 152 fragment)/[(m2 of m/z 198 fragment)-(m2 of m/z 152 fragment)] to evaluate the difference in pyruvate entering into the TCA cycle and the production of acetyl-CoA. TCA cycle anabolic glucose utilization was calculated based on the m1/m2 ratios of glutamate (Lee et al., 1996).
Aspartate isotopomers are formed either through pyruvate carboxylation of [1, 2-13C]-pyruvate from [1, 2-13C]-glucose or through the oxidation of malate from the TCA cycle. Aspartate isotopomers from either process are symmetrically labeled either in the [1, 2]- or [3, 4]-positions assuming randomization at the fumarate level. Electron impact ionization of TAB derivative of aspartate produced a fragment at m/z 152 corresponding to the C2-C4 fragment of aspartate with equal mixture of m2 and m1.
2.5 RNA ribose and 2-deoxyribose
RNA ribose was isolated by acid hydrolysis of the cellular RNA chloroform-isopropanol fraction after Trizol purification of cell extracts. Subsequent procedures were carried out to isolate 2-deoxyadenosine. Ribose and 2-deoxyribose were converted to their aldonitrile acetate derivatives prior to GC/MS analysis. Ion clusters around m/z 256 (carbons 1-5 of ribose, bychemical ionization, CI), m/z 217 (carbons 3-5 of ribose) and m/z 242 (carbons 1-4 of ribose from EI) were monitored. The oxidatitive vs nonoxidative ratio was determined as ox/non-ox = (m1+m3)/(m2+m3+2 × m4), since m1 and m3 need the oxidative branch to be formed, whereas m2, m3 and m4 species require the nonoxidative branch (twice in m4) (Lee et al., 1998).
2.6 Fatty acids and acetyl-CoA
Total fatty acids were extracted after saponification of cell pellets in 30% KOH (w/v) and 100% ethanol using petroleum ether. Fatty acids were converted to their methyl ester derivatives using 0.5N methanolic-HCl prior to GC/MS analysis. Palmitate was monitored beginning at m/z 270. Acetyl-CoA enrichment and de novo lipogenesis were determined from the mass isotopomer distribution of palmitate as reported previously (Lee, 1996).
2.7 Data analysis and statistical methods
Mass spectral analyses were carried out by consecutive and independent automatic injections of 1 μl samples by the automatic sampler; analyses were accepted only if the standard sample deviation is less than 1% of the normalized peak intensity among repeated injections. Data download was performed by three consecutive manual peak integrations using modified (background subtracted) spectra under the overlapping isotopomer peaks of the total ion chromatogram (TIC) window displayed by the Chemstation software (Agilent, Palo Alto, CA). 13C isotopomer enrichment in metabolic intermediates is presented as 13C m1, m2 … mn, where m represents mass shift in Dalton (D) with an integer indicating the number of 13C carbons replacing 13C in metabolites. Statistical analyses were performed using parametric unpaired, two-tailed independent sample “t” test as indicated with 95% confidence intervals. P < 0.05 was considered to indicate significant differences in glucose carbon metabolism between control and treated cells.
3 Results
3.1 Lactate production and glucose consumption
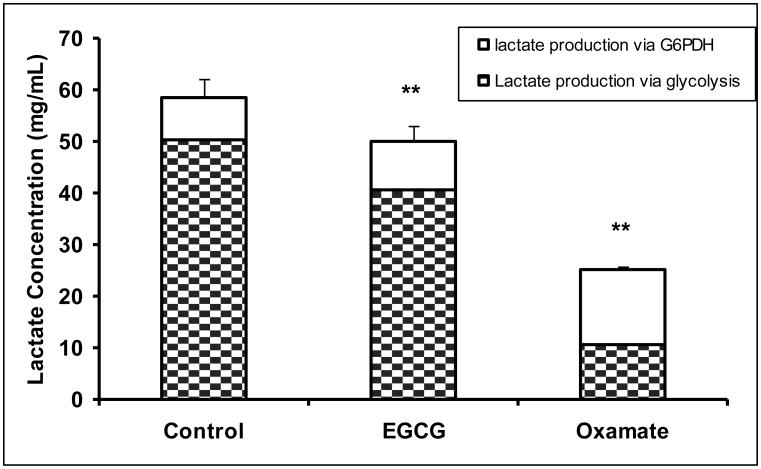
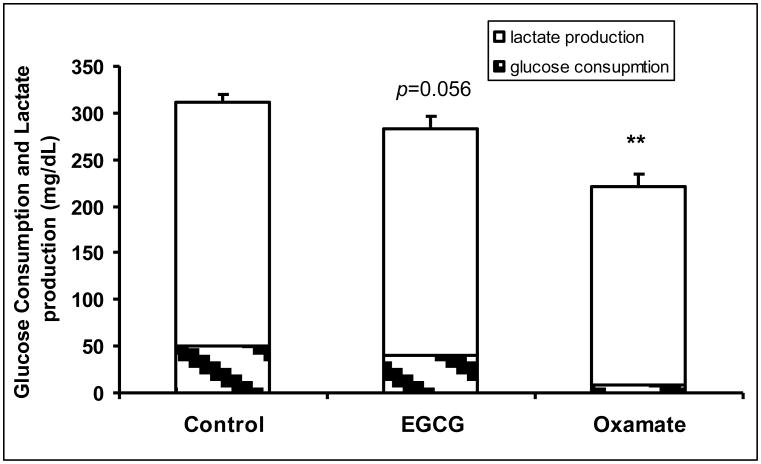
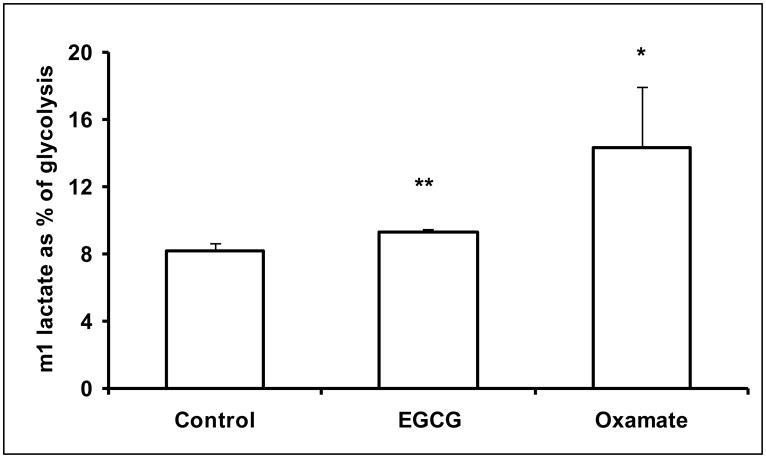
Human pancreatic adenocarcinoma MIA PaCa-2 cells were treated with 50 μM of EGCG or 100 mM oxamate. Oxamate is a LDHA reference inhibitor with a Ki of 138 μM (vs. pyruvate) (Thornburg et al., 2008). The reduction of LDHA expression by EGCG or inhibition of LDHA by oxamate significantly decreased lactate production via glycolysis pathway (Fig. 1a). Under control conditions, lactate production raised the medium lactate concentration to 58.5 ± 3.5 mg/dL, which was reduced to 50.0 ± 2.9 and 25.1 ± 0.69 mg/dL by EGCG and oxamate, respectively (Fig. 1a). The sources of lactate molecules varied under LDHA inhibition. Of the lactate produced, 84.6 % of the molecules were normally derived from glucose. As the result of the suppression of LDHA, the contribution of glycolysis to the lactate production reduced to 80.9% and 32.0% by EGCG and oxamate, respectively (Fig. 1a). There was a retrograde effect on glucose uptake due to LDHA inhibition with 261.5 ± 8.8 mg/dL in the control, 242 ± 13.6 mg/dL by EGCG (P = 0.056) and 212.2 ± 14.2 mg/dL (P < 0.01) by oxamate (Fig. 1b). The fractions of glucose used for lactate production were 18.9%, 16.7% and 3.7% under these conditions. Starting from the phosphorylation, glucose molecules can enter into the glycolytic pathway producing lactate with two 13C carbons (m2 lactate) or the glucose-6-phosphate dehydrogenase (G6PDH) pathway producing lactate with one 13C carbon (m1 lactate). Inhibition of LDHA increased the relative flux through the oxidative branch of the pentose phosphate pathway (PPP) as indicated by the ratio of m1/(m1+m2) (Fig. 1c).
Fig. 1.
EGCG (50 μM) and oxamate (100 mM) decreased lactate production and glucose consumption in MIA PaCa-2 cells after 24 h incubation. a Lactate production from glucose. Fraction of lactate molecules with either one (m1) or 2 (m2) 13C carbons are the products from glucose. Since only half of the trioses were labeled with 13C carbons, lactate production from glucose is given by the lactate concentration multiplied by twice the fraction of labeled lactate (m1+m2); b Glucose consumption was determined from glucose concentration in the medium at the beginning and the end of the incubation period; c Glucose undergoing glycolysis generates lactate molecules labeled with two 13C (m2) and oxidative decarboxylation by G6PDH generates lactate molecules labeled with one 13C (m1). The fraction of m1/m2 was used to calculate lactate production via G6PDH as a fraction of glycolysis. Columns, mean; bars, SD (n = 4). *, P < 0.05, **, P < 0.01 vs untreated control.
3.2 Labeled glucose contribution to RNA-ribose and 2-deoxyribose
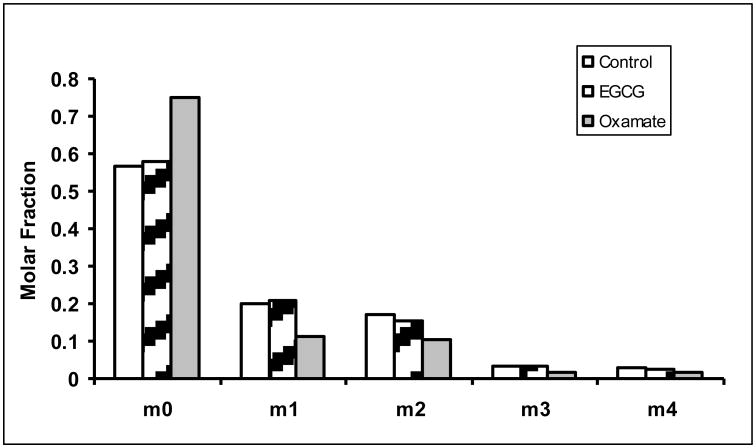
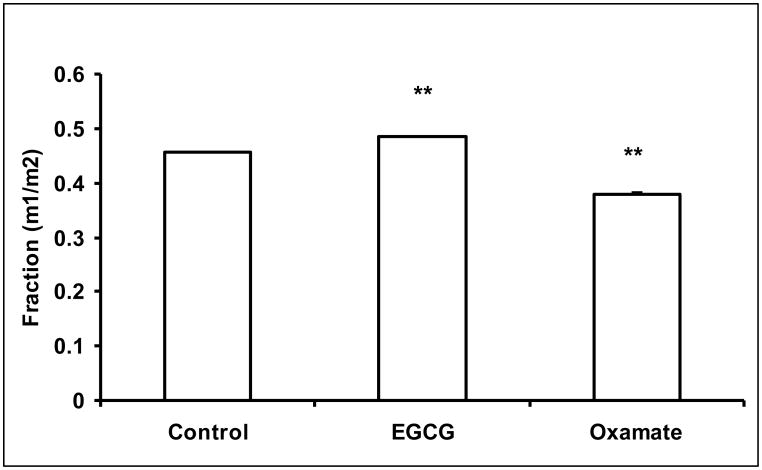
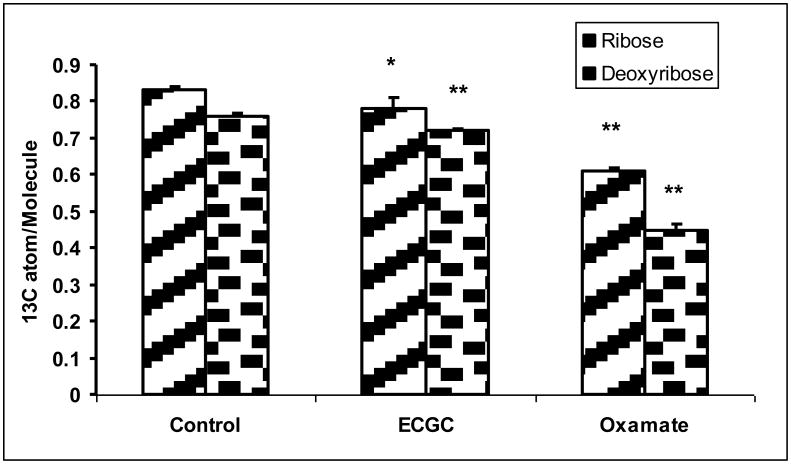
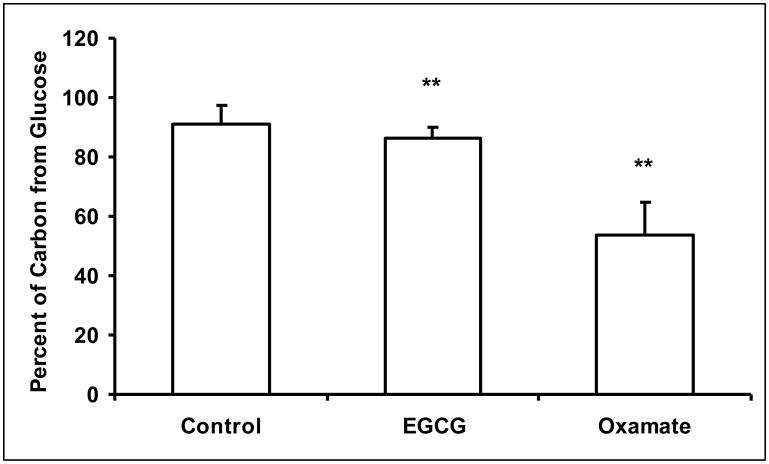
The reduced glucose uptake also impacted on pentose cycle metabolism. Both EGCG and oxamate altered the flux through oxidative and non-oxidative branch of pentose cycle. The oxidation of [1, 2-13C2]-glucose produces [1-13C]-ribose (m1 ribose) while the action of transketolase/transaldolase produces [1, 2-13C2]-ribose (m2 ribose). Further action of transktolase/transaldolase produces m3 and m4 ribose. The distribution of these isotopomers is shown in Figure 2a. The sum of m1 and m3 to that of m2 and m4 provides an estimate of the oxidative/non-oxidative ratio of the pentose phosphate pathway (PPP) according to Ramos-Montoya (Ramos-Montoya et al., 2006). The ratio changed from 1.38 ± 0.018 in untreated controls to 1.47 ± 0.030 and 1.15 ± 0.026 in EGCG and oxamate treated cells, respectively (Fig. 2b). Thus, the inhibition of LDHA resulted in an increase in pentose cycle flux through the oxidative relative to the non-oxidative pathway by ECGC treatment, but a decrease in the ratio by oxamate treatment. Additionally, the net incorporations of 13C from glucose into RNA-ribose as well as DNA-deoxyribose were reduced (Fig. 2c). The contribution of glucose carbon to ribose can be calculated by dividing the 13C enrichment in ribose by 13C enrichment in medium glucose. The percent contribution of glucose carbon reflects the fraction of new ribose synthesis (Fig. 2d). These reductions reflected a decrease in macromolecular synthesis consistent with diminished cell growth and proliferation.
Fig. 2.
Reduction of ribose and deoxyribose syntheses in MIA PaCa-2 cells in response to EGCG (50 μM) and oxamate (100 mM) treatment. a Mass isotopomer distribution in ribose. The oxidative and non-oxidative branches of the pentose phosphate pathways (PPP) produce newly synthesized ribose with one or two 13C carbons. The combined action of the two branches of PPP results in the formation of m3 and m4 isotopomers of ribose. The m0 fraction of ribose represents the maximum fraction of pre-existing unlabeled ribose. The m0 fractions were elevated in ECGC and oxamate treated cells due to the inhibition of pentose synthesis; b Oxidative/non-oxidative pentose cycle. The mass isotopomer ratio m1/m2 reflects the relative contribution of the oxidative and non-oxidative pentose phosphate pathways to ribose synthesis. The inhibition of LDHA not only reduced ribose synthesis, it also affected the relative flux through these pathways; c 13C enrichments in ribose and deoxyribose were calculated from mass isotopomer distribution using the formula Σmn = m1*1+m2*2+m3*3+…. The result is the average number of 13C atom per molecule corresponding to specific activity. The accumulation of 13C is a surrogate measure of the respective pentose synthesis from glucose; d Contribution of glucose carbon to ribose is calculated by dividing the 13C enrichment in ribose by 13C enrichment in medium glucose. The percent contribution of glucose carbon reflects the fraction of new ribose synthesis. Columns, mean; bars, SD (n = 4). *, P < 0.05, **, P < 0.01 vs untreated control.
3.3 Labeled glucose contribution to TCA cycle intermediates
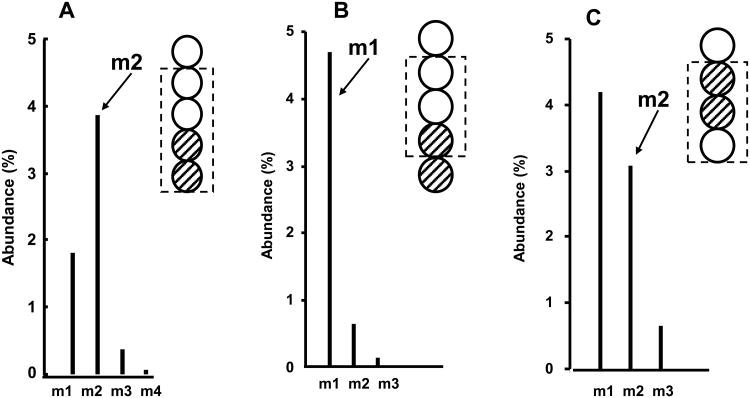
The amount of pyruvate entering into the TCA cycle depends on the action of two important pathways, pyruvate carboxylase (PC) and pyruvate dehydrogenase (PDH, Fig 3). Acetyl-CoA formed from PDH can be used for glucose oxidation or de novo lipogenesis. PC converts pyruvate to oxaloacetate (OAA) whereas PDH converts pyruvate to acetyl-CoA which condenses with OAA to form citrate and α-ketoglutarate (α-KG). Labeled pyruvate ([2, 3-13C2] pyruvate) is generated from [1, 2-13C2] glucose in glycolysis, which subsequently labels TCA cycle intermediates OAA in carbon 2 and 3 positions and α-KG in carbon 4 and 5 positions. The amount of 13C and the specific positions of labeling can be ascertained by the determination of mass isotopomers in aspartate and glutamate as m1 or m2 in the molecular fragments as shown in the accompanied spectra (Fig. 4). As shown in figure 3, [2, 3-13C2] pyruvate is converted to m2-αKG, [2, 3-13C2]-αKG via labeling of OAA and [4, 5-13C2]-αKG by PDH. These labeled molecules appear in the C2-C5 fragment (m/z 198) as m2. The fragment from [4, 5-13C2]-αKG becomes m1 while the corresponding fragment from [2, 3-13C2]-αKG remains as m2 in the C2-C4 fragment (m/z 152). When m2-αKG completes the first turn of the TCA cycle, it is converted to m1-αKG. The molar fractions of mass isotopomers of the aspartate and glutamate fragments are summarized in Table 1. It is important to note that the majority of m2 in the C2-C5 fragment became m1 of the C2-C4 fragment of glutamate indicating that labeling of glutamate was predominately via the PDH pathway. The ratio of m1/m2 of glutamate was used to calculate anaplerotic flux which reflects anaplerotic activity (conservation of pyruvate) relative to TCA cycle flux (Lee et al., 1996). Inhibition of LDHA decreased anaplerotic flux from 1.74 ± 0.10 to 1.54 ± 0.06 (P < 0.014) by ECGC and to 0.564 ± 0.022 (P < 5.4E-7) by oxamate. Σmn is the sum of product of molar fraction (m) with the number of 13C carbon substitution (n). The result is the 13C enrichment of the molecule or the average 13C carbon per molecule and is equivalent to specific activity in radioactive tracer studies. The increase in Σmn in Table 1 is a reflection of the contribution of glucose to glutamate synthesis. Inhibition of LDHA affected the entry of glucose carbon into the TCA cycle and the 13C-enrichment of glutamate was reduced by EGCG (0.099 ± 0.008, P = 0.2) and oxamate (0.074 ± 0.018, P = 0.001) treated cells, compared to untreated cells (0.103 ± 0.005).
Fig. 3.
Spectra of Mass isotopomer distribution in aspartate and glutamate as m1 or m2 in molecular fragments. [1, 2-13C2]-pyruvate from [1, 2-13C2]- glucose labels carbon 4 and 5 or carbons 2 and 3 of glutamate. These labeled glutamate molecules give rise to m2 C2-C5 fragment (a). However, only glutamate labeled in carbons 4 and 5 can give rise to m1 C2-C4 fragment (b). On the other hand, [1, 2-13C2]-pyruvate labels the inner carbons of oxaloacetate giving rise to m2 C2-C4 fragment (c).
Fig. 4.
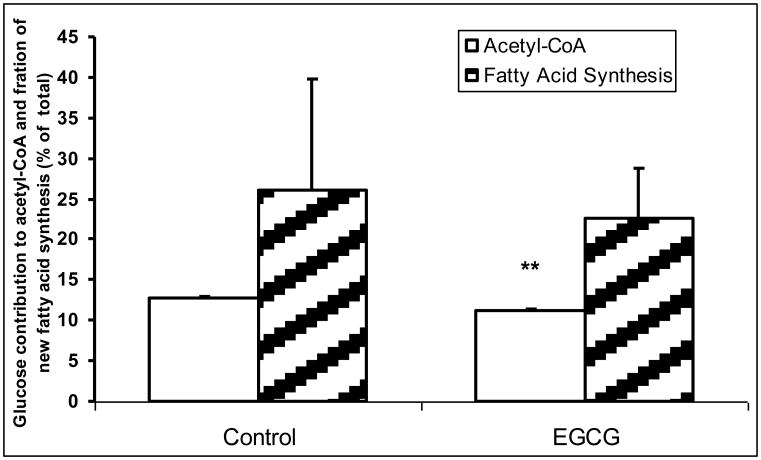
Glucose contribution to acetyl-CoA and fatty acid synthesis. EGCG (50 μM) treatment reduced glucose contribution to acetyl-CoA with a trend of decreased fraction of newly synthesized palmitate. Columns, mean; bars, SD (n = 4). *, P < 0.05, **, P < 0.01 vs untreated control.
Table 1. Mass isotopomer distribution in glutamate and aspartate and their fragments from MIA PaCa-2 cells incubated with [1, 2-13C2]-glucose.
| m0 | m1 | m2 | m3 | m4 | Σmn | |
|---|---|---|---|---|---|---|
| Glutamate C2 -C5 Fragment | ||||||
| Control | 0.943±0.003 | 0.016±0.001 | 0.037±0.002 | 0.003±0.001 | 0.001±0.001 | 0.103±0.005 |
| ECGC | 0.944±0.006 | 0.017±0.001 | 0.035±0.007 | 0.003±0.001 | 0.001±0.001 | 0.099±0.008 |
| Oxamate | 0.957±0.002 | 0.018±0.001 | 0.020±0.001 | 0.002±0.001 | 0.002±0.002 | 0.074±0.008 |
| Glutamate C2 -C4 Fragment | ||||||
| Control | 0.928±0.021 | 0.059±0.014 | 0.009±0.003 | 0.004±0.001 | 0.089±0.032 | |
| ECGC | 0.944±0.002 | 0.048±0.001 | 0.007±0.001 | 0.002±0.001 | 0.067±0.004 | |
| Oxamate | 0.958±0.001 | 0.039±0.004 | 0.003±0.001 | -0.00±0.001 | 0.045±0.006 | |
| m0 | m1 | m2 | Σmn | |||
| Aspartate C2 -C4 Fragment | ||||||
| Control | 0.925±0.003 | 0.032±0.002 | 0.043±0.002 | 0.119±0.005 | ||
| ECGC | 0.926±0.001 | 0.030±0.004 | 0.044±0.005 | 0.118±0.006 | ||
| Oxamate | 0.949±0.002 | 0.018±0.005 | 0.034±0.006 | 0.085±0.007 | ||
Aspartate is produced from OAA that is formed by pyruvate carboxylation giving rise to m2 aspartate and is in equilibrium with m1 malate in the TCA cycle. Therefore the mass isotopomer distribution is dissimilar to that of C2-C4 fragment of glutamate and reflects the admixture of these two processes. Channeling of malate from the TCA cycle to OAA in the cytosol for transamination is part of the malate cycle which is responsible for transporting reducing equivalents from the mitochondria to the cytosol.
3.4 Labeled glucose contribution to acetyl-CoA and de novo fatty acid synthesis
Palmitate, a major constituent of cellular membranes, is synthesized de novo from acetyl-CoA and malonyl-CoA by acetyl CoA carboxylase and fatty acid synthase (FAS). The measurement of newly made palmitate incorporating the isotope label over time is called the fraction of new synthesis. ECGC treatment effectively decreased acetyl-CoA, which in turn reduced palmitate synthesis (Fig. 5). We were unable to estimate acetyl-CoA enrichment from oxamate-treated cells, consistent with the role of oxamate as an inhibitor of fatty acid synthesis. The enrichment of the acetyl-CoA pool is a result of the action from PDH. From a theoretical enrichment of pyruvate (50% of [1, 2-13C2] glucose divided by two, or 25%), we can deduce that glucose carbons contributed to roughly 50% of the carbons in de novo synthesis. Both the m2 of glutamate and aspartate were significantly lower than that of acetyl-CoA enrichment suggesting dilution of glutamate from glutamine in the medium.
4 Discussion
Living cells are endowed with the capability of maintaining metabolic homeostasis. In proliferating cells such as cancer cells, metabolic homeostasis allows for macromolecule synthesis and cell division. Cellular metabolic homeostasis is regulated by a servomechanism (servo) system of signaling pathways, and by energy and substrate constraints in an extended cellular metabolic network (Zhang et al., 2010; Ma et al., 2012). The state of homeostasis is deviated when either signaling pathways or metabolic constraints are perturbed. The workings of such a system are not unlike those of an engineering system, such as temperature control, which includes a thermostat, along with heating and cooling elements. The system works by retaining a balance between heat gain and heat loss. Similarly, the hardware of the biological system consists of signaling and metabolic pathways and the metabolic homeostasis in cells is maintained by a balance of substrate input and metabolite output (balance of flux) across each metabolic pathway. When the balance of flux across the LDHA pathway is perturbed as shown in the present study, the cellular homeostasis is disrupted, resulting in a loss of metabolic efficiency and a new metabolic phenotype. Understanding of such a servo system would allow for the prediction that lactate production can be impeded by small molecules acting on different parts of the metabolic network. Using tracer-based metabolomics we showed that LDHA activity was reduced by ECGC through the inhibition of LDHA expression, and by oxamate through the direct inhibition of LDHA enzyme. Our findings of indirect and direct action of ECGC and oxamate on lactate production in cancer cells are consistent with previous reported observations in breast cancer cells (Thornburg et al., 2008) and colon cancer cells (Sanchez-Tena et al., 2013). The change in LDHA activity directly impaired the flux balance through the pyruvate pool and provoked a systems response throughout the metabolic network to achieve a new state of substrate balance and homeostasis. Both EGCG and oxamate significantly reduced glucose consumption resulting in decreased glycolytic rate in pancreatic adenocarcinoma cells. Since the pentose phosphate pathway (PPP) and glycolysis share a number of common metabolites, the decrease in glycolytic rate impacted on the flux balance of the pentose cycle intermediates by decreasing the contribution of G6PDH pathway to lactate production, changing the ratio of oxidative vs non-oxidative pathways of ribose synthesis, and reducing both ribose and deoxyribose syntheses. Thus, treatment of cells with ECGC and oxamate altered flux through affluent pathways to the pyruvate pool. Conventional precursor-product analysis suggests that inhibition of conversion of pyruvate into lactate may result in an increase in pyruvate concentration and substrate entry to the TCA cycle. Here we showed that the inhibition of LDHA was associated with reduced glycolysis and pyruvate contribution to the acetyl-CoA pool. This is evident from the reduced acetyl-CoA enrichment calculated from the labeling of palmitate and from the labeling of C4 and C5 of glutamate. Inhibition of LDHA also had an effect on anaplerosis, pathways leading out of the TCA cycle responsible for amino acid synthesis. Anaplerotic flux relative to TCA cycle flux was significantly reduced by ECGC and oxamate. Similarly, a decreased glucose contribution to pyruvate and OAA affected malate cycle as seen in the reduced m2 enrichment in aspartate. Thus ECGC and oxamate not only affect the affluent pathways to the pyruvate pool, but also affect the effluent pathways from pyruvate through the TCA cycle. The overall result is a perturbed homeostatic state in the MIA PaCa-2 cells with diminished biosynthesis of macromolecules and reduced rate of proliferation or increased apoptosis. Thus, direct and indirect inhibition of LDHA activity resulted in alterations in substrate fluxes into and out of the pool of glycolytic intermediates.
Despite numerous in vitro studies showing efficacy in suppressing tumor growth by metabolic inhibitors or phytochemicals, these agents have not been promoted for the treatment of cancer as much as agents targeting oncogenic pathways. In the design of anticancer drugs, targeting signal transduction pathways or targeting metabolic pathways can effectively change the balance of fluxes in the cellular metabolic network. Understanding of how cells maintain their homeostasis would suggest signal transduction pathways as well as metabolic pathways that can be exploited for the design of anticancer drugs. We have previously shown, among many other well-known antimetabolites used in the treatment of cancer, that oxythiamine, glycogen phosphorylase inhibitor CP-320626, and genistein effectively decreased ribose synthesis and cancer cell proliferation (Boros et al., 1997; Lee et al., 2004; Boros et al., 2001). Recently, studies have shown that dietary phenolic compounds luteolin and resveratrol inhibit FAS. The effect of FAS inhibition on cancer cell proliferation was also observed with a synthetic targeted FAS inhibitor C75 in MIA PaCa-2 cells (Harris et al., 2012). Conversely, growth promoting TGFβ and growth inhibiting signal ST571 were shown to change cellular metabolism principally by affecting the macromolecule synthesis pathways (Boros et al., 2000; Boren et al., 2001). The integration between signal transduction pathways and metabolic pathways has been studied using a proteomics approach. The results support the reciprocal relationship that changing the balance of flux by metabolic inhibitors can initiate changes in signaling pathways and vice versa (Zhang et al., 2010; Wang et al., 2013).
Our data demonstrated how specific inhibition or secondary inhibition of LDHA expression can have similar effect on flux through the LDHA pool leading to a diverse metabolic consequence through the concept of balance of flux. ECCG has been shown to target multiple pathways including the PI3K/AKT/mTOR (Liu et al., 2013) and to reduce the gene expressions of gluconeogenic enzymes, glucose-6-phosphatase (G6Pase) and phosphoenolpyruvate carboxykinase (PEPCK) (Yasui et al., 2011). Therefore, other mechanisms may be involved in the change of cell metabolic network that differ from those by oxamate inhibition.
In summary, we have shown that EGCG treatment of pancreatic carcinoma cells significantly reduced lactate production, anaerobic glycolysis, glucose consumption and glycolytic rate that are comparable to the inhibition of LDHA by oxamate treatment. Significant changes in intracellular glucose carbon re-distribution among major glucose-utilizing macromolecule biosynthesis pathways in response to EGCG and oxamate treatment were observed. These results suggest that phytochemical EGCG and LDHA reference inhibitor oxamate confer their anti-cancer activities by suppressing LDHA, leading to the disruption of the balance of flux throughout the cellular metabolic network. The metabolic profiling with tracers (tracer-based metabolomics) is a powerful tool to evaluate flux balance in a metabolic network.
Acknowledgments
This work was supported by the National Institutes of Health (P01AT003960) and the Hirshberg Foundation for Pancreatic Cancer Research.
Abbreviations
- EGCG
(–)-epigallocatechin gallate
- GTE
green tea extract
- LDHA
lactate dehydrogenase A
References
- Bardeesy N, DePinho RA. Pancreatic cancer biology and genetics. Nat Rev Cancer. 2002;2(12):897–909. doi: 10.1038/nrc949. doi:10.1038/nrc949 [doi];nrc949 [pii] [DOI] [PubMed] [Google Scholar]
- Boren J, Cascante M, Marin S, Comin-Anduix B, Centelles JJ, Lim S, Bassilian S, Ahmed S, Lee WN, Boros LG. Gleevec (STI571) influences metabolic enzyme activities and glucose carbon flow toward nucleic acid and fatty acid synthesis in myeloid tumor cells. J Biol Chem. 2001;276(41):37747–37753. doi: 10.1074/jbc.M105796200. doi:10.1074/jbc.M105796200 [doi];M105796200 [pii] [DOI] [PubMed] [Google Scholar]
- Boros LG, Bassilian S, Lim S, Lee WN. Genistein inhibits nonoxidative ribose synthesis in MIA pancreatic adenocarcinoma cells: a new mechanism of controlling tumor growth. Pancreas. 2001;22(1):1–7. doi: 10.1097/00006676-200101000-00001. [DOI] [PubMed] [Google Scholar]
- Boros LG, Puigjaner J, Cascante M, Lee WN, Brandes JL, Bassilian S, Yusuf FI, Williams RD, Muscarella P, Melvin WS, Schirmer WJ. Oxythiamine and dehydroepiandrosterone inhibit the nonoxidative synthesis of ribose and tumor cell proliferation. Cancer Res. 1997;57(19):4242–4248. [PubMed] [Google Scholar]
- Boros LG, Torday JS, Lim S, Bassilian S, Cascante M, Lee WN. Transforming growth factor beta2 promotes glucose carbon incorporation into nucleic acid ribose through the nonoxidative pentose cycle in lung epithelial carcinoma cells. Cancer Res. 2000;60(5):1183–1185. [PubMed] [Google Scholar]
- Deberardinis RJ, Sayed N, Ditsworth D, Thompson CB. Brick by brick: metabolism and tumor cell growth. Curr Opin Genet Dev. 2008;18(1):54–61. doi: 10.1016/j.gde.2008.02.003. doi:S0959-437X(08)00028-2 [pii];10.1016/j.gde.2008.02.003 [doi] [DOI] [PMC free article] [PubMed] [Google Scholar]
- Fantin VR, St-Pierre J, Leder P. Attenuation of LDH-A expression uncovers a link between glycolysis, mitochondrial physiology, and tumor maintenance. Cancer Cell. 2006;9(6):425–434. doi: 10.1016/j.ccr.2006.04.023. doi:S1535-6108(06)00145-0 [pii];10.1016/j.ccr.2006.04.023 [doi] [DOI] [PubMed] [Google Scholar]
- Goldman RD, Kaplan NO, Hall TC. Lactic Dehydrogenase in Human Neoplastic Tissues. Cancer Res. 1964;24:389–399. [PubMed] [Google Scholar]
- Granchi C, Roy S, Giacomelli C, Macchia M, Tuccinardi T, Martinelli A, Lanza M, Betti L, Giannaccini G, Lucacchini A, Funel N, Leon LG, Giovannetti E, Peters GJ, Palchaudhuri R, Calvaresi EC, Hergenrother PJ, Minutolo F. Discovery of N-hydroxyindole-based inhibitors of human lactate dehydrogenase isoform A (LDH-A) as starvation agents against cancer cells. J Med Chem. 2011;54(6):1599–1612. doi: 10.1021/jm101007q. doi:10.1021/jm101007q [doi] [DOI] [PubMed] [Google Scholar]
- Harris DM, Li L, Chen M, Lagunero TL, Go VLW, Boros LG. Diverse mechanisms of growth inhibition by luteolin, resveratrol, and quercetin in MIA PaCa-2 cells: a comparative glucose tracer study with the fatty acid synthase inhibitor C75. Metabolomics. 2012 doi: 10.1007/s11306-011-0300-9. [DOI] [PMC free article] [PubMed] [Google Scholar]
- Hiura A, Tsutsumi M, Satake K. Inhibitory effect of green tea extract on the process of pancreatic carcinogenesis induced by N-nitrosobis-(2-oxypropyl)amine (BOP) and on tumor promotion after transplantation of N-nitrosobis-(2-hydroxypropyl)amine (BHP)-induced pancreatic cancer in Syrian hamsters. Pancreas. 1997;15(3):272–277. doi: 10.1097/00006676-199710000-00009. [DOI] [PubMed] [Google Scholar]
- Hsu PP, Sabatini DM. Cancer cell metabolism: Warburg and beyond. Cell. 2008;134(5):703–707. doi: 10.1016/j.cell.2008.08.021. doi:S0092-8674(08)01066-0 [pii];10.1016/j.cell.2008.08.021 [doi] [DOI] [PubMed] [Google Scholar]
- Jeoung NH, Rahimi Y, Wu P, Lee WN, Harris RA. Fasting induces ketoacidosis and hypothermia in PDHK2/PDHK4-double-knockout mice. Biochem J. 2012;443(3):829–839. doi: 10.1042/BJ20112197. doi:BJ20112197 [pii];10.1042/BJ20112197 [doi] [DOI] [PMC free article] [PubMed] [Google Scholar]
- Jones RG, Thompson CB. Tumor suppressors and cell metabolism: a recipe for cancer growth. Genes Dev. 2009;23(5):537–548. doi: 10.1101/gad.1756509. doi:23/5/537 [pii];10.1101/gad.1756509 [doi] [DOI] [PMC free article] [PubMed] [Google Scholar]
- Le A, Cooper CR, Gouw AM, Dinavahi R, Maitra A, Deck LM, Royer RE, Vander Jagt DL, Semenza GL, Dang CV. Inhibition of lactate dehydrogenase A induces oxidative stress and inhibits tumor progression. Proc Natl Acad Sci U S A. 2010;107(5):2037–2042. doi: 10.1073/pnas.0914433107. doi:0914433107 [pii];10.1073/pnas.0914433107 [doi] [DOI] [PMC free article] [PubMed] [Google Scholar]
- Lee WN. Stable isotopes and mass isotopomer study of fatty acid and cholesterol synthesis. A review of the MIDA approach. Adv Exp Med Biol. 1996;399:95–114. doi: 10.1007/978-1-4613-1151-5_8. [DOI] [PubMed] [Google Scholar]
- Lee WN, Boros LG, Puigjaner J, Bassilian S, Lim S, Cascante M. Mass isotopomer study of the nonoxidative pathways of the pentose cycle with [1,2-13C2]glucose. Am J Physiol. 1998;274(5 Pt 1):E843–E851. doi: 10.1152/ajpendo.1998.274.5.E843. [DOI] [PubMed] [Google Scholar]
- Lee WN, Edmond J, Bassilian S, Morrow JW. Mass isotopomer study of glutamine oxidation and synthesis in primary culture of astrocytes. Dev Neurosci. 1996;18(5-6):469–477. doi: 10.1159/000111442. [DOI] [PubMed] [Google Scholar]
- Lee WN, Guo P, Lim S, Bassilian S, Lee ST, Boren J, Cascante M, Go VL, Boros LG. Metabolic sensitivity of pancreatic tumour cell apoptosis to glycogen phosphorylase inhibitor treatment. Br J Cancer. 2004;91(12):2094–2100. doi: 10.1038/sj.bjc.6602243. doi:6602243 [pii];10.1038/sj.bjc.6602243 [doi] [DOI] [PMC free article] [PubMed] [Google Scholar]
- Leimer KR, Rice RH, Gehrke CW. Complete mass spectra of N-trifluoroacetyl-n-butyl esters of amino acids. J Chromatogr. 1977;141(2):121–144. doi: 10.1016/s0021-9673(00)99131-3. [DOI] [PubMed] [Google Scholar]
- Li Y, Zhang T, Jiang Y, Lee HF, Schwartz SJ, Sun D. (-)-Epigallocatechin-3-gallate inhibits Hsp90 function by impairing Hsp90 association with cochaperones in pancreatic cancer cell line Mia Paca-2. Mol Pharm. 2009;6(4):1152–1159. doi: 10.1021/mp900037p. doi:10.1021/mp900037p [doi] [DOI] [PMC free article] [PubMed] [Google Scholar]
- Liu S, Wang XJ, Liu Y, Cui YF. PI3K/AKT/mTOR signaling is involved in (-)-epigallocatechin-3-gallate-induced apoptosis of human pancreatic carcinoma cells. Am J Chin Med. 2013;41(3):629–642. doi: 10.1142/S0192415X13500444. doi:10.1142/S0192415X13500444 [doi] [DOI] [PubMed] [Google Scholar]
- Ma D, Wang J, Zhao Y, Lee WN, Xiao J, Go VL, Wang Q, Recker RR, Xiao GG. Inhibition of glycogen phosphorylation induces changes in cellular proteome and signaling pathways in MIA pancreatic cancer cells. Pancreas. 2012;41(3):397–408. doi: 10.1097/MPA.0b013e318236f022. doi:10.1097/MPA.0b013e318236f022 [doi] [DOI] [PMC free article] [PubMed] [Google Scholar]
- Majima T, Tsutsumi M, Nishino H, Tsunoda T, Konishi Y. Inhibitory effects of beta-carotene, palm carotene, and green tea polyphenols on pancreatic carcinogenesis initiated by N-nitorsobis(2-oxopropyl)amine in Syrian golden hamsters. Pancreas. 1998;16(1):13–18. doi: 10.1097/00006676-199801000-00003. [DOI] [PubMed] [Google Scholar]
- Papaconstantinou J, Colowick SP. The role of glycolysis in the growth of tumor cells. II. The effect of oxamic acid on the growth of HeLa cells in tissue culture. J Biol Chem. 1961;236:285–288. [PubMed] [Google Scholar]
- Qanungo S, Das M, Haldar S, Basu A. Epigallocatechin-3-gallate induces mitochondrial membrane depolarization and caspase-dependent apoptosis in pancreatic cancer cells. Carcinogenesis. 2005;26(5):958–967. doi: 10.1093/carcin/bgi040. doi:bgi040 [pii];10.1093/carcin/bgi040 [doi] [DOI] [PubMed] [Google Scholar]
- Ramos-Montoya A, Lee WN, Bassilian S, Lim S, Trebukhina RV, Kazhyna MV, Ciudad CJ, Noe V, Centelles JJ, Cascante M. Pentose phosphate cycle oxidative and nonoxidative balance: A new vulnerable target for overcoming drug resistance in cancer. Int J Cancer. 2006;119(12):2733–2741. doi: 10.1002/ijc.22227. doi:10.1002/ijc.22227 [doi] [DOI] [PubMed] [Google Scholar]
- Rong Y, Wu W, Ni X, Kuang T, Jin D, Wang D, Lou W. Lactate dehydrogenase A is overexpressed in pancreatic cancer and promotes the growth of pancreatic cancer cells. Tumour Biol. 2013;34(3):1523–1530. doi: 10.1007/s13277-013-0679-1. doi:10.1007/s13277-013-0679-1 [doi] [DOI] [PubMed] [Google Scholar]
- Sanchez-Tena S, Alcarraz-Vizan G, Marin S, Torres JL, Cascante M. Epicatechin gallate impairs colon cancer cell metabolic productivity. J Agric Food Chem. 2013;61(18):4310–4317. doi: 10.1021/jf3052785. doi:10.1021/jf3052785 [doi] [DOI] [PubMed] [Google Scholar]
- Semenza GL, Jiang BH, Leung SW, Passantino R, Concordet JP, Maire P, Giallongo A. Hypoxia response elements in the aldolase A, enolase 1, and lactate dehydrogenase A gene promoters contain essential binding sites for hypoxia-inducible factor 1. J Biol Chem. 1996;271(51):32529–32537. doi: 10.1074/jbc.271.51.32529. [DOI] [PubMed] [Google Scholar]
- Shankar S, Ganapathy S, Hingorani SR, Srivastava RK. EGCG inhibits growth, invasion, angiogenesis and metastasis of pancreatic cancer. Front Biosci. 2008;13:440–452. doi: 10.2741/2691. doi:2691 [pii] [DOI] [PubMed] [Google Scholar]
- Surh YJ. Cancer chemoprevention with dietary phytochemicals. Nat Rev Cancer. 2003;3(10):768–780. doi: 10.1038/nrc1189. [DOI] [PubMed] [Google Scholar]
- Takada M, Nakamura Y, Koizumi T, Toyama H, Kamigaki T, Suzuki Y, Takeyama Y, Kuroda Y. Suppression of human pancreatic carcinoma cell growth and invasion by epigallocatechin-3-gallate. Pancreas. 2002;25(1):45–48. doi: 10.1097/00006676-200207000-00012. doi:00006676-200207000-00012 [pii] [DOI] [PubMed] [Google Scholar]
- Thornburg JM, Nelson KK, Clem BF, Lane AN, Arumugam S, Simmons A, Eaton JW, Telang S, Chesney J. Targeting aspartate aminotransferase in breast cancer. Breast Cancer Res. 2008;10(5):R84. doi: 10.1186/bcr2154. doi:bcr2154 [pii];10.1186/bcr2154 [doi] [DOI] [PMC free article] [PubMed] [Google Scholar]
- Wahjudi PN, Patterson ME, Lim S, Yee JK, Mao CS, Lee WN. Measurement of glucose and fructose in clinical samples using gas chromatography/mass spectrometry. Clin Biochem. 2010;43(1-2):198–207. doi: 10.1016/j.clinbiochem.2009.08.028. doi:S0009-9120(09)00374-9 [pii];10.1016/j.clinbiochem.2009.08.028 [doi] [DOI] [PMC free article] [PubMed] [Google Scholar]
- Wang J, Zhang X, Ma D, Lee WN, Xiao J, Zhao Y, Go VL, Wang Q, Yen Y, Recker R, Xiao GG. Inhibition of transketolase by oxythiamine altered dynamics of protein signals in pancreatic cancer cells. Exp Hematol Oncol. 2013;2(1):18. doi: 10.1186/2162-3619-2-18. doi:2162-3619-2-18 [pii];10.1186/2162-3619-2-18 [doi] [DOI] [PMC free article] [PubMed] [Google Scholar]
- Yang CS, Wang X, Lu G, Picinich SC. Cancer prevention by tea: animal studies, molecular mechanisms and human relevance. Nat Rev Cancer. 2009;9(6):429–439. doi: 10.1038/nrc2641. doi:10.1038/nrc2641 [doi] [DOI] [PMC free article] [PubMed] [Google Scholar]
- Yasui K, Tanabe H, Miyoshi N, Suzuki T, Goto S, Taguchi K, Ishigami Y, Paeng N, Fukutomi R, Imai S, Isemura M. Effects of (-)-epigallocatechin-3-O-gallate on expression of gluconeogenesis-related genes in the mouse duodenum. Biomed Res. 2011;32(5):313–320. doi: 10.2220/biomedres.32.313. doi:JST.JSTAGE/biomedres/32.313 [pii] [DOI] [PubMed] [Google Scholar]
- Zhang H, Cao R, Lee WN, Deng C, Zhao Y, Lappe J, Recker R, Yen Y, Wang Q, Tsai MY, Go VL, Xiao GG. Inhibition of protein phosphorylation in MIA pancreatic cancer cells: confluence of metabolic and signaling pathways. J Proteome Res. 2010;9(2):980–989. doi: 10.1021/pr9008805. doi:10.1021/pr9008805 [doi] [DOI] [PMC free article] [PubMed] [Google Scholar]
- Zhang L, Pang E, Loo RR, Rao J, Go VL, Loo JA, Lu QY. Concomitant inhibition of HSP90, its mitochondrial localized homologue TRAP1 and HSP27 by green tea in pancreatic cancer HPAF-II cells. Proteomics. 2011;11(24):4638–4647. doi: 10.1002/pmic.201100242. doi:10.1002/pmic.201100242 [doi] [DOI] [PMC free article] [PubMed] [Google Scholar]


