

Abstract
Background
It is widely believed that females have longer telomeres than males, although results from studies have been contradictory.
Methods
We carried out a systematic review and meta-analyses to test the hypothesis that in humans, females have longer telomeres than males and that this association becomes stronger with increasing age. Searches were conducted in EMBASE and MEDLINE (by November 2009) and additional datasets were obtained from study investigators. Eligible observational studies measured telomeres for both females and males of any age, had a minimum sample size of 100 and included participants not part of a diseased group. We calculated summary estimates using random-effects meta-analyses. Heterogeneity between studies was investigated using sub-group analysis and meta-regression.
Results
Meta-analyses from 36 cohorts (36,230 participants) showed that on average females had longer telomeres than males (standardised difference in telomere length between females and males 0.090, 95% CI 0.015, 0.166; age-adjusted). There was little evidence that these associations varied by age group (p = 1.00) or cell type (p = 0.29). However, the size of this difference did vary by measurement methods, with only Southern blot but neither real-time PCR nor Flow-FISH showing a significant difference. This difference was not associated with random measurement error.
Conclusions
Telomere length is longer in females than males, although this difference was not universally found in studies that did not use Southern blot methods. Further research on explanations for the methodological differences is required.
Keywords: Gender, Telomere length, Systematic review and meta-analysis, Measurement methods, Epidemiology
1. Introduction
Telomeres are nucleoprotein complexes at chromosome ends, where the DNA component is a repetitive stretch of (TTAGGG), which caps and protects the end of the chromosome. Some studies have found that shorter telomeres are associated with obesity (Nordfjall et al., 2008a), gender (Bekaert et al., 2007), lower socioeconomic position (Cherkas et al., 2008), smoking (Valdes et al., 2005) and mortality (Cawthon et al., 2003). Hence telomere length has been proposed as a useful index of biological age (Hunt et al., 2008), although this has been called into question (von Zglinicki, 2012). The present study focuses on the association with gender.
In the literature there are inconsistencies in the association between gender and telomere length. Some studies (Nawrot et al., 2004; Bekaert et al., 2007; Fitzpatrick et al., 2007) have found white blood cell telomeres to be longer in women than men. Several hypotheses have been postulated to explain this association (Nawrot et al., 2004; Mayer et al., 2006; Barrett and Richardson, 2011). One is the action of oestrogen (Mayer et al., 2006). An oestrogen-responsive element is present in telomerase reverse transcriptase (hTERT) (Nawrot et al., 2004), hence oestrogen might stimulate telomerase to add telomere repeats to the ends of chromosomes. Furthermore, telomeres are particularly sensitive to oxidative stress (von Zglinicki, 2002) and women produce fewer reactive oxygen species than men (Nawrot et al., 2004). It has been suggested that women might also metabolise reactive oxygen species better because of oestrogen (Nawrot et al., 2004), due to its antioxidant properties (Carrero et al., 2008). However, other studies have found that it is not always the case that telomere length is longer in females than males (Hunt et al., 2008; Shiels et al., 2011) or even the reverse (Adams et al., 2007). At birth, one study found that there was little difference in telomere length between the sexes (Okuda et al., 2002), but another study found that female newborns had longer telomeres than males (Aubert et al., 2012). In another study, (Hunt et al., 2008) no difference was detected in the telomere length of women and men in the younger Bogalusa Heart Study cohort (19–37 years), but in the older Family Heart Study cohort (30–93 years) telomeres were longer in women than men. Hence the association between gender and telomere length might vary by age. Whilst telomere length is inversely related to chronological age in humans (Shiels et al., 2011), there are concerns about how robust telomere length is as a biomarker of ageing (Shiels, 2010; Shiels et al., 2011).
Existing studies of the association of gender and telomere length in humans have a number of limitations. For example, some of the studies are small e.g. (Benetos et al., 2001) and hence may not have sufficient power to detect gender differences in telomere length. Furthermore, there are methodological differences between assay methods (Aviv et al., 2006), with Southern Blot providing a mean terminal restriction length for DNA fragments containing the telomeric DNA stretch plus sub-telomeric regions of variable length and sequence composition and real-time PCR measuring actual telomere-repeat length relative to a reference gene (Aviv et al., 2006). The most frequent cell types used in studies on telomere length are either whole blood (leukocytes made up of lymphocytes, monocytes and granulocytes) or peripheral blood mononuclear cells (PBMCs made up of lymphocytes and monocytes). In adults, lymphocytes have shorter telomeres than granulocytes (Aviv et al., 2006), hence it is important to assess whether the association between gender and telomere length varies by cell type. A literature search and qualitative meta-analysis (Barrett and Richardson, 2011) found that at a qualitative level, males tended to have shorter telomeres than females. However, no systematic review of the literature has been done to examine the association between gender and telomere length.
We carried out a systematic review and meta-analyses to test the hypothesis that in human populations females have longer telomeres than males and that this association becomes stronger with increasing age. Furthermore, we also investigated whether the association between gender and telomere length varied by method of measurement of telomere length or cell type. Our study has several advantages over the earlier review: (a) our study is a systematic review and meta-analysis; (b) has standardised effect estimates; (c) has more rigorous methodology including exploration of sources of heterogeneity. We hypothesised that there would be an association between gender and telomere length, with females having longer telomeres than males and that this association would become stronger with increasing age.
2. Methods
We undertook a systematic review of the published literature following the meta-analysis of observational studies in epidemiology (MOOSE) guidelines (Stroup et al., 2000) and the PRISMA statement (Moher et al., 2009) and we include a completed PRISMA checklist (Supplementary Data 1). Full review protocol is available in Supplementary Data 2.
2.1. Selection criteria
Eligible observational studies had a minimum number of 100 participants and measures of telomere length for both males and females. Participants were those of any age (from newborns through to oldest old) who were community dwelling at time of measurement of telomere length and who were not part of a diseased group (including healthy controls from case-control studies). Hence we excluded cancer tissue studies with measurements of telomere length and those control participants who were recruited from hospital in-patients.
2.2. Literature search and data extraction
Searches of the electronic databases MEDLINE and EMBASE (up to November 2009) were performed using text word search terms and explosion MeSH terms (Supplementary Data 2) by MG. Searches were restricted to studies of humans. Fig. 1 shows the identification of published studies. Combining the results of the MEDLINE and EMBASE electronic searches and removing duplicate records left abstracts of 6822 unique records to be screened by three authors (DB, MG and LW). Each of the three authors (DB, MG and LW) were responsible for screening one-third of the titles and abstracts of these 6822 papers and any considered to be ‘uncertain’ were independently screened by a second author. Sixty-one research papers were retrieved for full data extraction using a standardised data extraction form. Two authors (from DB, MG and LW) independently extracted the information and data of relevance from each of the 61 papers and any differences between the two sets of information extracted were resolved through discussion. The standardised data extraction included methods of measurement of telomere length, cell type, details of measurement error, details of sample recruitment, descriptive characteristics and unadjusted, age-adjusted and fully-adjusted measurements of differences in telomere length between females and males.
Fig. 1.
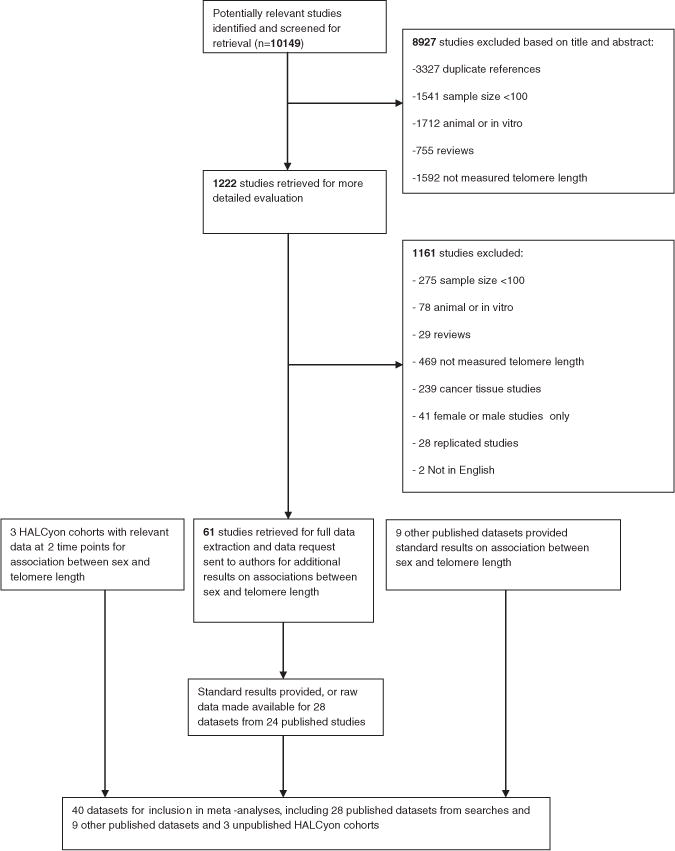
Flow diagram for identification of published studies and for showing contact with authors for published and unpublished studies for inclusion in review.
2.2.1. Data requested from eligible studies
We contacted the corresponding authors of the 61 eligible published research papers and asked them to complete standardised results tables or provide the data for us to analyse (Supplementary Data 3). We requested the regression coefficient representing the age-adjusted difference in telomere length between females and males, along with corresponding standard error. We asked that the study authors calculate regression coefficients using linear regression with raw telomere length as the outcome variable. We also requested that the study authors provide the mean age and telomere length (plus standard deviations) of males, females and total sample. After sending out one reminder, we received responses from 24 of the published research papers (28 datasets) (Fig. 1). Authors of 17 research papers provided standard sets of results and authors of another 7 research papers provided datasets for us to analyse.
2.3. Inclusion of other studies
2.3.1. HALCyon cohort studies
We included unpublished data from three of the nine UK cohort studies involved in the HALCyon collaboration. These were the Hertfordshire Ageing Study (HAS) (Syddall et al., 2010), the Lothian Birth Cohort 1921 (LBC1921) (Deary et al., 2004) and the MRC National Survey of Health and Development (NSHD) (Kuh et al., 2011). These studies had telomere length data available at two time points up to 10 years apart.
2.3.2. Other relevant studies
We contacted the corresponding author of an additional study identified through the literature search (Yamaguchi et al., 2005) which included at the time unpublished reference group telomere length data. The corresponding author subsequently provided us with the published reference group telomere length data (Aubert et al., 2012) for both granulocytes and lymphocytes. Furthermore, following e-mail contact with the corresponding authors of the 61 eligible published research papers, the corresponding authors of two unpublished studies: HyperGEN (Mangino et al., 2012) and the PREVEND Study (Huzen et al., 2011) contributed datasets (two from the HyperGEN study). An additional study (Newcastle 85+ study (Martin-Ruiz et al., 2011)) was identified through the HALCyon collaboration (www.halcyon.ac.uk) and a further study (The West of Scotland Twenty-07 Study (Der et al., 2012)) was identified through the FALCon collaboration (www.nshd.mrc.ac.uk/collaborations/falcon.aspx). The West of Scotland Twenty-07 Study contributed three datasets. Corresponding authors of the HyperGEN (Mangino et al., 2012), PREVEND (Huzen et al., 2011), Newcastle 85+ (Martin-Ruiz et al., 2011) and The West of Scotland Twenty-07 (Der et al., 2012) studies provided us with standard sets of results and each of these studies are now published. Hence these other relevant studies contributed an additional nine datasets from five separate studies.
So in total there are 40 datasets (28 datasets from published searches; 9 datasets from other relevant studies and 3 unpublished Halcyon cohort studies) from 32 separate studies.
2.4. Telomere length measures
Telomere length was measured by terminal restriction fragment (TRF) Southern Blot, real-time PCR or Flow-FISH (Aviv et al., 2006) in the eligible studies. Flow-FISH is a cytogenetic technique requiring intact cells to quantify the length of telomeres (Aviv et al., 2006). Cell types were whole blood, peripheral blood mononuclear cells (PBMC), lymphocytes or granulocytes (Aviv et al., 2006). Whole blood (leukocytes) cells were made up of lymphocytes, monocytes and granulocytes. These were prepared by red cell lysis and/or centrifugation of whole blood without Ficoll (buffy coat). PBMC (lymphocytes and sometimes variable fraction of monocytes) were prepared by whole blood centrifugation through a Ficoll cushion or gradient. Lymphocytes or granulocytes were used when specific cell fractions were isolated during the Flow-FISH method.
2.5. Statistical methods
We performed a two stage meta-analysis. Firstly equivalent models were run within each cohort. This involved using linear regression models to analyse the association between gender and telomere length adjusted for age. We made males the baseline group so that the regression coefficient represented the difference in telomere length for females compared to males. Some studies measured absolute telomere length in kb and others measured Telomere-to-Single Copy Gene (T/S) ratio (Real-time PCR). Furthermore, those laboratories using Real-time PCR methodology might use different reference samples (Horn et al., 2010) and also might change their reference sample when it runs out. To overcome such differences we standardised the regression coefficients (and corresponding standard error) by dividing both regression coefficient and standard error by the standard deviation of telomere length.
Secondly, the cohort specific standardised regression coefficients and standard errors were pooled using random effects meta-analyses (DerSimonian and Laird, 1986). We ran meta-analyses on results from models with age-adjusted as a continuous term and then from models with age-adjusted in quartiles. We included data from 36 datasets (published and unpublished studies) in our meta-analyses and included the remaining four datasets in sensitivity analyses. This was because two studies (Aubert et al., 2012; Halaschek-Wiener et al., 2008) had data on both granulocytes and lymphocytes and two studies (Nordfjall et al., 2008a,b) included the MONICA cohort study which was part of the more recent NSHDS cohort study which also included the VIP and MSP cohort studies (Nordfjall et al., 2009). Hence we wanted to make sure that the same sample was not included more than once within a meta-analysis. Furthermore, the 3 HALCyon studies and another study (Nordfjall et al., 2009) had repeat telomere length measures (time 1 and time 2). We thus ran meta-analyses first including these studies at time 1 and then including these four studies at time 2. We investigated between study heterogeneity using I2 and Q statistics (Higgins and Thompson, 2002; Higgins et al., 2003). We examined potential sources of heterogeneity for age group (above versus below the median age), method of measurement of telomere length and cell type by stratifying random effects meta-analyses by each of these factors and by running meta-regression analyses (Thompson and Sharp, 1999). For meta-regression analyses, we used post-estimation Wald tests to obtain F ratios and p values. To address non-linearity and variation with age we undertook a meta-regression of effect size on mean age and tested a quadratic or cubic relationship. We used funnel plots to assess publication bias and tested the symmetry of the funnel plots using Egger’s test (Egger et al., 1997).
We undertook a series of sensitivity analyses: (1) for the studies where we had access to the dataset, we repeated the test of association between gender and telomere length using transformed telomere length data (loge) and compared this to the results from meta-analysis using raw data for telomere length, to address the issue of positive skewness in telomere length measurements; (2) we excluded those studies where there was no detail of how the healthy participants were sampled and repeated the meta-analyses; (3) we repeated analyses using lymphocyte data rather than granulocyte data for two studies (Aubert et al., 2012; Halaschek-Wiener et al., 2008); (4) we replaced results from (Nordfjall et al., 2009) with data from either (Nordfjall et al., 2008a) or (Nordfjall et al., 2008b) to avoid using the same study population in meta-analyses more than once and repeated the analyses; (5) we repeated meta-analyses including only those studies who reported intra-assay or inter-assay coefficient of variation (CV); (6) we repeated meta-analyses having excluded those studies which had telomere length measured by any laboratory which appeared to have outlier values.
2.6. Methodological checks
As the data from the Newcastle group contributed to the apparent heterogeneity, a series of post hoc methodological checks was performed by this group.
3. Results
Forty datasets contributed results to this review. Table 1 presents the characteristics of these studies. Three studies (Hunt et al., 2008; Chen et al., 2009; Kaplan et al., 2009) each had telomere length data stratified for black and white participants and these data are presented separately. Mean age ranged from 36.6 ± 0.4SD years in The West of Scotland Twenty-07 Study to 89.9 ± 3.2SD years in the Leiden 85+ Study. The method of measurement of telomere length was TRF Southern Blot in 17 datasets, Real-time PCR in 19 datasets and Flow-FISH in four datasets. Telomere lengths were measured in whole blood (27 datasets), PBMC (8 datasets), granulocytes (2 datasets) and lymphocytes (3 datasets).
Table 1.
Characteristics of studies included in the reviewa.
| Reference and study name or recruitment method | Number of participants males females | Age males females | Telomere length males female | Method to measure telomere length | Cell type |
|---|---|---|---|---|---|
| Published studies from searches | |||||
| Adams et al. (2007) | 108 | 50 (−) | 5.55 kb (1.25) | Real-time PCR | PBMC |
| NewcastleThousand Families Study, UK | 172 | 50 (−) | 4.69 kb (1.02) | ||
| Aubert et al. (2012) | 405 | 43.6 (29.9) | 7.97 kb (1.59) | Flow-FISH | Granulocytes |
| Healthy controls No details of how recruited, Canada | 403 | 43.6 (30.0) | 8.09 kb (1.52) | ||
| Aubert et al. (2012) | 421 | 43.6 (29.9) | 6.95 kb (2.07) | Flow-FISH | Lymphocytes |
| Healthy controls No details of how recruited, Canada | 414 | 43.6 (30.0) | 7.26 kb (2.04) | ||
| Bekaert et al. (2007) | 1218 | 46.1 (5.9) | 7.79 kb (0.71) | TRF Southern Blot | Whole blood |
| Asklepios study cohort, Belgium | 1291 | 45.9 (6.0) | 7.96 kb (0.73) | ||
| Bischoff et al. (2006) | 260 | 80.5 (7.4) | 7.54 kb (1.15) | TRF Southern Blot | Whole blood |
| The Danish 1905 Cohort Study Longitudinal Study of Aging Danish Twins The Longitudinal Danish Centenarian Study | 552 | 81.8 (7.8) | 7.73 kb (1.25) | ||
| Cawthon et al. (2003) | 72 | 73.8 (8.0) | 1.04 T/S (0.15) | Real-time PCR | Whole blood |
| Utah residents who gave blood, USA | 71 | 71.8 (6.8) | 1.09 T/S (0.16) | ||
| Chen et al. (2009) (Blacks) | 62 | 39.0 (4.1) | 7.55 kb (0.70) | TRF Southern Blot | Whole Blood |
| Bogalusa Heart Study, USA | 128 | 37.0 (5.3) | 7.60 kb (0.81) | ||
| Chen et al. (2009) (Whites) | 208 | 38.5 (4.5) | 7.05 kb (0.70) | TRF Southern Blot | Whole blood |
| Bogalusa Heart Study, USA | 264 | 37.5 (4.8) | 7.11 kb (0.74) | TRF Southern Blot | Whole blood |
| Cherkas et al. (2008) | 247 | 48.1 (13.9) | 6.61 kb (0.67) | ||
| (Data used from larger Mangino et al., 2009 publication) UK Adult Twin Registry, UK | 3009 | 48.7 (13.0) | 7.01 kb (0.68) | ||
| Cronkhite et al. (2008) | 99 | 55.7 (16.0) | 5.83 kb (0.66) | TRF Southern Blot | Whole blood |
| No details of how recruited, USA | 102 | 55.8 (15.8) | 5.97 kb (0.48) | ||
| Diez Roux et al. (2009) | 467 | 65.4 (9.6) | 0.82 T/S (0.17) | Real-time PCR | Whole blood |
| Multi-ethnic study of Atherosclerosis, USA | 514 | 65.1 (9.9) | 0.87 T/S(0.18) | ||
| Halaschek-Wiener et al. (2008) | 69 | 78.1 (19.1) | 6.49 kb (0.96) | Flow-FISH | Granulocytes |
| Population based lists, Canada | 131 | 78.4 (18.0) | 6.61 kb (0.83) | ||
| Halaschek-Wiener et al. (2008) | 69 | 78.1 (19.1) | 4.95 kb (1.20) | Flow-FISH | Lymphocytes |
| Population based lists, Canada | 131 | 78.4 (18.0) | 5.26 kb (1.34) | ||
| Hunt et al. (2008) blacks | 216 | 52.3 (10.7) | 6.95 kb (0.64) | TRF Southern Blot | Whole blood |
| Family Heart Study, USA | 409 | 53.8 (11.0) | 7.16 kb (0.63) | ||
| Hunt et al. (2008) whites | 1170 | 56.6 (13.4) | 6.70 kb (0.65) | TRF Southern Blot | Whole blood |
| Family Heart Study, USA | 1433 | 57.4 (13.1) | 6.86 kb (0.67) | ||
| Jang et al. (2008) | 334 | 59.2 (6.2) | 2.22 T/S (1.05) | Real-time PCR | Lymphocytes |
| Primary Care/GP register, Korea | 152 | 58.7 (7.2) | 2.03 T/S (1.20) | ||
| Kaplan et al. (2009) blacks | 74 | 73.0 (5.6) | 6.31 kb (0.69) | TRF Southern Blot | Whole blood |
| Cardiovascular Health Study, USA | 140 | 72.3 (5.0) | 6.62 kb (0.66) | ||
| Kaplan et al. (2009) whites | 613 | 75.6 (5.5) | 6.19 kb (0.56) | TRF Southern Blot | Whole blood |
| Cardiovascular Health Study, USA | 842 | 74.9 (4.9) | 6.38 kb (0.62) | ||
| Kimura et al. (2007) | 56 | 55.7 (25.5) | 6.02 kb (0.99) | TRF Southern Blot | Whole blood |
| Individuals Campania region, Italy | 106 | 76.7 (25.9) | 5.57 kb (1.03) | ||
| Maeda et al. (2009) | 89 | 44.6 (10.2) | 8.77 kb (1.78) | TRF Southern Blot | PBMC |
| No details of how recruited, Japan | 58 | 43.8 (11.0) | 9.54 kb (1.96) | ||
| Martin-Ruiz et al. (2005) | 184 | 89.9 (3.2) | 4.44 kb (0.92) | Real-time PCR | PBMC |
| The Leiden 85-plus study, The Netherlands | 495 | 89.8 (2.9) | 4.26 kb (0.90) | ||
| Nawrot et al. (2004) | 119 | 42.9 (15.7) | 6.78 kb (0.70) | TRF Southern Blot | Whole blood |
| Family Based Cohort, Belgium of the Flemish Study on Environment, Genes and Health Outcomes | 152 | 41.7 (17.3) | 6.94 kb (0.67) | ||
| Nordfjall et al. (2005) | 65 | 57.9 (15.3) | 0.70 T/S (0.29) | Real-time PCR | PBMC |
| No details of how recruited, Sweden Healthy individuals in 49 unrelated families | 69 | 53.4 (15.0) | 0.75 T/S (0.26) | ||
| Nordfjall et al. (2009) | |||||
| NSHDS cohort study, Sweden | |||||
| Time 1 | 722 568 |
47.1 (5.6) 44.4 (7.0) |
0.70 T/S (0.21) 0.69 T/S (0.23) |
Real-time PCR | PBMC |
| Time 2 | 361 284 |
57.1 (5.6) 54.4 (6.9) |
0.59 T/S (0.16) 0.64 T/S (0.20) |
Real-time PCR | PBMC |
| Nordfjall et al. (2008a) | 197 | 47.1 (14.5) | 0.62 T/S (0.14) | Real-time PCR | PBMC |
| MONICA cohort study, Sweden | 335 | 43.8 (13.0) | 0.70 T/S (0.19) | ||
| Nordfjall et al. (2008b) | 514 | 55.3 (11.7) | 0.63 T/S (0.19) | Real-time PCR | PBMC |
| MDCC/Monica cohorts, Sweden | 475 | 49.3 (13.6) | 0.69 T/S (0.19) | ||
| Ren et al. (2009) | 53 | 44.7 (27.6) | 11.7 kb (1.4) | TRF Southern Blot | Whole blood |
| Healthy individuals with ancestors living in region for ≥3 generations, Tibet | 52 | 37.2 (24.7) | 11.7 kb (1.4) | ||
| Unryn et al. (2005) | 51 | 54.2 (14.5) | 7.02 kb (0.80) | TRF Southern Blot | PBMC |
| Random digit telephone dialling, Canada | 74 | 58.4 (12.0) | 7.09 kb (0.57) | ||
| Van der Harst et al. (2007) | 145 38 |
66.1 (8.5) 66.7 (10.3) |
1.09 T/S 0.32 1.14 T/S 0.41 |
Real-time PCR | Whole blood |
| University Genetic Database Healthy non-blood related relatives of patients with Crohn’s disease, Netherlands | |||||
| Woo et al. (2008) | 976 | 72.8 (5.0) | 8.81 kb (1.62) | Real-time PCR | Whole Blood |
| Health Survey recruited from community centres for elderly and housing estates, China | 1030 | 72.0 (5.2) | 9.35 kb (2.26) | ||
| Additional datasets | |||||
| HALCyon cohorts | |||||
| The Hertfordshire Ageing Study (Syddall et al., 2010), UK | |||||
| Wave 1 | 388 269 |
67.5 (2.4) 67.5 (2.2) |
5.32 kb (1.54) 5.10 kb (1.69) |
Real-time PCR | PBMC |
| Wave 2 | 165 112 |
76.7 (2.4) 76.3 (2.1) |
3.86 kb (1.20) 4.00 kb (1.55) |
Real-time PCR | PBMC |
| Lothian birth cohort 1921 (Deary et al., 2004) | |||||
| Wave 1 | 210 287 |
79.1 (0.6) 79.1 (0.6) |
4.23 kb (0.44) 3.98 kb (0.36) |
Real-time PCR | PBMC |
| Wave 3 | 72 74 |
86.6 (0.4) 86.6 (0.4) |
4.43 kb (0.43) 4.00 kb (0.60) |
Real-time PCR | PBMC |
| (Harris et al., 2006 published but used larger Lothian Birth Cohort 1921 dataset) | |||||
| NSHD birth cohort 1946 (Kuh et al., 2011) | |||||
| Age 53 | 1324 1336 |
53.5 (0.2) 53.5 (0.2) |
5.87 kb (1.94) 5.42 kb (1.89) |
Real-time PCR | PBMC |
| Age 60–64 | 501 557 |
63.3 (1.2) 63.4 (1.1) |
4.19 kb (1.28) 4.37 kb (1.33) |
Real-time PCR | PBMC |
| Der et al. (2012) | |||||
| The West of Scotland, UK Twenty-07 study | |||||
| 1970s cohort | 362 412 |
36.6 (0.4) 36.6 (0.4) |
0.85 T/S (0.22) 0.87 T/S (0.20) |
Real-time PCR | Whole Blood |
| 1950s cohort | 379 469 |
56.9 (0.9) 56.9 (0.7) |
0.77 T/S (0.18) 0.79 T/S (0.19) |
Real-time PCR | Whole Blood |
| 1930s cohort | 235 309 |
75.9 (0.6) 76.0 (0.6) |
0.68 T/S (0.19) 0.71 T/S (0.18) |
Real-time PCR | Whole Blood |
| Huzen et al (2011) | 4027 | 50.4 (12.9) | 1.05 T/S (0.33) | Real-time PCR | Whole Blood |
| The PREVEND Study, Netherlands | 4027 | 48.1 (12.3) | 1.08 T/S (0.34) | ||
| Mangino et al. (2012) blacks | 108 | 52.2 (8.8) | 7.05 kb (0.78) | TRF Southern Blot | Whole Blood |
| HyperGEN, USA | 116 | 54.5 (9.1) | 7.07 kb (0.64) | ||
| Mangino et al. (2012) whites | 612 | 51.9 (14.2) | 6.68 kb (0.60) | TRF Southern Blot | Whole Blood |
| HyperGEN, USA | 628 | 53.4 (13.1) | 6.80 kb (0.61) | ||
| Martin-Ruiz et al. (2011) | 295 | 85.5 (0.5) | 3.32 kb (1.14) | Real-time PCR | PBMC |
| Newcastle 85+ study, UK | 456 | 85.5 (0.4) | 3.05 kb (1.06) |
Age and telomere lengths are presented as mean (standard deviation).
3.1. Meta-analyses
Overall summary estimates of effects for the associations between gender and telomere length are detailed in Table 2. Meta-analyses from the 36 cohorts (36,230 participants) showed that gender was associated with telomere length, with females having longer telomeres on average than males (standardised difference in telomere length between females and males 0.090, 95% CI 0.015, 0.166, p = 0.02; age-adjusted; Fig. 2). These results included the 3 HALCyon studies and Nordfjall et al., 2009 at time 1. When these analyses were repeated but including these 4 studies at time 2 rather than time 1 (where the difference in mean ages between times 1 and 2 ranged from 7.5 years to 10 years), the associations between gender and telomere length were present, again showing that females had longer telomeres than males (p < 0.001).
Table 2.
Overall summary estimates of effect for the associations between gender and telomere length from stratified random effects meta-analyses.
| Stratification | Noa | ESb females–males | 95% CI | (Age-adjusted) p-value | I2 | p-valuec |
|---|---|---|---|---|---|---|
| None | 36 | 0.090 | 0.015, 0.166 | 0.02 | 91.4% | <0.001 |
| Mean aged (years) | ||||||
| ≤55.8 | 18 | 0.091 | −0.018, 0.200 | 0.10 | 92.4% | <0.001 |
| >55.8 | 18 | 0.090 | −0.021, 0.210 | 0.11 | 90.2% | <0.001 |
| F ratio | p-value | |||||
| Overalle | 0.00 | 1.00 | ||||
| Measurement method | ||||||
| Real-time PCR | 17 | −0.047 | −0.167, 0.072 | 0.44 | 93.2% | <0.001 |
| TRF Southern Blot | 17 | 0.240 | 0.173, 0.307 | <0.001 | 68.8% | <0.001 |
| Flow-FISH | 2 | 0.077 | −0.016, 0.171 | 0.11 | 0.0% | 0.65 |
| F ratio | p-value | |||||
| Overalle | 5.72 | 0.007 | ||||
| Cell Typef | ||||||
| Whole Blood | 27 | 0.132 | 0.050, 0.215 | 0.002 | 91.9% | <0.001 |
| PBMC | 6 | −0.070 | −0.354, 0.215 | 0.63 | 87.9% | <0.001 |
| Lymphocytes | 1 | −0.194 | −0.461, 0.072 | 0.15 | – | – |
| Granulocytes | 2 | 0.077 | −0.016, 0.171 | 0.11 | 0.0% | 0.65 |
| F ratio | p-value | |||||
| Overalle | 1.31 | 0.29 |
Number of studies.
Standardised regression coefficient (standardising for telomere length) representing the age-adjusted difference in telomere length between females and males. Here males are the baseline group so that the coefficient represents the difference in telomere length for females and males. Hence if females have longer telomeres this would be positive.
p-value is obtained from the heterogeneity χ2.
Stratified by the mean age above and below the median age.
Overall test for heterogeneity between subgroups by undertaking meta-regression and giving F ratio and p-values.
Cell types are whole blood (leukocytes: lymphocytes, monocytes and granulocytes) and Peripheral Blood Mononucleocytes (PBMC: enriched for lymphocytes), lymphocytes or granulocytes. Random effects meta-analyses were used throughout.
Fig. 2.

Meta-analysis for the association between gender and telomere length adjusted for continuous age.
3.2. Heterogeneity
There was evidence of substantial heterogeneity between studies (I2 = 91.4%, 95% CI 89.0, 93.2, p < 0.001) (Table 2). There was little evidence that the association between gender and telomere length varied by age group (F ratio = 0.00, p = 1.00; Table 2; Fig. 3) but did vary by the method of telomere length measurement (F ratio = 5.72, p = 0.007; Table 2; Fig. 4). There was moderate heterogeneity between studies using the TRF Southern Blot method (I2 = 68.8%, 95% CI 48.5, 81.1, p < 0.001) and high heterogeneity between studies using the Real-time PCR method (I2 = 93.2%, 95% CI 90.6, 95.1, p < 0.001) and the summary estimates of effect showed longer telomeres in females than males only for the TRF Southern Blot method. There was little evidence that the associations between gender and telomere length varied by cell type (F ratio = 1.31, p = 0.29; Table 2; Fig. 5). The results in Table 2 include the 3 HALCyon studies and Nordfjall et al., 2009 at phase 1. When these analyses were repeated but including these 4 studies at phase 2, there was again little evidence that the associations varied by age group (F ratio = 0.06, p = 0.80) or by cell type (F ratio = 0.99, p = 0.41) but there was still evidence (albeit weaker) that the association between gender and telomere length varied by method to measure telomere length (F ratio = 3.10, p = 0.06). There was little evidence that the association between telomere length and gender had a nonlinear variation with age (data not shown). For comparison purposes for the TRF Southern Blot method, the overall summary estimates of the absolute difference in telomere length between females and males was 176 bp (95% CI 131, 221, p < 0.001; age-adjusted).
Fig. 3.

Stratified meta-analyses above and below median age for the association between gender and telomere length adjusted for continuous age.
Fig. 4.

Stratified meta-analyses by method of measurement of telomere length for the association between gender and telomere length adjusted for continuous age.
Fig. 5.

Stratified meta-analyses by cell type for the association between gender and telomere length adjusted for continuous age.
3.3. Publication bias
The funnel plots (data not shown) and Egger test (bias = −1.52, p = 0.15) did not show strong evidence for small study bias.
3.4. Sensitivity analyses
We found no evidence that the association between gender and telomere length differed whether we used raw data for telomere length, or whether it was transformed (loge) (data not shown). Excluding studies where there were no details of how the healthy participants were sampled had little effect on the findings. The Egger test using these studies, showed that there was again no strong evidence for small study bias (bias = −1.76, p = 0.18; including phase 1 data). Repeating the analyses including lymphocyte data rather than granulocyte data for the two studies with both data made little difference to the associations (data not shown). Replacing (Nordfjall et al., 2009) study with data from either (Nordfjall et al., 2008a) or (Nordfjall et al., 2008b) again had little effect on the associations. Eight out of 22 studies reported values for intra-assay CV and 4 out of 22 studies reported values for inter-assay CV. Repeating the analyses but including only those 10 studies who reported intra-assay or inter-assay CV in their studies, showed that gender was strongly associated with telomere length, with females having longer telomeres than males.
4. Discussion
4.1. Explanation of findings
The results of these meta-analyses showed that gender was associated with telomere length, with females having longer telomeres on average than males, even though significant heterogeneity between studies was detected. There was little evidence that the strength of the associations varied by age group or by cell type. However, the association between gender and telomere length did vary by measurement methods. The summary estimates of effect showed longer telomeres in females than males only for the TRF Southern Blot method, but not for the Real-time PCR nor the Flow-FISH method. However, there was significant heterogeneity between studies, particularly for the Real-time PCR method (I2 = 93.2%) but also for TRF Southern Blot (I2 = 68.8%) methodologies. Moreover, heterogeneity was also confirmed by more recent large Real-time PCR studies which did (Weischer et al., 2012) or did not (Needham et al., 2013) identify shorter telomeres in males than females.
These results suggest two alternative conclusions: (i) women have longer telomeres than men, and the failure of the PCR and Flow-FISH methods to detect this difference reproducibly is related to higher experimental variability of these techniques, or (ii) there is no consistent gender difference in telomere length but a methodological bias specific to the Southern blot technique.
The overall outcome of the present systematic review argues in favour of the first conclusion. In addition, a number of biological plausible arguments for longer telomeres in women than in men have been made. These include the action of oestrogen which can stimulate the production of telomerase and might be protective against reactive oxygen species damage (Aviv, 2002) and the heterogametic sex hypothesis (Barrett and Richardson, 2011) stating that any deleterious recessive alleles on the X chromosome of the heterogametic sex (males in humans (XY)), will have no compensatory allele, unlike in females where the second chromosome might compensate (Austad, 2006). Hence, shorter telomeres in males might arise if the unguarded X chromosome in males contains inferior telomere maintenance alleles (Barrett and Richardson, 2011).
It has been suggested that longer telomere length in women than men might arise from a slower rate of telomere attrition in women (Okuda et al., 2002). In both cross-sectional (Bekaert et al., 2007) and longitudinal studies (Chen et al., 2011) the rate of leukocyte telomere length shortening was slower in women than men. However, the associations were not strong and hence need to be confirmed in larger studies (Chen et al., 2011). In the present study, there was little evidence that the strength of the association between gender and telomere length varied by age group (above versus below the median age of 55.6 years). It is not clear whether gender dependent differences in telomere length are already present at birth: One study found that there was little difference in telomere length measured by TRF Southern Blot between the sexes at birth (Okuda et al., 2002), while a recent study using Flow-FISH found that female newborns had longer telomeres than males (Aubert et al., 2012).
It has been suggested that longer telomeres might be a cause of improved fitness in women, manifest in longer lifespan and lower risk for cardiovascular disease and cancers (Aviv, 2002). However, the picture might be more complex: While short leukocyte telomere length has been associated with cardiovascular risk factors (Benetos et al., 2001; Bekaert et al., 2007; Fitzpatrick et al., 2007; Nordfjall et al., 2008b; Shiels et al., 2011) and cardiovascular disease (Brouilette et al., 2007; Fitzpatrick et al., 2007), it did not predict risk for enhanced cancer incidence in carefully controlled prospective studies (Weischer et al., 2013) and for some cancers including breast cancer, long rather than short telomeres were associated with increased risk (Pellatt et al., 2013). While males die at a higher rate at virtually every age (Austad, 2006), associations of telomere length with mortality have shown contradictory results (Cawthon et al., 2003; Bischoff et al., 2006; Fitzpatrick et al., 2011). Finally, females show higher incidence and prevalence of many age-related diseases (except cardiovascular disease and cancer) and disabilities (Collerton et al., 2009). Many of these including, for example, multiple-morbidity (Sanders et al., 2012), rheumatoid arthritis (Costenbader et al., 2011) or depression (Puterman et al., 2013) have been associated with short telomeres. Together, these data do not suggest a general association between gender-specific telomere length and fitness in domains other than cardiovascular disease.
A large part of the heterogeneity of the real-time PCR studies can be attributed to a single group. The von Zglinicki group repeatedly reported longer telomeres in men than in women (Deary et al., 2004; Martin-Ruiz et al., 2005, 2011; Adams et al., 2007; Syddall et al., 2010; Kuh et al., 2011). A post hoc analysis excluding these studies (Deary et al., 2004; Martin-Ruiz et al., 2005, 2011; Adams et al., 2007; Syddall et al., 2010; Kuh et al., 2011) now showed longer telomeres in females than males for the Real-time PCR method (standardised difference in telomere length between females and males 0.134, 95% CI 0.053, 0.215, p = 0.001). However, there was still evidence of moderate heterogeneity (e.g. Real-time PCR I2 = 72.9%). To address the possibility of methodological errors, a number of methodological checks were performed by the von Zglinicki group. Coding errors were ruled out by independent cross-checks. Inter-assay CV were measured repeatedly and always found to be below 6%. PCR efficiencies were estimated both from standard curves and as single-well efficiency. Plate-to-plate efficiency variation was below 1% for the reference gene PCR and below 2.7% for telomere PCR. The intra-plate single-well efficiency CV was always below 3%. Finally, telomere length of the Newcastle 85+ study participants (which showed longer telomeres in men than women PBMCs) was repeated using whole blood and a different reference gene with the same result. Interestingly, Southern blot telomere length studies in patient cohorts done by the von Zglinicki group showed a tendency towards longer telomeres in women in agreement with the Southern blot studies included in the present review (von Zglinicki et al., 2000; Martin-Ruiz et al., 2006). Thus, there is no obvious methodological explanation for the fact that the Newcastle group found longer telomeres in men in most of their analysed cohorts, using Real-time PCR methodology.
Smaller measurement error in the TRF Southern Blot method as compared to the Real-time PCR methodology might explain greater consistency of findings between studies using the Southern blot technique (Aviv et al., 2011). In a recent blinded study (Aviv et al., 2011), the inter-assay CV was much larger (6.45%) for the Real-time PCR method performed by the Blackburn group than that of the TRF Southern Blot method as performed by the Aviv group (1.74%). However, this difference is probably not representative for the field as a whole. In the literature, inter-assay CV has ranged from 2.3% to 28% for Real-time PCR methods and from 1.5% to 12% for TRF Southern Blot methods (Aviv et al., 2011). In the studies included here, where reported, coefficient of variation ranged from 1.7% to 11.1% for Real-time PCR and from 1.4% to 12% for TRF Southern Blot. In a fully blinded comparative telomere length assessment involving 10 different groups, many of which also contributed data to the present analysis, median inter-assay CVs were not significantly different between techniques (p = 0.86, in preparation). Excluding the data with the lowest reported CVs generated by the Aviv group had little impact on effect size (0.174, 95% CI 0.045, 0.303, p < 0.01) or heterogeneity (I2 = 59.6%, p < 0.03) for the Southern blot results, although the average of the reported CVs for the remaining groups using the Southern blot technique was now 7.4%. Therefore, differences between Southern blotting and the two other techniques cannot be due to technology-specific random measurement error.
However, our results do not rule out the possibility of technology-specific bias. Various types of polymorphisms will have technology-specific impact on telomere length if measured by Southern blot versus PCR or Flow-FISH. The most probable of these are polymorphisms affecting the most distal recognition sites for the endonucleases Hinf1 and RSA1 typically used in TRF Southern blotting. Subtelomeric regions exhibit high levels of sequence polymorphism and strong linkage disequilibrium, leading to the existence of relatively few common haplotypes (Baird et al., 1995, 2000). The most distal Hinf1/RSA1 recognition site at chromosome Xp/Yp, for instance, is polymorphic, resulting in an apparent increase in the length of this telomere if measured by Southern blotting in this haplotype (Baird et al., 1995). Interstitial telomere repeats are also highly polymorphic due to polymerase template slippage, which can cause either insertion or deletion of hexameric repeat units (Mondello et al., 2000). Both short (Ruiz-Herrera et al., 2008) and long interstitial telomeric repeats are frequent in the human genome, for instance an interstitial repeat at chromosome 22q11 displays length polymorphism ranging from 1 to 4 kb (Samassekou and Yan, 2011). Such interstitial sequences will either not contribute to the Southern blot signal at all (short interstitial sequences) or register as short telomere. In contrast, they will always increase the apparent average telomere length measured by PCR or Flow-FISH. In birds, the amount of interstitial telomeric sequence was substantial as compared to the actual telomeres and highly variable between species. Most importantly, it was also highly variable between individuals (Foote et al., 2013). It is not known whether frequencies of any of these polymorphisms might be gender-specific in humans. Finally, Hinf1/RSA1 are not fully methylation-insensitive, both may be blocked by overlapping CpG methylation. Telomeres tend to be transcriptionally silenced and hyper-methylated, however, this is a regulated process as evident in the human ICF syndrome, where hypomethylation due to lack of the DNA methyltransferase DNMT3b causes abnormally high levels of telomere repeat containing RNA (TERRA) and complete failure of telomere maintenance (Deng et al., 2010). Subtelomeric hypomethylation in endothelial cells was associated with apparent telomere lengthening as measured by Southern blot (Maeda et al., 2013). X inactivation in females might thus be expected to skew a subpopulation of telomeres towards apparently larger sizes if measured by Southern blot. Whether subtelomeric CpG sites on other chromosomes are differentially methylated between the sexes is not known but possible.
4.2. Strengths and limitations
This large scale systematic review and meta-analysis examining the association between gender and telomere length includes data from 40 datasets. We have followed a strict protocol, testing a priori hypotheses, have included several unpublished cohorts, have standardised regression coefficients and have undertaken a series of sensitivity analyses. We have thus aimed to minimise a range of biases including publication and selection bias. We requested that authors performed their analyses in a standard way, so limiting the heterogeneity caused by variation in analysis. Furthermore, possible sources of heterogeneity include the differences in the protocols for measuring telomere length, which might have biased the associations. We aimed to overcome such differences by standardising the regression coefficients and by running sensitivity analyses including raw telomere length data and transformed telomere length data (loge). We adjusted for age as a potential confounder. Other potential confounders include race, BMI and smoking status (Chen et al., 2011). Findings suggest leukocyte telomeres are longer in African Americans than in whites (Hunt et al., 2008), hence where available (Hunt et al., 2008; Chen et al., 2009; Kaplan et al., 2009) we stratified analyses by race. Shorter telomeres have been shown in some studies to be associated with obesity (Nordfjall et al., 2008b) and smoking Valdes et al., 2005). Only a small number of studies included data on BMI and smoking status and we decided against requesting further adjustments for BMI and smoking status as this might lead to inconsistencies in adjustments. In addition to the characteristics investigated, it is possible that other factors might vary between studies, for example epigenetic status, proinflammatory state and pathogen challenge. All these factors interact with each other and with telomere length (Aviv et al., 2006; Bekaert et al., 2007; Shiels, 2010; Shiels et al., 2011) and could result in heterogeneity.
We also undertook several sensitivity analyses-including a control for measurement error by only including those studies with intra- or inter-assay CV measures and for four studies we included telomere length measures at phases 1 and 2 (up to 10 years apart) and we repeated the associations in separate meta-analyses at the two phases. For each of these sensitivity analyses, gender was still associated with telomere length, with females having longer telomeres than males. We did not assess the quality of the included studies, as quality assessment in meta-analysis of observational studies is controversial (Stroup et al., 2000). Although this was a large systematic review and meta-analysis, we might still have been underpowered for the sub-group analyses and meta-regression. Hence whilst the funnel plots and formal tests for publication bias gave no strong evidence for publication bias, these still need to be interpreted with caution. Mean ages in the study ranged from 36.6 ± 0.4SD years to 89.9 ± 3.2SD years, hence a limitation was that there were few studies at younger ages. We adjusted for age as a potential confounder but other potential confounders including BMI, smoking status and epigenetic status might have affected the strength of the associations. Furthermore, variation in these characteristics between the studies might result in heterogeneity.
5. Conclusion
Telomere length was longer on average in females than males and the strength of these associations varied by measurement method but not by age group: Southern blot was the only technique showing an unequivocal sex difference. This difference cannot be explained by differential random measurement error, but might be due to method-specific bias. Direct comparison of Southern blot results with at least one of the other methods in the same participants would help to clarify whether there are real sex differences in telomere length.
Supplementary Material
Acknowledgments
We are very grateful to all cohort members who participated in the studies. Regarding the MESA study: This research was supported by contracts N01-HC-95159 through N01-HC-95169 from the National Heart, Lung, and Blood Institute and by grants UL1-RR-024156 and UL1-RR-025005 from NCRR. The authors thank the other investigators, the staff, and the participants of the MESA study for their valuable contributions. A full list of participating MESA investigators and institutions can be found at http://www.mesa-nhlbi.org. Regarding the Cardiovascular Health Study: This research was supported by grant HL80698 and contracts HHSN268201200036C, HHSN268200800007C, N01HC55222, N01HC85079, N01HC85080, N01HC85081, N01HC85082, N01HC85083, N01HC85086 and grant HL080295 from the National Heart, Lung and Blood Institute (NHLBI), with additional contribution from the National Institute of Neurological Disorders and Stroke (NINDS). Additional support from provided by AG023629 from the National Institute on Aging (NIA). A full list of principal CHS investigators and institutions can be found at http://www.chs-nhlbi.org/PI.htm. Jang et al.’s (2008) study was supported by a grant from the National R & D Program for Cancer Control, Ministry of Health & Welfare, Republic of Korea (0720550-2). We acknowledge the help of Christine Garcia, the corresponding author of the Cronkhite et al. (2008) study.
Funding
HALCyon is funded by the New Dynamics of Ageing (RES-353-25-0001) and MG and RC have received support from this grant. The NSHD is funded by the UK Medical Research Council (U120063239 and U123092720). TvZ acknowledges funding by MRC for telomere measurements (G0500997 and G0601333) and from BBSRC (BH092279) for a CASE studentship for LW. The Hertfordshire Ageing Study was funded by the Wellcome Trust and the UK Medical Research Council. The Lothian Birth Cohort 1921 wave 1 phenotypic data collection and DNA preparation was funded by the Biotechnology and Biological Sciences Research Council (BBSRC) (project grant 15/SAG09977). The Lothian Birth Cohort 1921 wave 3 phenotypic data collection was funded by the Chief Scientific Office of the Scottish Government Health Directorates (project grant CZB/4/505). The LBC1921 work was undertaken by the University of Edinburgh Centre for Cognitive Ageing and Cognitive Epidemiology, part of the cross council Lifelong Health and Wellbeing Initiative (Centre grant G0700704/84698). Funding from the BBSRC, Engineering and Physical Sciences Research Council (EPSRC), Economic and Social Research Council (ESRC) and Medical Research Council (MRC) is gratefully acknowledged. The funders had no role in study design, data collection, analysis and interpretation of the data, decision to publish, or preparation of the manuscript.
Footnotes
Précis: There is an association between gender and telomere length, with females having longer telomeres than males.
Supplementary data to this article can be found online at http://dx.doi.org/10.1016/j.exger.2013.12.004.
Ethics statement
All included studies had received the relevant ethical approval. For the HALCyon cohorts: HAS: ethical approval was given by the Bedfordshire and Hertfordshire Local Research Ethics Committee and the West Hertfordshire Local Research Ethics Committee; LBC1921: Multicentre Research Ethics Committee for Scotland and the Lothian Research Ethics Committee; NSHD: North Thames Multi-Centre Research Ethics Committee (age 53y) and the Central Manchester Research Ethics Committee and the Scottish A Research Ethics Committee (age 60–64). Other relevant studies: HyperGEN: The Institutional Review Board of the University of Alabama at Birmingham Medical School; the Institutional Review Board of Boston University School of Medicine; the Institutional Review Board of the University of Minnesota Medical School; the Institutional Review Board of the University of Utah Medical School; The Institutional Review Board of the University of North Carolina; PREVEND: study was approved by the local medical ethics committee; Newcastle 85+ study: Newcastle and North Tyneside 1 research ethics committee; The West of Scotland Twenty-07 Study: Ethical approval for each wave was obtained from the relevant local ethics committee.
Conflict of interest disclosure
This is an original work, and it has never been published nor is under consideration for publication elsewhere. All the authors have substantially contributed to data collection and manuscript drafting and revision. Peter Lansdorp is a founding shareholder in Repeat Diagnostics, a company specializing in leukocyte telomere length measurements using flow FISH. All other authors have not declared any conflicts of interest.
References
- Adams J, Martin-Ruiz C, Pearce MS, White M, Parker L, von Zglinicki T. No association between socio-economic status and white blood cell telomere length. Aging Cell. 2007;6:125–128. doi: 10.1111/j.1474-9726.2006.00258.x. [DOI] [PubMed] [Google Scholar]
- Aubert G, Baerlocher GM, Vulto I, Poon SS, Lansdorp PM. Collapse of telomere homeostasis in hematopoietic cells caused by heterozygous mutations in telomerase genes. PLoS Genet. 2012;8 doi: 10.1371/journal.pgen.1002696. http://dx.doi.org/10.1371/journal.pgen.1002696. [DOI] [PMC free article] [PubMed] [Google Scholar]
- Austad SN. Why women live longer than men: sex differences in longevity. Gend Med. 2006;3:79–82. doi: 10.1016/s1550-8579(06)80198-1. [DOI] [PubMed] [Google Scholar]
- Aviv A. Telomeres, sex, reactive oxygen species, and human cardiovascular aging. J Mol Med. 2002;80:689–695. doi: 10.1007/s00109-002-0377-8. [DOI] [PubMed] [Google Scholar]
- Aviv A, Valdes AM, Spector TD. Human telomere biology: pitfalls of moving from the laboratory to epidemiology. Int J Epidemiol. 2006;35:1424–1429. doi: 10.1093/ije/dyl169. [DOI] [PubMed] [Google Scholar]
- Aviv A, Hunt SC, Lin J, Cao X, Kimura M, Blackburn E. Impartial comparative analysis of measurement of leukocyte telomere length/DNA content by Southern blots and qPCR. Nucleic Acids Res. 2011;39 doi: 10.1093/nar/gkr634. http://dx.doi.org/10.1093/nar/gkr634. [DOI] [PMC free article] [PubMed] [Google Scholar]
- Baird DM, Jeffreys AJ, Royle NJ. Mechanisms underlying telomere repeat turnover, revealed by hypervariable variant repeat distribution patterns in the human Xp/Yp telomere. EMBO J. 1995;14:5433–5443. doi: 10.1002/j.1460-2075.1995.tb00227.x. [DOI] [PMC free article] [PubMed] [Google Scholar]
- Baird DM, Coleman J, Rosser ZH, Royle NJ. High levels of sequence polymorphism and linkage disequilibrium at the telomere of 12q: implications for telomere biology and human evolution. Am J Hum Genet. 2000;66:235–250. doi: 10.1086/302721. [DOI] [PMC free article] [PubMed] [Google Scholar]
- Barrett EL, Richardson DS. Sex differences in telomeres and lifespan. Aging Cell. 2011;10:913–921. doi: 10.1111/j.1474-9726.2011.00741.x. [DOI] [PubMed] [Google Scholar]
- Bekaert S, Rietzschel ER, De Buyzere ML, De Bacquer D, Langlois M, Segers P, et al. Telomere length and cardiovascular risk factors in a middle-aged population free of overt cardiovascular disease. Aging Cell. 2007;6:639–647. doi: 10.1111/j.1474-9726.2007.00321.x. [DOI] [PubMed] [Google Scholar]
- Benetos A, Okuda K, Lajemi M, Kimura M, Thomas F, Skurnick J, et al. Telomere length as an indicator of biological aging: the gender effect and relation with pulse pressure and pulse wave velocity. Hypertension. 2001;37:381–385. doi: 10.1161/01.hyp.37.2.381. [DOI] [PubMed] [Google Scholar]
- Bischoff C, Peterson HC, Graakjaer J, Andersen-Ranberg K, Vaupel JW, Bohr VA, et al. No association between telomere length and survival among the elderly and oldest old. Epidemiology. 2006;17:190–194. doi: 10.1097/01.ede.0000199436.55248.10. [DOI] [PubMed] [Google Scholar]
- Brouilette SW, Moore JS, McMahon AD, Thompson JR, Ford I, Shepherd J, et al. Telomere length, risk of coronary heart disease, and statin treatment in the West of Scotland Primary Prevention Study: a nested case–control study. Lancet. 2007;369:107–114. doi: 10.1016/S0140-6736(07)60071-3. [DOI] [PubMed] [Google Scholar]
- Carrero JJ, Stenvinkel P, Fellstrom B, Qureshi AR, Lamb K, Heimburger O, et al. Telomere attrition is associated with inflammation, low fetuin-A levels and high mortality in prevalent haemodialysis patients. J Intern Med. 2008;263:302–312. doi: 10.1111/j.1365-2796.2007.01890.x. [DOI] [PubMed] [Google Scholar]
- Cawthon RM, Smith KR, O’Brien E, Sivatchenko A, Kerber RA. Association between telomere length in blood and mortality in people aged 60 years or older. Lancet. 2003;361:393–395. doi: 10.1016/S0140-6736(03)12384-7. [DOI] [PubMed] [Google Scholar]
- Chen W, Gardner JP, Kimura M, Brimacombe M, Cao X, Srinivasan SR, et al. Leukocyte telomere length is associated with HDL cholesterol levels: the Bogalusa heart study. Atherosclerosis. 2009;205:620–625. doi: 10.1016/j.atherosclerosis.2009.01.021. [DOI] [PubMed] [Google Scholar]
- Chen W, Kimura M, Kim S, Cao X, Srinivasan SR, Berenson GS, et al. Longitudinal versus cross-sectional evaluations of leukocyte telomere length dynamics: age-dependent telomere shortening is the rule. J Gerontol A Biol Sci Med Sci. 2011;66:312–319. doi: 10.1093/gerona/glq223. [DOI] [PMC free article] [PubMed] [Google Scholar]
- Cherkas LF, Hunkin JL, Kato BS, Richards JB, Gardner JP, Surdulescu GL, et al. The association between physical activity in leisure time and leukocyte telomere length. Arch Intern Med. 2008;168:154–158. doi: 10.1001/archinternmed.2007.39. [DOI] [PubMed] [Google Scholar]
- Collerton J, Davies K, Jagger C, Kingston A, Bond J, Eccles MP, et al. Health and disease in 85 year olds: baseline findings from the Newcastle 85+ cohort study. BMJ. 2009;339 doi: 10.1136/bmj.b4904. http://dx.doi.org/10.1136/bmj.b4904. [DOI] [PMC free article] [PubMed] [Google Scholar]
- Costenbader KH, Prescott J, Zee RY, De Vivo I. Immunosenescence and rheumatoid arthritis: does telomere shortening predict impending disease? Autoimmun Rev. 2011;10:569–573. doi: 10.1016/j.autrev.2011.04.034. [DOI] [PMC free article] [PubMed] [Google Scholar]
- Cronkhite JT, Xing C, Raghu G, Chin KM, Torres F, Rosenblatt RL. Telomere shortening in familial and sporadic pulmonary fibrosis. Am J Respir Crit Care Med. 2008;178:729–737. doi: 10.1164/rccm.200804-550OC. [DOI] [PMC free article] [PubMed] [Google Scholar]
- Deary IJ, Whiteman MC, Starr JM, Whalley LJ, Fox HC. The impact of childhood intelligence on later life: following up the Scottish mental surveys of 1932 and 1947. J Pers Soc Psychol. 2004;86:130–147. doi: 10.1037/0022-3514.86.1.130. [DOI] [PubMed] [Google Scholar]
- Deng Z, Campbell AE, Lieberman PM. TERRA, CpG methylation and telomere heterochromatin: lessons from ICF syndrome cells. Cell Cycle. 2010;9:69–74. doi: 10.4161/cc.9.1.10358. [DOI] [PMC free article] [PubMed] [Google Scholar]
- Der G, Batty GD, Benzeval M, Deary IJ, Green MJ, McGlynn L, McIntyre A, Robertson T, Shiels PG. Is telomere length a biomarker for aging: cross-sectional evidence from the West of Scotland? PLoS One. 2012;7 doi: 10.1371/journal.pone.0045166. http://dx.doi.org/10.1371/journal.pone.0045166. [DOI] [PMC free article] [PubMed] [Google Scholar]
- DerSimonian R, Laird N. Meta-analysis in clinical trials. Control Clin Trials. 1986;7:177–188. doi: 10.1016/0197-2456(86)90046-2. [DOI] [PubMed] [Google Scholar]
- Diez Roux AV, Ranjit N, Jenny NS, Shea S, Cushman M, Fitzpatrick A, et al. Race/ethnicity and telomere length in the multi-ethnic study of atherosclerosis. Aging Cell. 2009;8:251–257. doi: 10.1111/j.1474-9726.2009.00470.x. [DOI] [PMC free article] [PubMed] [Google Scholar]
- Egger M, Davey Smith G, Schneider M, Minder C. Bias in meta-analysis detected by a simple, graphical test. BMJ. 1997;315:629–634. doi: 10.1136/bmj.315.7109.629. [DOI] [PMC free article] [PubMed] [Google Scholar]
- Fitzpatrick AL, Kronmal RA, Gardner JP, Psaty BM, Jenny NS, Tracy RP, et al. Leukocyte telomere length and cardiovascular disease in the cardiovascular health study. Am J Epidemiol. 2007;165:14–21. doi: 10.1093/aje/kwj346. [DOI] [PubMed] [Google Scholar]
- Fitzpatrick AL, Kronmal RA, Kimura M, Gardner JP, Psaty BM, Jenny NS, et al. Leukocyte telomere length and mortality in the cardiovascular health study. J Gerontol A Biol Sci Med Sci. 2011;66:421–429. doi: 10.1093/gerona/glq224. [DOI] [PMC free article] [PubMed] [Google Scholar]
- Foote CG, Vleck D, Vleck CM. Extent and variability of interstitial telomeric sequences and their effects on estimates of telomere length. Mol Ecol Resour. 2013;13:417–428. doi: 10.1111/1755-0998.12079. [DOI] [PubMed] [Google Scholar]
- Halaschek-Wiener J, Vulto I, Fornika D, Collins J, Connors JM, Le ND, et al. Reduced telomere length variation in healthy oldest old. Mech Ageing Dev. 2008;129:638–641. doi: 10.1016/j.mad.2008.07.004. [DOI] [PubMed] [Google Scholar]
- Harris SE, Deary IJ, MacIntyre A, Lamb KJ, Radhakrishnan K, Starr JM, et al. The association between telomere length, physical health, cognitive ageing, and mortality in non-demented older people. Neurosci Lett. 2006;406:260–264. doi: 10.1016/j.neulet.2006.07.055. [DOI] [PubMed] [Google Scholar]
- Higgins JP, Thompson SG. Quantifying heterogeneity in a meta-analysis. Stat Med. 2002;21:1539–1558. doi: 10.1002/sim.1186. [DOI] [PubMed] [Google Scholar]
- Higgins JP, Thompson SG, Deeks JJ, Altman DG. Measuring inconsistency in meta-analyses. BMJ. 2003;327:557–560. doi: 10.1136/bmj.327.7414.557. [DOI] [PMC free article] [PubMed] [Google Scholar]
- Horn T, Robertson BC, Gemmell NJ. The use of telomere length in ecology and evolutionary biology. Heredity. 2010;105:497–506. doi: 10.1038/hdy.2010.113. [DOI] [PubMed] [Google Scholar]
- Hunt SC, Chen W, Gardner JP, Kimura M, Srinivasan SR, Eckfeldt JH, et al. Leukocyte telomeres are longer in African Americans than in whites: the National Heart, Lung, and Blood Institute Family Heart Study and the Bogalusa Heart Study. Aging Cell. 2008;7:451–458. doi: 10.1111/j.1474-9726.2008.00397.x. [DOI] [PMC free article] [PubMed] [Google Scholar]
- Huzen J, Peeters W, de Boer RA, Moll FL, Wong LS, Codd V, et al. Circulating leukocyte and carotid atherosclerotic plaque telomere length: interrelation, association with plaque characteristics, and restenosis after endarterectomy. Arterioscler Thromb Vasc Biol. 2011;31:1219–1225. doi: 10.1161/ATVBAHA.110.217158. [DOI] [PubMed] [Google Scholar]
- Jang JS, Choi YY, Lee WK, Choi JE, Cha SI, Kim YJ, et al. Telomere length and the risk of lung cancer. Cancer Sci. 2008;99:1385–1389. doi: 10.1111/j.1349-7006.2008.00831.x. [DOI] [PMC free article] [PubMed] [Google Scholar]
- Kaplan RC, Fitzpatrick AL, Pollak MN, Gardner JP, Jenny NS, McGinn AP, et al. Insulin-like growth factors and leukocyte telomere length: the cardiovascular health study. J Gerontol A Biol Sci Med Sci. 2009;64:1103–1106. doi: 10.1093/gerona/glp036. [DOI] [PMC free article] [PubMed] [Google Scholar]
- Kimura M, Barbieri M, Gardner JP, Skurnick J, Cao X, van Riel N, et al. Leukocytes of exceptionally old persons display ultra-short telomeres. Am J Physiol Regul Integr Comp Physiol. 2007;293:R2210–R2217. doi: 10.1152/ajpregu.00615.2007. [DOI] [PubMed] [Google Scholar]
- Kuh D, Pierce M, Adams J, Deanfield J, Ekelund U, Friberg P, et al. Cohort profile: updating the cohort profile for the MRC National Survey of Health and Development: a new clinic-based data collection for ageing research. Int J Epidemiol. 2011;40 doi: 10.1093/ije/dyq231. http://dx.doi.org/10.1093/ije/dyq231. [DOI] [PMC free article] [PubMed] [Google Scholar]
- Maeda T, Guan JZ, Oyama J, Higuchi Y, Makino N. Age-related changes in subtelomeric methylation in the normal Japanese population. J Gerontol A Biol Sci Med Sci. 2009;64:426–434. doi: 10.1093/gerona/gln057. [DOI] [PMC free article] [PubMed] [Google Scholar]
- Maeda T, Guan JZ, Koyanagi M, Makino N. Alterations in the telomere length distribution and the subtelomeric methylation status in human vascular endothelial cells under elevated temperature in culture condition. Aging Clin Exp Res. 2013;25:231–238. doi: 10.1007/s40520-013-0045-6. [DOI] [PubMed] [Google Scholar]
- Mangino M, Richards JB, Soranzo N, Zhai G, Aviv A, Valdes AM, et al. A genome-wide association study identifies a novel locus on chromosome 18q12.2 influencing white cell telomere length. J Med Genet. 2009;46:451–454. doi: 10.1136/jmg.2008.064956. [DOI] [PMC free article] [PubMed] [Google Scholar]
- Mangino M, Hwang SJ, Spector TD, Hunt SC, Kimura M, Fitzpatrick AL, et al. Genome-wide meta-analysis points to CTC1 and ZNF676 as genes regulating telomere homeostasis in humans. Hum Mol Genet. 2012;21 doi: 10.1093/hmg/dds382. http://dx.doi.org/10.1093/hmg/dds382. [DOI] [PMC free article] [PubMed] [Google Scholar]
- Martin-Ruiz CM, Gussekloo J, van Heemst D, von Zglinicki T, Westendorp RG. Telomere length in white blood cells is not associated with morbidity or mortality in the oldest old: a population-based study. Aging Cell. 2005;4:287–290. doi: 10.1111/j.1474-9726.2005.00171.x. [DOI] [PubMed] [Google Scholar]
- Martin-Ruiz CM, Dickinson HO, Keys B, Rowan E, Kenny RA, von Zglinicki T. Telomere length predicts poststroke mortality, dementia, and cognitive decline. Ann Neurol. 2006;60:174–180. doi: 10.1002/ana.20869. [DOI] [PubMed] [Google Scholar]
- Martin-Ruiz CM, Jagger C, Kingston A, Collerton J, Catt M, Davies K, et al. Assessment of a large panel of candidate biomarkers of ageing in the Newcastle 85+ study. Mech Ageing Dev. 2011;132:496–502. doi: 10.1016/j.mad.2011.08.001. [DOI] [PubMed] [Google Scholar]
- Mayer S, Bruderlein S, Perner S, Waibel I, Holdenried A, Ciloglu N, et al. Sex-specific telomere length profiles and age-dependent erosion dynamics of individual chromosome arms in humans. Cytogenet Genome Res. 2006;112:194–201. doi: 10.1159/000089870. [DOI] [PubMed] [Google Scholar]
- Moher D, Liberati A, Tetzlaff J, Altman DG, PRISMA Group Preferred reporting items for systematic reviews and meta-analyses: the PRISMA statement. Ann Intern Med. 2009;151:264–269. doi: 10.7326/0003-4819-151-4-200908180-00135. [DOI] [PubMed] [Google Scholar]
- Mondello C, Pirzio L, Azzalin CM, Giulotto E. Instability of interstitial telomeric sequences in the human genome. Genomics. 2000;68:111–117. doi: 10.1006/geno.2000.6280. [DOI] [PubMed] [Google Scholar]
- Nawrot TS, Staessen JA, Gardner JP, Aviv A. Telomere length and possible link to X chromosome. Lancet. 2004;363:507–510. doi: 10.1016/S0140-6736(04)15535-9. [DOI] [PubMed] [Google Scholar]
- Needham BL, Adler N, Gregorich S, Rehkopf D, Lin J, Blackburn EH. Socioeconomic status, health behaviour, and leukocyte telomere length in the National Health and Nutrition Examination Survey, 1999–2002. Soc Sci Med. 2013;85 doi: 10.1016/j.socscimed.2013.02.023. http://dx.doi.org/10.1016/j.socscimed.2013.02.023. [DOI] [PMC free article] [PubMed] [Google Scholar]
- Nordfjall K, Larefalk A, Lindgren P, Holmberg D, Roos G. Telomere length and heredity: indications of paternal inheritance. Proc Natl Acad Sci U S A. 2005;102:16374–16378. doi: 10.1073/pnas.0501724102. [DOI] [PMC free article] [PubMed] [Google Scholar]
- Nordfjall K, Eliasson M, Stegmayr B, Lundin S, Roos G, Nilsson PM. Increased abdominal obesity, adverse psychosocial factors and shorter telomere length in subjects reporting early ageing; the MONICA Northern Sweden Study. Scand J Public Health. 2008a;36:744–752. doi: 10.1177/1403494808090634. [DOI] [PubMed] [Google Scholar]
- Nordfjall K, Eliasson M, Stegmayr B, Melander O, Nilsson P, Roos G. Telomere length is associated with obesity parameters but with a gender difference. Obesity. 2008b;16:2682–2689. doi: 10.1038/oby.2008.413. [DOI] [PubMed] [Google Scholar]
- Nordfjall K, Svenson U, Norrback KF, Adolfsson R, Lenner P, Roos G. The individual blood cell telomere attrition rate is telomere length dependent. PLoS Genet. 2009;5 doi: 10.1371/journal.pgen.1000375. http://dx.doi.org/10.1371/journal.pgen.1000375. [DOI] [PMC free article] [PubMed] [Google Scholar]
- Okuda K, Bardeguez A, Gardner JP, Rodriguez P, Ganesh V, Kimura M, et al. Telomere length in the newborn. Pediatr Res. 2002;52:377–381. doi: 10.1203/00006450-200209000-00012. [DOI] [PubMed] [Google Scholar]
- Pellatt AJ, Wolff RK, Torres-Mejia G, John EM, Herrick JS, Lundgreen A, et al. Telomere length, telomere-related genes, and breast cancer risk: the breast cancer health disparities study. Genes Chromosomes Cancer. 2013;52:595–609. doi: 10.1002/gcc.22056. [DOI] [PMC free article] [PubMed] [Google Scholar]
- Puterman E, Epel ES, Lin J, Blackburn EH, Gross JJ, Whooley MA, et al. Multisystem resiliency moderates the major depression-telomere length association: findings from the Heart and Soul Study. Brain Behav Immun. 2013 doi: 10.1016/j.bbi.2013.05.008. http://dx.doi.org/10.1016/j.bbi.2013.05.008. [DOI] [PMC free article] [PubMed]
- Ren F, Li C, Xi H, Wen Y, Huang K. Estimation of human age according to telomere shortening in peripheral blood leukocytes of Tibetan. Am J Forensic Med Pathol. 2009;30:252–255. doi: 10.1097/PAF.0b013e318187df8e. [DOI] [PubMed] [Google Scholar]
- Ruiz-Herrera A, Nergadze SG, Santagostino M, Giulotto E. Telomeric repeats far from the ends: mechanisms of origin and role in evolution. Cytogenet Genome Res. 2008;122:219–228. doi: 10.1159/000167807. [DOI] [PubMed] [Google Scholar]
- Samassekou O, Yan J. Polymorphism in a human chromosome-specific interstitial telomere-like sequence at 22q11.2. Cytogenet Genome Res. 2011;134:174–181. doi: 10.1159/000328862. [DOI] [PubMed] [Google Scholar]
- Sanders JL, Fitzpatrick AL, Boudreau RM, Arnold AM, Aviv A, Kimura M, et al. Leukocyte telomere length is associated with noninvasively measured age-related disease: the cardiovascular health study. J Gerontol A Biol Sci Med Sci. 2012;67A:409–416. doi: 10.1093/gerona/glr173. [DOI] [PMC free article] [PubMed] [Google Scholar]
- Shiels PG. Improving precision in investigating aging: why telomeres can cause problems. J Gerontol A Biol Sci Med Sci. 2010;65:789–791. doi: 10.1093/gerona/glq095. [DOI] [PubMed] [Google Scholar]
- Shiels PG, McGlynn LM, MacIntyre A, Johnson PCD, Batty GD, Burns H, et al. Accelerated telomere attrition is associated with relative household income, diet and inflammation in the pSoBid cohort. PLoS ONE. 2011;6 doi: 10.1371/journal.pone.0022521. http://dx.doi.org/10.1371/journal.pone.0022521. [DOI] [PMC free article] [PubMed] [Google Scholar]
- Stroup DF, Berlin JA, Morton SC, Olkin I, Williamson GD, Rennie D, et al. Meta-analysis of observational studies in epidemiology: a proposal for reporting. Meta-analysis of Observational Studies in Epidemiology (MOOSE) group. JAMA. 2000;283:2008–2012. doi: 10.1001/jama.283.15.2008. [DOI] [PubMed] [Google Scholar]
- Syddall HE, Simmonds SJ, Martin HJ, Watson C, Dennison EM, Cooper C, et al. Cohort profile: the Hertfordshire Ageing Study (HAS) Int J Epidemiol. 2010;39:36–43. doi: 10.1093/ije/dyn275. [DOI] [PMC free article] [PubMed] [Google Scholar]
- Thompson SG, Sharp SJ. Explaining heterogeneity in meta-analysis: a comparison of methods. Stat Med. 1999;18:2693–2708. doi: 10.1002/(sici)1097-0258(19991030)18:20<2693::aid-sim235>3.0.co;2-v. [DOI] [PubMed] [Google Scholar]
- Unryn BM, Cook LS, Riabowol KT. Paternal age is positively linked to telomere length of children. Aging Cell. 2005;4:97–101. doi: 10.1111/j.1474-9728.2005.00144.x. [DOI] [PubMed] [Google Scholar]
- Valdes AM, Andrew T, Gardner JP, Kimura M, Oelsner E, Cherkas LF, et al. This title is Obesity, cigarette smoking, and telomere length in women. Lancet. 2005;366:662–664. doi: 10.1016/S0140-6736(05)66630-5. [DOI] [PubMed] [Google Scholar]
- van der Harst P, van der Steege G, de Boer RA, Voors AA, Hall AS, Mulder MJ, et al. Telomere length of circulating leukocytes is decreased in patients with chronic heart failure. J Am Coll Cardiol. 2007;49:1459–1464. doi: 10.1016/j.jacc.2007.01.027. [DOI] [PubMed] [Google Scholar]
- von Zglinicki T. Oxidative stress shortens telomeres. Trends Biochem Sci. 2002;27:339–344. doi: 10.1016/s0968-0004(02)02110-2. [DOI] [PubMed] [Google Scholar]
- von Zglinicki T. Will your telomeres tell your future? BMJ. 2012;344 doi: 10.1136/bmj.e1727. http://dx.doi.org/10.1136/bmj.e1727. [DOI] [PubMed] [Google Scholar]
- von Zglinicki T, Serra V, Lorenz M, Saretzki G, Lenzen-Grossimlighaus R, Gessner R, et al. Short telomeres in patients with vascular dementia: an indicator of low antioxidative capacity and a possible risk factor? Lab Invest. 2000;80:1739–1747. doi: 10.1038/labinvest.3780184. [DOI] [PubMed] [Google Scholar]
- Weischer M, Bojesen SE, Cawthon RM, Freiberg JJ, Tybjaerg-Hansen A, Nordestgaard BG. Short telomere length, myocardial infarction, ischemic heart disease, and early death. Arterioscler Thromb Vasc Biol. 2012;32:822–829. doi: 10.1161/ATVBAHA.111.237271. [DOI] [PubMed] [Google Scholar]
- Weischer M, Nordestgaard BG, Cawthon RM, Freiberg JJ, Tybjaerg-Hansen A, Bojesen SE. Short telomere length, cancer survival, and cancer risk in 47102 individuals. J Natl Cancer Inst. 2013;105:459–468. doi: 10.1093/jnci/djt016. [DOI] [PubMed] [Google Scholar]
- Woo J, Tang NL, Suen E, Leung JC, Leung PC. Telomeres and frailty. Mech Ageing Dev. 2008;129:642–648. doi: 10.1016/j.mad.2008.08.003. [DOI] [PubMed] [Google Scholar]
- Yamaguchi H, Calado RT, Ly H, Kajigaya S, Baerlocher GM, Chanock SJ, et al. Mutations in TERT, the gene for telomerase reverse transcriptase, in aplastic anemia. N Engl J Med. 2005;352:1413–1424. doi: 10.1056/NEJMoa042980. [DOI] [PubMed] [Google Scholar]
Associated Data
This section collects any data citations, data availability statements, or supplementary materials included in this article.