Abstract
Global motion perception matures during childhood and involves the detection of local directional signals that are integrated across space. We examine the maturation of local directional selectivity and global motion integration with an equivalent noise paradigm applied to direction discrimination. One hundred and three observers (6–17 years) identified the global direction of motion in a 2AFC task. The 8° central stimuli consisted of 100 dots of 10% Michelson contrast moving 2.8°/s or 9.8°/s. Local directional selectivity and global sampling efficiency were estimated from direction discrimination thresholds as a function of external directional noise, speed, and age. Direction discrimination thresholds improved gradually until the age of 14 years (linear regression, p < 0.05) for both speeds. This improvement was associated with a gradual increase in sampling efficiency (linear regression, p < 0.05), with no significant change in internal noise. Direction sensitivity was lower for dots moving at 2.8°/s than at 9.8°/s for all ages (paired t test, p < 0.05) and is mainly due to lower sampling efficiency. Global motion perception improves gradually during development and matures by age 14. There was no change in internal noise after the age of 6, suggesting that local direction selectivity is mature by that age. The improvement in global motion perception is underpinned by a steady increase in the efficiency with which direction signals are pooled, suggesting that global motion pooling processes mature for longer and later than local motion processing.
Keywords: motion perception, development, sampling efficiency, internal noise, random dot kinematogram
Introduction
The ability to detect movement and to discriminate speed and direction are fundamental visual functions for navigation and safe mobility in an environment that is dynamic in three-dimensions. The visual perception of motion is initially based on the responses of retinotopic motion sensors in primary visual cortex, V1, that are selective for the speed and direction of movement within a relatively small area of the visual field (Hubel & Wiesel, 1962). In order to detect the movement of objects that are larger than V1 receptive fields, local motion signals must be integrated across larger regions of the visual field. The medial temporal area, MT, in primate brains is implicated in the global processing of local motion signals and has been identified in electrophysiological (Zeki, 1974), lesion (Newsome & Pare, 1988), single neuron recording (Liu & Newsome, 2003; Maunsell & Van Essen, 1983), human stroke patient (Zihl, von Cramon, & Mai, 1983), Functional Magnetic Resonance Imaging (Beauchamp, Cox, & DeYoe, 1997; Huk & Heeger, 2000; Tootell et al., 1995), and micro stimulation (Salzman, Murasugi, Britten, & Newsome, 1992) studies. Neurons in MT have receptive fields about 10 times the diameter of those in V1, and are well suited to extract global motion from local motion signals over space and time in order to encode the movements of larger objects (Bruce, Georgeson, & Green, 2003).
Although the literature is inconsistent concerning why the development of motion perception in children takes so long, most studies find that children improve with development. Global motion perception is believed to mature between the age of 7 and 12 years (Armstrong, Maurer, & Lewis, 2009; Ellemberg, Lewis, Hong Liu, & Maurer, 1999; Gunn et al., 2002; Parrish, 2005). Studies have used random dot kinematograms (RDK) to examine the development of global motion perception by measuring motion coherence thresholds (MCTs) (Manning, Aagten-Murphy, & Pellicano, 2012; Parrish, 2005). MCTs estimate the smallest proportion of signal dots required for direction identification. Sensitivity to complex patterns of global motion, such as expansion and rotation, develop later in childhood (Baumberger & Fluckiger, 2004) and some are not fully developed even in teenagers, depending on the stimulus and parameters that are used (Armstrong et al., 2009; Atkinson, Braddick, & Moar, 1977; Baumberger & Fluckiger, 2004; Ellemberg et al., 2004; Falkenberg, Dutton, & Simpson, 2010; Parrish, Giaschi, Boden, & Dougherty, 2005; Regal, 1981).Very young infants are not able to perform forced choice psychophysical experiments. To study the development of motion perception, several authors have therefore measured involuntary directional eye movements elicited by moving stimuli. With this technique, it has been shown that sensitivity to the direction of moving patterns is present as early as 3 months of age (Dobkins, Fine, Hsueh, & Vitten, 2004) and, when corrected for contrast sensitivity, show little further development into adulthood (Blumenthal, Bosworth, & Dobkins, 2013). The observation that chromatic segmentation cues can improve motion perception without changing directional eye movements suggests that the eye movement response is largely driven by low level motion signals and is unaffected by attentional factors (Dobkins & Sampath, 2008).
In order to determine the global direction of motion of a random dot stimulus, an observer must first detect the local direction of motion of one or more of the moving dots and then combine a number of such local direction estimates to estimate the overall direction of global motion. The observer's performance at the task is limited by both of these stages; however, the MCT paradigm does not independently quantify either of these stages. It is possible that these two stages may mature at different rates during normal development and that each stage may be differentially affected by impairment of motion perception. The aim of this study is to use an equivalent noise (EN) paradigm (see Appendix for details) to investigate the normal development of sampling efficiency and internal noise using a global direction discrimination task. In the EN paradigm, all dots are signal dots and give information of the total direction of the dot pattern. The EN paradigm measures the influence that additional external noise, the variability of directions added to each dot, has on the ability to recognize the overall global direction of motion for each observer (Dakin, Mareschal, & Bex, 2005). The advantage of EN is that having two separate measures of sampling efficiency and internal noise allow us to make hypotheses about the maturation of motion mechanisms. Recently, we have shown using the EN paradigm in an aging study, where the observers' age ranged from 20–89 years, that the reduced direction discrimination of global motion with age is due to a decrease in sampling efficiency and an increase in internal noise (Bogfjellmo, Bex, & Falkenberg, 2013). This suggests that the ability to integrate motion signals is reduced in older observers in addition to local motion sensors becoming less selective in their responses to directional signals.
In this study we estimated the development of local direction sensitivity and global direction pooling on global motion discrimination (Bogfjellmo et al., 2013; Dakin et al., 2005) using an EN model in school aged children from 6 to 17 years old. As motion sensitivity is found to develop later for slower than faster speeds (Ahmed et al., 2005; Aslin & Shea, 1990; Banton, Dobkins, & Bertenthal, 2001; Dobkins & Teller, 1996; Manning et al., 2012), we examined internal noise and sampling efficiency for two speeds.
Methods
Observers
One hundred and three naive observers from the ages of 6 to 17 years participated in the study. Observers were recruited from three schools in Mosjøen, Norway. Observers were included if they had normal or corrected-to-normal visual acuity of 0.8 Snellen (95 observers had visual acuities better than 1.0), normal contrast sensitivity tested on an iPad (Dorr, Lesmes, Lu, & Bex, 2013), stereo acuity better than 120″ and normal visual health. The parents of all observers signed an informed consent form, and the tenets of the Declaration of Helsinki were followed. The study had an ethical approval from the Regional Ethical Committee of Norway.
Apparatus and stimuli
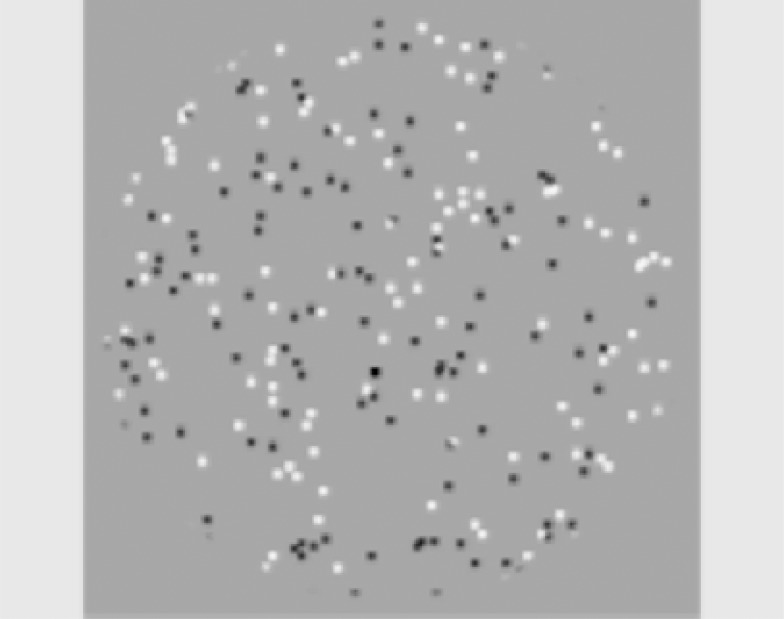
Random dot motion stimuli were generated using MatLab (MathWorks) version R2010a integrating elements of the PsychToolbox (Brainard, 1997; Pelli, 1997). Stimuli were presented on a MacBook Pro with a 15-inch Glossy Widescreen LCD Display (refresh rate 60 Hz) with a mean luminance of 91 cd/m2. The display was calibrated every day of testing using a Spyder 3 Elite (Datacolor, Lawrenceville, NJ). Each stimulus contained 50 white and 50 black circular dots moving to the right or left of upwards in a circular 8° aperture. The use of dark and light dots prevented any change in mean luminance at the onset and offset of the stimulus. The dot diameter was 6 pixels (0.14°), the dot Michelson contrast was 10%, and the dot speed was 2.8°/s or 9.8°/s (Figure 1), well within the preferred speeds for MT neurons, which are from 2°/s to 256°/s (Maunsell & Van Essen, 1983). A restricted dot lifetime of three frames prevented observers tracking individual dots. Each dot was initialized with a random age to avoid synchronized expiry, and were randomly repositioned in the display aperture at the end of their lifetime. The stimulus duration was 0.5 seconds.
Figure 1.
Illustration of a single frame of the stimulus used in the experiments. On each trial, the observer fixated a central colored point and reported whether the global motion of the dots was clockwise or counter-clockwise of upwards.
Procedure
In a single interval two alternative forced-choice presentation, observers judged whether the overall direction of motion was clockwise or anticlockwise of upwards while they fixated a central, stationary colored point. Observers were encouraged to guess when not sure of the direction. The observer's response was reported verbally to the examiner (LGB) who pressed the keypad without viewing the stimulus. Feedback was provided by changing the color of the fixation point; green for correct responses, and red for incorrect responses. Before starting the experiment, all observers completed two test runs of 10 trials to ensure that they understood the task. The stimulus was run in a fixed order, where speed 9.8°/s was tested before speed 2.8°/s. This was done because we have previously found that thresholds for the faster speed are lower (Bogfjellmo et al., 2013), and practice with the easier speed condition was helpful. Each observer completed one experiment of 50 trials for each speed. Each test lasted about 3 min, and the whole experiment took about 20 min including breaks. Observers viewed the display binocularly from a head rest at 57 cm in an otherwise dark room.
Equivalent noise analysis
Direction noise was added to all dots to allow for an EN paradigm (Bogfjellmo et al., 2013; Dakin et al., 2005) to be used to estimate internal noise σint and sampling efficiency Nsamp for each observer. The EN function (Equation 1) describes direction discrimination threshold as a function of external noise:
 |
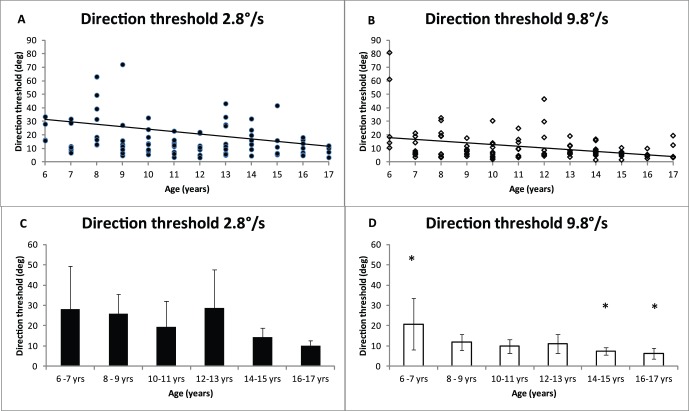
where σobs is the observed direction discrimination threshold, σint is internal noise (i.e., the directional uncertainty in the observer's visual system), σext is external noise, i.e., the variance of the direction distribution from which dot directions were drawn, and Nsamp is the number of dots used by the observer to estimate the global direction of all dots. The precision of each dot's direction estimate and the number of integrated dots jointly determine performance. The important assumption of the model is that internal noise is constant. When the external noise is low, performance depends primarily on internal noise. When external noise is high, performance depends primarily on global extraction of information (Dakin et al., 2005). Direction threshold (Figure 2) is the smallest angle required to discriminate the direction of motion on 75% trials without added directional noise (direction standard deviation was 0°).
Figure 2.
Direction discrimination thresholds as a function of age for 2.8°/s and 9.8°/s. A and B show individual data, with regression lines. C and D show the mean data for observers binned according to age. Error bars show ±95% confidence intervals. Asterisks (*) indicate a statistically significant difference at p < 0.005 (ANOVA) between the two oldest age groups and the youngest age group. Significant post hoc Tukey comparisons show p = 0.01.
The EN algorithm was implemented with the FAST toolbox (Vul, Bergsma, & MacLeod, 2010) which selected the direction angle of global motion, and the standard deviation of the direction distribution from which local dot directions were sampled on each trial. The FAST method selects the test parameters on each trial that maximizes information gain and provides significant increases in the efficiency of data collection (see Appendix for details).
Data analysis
Statistical analysis was performed using SPSS 20.0.0 (IBM Corp). Linear regressions were used to determine the effect of age on each speed separately. To aid comparison with previous studies, data were binned into six different groups of two years each; 6–7 years (n = 13), 8–9 years (n = 19), 10–11 years (n = 20), 12–13 years (n = 20), 14–15 years (n = 18), 16–17 years (n = 13). One-way ANOVA and post hoc Tukey tests were used to analyze differences between binned age groups. Paired t tests were used to test whether there was a difference between the two speeds.
Results
Direction discrimination threshold was estimated from the EN function at the point where external noise = 0°. This point represents the minimum direction threshold for a noiseless stimulus. Figure 2A and 2B show direction discrimination thresholds as a function of age for individual observers for 2.8°/s and 9.8°/s. The slopes on the fitted linear regression lines show a gradual improvement in direction discrimination with development for 2.8°/s (B2.8 = −1.6, t(102) = −1.8, p = 0.078, r2 = 0.03), and for 9.8°/s (B9.8 = −1.1, t(102) = −3.3, p = 0.001, r2 = 0.1), although there are large individual differences. Figure 2 C and D show the mean direction discrimination threshold for binned age groups. At 9.8°/s, direction discrimination was significantly lower for the two oldest age groups compared with the youngest age group, ANOVA, F(5, 97) = 2.9, p < 0.05; post hoc Tukey, p = 0.01. In addition, Figure 2 also shows that direction discrimination thresholds were lower at the faster speed, paired t test: t(102) = −3.5, p = 0.001.
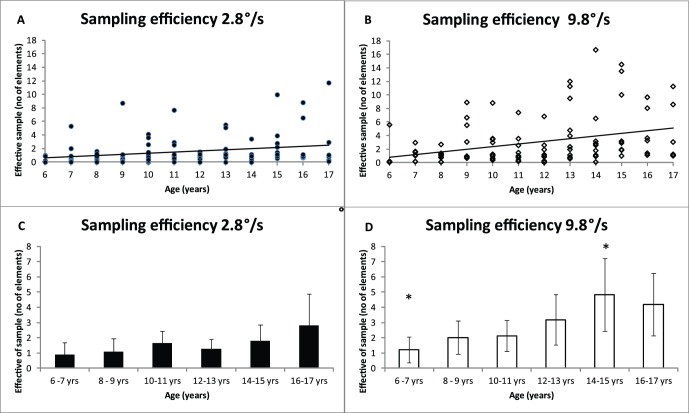
Sampling efficiency is a parameter (Nsamp) estimated with EN analysis. Figure 3 shows sampling efficiency as a function of age for two different speeds. Figure 3A and B show individual sampling efficiencies, and it is clear that there is a significant increase in efficiency with age for both speeds (linear regression): B2.8 = 0.2, t(102) = 2.3, p = 0.02, r2 = 0.05; B9.8 = 0.4, t(102) = 3.4, p = 0.001, r2 = 0.3). Comparing different age groups, Figure 3 D show that sampling efficiency is significantly higher for the 14–15 year olds than for the youngest age group, ANOVA, F(5, 97) = 2.6, p < 0.05; Post hoc Tukey p = 0.05. Furthermore, sampling efficiency was significantly lower at speed 2.8°/s than at speed 9.8°/s for all observers, paired t test: t(102) = 4.1, p < 0.001.
Figure 3.
Sampling efficiency as a function of age at two different speeds. Figure A and B show the individual data for 2.8°/s and 9.8°/s speeds, respectively, with regression lines. Figure C and D show the mean data for participants binned according to age. Error bars show ±95% confidence intervals. Asterisks (*) indicate a statistically significant difference between age groups (ANOVA, p < 0.05).
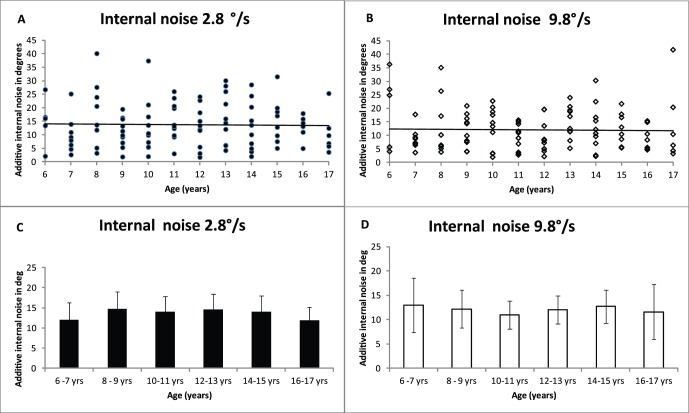
Internal noise (σint) is estimated with EN analysis. Figure 4 shows internal noise as a function of age for 2.8°/s and 9.8°/s. Figure 4A and B show the individual data, and Figure C and D show binned data. As can be seen from Figure 4, there is no change in internal noise with age, B2.8 = −0.04, t(102) = −0.1, p = 0.9, r2 = 0; B9.8 = −0.04, t(102) = −0.16, p = 0.9, r2 = 0, and there was no difference with speed, paired t test: t(102) = −1.7, p = 0.09.
Figure 4.
Internal noise as a function of age at two different speeds. Figure A and B show the individual data for 2.8°/s and 9.8°/s speeds, respectively, showing regression lines for the individual data. Figure C and D show the mean data for participants binned according to age. Error bars show ±95% confidence intervals.
Discussion
The current study investigated global motion perception of children aged 6–17 years at two different speeds (2.8°/s and 9.8°/s) using an EN model. The results show that the ability to discriminate the direction of global motion gradually matures in normal development, and that the youngest children need a larger angle to discriminate the direction of global motion. The EN analysis demonstrated that the improvement with age is due to improved sampling efficiency and not to reductions in internal noise.
Further, the performance is better at speed 9.8°/s than at 2.8°/s. The results extend our findings in aging, in which we showed that there is a decrease in direction discrimination in aging due to reduced sampling efficiency and also increased internal noise (Bogfjellmo et al., 2013). Our result is in agreement with Hadad, Maurer, and Lewis (2011) who found an immaturity in sensitivity to the direction of global motion until the age of 12 years for speeds 4°/s and 18°/s. Our results are also in agreement with Banton et al. (2001), who performed a study on infants: They suggested that if the bandwidth of directionally selective motion mechanisms narrows with age, the direction discrimination sensitivity will increase. Broad bandwidths means that the precision of direction discrimination is poor as small differences in direction will elicit indistinguishable responses in a given detector (Banton et al., 2001), and therefore make the immature observer uncertain about the local direction of individual elements in the stimulus—i.e., internal noise. Kiorpes, Price, Hall-Haro, and Movshon (2012) also found that the ability to discriminate global direction develops gradually in macaque monkeys. They found that macaque monkeys reach maturity for complex motion direction discrimination at about 3 years of age due to the late maturation of extrastriate mechanisms. This age is approximately comparable to 13 human years (Boothe, Dobson, & Teller, 1985), in broad agreement with the present data. Hatta et al. (1998), who conducted physiological recordings from V1 neurons in infant Macaque monkeys ranging in age from 6 days to 8 weeks, showed that direction sensitivity was absent or very broad in one-week-old monkeys, but the bandwidth narrows with age and continues narrowing until maturation is reached.
Our data demonstrate that younger children need a larger angle to discriminate direction at speed 2.8°/s compared with speed 9.8°/s. The EN analysis determined that the reason for the improved global direction discrimination is a gradual development and improvement of sampling efficiency at both speeds, and that maturity is reached around the age of 14. Reduced sampling efficiency is equivalent to the observer using fewer elements in the stimulus to discriminate the global direction (Dakin et al., 2005). We have measured reduced sampling efficiency both in young children and in aging adults; this reduction could be related to an inconsistent decision-criterion dependent on the level of noise, or there is a mismatch between the decision template and the information contained in the stimulus (Bennett, Sekuler, & Ozin, 1999; Casco, Robol, Grassi, & Venturini, 2012; Legge, Kersten, & Burgess, 1987; Pardhan, Gilchrist, Elliott, & Beh, 1996; Simpson, Falkenberg, & Manahilov, 2003). Studies conducted on adults have found that reduced sampling efficiency may be due to neural dysfunction found in amblyopia (Giaschi, Regan, Kraft, & Hong, 1992) or optic neuritis (Parrish, 2005) amongst others. Although Hess, Wang, Demanins, Wilkinson, and Wilson (1999) found that the reduction in suprathreshold form, when testing global shape detection in amblyopes, was due to increased internal noise rather than reduced sampling efficiency. This is in agreement with Knox, Ledgeway, and Simmers (2013), who suggested that internal noise in the earliest stages in motion perception is relatively high in amblyopes. In this study all observers went through a screening procedure to ensure that they were visually normal, and had normal visual health, which means that the improvement in sampling efficiency is due to normal development, rather than any observable pathology. The contrast of the present stimuli was relatively low (10% Michelson), and it is therefore possible that part of the improvement in direction discrimination could be related to an improvement in contrast sensitivity. We measured the contrast sensitivity function of each subject and found no significant change in either the area under the log contrast sensitivity function (Applegate, 1984) or in spatial frequency resolution, in agreement with previous studies, Ellemberg et al. (1999), suggesting that contrast sensitivity changes alone do not account for the improvement in motion sensitivity we observe.
Our results show that internal noise did not change with age or speed, and direction discrimination performance does not seem to depend on uncertainty about each dot's local direction, which is in agreement with Falkenberg, Simpson, and Dutton (2013). Children between 6 and 17 are equally uncertain about local dot motion, suggesting that direction bandwidth is mature by the age of 6 years, consistent with primate data (Hatta et al., 1998). Although in principle, performance could be related to optical defocus due to immature accommodation or refractive status, all children in this study were screened and had best corrected Snellen visual acuity of 0.8 or better; therefore optical defocus is most likely not an issue. Reduced illumination and increased light scatter in the eye are also factors that can decrease performance; however, these ocular factors are unlikely in the young, visually healthy, observers we tested.
For all observers, direction discrimination sensitivity was lower (i.e., thresholds were higher) at 2.8°/s compared to 9.8°/s. This is in agreement with previous studies on development of speed sensitivity (Ahmed et al., 2005; Manning et al., 2012) and work on adult observers (Bogfjellmo et al., 2013; McKee, Silverman, & Nakayama, 1986). Our study shows a gradual improvement for both speeds, although there are large individual differences in the population.
The children in this study needed a larger angle to discriminate direction at speed 2.8 °/s compared with speed 9.8°/s, which may be due to the lower sampling efficiency at speed 2.8°/s. The different stages of maturation of the visual functions may be due to the difference in selectivity of the various areas in the cerebral cortex that are devoted to the analysis of motion (Giaschi & Regan, 1997). The underlying speed mechanisms are computationally more complex than those coding direction. Neurons within MT may be less sharply tuned in children than adults, as there are fewer neurons tuned to slow speed compared with fast speeds in adult monkeys (Liu & Newsome, 2003). Less developed tuning may therefore have a greater impact on the discrimination of slower speeds, causing different rates of development of the pathways discriminating fast and slow speed (Ahmed et al., 2005; Manning et al., 2012). This also supports the idea of separate processing systems for fast and slow motion (Edwards, Badcock, & Smith, 1998; van der Smagt, Verstraten, Vaessen, van Londen, & van de Grind, 1999). Burr, Fiorentini, and Morrone (1998) hypothesized that the slow system is active at speeds below 3°/s and as speed increases it involves the fast system to an upper limit of approximately 80°/s. Narasimhan and Giaschi (2012) tested densities of 1, 15, and 30 dots/deg2 at speeds 1°/s and 4°/s and found that for children at 5 and 6 years, both speed and density had significant effects on the thresholds, whereas adults seemed to be unaffected. Hadad et al. (2011) and Gunn et al. (2002) reported in their studies that the late maturation was due to the sparse patterns they used; 0.75 dots/deg2 and 4 dots/deg2, respectively (Narasimhan & Giaschi, 2012). Our patterns were sparse; they had a density of 3.8 dots/deg2 for both speeds; however, Dakin et al. (2005) showed that the number of dots present in the EN stimuli limits both local noise and global sampling regardless of their density or size of field they occupy.
Since a gradual improvement was observed for both speeds, it is unlikely that performance is limited by non-visual factors such as response bias, attention, memory, motivation, or subjects' understanding of the test. All observers in this study had a short practice run before they started to make sure they understood the test. Abramov et al. (1984) found in his study that good psychophysical data on children could be collected within a reasonably short time. The test time in our study was approximately 3 min for each trial run, and we therefore suppose that the developmental improvements we see in this study are visual in nature and not cognitive. The most parsimonious explanation of the speed difference is that the lifetime of each dot was fixed at three video frames; thus, slower moving dots traveled a shorter overall distance than faster moving dots. It is therefore possible that longer trajectories contain more spatial information than do shorter trajectories.
Conclusion
Global motion perception improves gradually during development and matures by the age of 14 years. The improvement in global motion perception is underpinned by a steady increase in the efficiency with which direction signals are pooled, whereas internal noise does not change after the age of 6. This suggests that global motion pooling processes mature later than local motion processing, a finding in line with previous studies (Armstrong et al., 2009; Ellemberg et al., 1999; Gunn et al., 2002; Manning et al., 2012; Parrish, 2005).
Acknowledgments
This research was supported by NIH R01 EY018664 to Peter J. Bex. We thank Tor Martin Kvikstad for helpful suggestions.
Commercial relationships: none.
Corresponding author: Helle Kristine Falkenberg.
Email: helle.k.falkenberg@hbv.no.
Address: Department of Optometry and Visual Science, Buskerud and Vestfold University College, Kongsberg, Norway.
Appendix
Equivalent noise (EN) implementation in FAST
A variety of well-known adaptive procedures have been developed to increase the efficiency with which a psychometric function can be estimated during an experiment; for review see (Treutwein, 1995; Leek, 2001). More recently, several authors have proposed efficient methods to estimate behavioral functions. Behavioral functions such as the TvC function (Lesmes, Jeon, Lu, & Dosher, 2006), the Contrast Sensitivity Function (Lesmes, Lu, Baek, & Albright, 2010), ellipsoidal threshold functions (Kujala & Lukka, 2006), and a general FAST toolbox for rapid assessment of behavioral functions has been implemented in MatLab (Vul, Bergsma, & MacLeod, 2010).
These approaches specify a behavioral function that describes threshold (e.g., contrast detection threshold) as a function of an experimental variable (e.g., spatial frequency). Instead of measuring a threshold at each of a set of predetermined levels (e.g., six spatial frequencies log-spaced between 0.5 and 16 c/°), these approaches exploit information about the whole function from each data point. For each trial, the potential information gained from multiple alternative possible stimuli (e.g., spatial frequency and contrast combinations) is estimated. The stimulus that maximizes the certainty about the function parameter values is then selected for the next trial, and this process is repeated until the end of the experiment. This process allows an experiment to converge on an estimate of the function in many fewer trials than does a conventional experiment.
We implemented the EN algorithm with the FAST toolbox (Vul et al., 2010). The EN function described direction discrimination threshold as a function of external noise:
 |
where σθ is the direction discrimination threshold; σint is internal noise, the directional uncertainty in the observer's visual system; σext is external noise, the variance of the direction distribution from which dot directions were drawn; and Nsamp is the number of dots used by the observer to estimate the global direction of all dots.
The probability of a correct response on any trial is:
 |
where θ is the global direction angle of the stimulus, and σs is the slope of the psychometric function. The purpose of the experiment is to estimate σint, Nsamp, and σs, which are unknown, by varying θ and σext and observing p. The FAST algorithm selects θ and σext each trial.
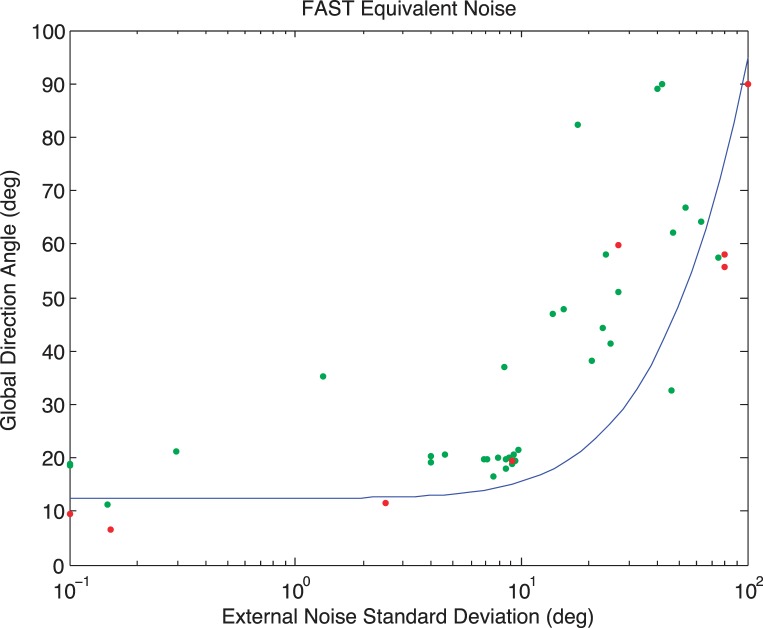
Figure A1 shows the results of a simulated experiment in which the internal noise, sampling efficiency parameters, and the slope of the psychometric function were respectively fixed at 5°, 2°—based on previous data (Mareschal, Bex, & Dakin, 2008), and 3.5°—based on QUEST (Watson & Pelli, 1983). Each data point indicates the angle and external noise level on one trial: Green data points indicate trials on which the response was correct, and red points represent incorrect trials. The curve shows the best fitting EN function after 100 trials.
Figure A1.
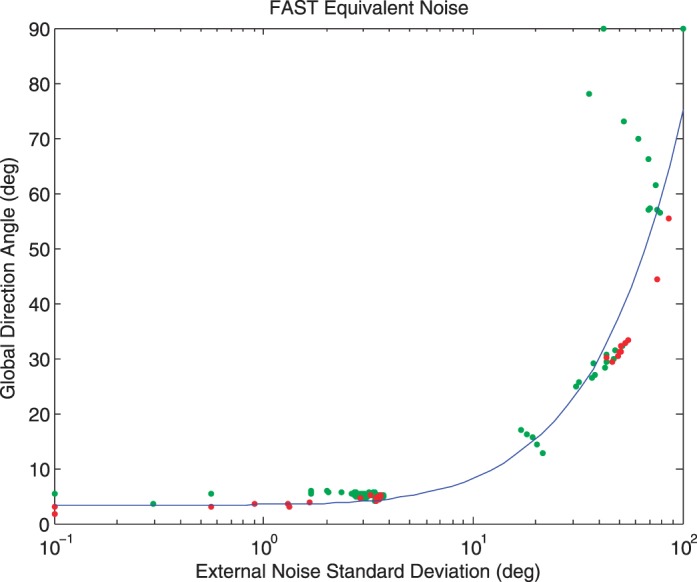
EN Analysis measured with FAST in a simulated experiment with 100 trials. Each data point indicates the direction angle and external noise level on one trial: Green data points indicate trials on which the response was correct; red points represent incorrect trials. The curve shows the best fitting EN function. See text for details.
Figure A2 shows the distribution of the absolute error between the FAST estimate and the true value of each parameter as a function of the number of trials completed. Error rapidly decreases as the number of trials increases and the algorithm converges to less than 10% of the true parameter values within around 40 trials. For internal noise and sampling efficiency, median error is less than 20% of the true value after 24 trials and stabilizes at around 10% of the true value after around 40 trials. Error on slope also converges to within 10% of the true value within 40 trials, but continues to converge with additional trials. We therefore used a conservative 50 trials in the experiment.
Figure A2.
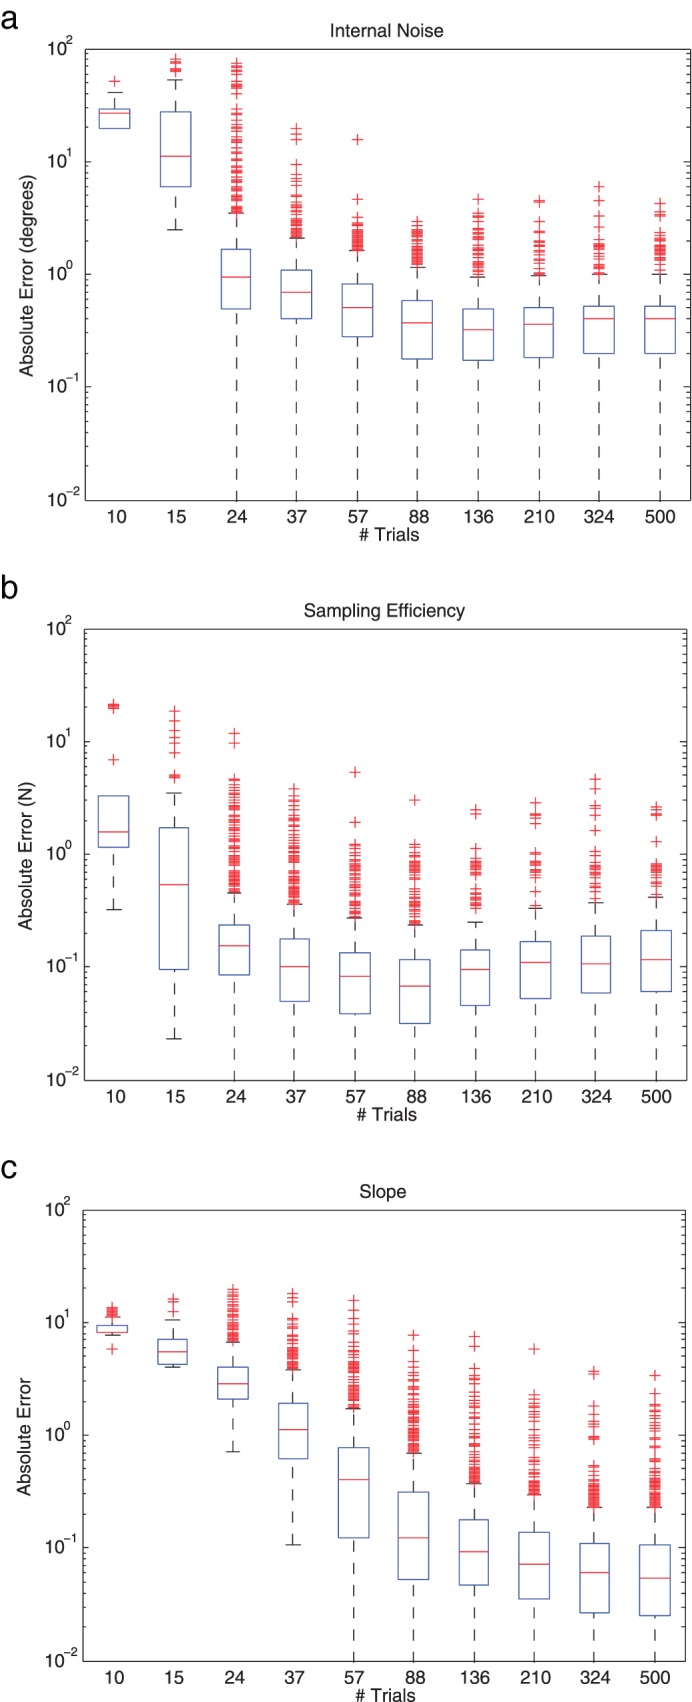
Box plots of the error between the FAST estimate and the true value of (a) Internal Noise, (b) Sampling Efficiency, and (c) Psychometric Function Slope as a function of the number of trials in an experiment. The central red line is the median, the edges of the box are the 25th and 75th percentiles, the black whiskers extend to the most extreme data points not considered outliers, and red plus symbols indicate outliers, determined automatically by MatLab.
Figure A3 shows typical data from a 35-year-old observer from (Bogfjellmo et al., 2013), plotted as in Figure A1.
Figure A3.
As Figure A1 except the data are for a 35-year-old naive observer.
References
- Abramov I., Hainline L., Turkel J., Lemerise E., Smith H., Gordon J., Petry S. (1984). Rocket-ship psychophysics. Assessing visual functioning in young children. Investigative Ophthalmology and Visual Science , 25 (11), 1307–1315, http://www.iovs.org/content/25/11/1307. [PubMed] [Google Scholar]
- Ahmed I. J., Lewis T. L., Ellemberg D., Maurer D. (2005). Discrimination of speed in 5-year-olds and adults: Are children up to speed? Vision Research , 45 (16), 2129–2135. [DOI] [PubMed] [Google Scholar]
- Armstrong V., Maurer D., Lewis T. L. (2009). Sensitivity to first- and second-order motion and form in children and adults. Vision Research , 49 (23), 2774–2781. doi: S0042-6989(09)00376-9 [pii]10.1016/j.visres.2009.08.016 [doi]. [DOI] [PubMed] [Google Scholar]
- Aslin R. N., Shea S. L. (1990). Velocity thresholds in human infants: Implications for the perception of motion. Developmental Psychology , 26 (4), 589–598. doi:10.1037/0012-1649.26.4.589. [Google Scholar]
- Atkinson J., Braddick O., Moar K. (1977). Contrast sensitivity of the human infant for moving and static patterns. Vision Research , 17 (9), 1045–1047. doi: 0042-6989(77)90008-6 [pii]. [DOI] [PubMed] [Google Scholar]
- Banton T., Dobkins K., Bertenthal B. I. (2001). Infant direction discrimination thresholds. Vision Research , 41 (8), 1049–1056. [DOI] [PubMed] [Google Scholar]
- Baumberger B., Fluckiger M. (2004). The development of distance estimation in optic flow. Perception , 33 (9), 1081–1099. [DOI] [PubMed] [Google Scholar]
- Beauchamp M. S., Cox R. W., DeYoe E. A. (1997). Graded effects of spatial and featural attention on human area MT and associated motion processing areas. Journal of Neurophysiology , 78 (1), 516–520. [DOI] [PubMed] [Google Scholar]
- Bennett P. J., Sekuler A. B., Ozin L. (1999). Effects of aging on calculation efficiency and equivalent noise. Journal of the Optical Society of America A: Optics, Image Science, and Vision , 16 (3), 654–668. [DOI] [PubMed] [Google Scholar]
- Blumenthal E. J., Bosworth R. G., Dobkins K. R. (2013). Fast development of global motion processing in human infants. Journal of Vision , 13 (13): 19 1–13, http://www.journalofvision.org/content/13/13/8, doi:10.1167/13.13.8. [DOI] [PMC free article] [PubMed] [Google Scholar]
- Bogfjellmo L. G., Bex P. J., Falkenberg H. K. (2013). Reduction in direction discrimination with age and slow speed is due to both increased internal noise and reduced sampling efficiency. Investigative Ophthalmology and Visual Science , 54 (8), 5204–5210, http://www.iovs.org/content/54/8/5204, doi:10.1167/iovs.13-12005. [DOI] [PMC free article] [PubMed] [Google Scholar]
- Boothe R. G., Dobson V., Teller D. Y. (1985). Postnatal development of vision in human and nonhuman primates. Annual Review of Neuroscience , 8, 495–545. doi:10.1146/annurev.ne.08.030185.002431. [DOI] [PubMed] [Google Scholar]
- Brainard D. H. (1997). The Psychophysics Toolbox. Spatial Vision , 10 (4), 433–436. [PubMed] [Google Scholar]
- Bruce V., Georgeson M. A., Green P. R. (2003). Visual perception: physiology, psychology, & ecology. Hove, UK: Psychology Press. [Google Scholar]
- Burr D. C., Fiorentini A., Morrone C. (1998). Reaction time to motion onset of luminance and chromatic gratings is determined by perceived speed. Vision Research , 38 (23), 3681–3690. [DOI] [PubMed] [Google Scholar]
- Casco C., Robol V., Grassi M., Venturini C. (2012). Positional noise in Landolt-C stimuli reduces spatial resolution: A study with younger and older observers. Vision Research , 67, 37–43. doi:10.1016/j.visres.2012.07.001. [DOI] [PubMed] [Google Scholar]
- Dakin S. C., Mareschal I., Bex P. J. (2005). Local and global limitations on direction integration assessed using equivalent noise analysis. Vision Research , 45 (24), 3027–3049. doi: S0042-6989(05)00396-2 [pii]10.1016/j.visres.2005.07.037 [doi]. [DOI] [PubMed] [Google Scholar]
- Dobkins K. R., Fine I., Hsueh A. C., Vitten C. (2004). Pattern motion integration in infants. Journal of Vision , 4 (3): 19 144–155, http://www.journalofvision.org/content/4/3/2, doi:10:1167/4.3.2. [DOI] [PubMed] [Google Scholar]
- Dobkins K. R., Sampath V. (2008). The use of chromatic information for motion segmentation: Differences between psychophysical and eye-movement measures. Perception , 37 (7), 993. [DOI] [PubMed] [Google Scholar]
- Dobkins K. R., Teller D. Y. (1996). Infant contrast detectors are selective for direction of motion. Vision Research , 36 (2), 281–294. doi: 0042-6989(95)00094-G [pii]. [DOI] [PubMed] [Google Scholar]
- Dorr M., Lesmes L. A., Lu Z.-L., Bex P. J. (2013). Rapid and reliable assessment of the contrast sensitivity function on an iPad. Investigative Ophthalmology & Visual Science , 54 (12), 7266–7273, http://www.iovs.org/content/54/12/7266. [DOI] [PMC free article] [PubMed] [Google Scholar]
- Edwards M., Badcock D. R., Smith A. T. (1998). Independent speed-tuned global-motion systems. Vision Research , 38 (11), 1573–1580. [DOI] [PubMed] [Google Scholar]
- Ellemberg D., Lewis T. L., Dirks M., Maurer D., Ledgeway T., Guillemot J. P., Lepore F. (2004). Putting order into the development of sensitivity to global motion. Vision Research , 44 (20), 2403–2411. [DOI] [PubMed] [Google Scholar]
- Ellemberg D., Lewis T. L., Hong Liu C., Maurer D. (1999). Development of spatial and temporal vision during childhood. Vision Research , 39 (14), 2325–2333. [DOI] [PubMed] [Google Scholar]
- Falkenberg H. K., Dutton G. N., Simpson W. A. (2010). Does Motion Discrimination Sensitivity in Children Aged 5-14 Years Improve After 1 Year? Investigative Ophthalmology & Visual Science , 51 (5), 1839. [Google Scholar]
- Falkenberg H. K., Simpson W. A., Dutton G. N. (2014). Development of sampling efficiency and internal noise in motion detection and discrimination in school-aged children. Manuscript submitted for publication. [DOI] [PubMed] [Google Scholar]
- Giaschi D. E., Regan D. (1997). Development of motion-defined figure-ground segregation in preschool and older children, using a letter-identification task. Optometry & Vision Science , 74 (9), 761–767. [DOI] [PubMed] [Google Scholar]
- Giaschi D. E., Regan D., Kraft S. P., Hong X. H. (1992). Defective processing of motion-defined form in the fellow eye of patients with unilateral amblyopia. Investigative Ophthalmology & Visual Science , 33 (8), 2483–2489, http://www.iovs.org/content/33/8/2483. [PubMed] [Google Scholar]
- Gunn A., Cory E., Atkinson J., Braddick O., Wattam-Bell J., Guzzetta A., Cioni G. (2002). Dorsal and ventral stream sensitivity in normal development and hemiplegia. Neuroreport , 13 (6), 843–847. [DOI] [PubMed] [Google Scholar]
- Hadad B. S., Maurer D., Lewis T. L. (2011). Long trajectory for the development of sensitivity to global and biological motion. Developmental Science , 14 (6), 1330–1339. doi:10.1111/j.1467-7687.2011.01078.x. [DOI] [PubMed] [Google Scholar]
- Hatta S., Kumagami T., Qian J., Thornton M., Smith E. L. III, Chino Y. M. (1998). Nasotemporal directional bias of V1 neurons in young infant monkeys. Investigative Ophthalmology & Visual Science , 39 (12), 2259–2267, http://www.iovs.org/content/39/12/2259. [PubMed] [Google Scholar]
- Hess R. F., Wang Y. Z., Demanins R., Wilkinson F., Wilson H. R. (1999). A deficit in strabismic amblyopia for global shape detection. Vision Research , 39 (5), 901–914. [DOI] [PubMed] [Google Scholar]
- Hubel D. H., Wiesel T. N. (1962). Receptive fields, binocular interaction and functional architecture in the cat's visual cortex. Journal of Physiology , 160, 106–154. [DOI] [PMC free article] [PubMed] [Google Scholar]
- Huk A. C., Heeger D. J. (2000). Task-related modulation of visual cortex. Journal of Neurophysiology , 83 (6), 3525–3536. [DOI] [PubMed] [Google Scholar]
- Kiorpes L., Price T., Hall-Haro C., Movshon J. A. (2012). Development of sensitivity to global form and motion in macaque monkeys (macaca nemestrina). Vision Research , 63, 34–42. doi:10.1016/j.visres.2012.04.018. [DOI] [PMC free article] [PubMed] [Google Scholar]
- Knox P. J., Ledgeway T., Simmers A. J. (2013). The effects of spatial offset, temporal offset and image speed on sensitivity to global motion in human amblyopia. Vision Research , 86C, 59–65. doi:10.1016/j.visres.2013.04.003. [DOI] [PubMed] [Google Scholar]
- Kujala J. V., Lukka T. J. (2006). Bayesian adaptive estimation: The next dimension. Journal of Mathematical Psychology , 50 (4), 369–389. doi:10.1016/j.jmp.2005.12.005 [Google Scholar]
- Leek M. (2001). Adaptive procedures in psychophysical research. Attention, Perception, & Psychophysics , 63 (8), 1279–1292. doi:10.3758/BF03194543. [DOI] [PubMed] [Google Scholar]
- Legge G. E., Kersten D., Burgess A. E. (1987). Contrast discrimination in noise. Journal of the Optical Society of America A , 4 (2), 391–404. [DOI] [PubMed] [Google Scholar]
- Lesmes L. A., Jeon S.-T., Lu Z.-L., Dosher B. A. (2006). Bayesian adaptive estimation of threshold versus contrast external noise functions: The quick TvC method. Vision Research , 46 (19), 3160–3176. doi:10.1016/j.visres.2006.04.022. [DOI] [PubMed] [Google Scholar]
- Lesmes L. A., Lu Z.-L., Baek J., Albright T. D. (2010). Bayesian adaptive estimation of the contrast sensitivity function: The quick CSF method. Journal of Vision , 10 (3): 19 1–21, http://www.journalofvision.org/content/10/3/17, doi:10.1167/10.3.17. [DOI] [PMC free article] [PubMed] [Google Scholar]
- Liu J., Newsome W. T. (2003). Functional organization of speed tuned neurons in visual area MT. Journal of Neurophysiology , 89 (1), 246–256. doi:10.1152/jn.00097.2002. [DOI] [PubMed] [Google Scholar]
- Manning C., Aagten-Murphy D., Pellicano E. (2012). The development of speed discrimination abilities. Vision Research , 70, 27–33. doi:10.1016/j.visres.2012.08.004. [DOI] [PubMed] [Google Scholar]
- Mareschal I., Bex P., Dakin S. (2008). Local motion processing limits fine direction discrimination in the periphery. Vision Research , 48 (16), 1719–1725. doi:10.1016/j.visres.2008.05.003. [DOI] [PMC free article] [PubMed] [Google Scholar]
- Maunsell J. H., Van Essen D. C. (1983). Functional properties of neurons in middle temporal visual area of the macaque monkey. I. Selectivity for stimulus direction, speed, and orientation. Journal of Neurophysiology , 49 (5), 1127–1147. [DOI] [PubMed] [Google Scholar]
- McKee S. P., Silverman G. H., Nakayama K. (1986). Precise velocity discrimination despite random variations in temporal frequency and contrast. Vision Research , 26 (4), 609–619. [DOI] [PubMed] [Google Scholar]
- Narasimhan S., Giaschi D. (2012). The effect of dot speed and density on the development of global motion perception. Vision Research , 62, 102–107. doi:10.1016/j.visres.2012.02.016. [DOI] [PubMed] [Google Scholar]
- Newsome W. T., Pare E. B. (1988). A selective impairment of motion perception following lesions of the middle temporal visual area (MT). Journal of Neuroscience , 8 (6), 2201–2211. [DOI] [PMC free article] [PubMed] [Google Scholar]
- Pardhan S., Gilchrist J., Elliott D. B., Beh G. K. (1996). A comparison of sampling efficiency and internal noise level in young and old subjects. Vision Research , 36 (11), 1641–1648. [DOI] [PubMed] [Google Scholar]
- Parrish E. E., Giaschi D.E., Boden C., Dougherty R. (2005). The maturation of form and motion perception in school age children. Vision Research , 45 (7), 827–837. [DOI] [PubMed] [Google Scholar]
- Pelli D. G. (1997). The VideoToolbox software for visual psychophysics: T4ransforming numbers into movies. Spatial Vision , 10 (4), 437–442. [PubMed] [Google Scholar]
- Regal D. M. (1981). Development of critical flicker frequency in human infants. Vision Research , 21 (4), 549–555. doi: 0042-6989(81)90100-0 [pii]. [DOI] [PubMed] [Google Scholar]
- Salzman C. D., Murasugi C. M., Britten K. H., Newsome W. T. (1992). Microstimulation in visual area MT: Effects on direction discrimination performance. Journal of Neuroscience , 12 (6), 2331–2355. [DOI] [PMC free article] [PubMed] [Google Scholar]
- Simpson W. A., Falkenberg H. K., Manahilov V. (2003). Sampling efficiency and internal noise for motion detection, discrimination, and summation. Vision Research , 43 (20), 2125–2132. [DOI] [PubMed] [Google Scholar]
- Tootell R. B., Reppas J. B., Kwong K. K., Malach R., Born R. T., Brady T. J., Belliveau J. W. (1995). Functional analysis of human MT and related visual cortical areas using magnetic resonance imaging. Journal of Neuroscience , 15 (4), 3215–3230. [DOI] [PMC free article] [PubMed] [Google Scholar]
- Treutwein B. (1995). Adaptive psychophysical procedures. Vision Research , 35 (17), 2503–2522. [PubMed] [Google Scholar]
- van der Smagt M. J., Verstraten F. A., Vaessen E. B., van Londen T., van de Grind W. A. (1999). Motion aftereffect of combined first-order and second-order motion. Perception , 28 (11), 1397–1411. [DOI] [PubMed] [Google Scholar]
- Vul E., Bergsma J., MacLeod D. I. (2010). Functional Adaptive Sequential Testing. Seeing and Perceiving, 23 , 5 (6), 483–515. [DOI] [PubMed] [Google Scholar]
- Watson A. B., Pelli D. G. (1983). QUEST: A Bayesian adaptive psychometric method. Perception & Psychophysics , 33, 113–120. [DOI] [PubMed] [Google Scholar]
- Zeki S. M. (1974). Functional organization of a visual area in the posterior bank of the superior temporal sulcus of the rhesus monkey. Journal of Physiology , 236 (3), 549–573. [DOI] [PMC free article] [PubMed] [Google Scholar]
- Zihl J., von Cramon D., Mai N. (1983). Selective disturbance of movement vision after bilateral brain damage. Brain , 106 (Pt 2), 313–340. [DOI] [PubMed] [Google Scholar]


