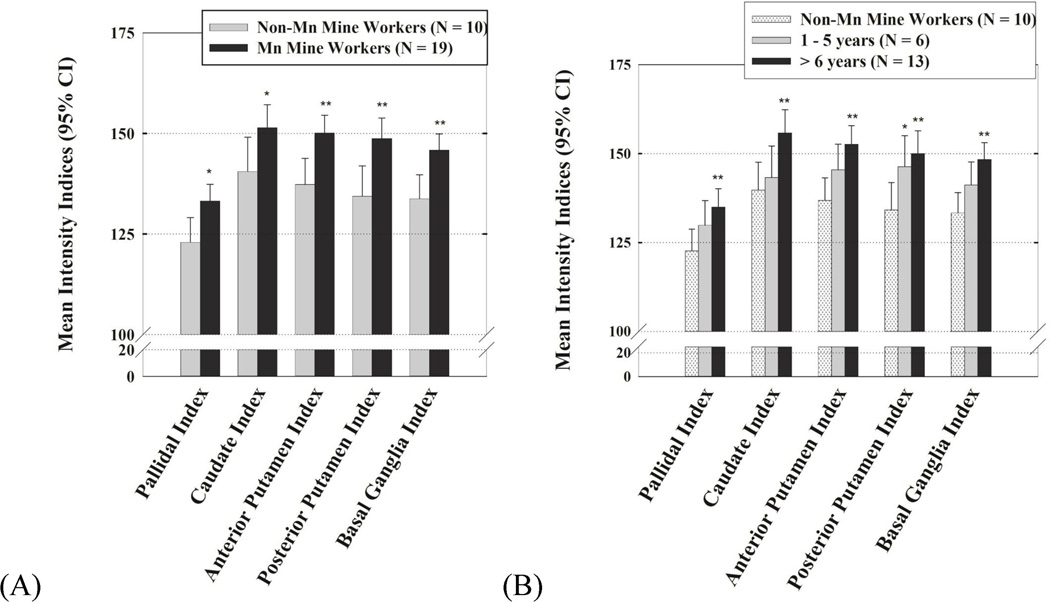
Figure 2.
T1 Intensity Indices for each region in (A) Mn miners and non-Mn miners and (B) High- and low-exposed Mn miners and non-Mn miners adjusted for age of death, time from last Mn exposure, and the death to scan interval.
*p values ≤ 0.05, **p values ≤ 0.01 when compared to reference non-Mn miners.

