

Abstract
The healthy adult brain undergoes tissue volume decline with age, but contradictory findings abound regarding rate of change. To identify a source of this discrepancy, we present contrasting statistical approaches to estimate hippocampal volume change with age based on 200 longitudinally-acquired magnetic resonance imaging in 70 healthy adults, age 20–70 years, who had 2–5 magnetic resonance imaging collected over 6 months to 8 years. Linear mixed-effects modeling using volume trajectories over age for each subject revealed significantly negative slopes with aging after a linear decline with a suggestion of acceleration in older individuals. By contrast, general linear modeling using either the first observation only of each subject or all observations treated independently (thereby disregarding trajectories) indicated no significant correlation between volume and age. Entering a quadratic term into the linear model yielded a biologically plausible function that was not supported by longitudinal analysis. The results underscore the importance of analyses that incorporate the trajectory of individuals in the study of brain aging.
Keywords: Longitudinal, Cross-sectional, Aging MRI, Brain, Atlas-based parcellation, Hippocampus, Linear mixed-effects model
1. Introduction
Heterochronicity in growth and aging trajectories of regional brain volumes has been firmly established with quantitative neuroimaging (e.g., Abe et al., 2008; Giedd et al., 2010; Jernigan et al., 2001; Pfefferbaum et al., 1994; Raz and Rodrigue, 2006; Walhovd et al., 2011). Age-related effects across the adult span have shown areas especially vulnerable to aging, including prefrontal cortex and cerebellar hemispheres and those relatively resistant to aging, including motor, sensory, occipital cortices, corpus callosum, and ventral pons (e.g., Good et al., 2001; Jernigan et al., 2001; Pfefferbaum et al., 2013; Raz and Rodrigue, 2006; Raz et al., 2005; Walhovd et al., 2011). These observations have been based largely on “cross-sectional” studies, that is, data from healthy individuals of different ages examined once each, with the assumption that resulting age regressions reflect longitudinal change.
Studies across adult ages that have a longitudinal component (i.e., >1 observation per subject at different ages, typically deemed “longitudinal” studies) have confirmed many but not all assumptions about brain development and aging derived from “cross-sectional” studies on the pattern of regional cortical and allocortical age-related effects (Fjell et al., 2010; Pfefferbaum et al., 2013; Raz et al., 2010). The effects of age on hippocampal volume have been inconsistent, with some cross-sectional reports of no age-related declines in men or women (Du et al., 2006; Good et al., 2001; Liu et al., 2003; Sullivan et al., 1995, 2005) and little evidence for heritability of hippocampal volume in old age (Sullivan et al., 2001), whereas other cross-sectional studies report significant age-related hippocampal volume decline (Allen et al., 2005; Greenberg et al., 2008; Jernigan et al., 2001; Lupien et al., 2007; Raz et al., 2004; Walhovd et al., 2011). By contrast, longitudinal studies provide more consistent evidence for untoward effects of aging on hippocampal volume, showing linear (Driscoll et al., 2009; Du et al., 2006) or nonlinear, late-life accelerated decline (Fjell et al., 2013; Pfefferbaum et al., 2013; Raz et al., 2010) (cf., Jernigan and Gamst, 2005). Thus, the extent to which assumptions about change derived from data collected with cross-sectional designs reflects true longitudinal measurement remains controversial (cf., Lindenberger, et al., 2011; Rabbitt, 2011; Raz and Lindenberger, 2011; Salthouse, 2011a).
Practical considerations (i.e., the life span of subjects and investigators) mandate that longitudinal studies of the adult age range comprise asynchronous age observations (i.e., subjects of different ages entered into the data set) and heterogeneous observation intervals across subjects. This results in data collected over relatively short time series at different ages in subjects’ lives. Thus, even longitudinal studies of normal aging are, in reality, a hybrid of cross-sectional and longitudinal observations. Therefore, analyses using individual trajectories may be the most desirable approach, allowing for both inferences about the normal aging process and interactions between aging trajectories and advancing age, which presents as nonlinear aging.
We present an example of how individual trajectory analysis improves modeling changes with aging despite the substantial heterogeneity in brain structure at any given age. The analyses use hippocampal volumetric data (Fig. 1A) collected longitudinally in healthy adults of different ages (20–70 year old at initial magnetic resonance imaging [MRI]), analyzed 2 ways, demonstrating differences in conclusions to be drawn about age-related effects on regional brain volume depending on the modeling of change employed and the structure measured. First, longitudinal analysis using the linear mixed-effects model examined age-related differences in terms of within-subject age-related slopes. This model also enabled testing the possibility that change accelerates with advanced age. Second, cross-sectional analysis using a linear model treated either only the first observation or all observations independently, as in “cross-sectional” studies, to explore potential differences obtained when analyzing the same basis data with these 2, different statistical approaches.
Fig. 1.
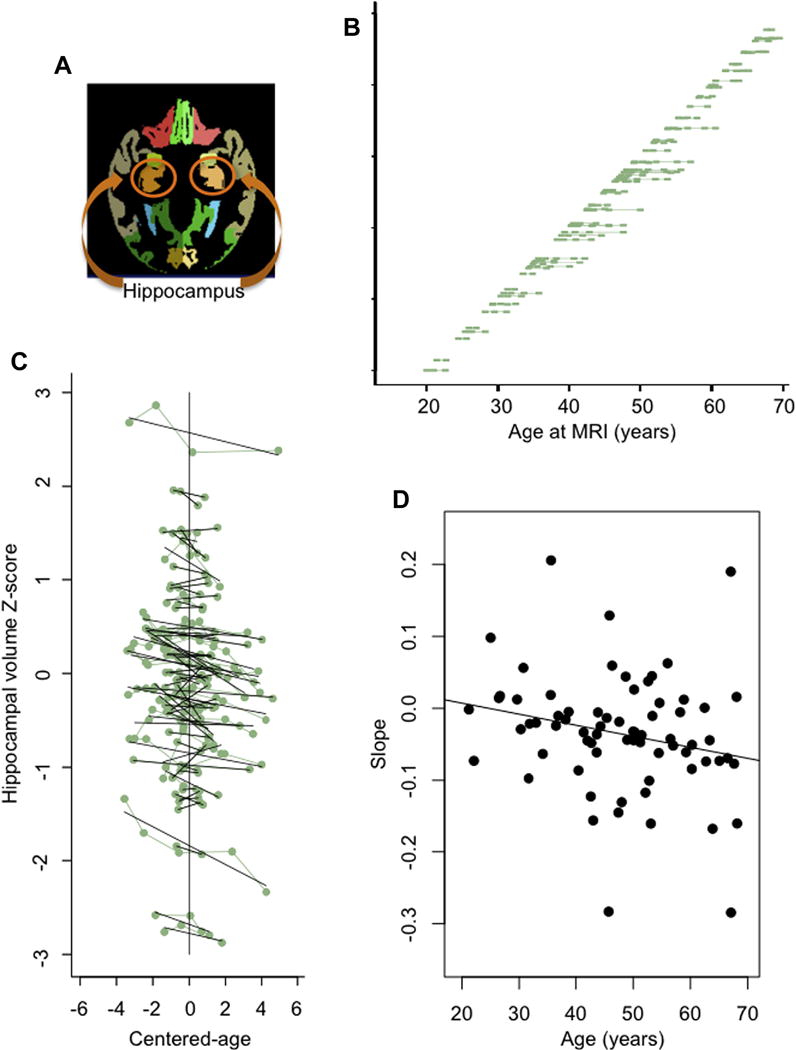
(A) Axial slice of a parcellated MRI structural image displaying a sample of the hippocampus (orange) used to derive the volume, which was measured over multiple slices. (B) Distribution of ages at each MRI (green square) for each participant. (C) Individual hippocampal z-scores (green dots) and slopes (black lines) plotted as a function of centered-age. For example, for a person who was scanned at ages 40, 45, 47, and 52 years, his mean-age = 46 and his centered-age values after subtracting mean-age were −6, −1, +1, and +6 years. (D) Individual hippocampal slopes plotted as function of each individual’s mean age. Abbreviation: MRI, magnetic resonance imaging. (For interpretation of the references to color in this figure legend, the reader is referred to the Web version of this article.)
2. Methods
2.1. Participants
The data used in these analyses were based on MRI data from 32 men and 38 women, taken from our earlier publication (Pfefferbaum et al., 2013); 65 served as controls in another publication (Pfefferbaum et al., 2014). These men and women, age 20–70 years at initial MRI, had at least 2 longitudinally-acquired, analyzable MRI studies (N = 200 MRIs); 36 participants had 3 MRIs; 17 participants had 4 MRIs; and 7 participants had 5 MRIs (Fig.1B and Supplementary Table 1). The range of time between first and last MRI was 6 months–8.25 years. Participants were recruited by referral from Internet posting, flyers, and word of mouth. Calibrated research clinical psychologists or a research nurse conducted a Structured Clinical Interview for Diagnostic and Statistical Manual of Mental Disorders (Fourth Edition) (First et al., 1998) to confirm that prospective participants did not meet criteria for any Axis I disorder, including alcohol or other substance use or abuse disorders.
2.2. MRI acquisition parameters and quantification
MRI data (T-weighted) were collected on a 1.5 T whole-body system (also see Supplementary Material). The SRI24 atlas (Rohlfing et al., 2010) (http://nitrc.org/projects/sri24) served as the template for parcellating brain images into bilateral volumes of the hippocampus (Fig. 1A). Analyses used intracranial volume-adjusted values, expressed as standardized Z-scores, thereby minimizing volume differences between the sexes based on normal differences in somatic size (Mathalon et al., 1993; Pfefferbaum et al., 1992).
2.3. Statistical analysis
Three functions were used from the lme4 R statistical package [http://www.r-project.org/] (Laird and Ware, 1982): lm fits simple linear and quadratic regression models, treating each data point as an independent observation; lmList fits simple linear regression models for each subject separately; and lmer (linear mixed-effects modeling) provides information about observed age-related effects common to all subjects (i.e., fixed effects) and those unique to the trajectory of each individual’s change over observation time (i.e., random effects). Furthermore, the analysis can be extended to measure interactions between individual trajectories and age and, for example, to test for sex effects.
3. Results
3.1. Mixed-effects models
These models examined age effects or age and sex in terms of the within-subject trajectory or slope (i.e., random effect) of hippocampal volume change with age:
where bi is the random effect for each individual.
3.1.1. Centered-age
To accommodate the asynchrony of age at times of observation and ultimately to test interactions between individual trajectories and age, for each subject, we first computed the mean age at the time of one’s scans (“mean-age”). Then for each subject the deviation from mean-age at each scan time was determined, producing a new set of age values, labeled “centered-age.” For example, for a person who was scanned at ages 40, 45, 47, and 52 years, his mean age = 46 and his centered-age values after subtracting mean-age were −6, −1, +1, and +6 years. For each subject, the slope of the hippocamal volume Z-score was computed as a function of the subject’s centered-age using lmList:
Thus, each subject had an age-related trajectory (slope) and intercept at his mean age, now centered on 0 (centered-age = 0; Fig. 1C). When observed as individual trajectories, 51 subjects had a negative slope and 19 had a positive slope (p = 0.0002, mean slope = 0.0351 Z-score units per year); hippocampus volume of most subjects decreased with age (Fig. 1D).
3.1.2. Individual slope by age correlation
Each individual’s centered-age slope is plotted as a function his mean age in Fig. 1D; note that each subject now has only 1 value, that is, his slope computed from lmList. There is a modest negative correlation between slope and mean-age (r = −0.2268, p = 0.05904). This relation (i.e., steeper slope in older individuals) is further tested below in an expanded model.
3.1.3. Linear mixed-effects modeling
Expanding linear mixed-effects models in R enabled testing the influence of average chronological age, sex, and their interactions on individual’s trajectories. Instead of entering the mean age of each subject, we constructed a new variable, mean-age-48 (the median age of the entire group was 48 years), which allowed the estimation of a subject’s trajectory at age 48 years. Otherwise, entering chronological age in the model would have provided an estimate of each subject’s age trajectory at age 0.
The first linear mixed effects model entered each subject’s centered-age rather than his chronological age to predict hippocampal volume and indicated that within an individual the volume of the hippocampus decreased with age (centered-age t = −5.883, p < 0.0001; Supplementary Table 2) (model 1 = lmer [volume ~ centered-age + {centered-age | subject}]).
The second model included both mean-age-48 and centered-age as predictors of hippocampal volume. As above, centered-age was significant but, in addition, the interaction between centered-age and mean-age-48 was also significant (t = −2.735, p = 0.0081; Supplementary Table 2). This interaction indicated that the slope of the hippocampus volume became more negative with older age (as also seen in the plot of slopes vs. mean chronological ages, Fig. 2A). The linear mixed-effects model was more sensitive in detecting the change in trajectory with age than was the simple correlation of slopes over ages (model 2 = lmer [volume ~ centered-age × mean-age-48 {centered-age | subject}]).
Fig. 2.
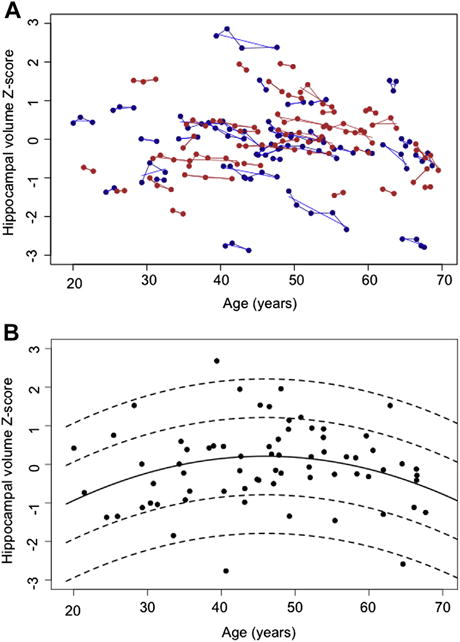
(A) Supratentorial volume-corrected hippocampal z-scores at each magnetic resonance imaging session of the 32 men (blue) and 38 women (red) as a function of chronological age. The blue and red lines are individual’s volume slopes. (B) Scatterplot of hippocampal volume data without trajectory information for first observations only. The solid line is the volume by age quadratic regression function, and the dashed lines are ±1 and 2 standard deviations. (For interpretation of the references to color in this figure legend, the reader is referred to the Web version of this article.)
3.1.4. Sex effects
Two approaches were applied to test for sex differences in hippocampal volume trajectory. First, model 2 was fit separately for men and women (model 2m and model 2f, Supplementary Table 2; Fig. 2A). This model does not allow for a statistical test of sex but only allows for informal comparison the 2 sets of estimates. For men, the interaction of mean-age-48 and centered-age on hippocampal volume was significant (t = −2.466, p = 0.0184), indicating that the slope of the hippocampus volume became more negative with older age. For women, the interaction was not significant (t = −1.582, p = 0.1190) but was in the direction seen in the men.
The second approach nested a centered-age by sex interaction term into model 2 and revealed a trend for men having a steeper trajectory than women (t = −1.933, p = 0.06849; Supplementary Table 2), not inconsistent with the first approach wherein men but not women showed a significant increase in slope with age. The results were confounded with chronological age, however, in that the men were slightly older than the women (model 3 = lmer [volume ~ centered-age × mean-age-48 + centered-age × sex + {centered-age |subject}]).
A 2 degree of freedom–likelihood ratio test allowed comparison; the 2 lmer models (model 2 and model 3) revealed no significant improvement of model 3 over model 2 (χ2 = 4.1859, degree of freedom = 8, 10, p = 0.1233; Supplementary Table 2). Finally, model 3 was expanded by adding the 3-way interaction of centered-age by mean-age-48 by sex, but this interaction was not significant (t = 1.097, p = 0.2771), suggesting a lack of an age-accelerated, sex effect.
3.2. Linear regression models
This analysis presents an example of the pitfalls of using cross-sectional data to draw inferences about longitudinal effects. Rather than using the preferred mixed-effects models, which accounts for within-subject variation over age, the longitudinal data here were treated as individual observations, either as the first observation only or all observations treated as independent observations (i.e., without respect to the within-subject’s repeated measures), using a general linear model: Lmodel 1 = lm (volume ~ age).
No significant correlations emerged between volume and age for those based either on the first observation for each subject or all observations. Adding age-squared to the model produced significant age (t = 2.358, p = 0.0213 observation 1 only; t = 3.103, p = 0.0022 all observations) and age-squared effects (t = −2.358, p = 0.0213 observation 1 only; t = −3.273, p = 0.0012 all {time 1 only} observations; Fig. 2B, black regression line ± 2 standard deviation): Lmodel 2 = lm (volume ~ age + age2).
Of particular note in Fig. 2B is that Lmodel 2 with its significant quadratic effect might suggest accelerated hippocampal decrease with age. The model fit is, however, as dependent on an apparent increase in volume up to age 45 as it is on the decrease thereafter.
4. Discussion
The results demonstrate convergent and contradictory findings and conclusions to be drawn about hippocampal volume change across the adult age span depending on the data available (longitudinal change, i.e., multiple observations on each individual at several different ages, from cross-sectional data, i.e., or one single observations on individuals of different ages) and the analysis model. The differences identified herein based on the same data, that were analyzed either accounting for or ignoring the trajectories of the individuals, caution conclusions regarding findings from cross-sectional study that simply correlate with longitudinal findings study (Lindenberger et al., 2011).
The cross-sectional (i.e., single observation) and longitudinal (i.e., trajectory) analyses of the same hippocampal volumes over age produced vastly different results. Cross-sectional statistics indicated no relation of volumes with age using a simple, linear function. Entering a quadratic term into the model yielded a function, suggesting growth at the younger adult ages and then decline with older age; however, this interpretation is contracted by the longitudinal analysis. This model fit, however, was as dependent on an apparent increase in volume up to age 45 years as it was on the decrease thereafter. The “bowed” trend was not borne out by longitudinal lmer statistics, which yielded a highly significant volume decline with aging and modest evidence for accelerating volume decline with advancing age. Indeed, review of Fig. 1D shows that the mainstay of the slope values of even the younger participants was negative, which belies the ascending function indicated by the cross-sectionally-based quadratic function. This conclusion from the trajectory analysis that hippocampal volume decline accelerates with advancing age, too, must be interpreted with caution because the longitudinal data were acquired with an accelerated cohort design (Birren and Schaie, 1985), leaving open the possibility that birth cohort effects accounted for the apparent age-accelerated declines. Further limitations of this design include restricted age ranges of individual trajectories and small sample sizes per trajectory age range.
After controlling for brain size differences in the entire group, hippocampal volume declines did not differ significantly between men and women. Absence of a sex difference in volume indicates that the adjustment for supratentorial volume successfully removed the known brain size differences attributable to sex. In spite of the ability to diminish the influence of head size on hippocampal volume, the large across-subject variability rendered simple regression approaches insensitive to the age-related changes detected with trajectory analyses. As is seen in Fig. 2, the within-subject variance in hippocampal volume is small compared with the across-subject variance.
Despite their advantages, longitudinal studies also suffer limitations. In addition to potential biases from sampling related to genetic, environmental, and other potentially relevant factors, almost all longitudinal studies of normal aging or disease progression across ages are based on a cross-sectional and/or longitudinal design, in effect, collections of short trajectories. That is, the baseline, or initial, data point is typically age-asynchronous, meaning collected on subjects at different ages, rendering aging trajectories vulnerable to interaction with cohort effects–people born in different eras may age differently (cf., Fjell et al., 2010, Pfefferbaum et al., 2013, Salthouse, 2011a, 2011b, Schaie and Hofer, 2001).
Supplementary Material
Acknowledgments
The authors wish to thank David R. Rogosa, Ph.D., of the Departments of Biostatistics and of Education, Stanford University, Stanford, CA for his tireless pedagogical efforts in statistical analysis. This work was supported by NIAAA grants: AA021697-NCANDA; AA013521-INIA; AA010723; AA017168.
Appendix A. Supplementary data
Supplementary data associated with this article can be found, in the online version, at http://dx.doi.org/10.1016/j.neurobiolaging.2015.05.005.
Footnotes
Disclosure statement
The authors have no conflicts of interest. All research procedures were approved by the Internal Review Boards of SRI International and of Stanford University School of Medicine and were conducted within their required guidelines.
References
- Abe O, Yamasue H, Aoki S, Suga M, Yamada H, Kasai K, Masutani Y, Kato N, Kato N, Ohtomo K. Aging in the CNS: comparison of gray/white matter volume and diffusion tensor data. Neurobiol Aging. 2008;29:102–116. doi: 10.1016/j.neurobiolaging.2006.09.003. [DOI] [PubMed] [Google Scholar]
- Allen JS, Bruss J, Brown CK, Damasio H. Normal neuroanatomical variation due to age: the major lobes and a parcellation of the temporal region. Neurobiol Aging. 2005;26:1245–1260. doi: 10.1016/j.neurobiolaging.2005.05.023. discussion 79–82. [DOI] [PubMed] [Google Scholar]
- Birren JE, Schaie KW. Handbook of the Psychology of Aging. second. Van Nostrand Reinhold Co; New York: 1985. [Google Scholar]
- Driscoll I, Davatzikos C, An Y, Wu X, Shen D, Kraut M, Resnick SM. Longitudinal pattern of regional brain volume change differentiates normal aging from MCI. Neurology. 2009;72:1906–1913. doi: 10.1212/WNL.0b013e3181a82634. [DOI] [PMC free article] [PubMed] [Google Scholar]
- Du AT, Schuff N, Chao LL, Kornak J, Jagust WJ, Kramer JH, Reed BR, Miller BL, Norman D, Chui HC, Weiner MW. Age effects on atrophy rates of entorhinal cortex and hippocampus. Neurobiol Aging. 2006;27:733–740. doi: 10.1016/j.neurobiolaging.2005.03.021. [DOI] [PMC free article] [PubMed] [Google Scholar]
- First MB, Spitzer RL, Gibbon M, Williams JBW. Structured Clinical Interview for DSM-IV Axis I Disorders (SCID) Version 2.0. Biometrics Research Department, New York State Psychiatric Institute; New York, NY: 1998. [Google Scholar]
- Fjell AM, Walhovd KB, Westlye LT, Ostby Y, Tamnes CK, Jernigan TL, Gamst A, Dale AM. When does brain aging accelerate? Dangers of quadratic fits in cross-sectional studies. Neuroimage. 2010;50:1376–1383. doi: 10.1016/j.neuroimage.2010.01.061. [DOI] [PubMed] [Google Scholar]
- Fjell AM, Westlye LT, Grydeland H, Amlien I, Espeseth T, Reinvang I, Raz N, Holland D, Dale AM, Walhovd KB. Critical ages in the life course of the adult brain: nonlinear subcortical aging. Neurobiol Aging. 2013;34:2239–2247. doi: 10.1016/j.neurobiolaging.2013.04.006. [DOI] [PMC free article] [PubMed] [Google Scholar]
- Giedd JN, Stockman M, Weddle C, Liverpool M, Alexander-Bloch A, Wallace GL, Lee NR, Lalonde F, Lenroot RK. Anatomic magnetic resonance imaging of the developing child and adolescent brain and effects of genetic variation. Neuropsychol Rev. 2010;20:349–361. doi: 10.1007/s11065-010-9151-9. [DOI] [PMC free article] [PubMed] [Google Scholar]
- Good CD, Johnsrude IS, Ashburner J, Henson RN, Friston KJ, Frackowiak RS. A voxel-based morphometric study of ageing in 465 normal adult brains. Neuroimage. 2001;14:21–36. doi: 10.1006/nimg.2001.0786. [DOI] [PubMed] [Google Scholar]
- Greenberg DL, Messer DF, Payne ME, Macfall JR, Provenzale JM, Steffens DC, Krishnan RR. Aging, gender, and the elderly adult brain: an examination of analytical strategies. Neurobiol Aging. 2008;29:290–302. doi: 10.1016/j.neurobiolaging.2006.09.016. [DOI] [PMC free article] [PubMed] [Google Scholar]
- Jernigan TL, Archibald SL, Fennema-Notestine C, Gamst AC, Stout JC, Bonner J, Hesselink JR. Effects of age on tissues and regions of the cerebrum and cerebellum. Neurobiol Aging. 2001;22:581–594. doi: 10.1016/s0197-4580(01)00217-2. [DOI] [PubMed] [Google Scholar]
- Jernigan TL, Gamst AC. Changes in volume with ageeconsistency and interpretation of observed effects. Neurobiol Aging. 2005;26:1271–1274. doi: 10.1016/j.neurobiolaging.2005.05.016. discussion 5–8. [DOI] [PubMed] [Google Scholar]
- Laird NM, Ware JH. Random-effects models for longitudinal data. Biometrics. 1982;38:963–974. [PubMed] [Google Scholar]
- Lindenberger U, von Oertzen T, Ghisletta P, Hertzog C. Cross-sectional age variance extraction: what’s change got to do with it? Psychol Aging. 2011;26:34–47. doi: 10.1037/a0020525. [DOI] [PubMed] [Google Scholar]
- Liu RS, Lemieux L, Bell GS, Sisodiya SM, Shorvon SD, Sander JW, Duncan JS. A longitudinal study of brain morphometrics using quantitative magnetic resonance imaging and difference image analysis. Neuroimage. 2003;20:22–33. doi: 10.1016/s1053-8119(03)00219-2. [DOI] [PubMed] [Google Scholar]
- Lupien SJ, Evans A, Lord C, Miles J, Pruessner M, Pike B, Pruessner JC. Hippocampal volume is as variable in young as in older adults: implications for the notion of hippocampal atrophy in humans. Neuroimage. 2007;34:479–485. doi: 10.1016/j.neuroimage.2006.09.041. [DOI] [PubMed] [Google Scholar]
- Mathalon DH, Sullivan EV, Rawles JM, Pfefferbaum A. Correction for head size in brain-imaging measurements. Psychiatry Res. 1993;50:121–139. doi: 10.1016/0925-4927(93)90016-b. [DOI] [PubMed] [Google Scholar]
- Pfefferbaum A, Lim KO, Zipursky RB, Mathalon DH, Rosenbloom MJ, Lane B, Ha CN, Sullivan EV. Brain gray and white matter volume loss accelerates with aging in chronic alcoholics: a quantitative MRI study. Alcohol Clin Exp Res. 1992;16:1078–1089. doi: 10.1111/j.1530-0277.1992.tb00702.x. [DOI] [PubMed] [Google Scholar]
- Pfefferbaum A, Mathalon DH, Sullivan EV, Rawles JM, Zipursky RB, Lim KO. A quantitative magnetic resonance imaging study of changes in brain morphology from infancy to late adulthood. Arch Neurol. 1994;51:874–887. doi: 10.1001/archneur.1994.00540210046012. [DOI] [PubMed] [Google Scholar]
- Pfefferbaum A, Rogosa DA, Rosenbloom MJ, Chu W, Sassoon SA, Kemper CA, Deresinski S, Rohlfing T, Zahr NM, Sullivan EV. Accelerated aging of selective brain structures in human immunodeficiency virus infection: a controlled, longitudinal magnetic resonance imaging study. Neurobiol Aging. 2014;35:1755–1768. doi: 10.1016/j.neurobiolaging.2014.01.008. [DOI] [PMC free article] [PubMed] [Google Scholar]
- Pfefferbaum A, Rohlfing T, Rosenbloom MJ, Chu W, Colrain IM, Sullivan EV. Variation in longitudinal trajectories of regional brain volumes of healthy men and women (ages 10 to 85 years) measured with atlas-based parcellation of MRI. Neuroimage. 2013;65:176–193. doi: 10.1016/j.neuroimage.2012.10.008. [DOI] [PMC free article] [PubMed] [Google Scholar]
- Rabbitt P. Between-individual variability and interpretation of associations between neurophysiological and behavioral measures in aging populations: comment on Salthouse (2011) Psychol Bull. 2011;137:785–789. doi: 10.1037/a0024580. [DOI] [PubMed] [Google Scholar]
- Raz N, Ghisletta P, Rodrigue KM, Kennedy KM, Lindenberger U. Trajectories of brain aging in middle-aged and older adults: regional and individual differences. Neuroimage. 2010;51:501–511. doi: 10.1016/j.neuroimage.2010.03.020. [DOI] [PMC free article] [PubMed] [Google Scholar]
- Raz N, Lindenberger U. Only time will tell: cross-sectional studies offer no solution to the age-brain-cognition triangle: comment on Salthouse (2011) Psychol Bull. 2011;137:790–795. doi: 10.1037/a0024503. [DOI] [PMC free article] [PubMed] [Google Scholar]
- Raz N, Lindenberger U, Rodrigue KM, Kennedy KM, Head D, Williamson A, Dahle C, Gerstorf D, Acker JD. Regional brain changes in aging healthy adults: general trends, individual differences, and modifiers. Cereb Cortex. 2005;15:1676–1689. doi: 10.1093/cercor/bhi044. [DOI] [PubMed] [Google Scholar]
- Raz N, Rodrigue KM. Differential aging of the brain: patterns, cognitive correlates and modifiers. Neurosci Biobehav Rev. 2006;30:730–748. doi: 10.1016/j.neubiorev.2006.07.001. [DOI] [PMC free article] [PubMed] [Google Scholar]
- Raz N, Rodrigue KM, Head D, Kennedy KM, Acker JD. Differential aging of the medial temporal lobe: a study of a five-year change. Neurology. 2004;62:433–438. doi: 10.1212/01.wnl.0000106466.09835.46. [DOI] [PubMed] [Google Scholar]
- Rohlfing T, Zahr NM, Sullivan EV, Pfefferbaum A. The SRI24 multichannel atlas of normal adult human brain structure. Hum Brain Mapp. 2010;31:798–819. doi: 10.1002/hbm.20906. [DOI] [PMC free article] [PubMed] [Google Scholar]
- Salthouse TA. All data collection and analysis methods have limitations: reply to Rabbitt (2011) and Raz and Lindenberger (2011) Psychol Bull. 2011a;137:796–799. doi: 10.1037/a0024843. [DOI] [PMC free article] [PubMed] [Google Scholar]
- Salthouse TA. Neuroanatomical substrates of age-related cognitive decline. Psychol Bull. 2011b;137:753–784. doi: 10.1037/a0023262. [DOI] [PMC free article] [PubMed] [Google Scholar]
- Schaie KW, Hofer SM. Longitudinal studies in aging research. In: Birren JE, Schaie KW, editors. Handbook of the Psychology of Aging. fifth. Academic Press; San Diego: 2001. pp. 53–77. [Google Scholar]
- Sullivan EV, Marsh L, Mathalon DH, Lim KO, Pfefferbaum A. Age-related decline in MRI volumes of temporal lobe gray matter but not hippocampus. Neurobiol Aging. 1995;16:591–606. doi: 10.1016/0197-4580(95)00074-o. [DOI] [PubMed] [Google Scholar]
- Sullivan EV, Marsh L, Pfefferbaum A. Preservation of hippocampal volume through adulthood in healthy men and women. Neurobiol Aging. 2005;26:1093–1098. doi: 10.1016/j.neurobiolaging.2004.09.015. [DOI] [PubMed] [Google Scholar]
- Sullivan EV, Pfefferbaum A, Swan GE, Carmelli D. Heritability of hippocampal size in elderly twin men: equivalent influence from genes and environment. Hippocampus. 2001;11:754–762. doi: 10.1002/hipo.1091. [DOI] [PubMed] [Google Scholar]
- Walhovd KB, Westlye LT, Amlien I, Espeseth T, Reinvang I, Raz N, Agartz I, Salat DH, Greve DN, Fischl B, Dale AM, Fjell AM. Consistent neuroanatomical age-related volume differences across multiple samples. Neurobiol Aging. 2011;32:916–932. doi: 10.1016/j.neurobiolaging.2009.05.013. [DOI] [PMC free article] [PubMed] [Google Scholar]
Associated Data
This section collects any data citations, data availability statements, or supplementary materials included in this article.