

Abstract
Scope
The gut microbiota is able to modulate host physiology through the production of bioactive metabolites. Our recent studies suggest that changes in gut microbiota composition upon prebiotics supplementation alter tissue levels of PUFA-derived metabolites in mice. However, in vivo evidence that gut microbes produces PUFA-derived metabolites is lacking. This study aimed to decipher the contribution of gut microbes versus that of the host in PUFA-derived metabolite production.
Methods and results
To achieve this goal, we compared the proportion of PUFA-derived metabolites and the expression of fatty acid desaturases in germ-free (GF) and conventionalized (CONV) mice fed either a low fat or Western diet.
Higher concentrations of PUFA-derived metabolites were found in the colonic contents of CONV mice compared to GF mice. The abundance of these metabolites in host tissues was modulated by dietary treatments but not by microbial status. Although microbial status did significantly influence desaturase expression, no correlations between host enzymes and tissue PUFA-derived metabolite levels were observed.
Conclusion
Together, these results highlight the ability of the gut microbiota to produce PUFA-derived metabolites from dietary PUFA. However, microbial production of these metabolites in colonic contents is not necessarily associated with modifications of their concentration in host tissues.
Keywords: gut microbiota, PUFA-derived metabolites, germ-free, western diet
Introduction
The trillions of bacteria residing in the gastrointestinal tract, known collectively as the gut microbiota, are well-known to influence host physiology [1]. Interactions between microbiota and host are, among others, mediated by bacterial production of active metabolites such as bile acids and short chain fatty acids [2, 3].
PUFA-derived metabolites have been associated with biological properties since feeding CLA to humans and animals was accompanied by anti-obesogenic, anti-atherogenic, anti-diabetogenic and anti-carcinogenic effects [13–18]. We proposed that PUFA-derived metabolites could be a new kind of active metabolites produced by the gut microbes. This hypothesis is supported by previous studies performed in ruminants indicating microbes play an important role in PUFA biotransformation. Rumen microbes are known to biohydrogenate PUFA such as linoleic acid (LA) and α-linolenic acid (α-LnA) into saturated fatty acid (stearic acid, C18:0) [4–6]. Through these pathways, numerous intermediates are also produced, including CLA (conjugated linoleic acids), CLnA (conjugated linolenic acids) as well as non-conjugated fatty acids such as vaccenic acid (trans-11-18:1). Other in vitro experiments have shown that bacteria isolated from human faeces are able to synthesize CLA, CLnA and vaccenic acid (trans-11-18:1) from LA or α-LnA [7–9]. Previous studies using feces, colon and caecal contents from germ-free (GF), gnotobiotic and conventional rodents indicated that gut microbes were capable of transforming LA into CLA during in vitro incubations [10, 11]. More recently, other metabolites derived from the PUFA saturation pathway were found to be present at higher levels in tissues from conventional versus GF mice, suggesting that gut microbial metabolism can affect host fatty acid composition [12]. However, whether gut microbes are required for CLA accumulation in host tissues remains controversial.
We previously showed that high-fat diet feeding and prebiotic supplementation were associated with a modulation of rumenic acid (CLA cis-9, trans-11-18:2) and vaccenic acid (trans-11-18:1) proportions in both caecal and subcutaneous adipose tissues [22, 23]. We also demonstrated that, after an oral load of PUFA, PUFA-derived metabolite production occurs predominantly in the distal part of the gut (caecum and colon) where the bacterial population is dense and diverse [24]. We also showed an accumulation of these PUFA-derived metabolites locally in the intestinal tissues. Although our previous results obtained in vivo in mice suggest that the gut microbiota is able to produce PUFA-derived metabolites, clear evidence of the implication of microbial production is lacking.
Here, we hypothesized that the gut microbiota is required for the in vivo production of PUFA-derived metabolites such as CLA, CLnA and non-conjugated fatty acids. To investigate this hypothesis, we performed a comprehensive analysis of the fatty acid profiles in both the colonic contents and host tissues of GF and CONV mice fed either a low fat (LFD) or western diet (WD). We also evaluated the role of host enzymes, including desaturases such as SCD-1 (stearoyl-CoA desaturase 1) and FADS3 (fatty acid desaturase 3), in modulating levels of PUFA-derived metabolites in host tissues to decipher the contribution of gut microbial metabolism versus host metabolism in modulating tissue fatty acid profiles. Indeed, recent studies showed that host enzymes could also modulate CLA profile in host tissues. Indeed, vaccenic acid (trans-11-18:1) could be desaturated into rumenic acid (CLA cis-9, trans-11-18:2) by a Δ9-desaturase (called stearoyl-CoA desaturase 1, SCD-1) in rodent or human tissues [25, 26]. In addition to SCD-1, FADS3 (fatty acid desaturase 3), another host desaturase, was characterized last year. This enzyme is able to transform vaccenic acid (trans-11-18:1) into CLA trans-11, cis-13-18:2 [27].
Materials and Methods
Animals and diets
Germ-free (GF) C3H/HeN male mice were bred and reared in flexible film isolators and maintained under germ free conditions with a 14 h light/10h dark cycle and controlled temperature and humidity. GF status of the breeding isolators was routinely checked by analyzing fresh feces using semi-quantitative PCR for 30 cycles and the universal bacteria primers 8F (AGAGTTTGATCCTGGCTCAG) and 1391R (GACGGGCGGTGWGTRCA) as well as by aerobic and anaerobic culture on tryptic soy agar plates and Brain Heart Infusion, Wilkins-Chalgren and Yeast Mold broths maintained at 37°C for seven days. GF status of the experimental isolator was checked at least twice, once before the introduction of the experimental diet and once during the last week of the experiment. GF C3H/HeN (5.5 week-old) mice were conventionalized via oral gavage with a caecal slurry from C3H/HeN conventional mice. Conventionalized mice (CONV) were subsequently housed in individually ventilated cages. Both CONV and GF mice were housed in the same animal room, maintained on autoclaved bedding, and fed the same autoclaved water and diet (LabDiets JL Rat and Mouse/Auto 6F 5K67, St. Louis, MO) during the period preceding introduction of experimental diets. Experimental diets were introduced nine days after conventionalization of C3H/HeN mice (8 mice/group) and fed for eight weeks. All animal procedures were conducted with the approval of the University of Nebraska-Lincoln Institutional Animal Care and Use Committee.
Experimental diets were prepared by Research Diets (New Brunswick, NJ) and sterilized by γ-irradiation (min 50 kGy, Neutron Products, Dickerson, MD). We used a customized Western Diet (45% kcal from fat and 17% kcal from sucrose with low maltodextrine/high starch compared to the D12451 formulation from Research Diets), as these mice were part of another experiment investigating the impact of various starches on metabolic syndrome that will be published elsewhere (Bindels LB, Walter J, Ramer-Tait AE). Composition of the experimental diets is presented in detail in Supplemental Table 1 and the fatty acid profile analyzed by GC-FID (gas chromatography with flame ionization detector) is presented in Supplemental Table 2.
Tissue samples
Mice were euthanized using carbon dioxide. At necropsy, livers, subcutaneous adipose tissues (SAT), colon tissues and colon contents were weighed and immediately flash frozen in liquid nitrogen. A piece of SAT was also fixed in RNA later (Ambion, Life Technologies, Grand Island, NY). All samples were stored at −80°C until use.
Fatty acid profile analysis
To determine the fatty acid profile in colonic contents, colon tissues and SAT, we utilized 25 mg of colonic contents, 30 mg of colon tissues or 20 mg of SAT [24]. Colonic contents, colon tissues and SAT and were homogenized in a methanol:chloroform mixture (1:2 V/V). Homogenates were filtered with Whatman filters N°1 (porosity 10 μm). Filters were rinsed with 2 ml of chloroform and 1 ml of methanol. Homogenates were purified successively with KCl 0.88% and KCl 0.88%:methanol (1:1 V/V). After centrifugation (1500g, 5 min), the chloroform phase was collected in new tubes and evaporated under a nitrogen flux.
The esterified fatty acids were then subjected to an alkaline hydrolysis (saponification). Briefly, a solution of KOH in methanol was added and incubated at 70°C for 1 hour. The free fatty acids were methylated by adding 0.4 ml of HCl in methanol (1.2 M) and incubating at 70°C for 20 minutes. FAME (fatty acid methyl esters) were then extracted with hexane.
Quantification of FAME was made by gas-liquid chromatography (Focus GC, Thermo-Finnigan, Interscience, Belgium). The chromatograph was equipped with a flame ionization detector and a 100 m capillary column (i.d. 0.25 mm, film thickness 0.20 μm; RT-2560, Restek, Interscience, Belgium) using H2 as the carrier gas at a constant flow of 1.5 ml/min. Oven temperature was initially set at 80°C, increased by 25°C/min to 175°C (held for 10 min), then increased by 1°C/min to 200°C (held for 15 min), and then increased again by 5°C/min to 215°C (held for 5 min) before being decreased by 20°C/min to 80°C. The flame ionization detector temperature was maintained at 250°C. The identification of each peak was made by comparing retention times with pure FAME standards (Larodan Fine Chemicals AB, Malmö, Sweden).
In accordance with an approach commonly used in the literature, PUFA and PUFA-derived metabolites in colonic content and host tissues were presented as percentages of identified fatty acids (Figure 1–3). However, we obtained similar results when PUFA and PUFA-derived metabolites were expressed in absolute amounts (mg of fatty acid/g of content or tissues) (Supplemental Table 3–5).
Figure 1. Profiles of PUFA and PUFA-derived metabolites (CLA and non-conjugated metabolites) in colonic contents of GF and CONV mice fed a low fat or western diet.

Results are expressed as a percentage of identified fatty acids. Data are presented as the mean ± SEM. Mean values with different letters are significantly different from one another (p<0.05) as determined by Tukey’s post hoc ANOVA statistical analysis.
Figure 3. Profiles of PUFA and PUFA-derived metabolites (CLA and non-conjugated metabolites) in the subcutaneous adipose tissue (SAT) of GF and CONV mice fed a low fat or western diet.

Results are expressed as a percentage of identified fatty acids. Data are presented as the mean ± SEM. Mean values with different letters are significantly different from one another (p<0.05) as determined by Tukey’s post hoc ANOVA statistical analysis.
Real-time quantitative PCR
Total RNA was extracted using the TriPure isolation reagent (Roche Diagnostics Belgium, Vilvoorde, Belgium) according to manufacturer’s instructions, with an additional step for the SAT (samples were heated at 60°C for 5 min after homogenization in Tripure). RNA quality was checked for a subset of samples using an Agilent 2100 Bioanalyzer (Agilent Technologies, Santa Clara, CA). cDNA was prepared via reverse transcription of 1 μg of total RNA using the Kit Reverse transcription System (Promega, Leiden, The Netherlands). For the liver, real-time PCR was performed with the SetpOnePlus™ real-time PCR system and software (Applied Biosystems, Den Ijssel, The Netherlands) using SYBR-Green (Mesa Fast qPCR™, Eurogentec, Seraing, Belgium) for detection. For the SAT, real-time PCR was performed with an Eppendorff Mastercycler ep realplex using SYBR Green (5Prime RealMasterMix SYBR ROX, Gaithersburg, MD) for detection. Ribosomal protein L4 (RPL4) was chosen as housekeeping gene to normalize the data, which was analyzed according to the 2−ΔΔCT method [28]. Primer sequences for the targeted mouse genes are RPL4 F: CAAGAAGACCAAGGAGGCTGT; RPL4 R: GGTTTCTCATTTTGCCCTTG; SCD-1 F: CCTCTTCGGGATTTTCTACTACATG; SCD-1 R: GCCGTGCCTTGTAAGTTCTGT; FADS3 F: TGCTGTGGGCTGCCAGTT; FADS3 R: CACCCTGACAGCAACGAAGA.
Fecal microbiota analysis
Fecal microbiota composition was analyzed by 16S rRNA gene sequencing of fecal samples in the context of an independent project dedicated to the investigation of the impact of various starches on metabolic syndrome that will be published elsewhere (Bindels LB, Walter J, Ramer-Tait AE).
Genomic DNA was extracted from feces using a QIAamp DNA Stool Mini Kit (Qiagen, Valencia, CA) according to the manufacturer’s instructions, including a bead beating step in lysozyme-based buffer. Briefly, the V5-V6 region of the 16S rRNA gene was PCR-enriched, with further tailing. Amplicons were purified, quantified and sequenced using an Illumina Miseq (v3 kit) to produce 2x 300 bp sequencing products. Initial quality filtering of the reads was performed with the Illumina Software. Quality scores were visualized with the FastQC software (http://www.bioinformatics.babraham.ac.uk/publications.html), and reads were trimmed to 250 bp (R1) and 230 bp (R2) with the FASTX-Toolkit (http://hannonlab.cshl.edu/fastx_toolkit/). Next, reads were merged with the merge-illumina-pairs application (with p-value = 0.02, enforced Q30 check, perfect matching to primers which are removed by the software, and otherwise default settings including no ambiguous nucleotides allowed) [29]. For samples with >20000 merged reads, a subset of 20000 reads was randomly selected using Mothur 1.32.1 centos 5.5 for Linux [30] to avoid large disparities in the number of sequences. Putative chimeras were identified against the Gold reference database and removed using the UPARSE pipeline implemented in USEARCH v7.0.1001 [31]. For this study, we focused our analysis on CLA-producing bacteria previously identified during in vitro studies described in the literature [7–9]. Bioinformatics searches (BLAST) for bacteria known to produce PUFA-derived metabolites were performed on the dataset in order to analyze the impact of the WD on the number of CLA-producing bacteria. Results were expressed in percent proportions based on the total number of sequences in each sample. Full protocol and accession numbers are provided in supplementary materials and methods.
Statistical analysis
Data are presented as the mean ± SEM. Statistical significance of difference between groups was assessed by one-way analysis of variance (ANOVA) followed by post hoc Tukey’s multiple comparison test (GraphPad Prism Software, San Diego, CA, USA). P < 0.05 was considered as statistically significant. Mean values with different letters are significantly different from one another (p<0.05) as determined by Tukey’s post hoc ANOVA statistical analysis. Regarding the analysis of gut microbiota composition performed only in CONV mice, statistical significance of difference between the 2 groups was assessed by Student t-test (GraphPad Prism Software, San Diego, CA, USA).
Results
Synthesis of PUFA-derived metabolites in colonic contents is influenced by both microbial metabolism and diet
Neither microbial status of the mice (GF versus CONV) nor dietary treatment (LFD versus WD) altered PUFA (LA and α-LnA) proportions in colonic contents (Figure 1A and B). Despite no difference in PUFA proportions, we did, however, observe a clear difference between levels of PUFA-derived metabolites present in GF and CONV mice when all were fed a LFD. Specifically, proportions of CLA cis-9, trans-11-18:2, CLA trans-11, trans-13-18:2 and CLA trans-9, trans-11-18:2 were all significantly higher in CONV mice compared to GF mice (Figure 1C, E and F). Although not significant, the abundance of CLA trans-10, cis-12-18:2 also tended to be higher in CONV mice compared to GF mice (Figure 1D). Levels of non-conjugated metabolites (trans-10-18:1 and trans-11-18:1) were also significantly increased in CONV mice compared to GF mice when all were fed a LFD (Figure 1G and H). WD feeding did not change PUFA (LA and α-LnA) or PUFA-derived metabolite proportions in colonic contents of GF mice (Figure 1). However, WD feeding did decrease the proportions of PUFA-derived metabolites present in the colonic contents of CONV mice (Figure 1C–H) even though WD feeding did not modify PUFA proportions (Figure 1A–B).
Levels of PUFA-derived metabolites in host tissues are influenced by diet but not by microbial metabolism
WD feeding of both GF and CONV mice significantly increased the presence of LA in colonic tissues (Figure 2A). However, tissue abundance of α-LnA was not modified by microbial status of the mice (GF or CONV) or by dietary treatment (LFD or WD) (Figure 2B). In colonic tissues, proportions of the two major CLA isomers, rumenic acid (CLA cis-9, trans-11-18:2) and CLA trans-10, cis-12-18:2, were found to be similar among all treatments (Figure 2C and D), as were proportions of the minor CLA isomers trans-11, trans-13-18:2 and trans-9, trans-11-18:2 between GF and CONV mice fed the same diet (Figure 2E and F). However, their proportions were decreased in both GF and CONV mice fed a WD as compared to a LFD (Figure 2E and F). Levels of non-conjugated PUFA metabolites were not influenced by the microbial status of the mice (Figure 2G and H). However, the proportion of trans-10-18:1 was significantly increased in CONV mice fed a WD (Figure 2G). Although not significant, similar trends were also observed for vaccenic acid levels in the colon tissues of both GF and CONV mice fed a WD (Figure 2H).
Figure 2. Profiles of PUFA and PUFA-derived metabolites (CLA and non-conjugated metabolites) in colon tissues of GF and CONV mice fed a low fat or western diet.

Results are expressed as a percentage of identified fatty acids. Data are presented as the mean ± SEM. Mean values with different letters are significantly different from one another (p<0.05) as determined by Tukey’s post hoc ANOVA statistical analysis.
An evaluation of the fatty acid profile in subcutaneous adipose tissue (SAT) revealed that LA levels were significantly increased by WD feeding of both GF and CONV mice (Figure 3A). An opposite effect was observed for the proportion of α-LnA, which was significantly decreased by WD feeding both in GF and CONV mice (Figure 3B). Rumenic acid (CLA cis-9, trans-11-18:2) proportions were significantly increased by WD feeding, but were not influenced by the microbial status of the mice (Figure 3C). WD feeding decreased proportions of the CLA isomers trans-11, trans-13-18:2 and trans-9, trans-11-18:2 in both GF and CONV mice (Figure 3E and F), a phenomenon consistent with that observed in colonic tissues. Of note, CLA trans-11, trans-13-18:2 was the only PUFA-derived metabolite whose tissue levels were regulated by microbial status (Figure 3E).
Abundance of the non-conjugated PUFA derivative trans-10-18:1 was increased by WD feeding of both GF and CONV mice (Figure 3G). WD feeding had no effect on vaccenic acid (trans-11-18:1) levels in GF or CONV mice compared to LFD feeding (Figure 3H). However, the proportion of vaccenic acid (trans-11-18:1) tended to be higher in CONV mice compared to GF mice when both were fed a LFD (Figure 3H).
Both microbial status and dietary treatment influence desaturase mRNA expression and desaturation ratios
Given the discrepancy between host tissues and colonic contents regarding the abundance of PUFA-derived metabolites, we sought to determine if changes in host enzymes could explain our findings. To that end, we estimated the activity and analysed the mRNA expression of SCD-1 (stearoyl-CoA desaturase 1), a Δ9-desaturase known to desaturate vaccenic acid (trans-11-18:1) into rumenic acid (CLA cis-9, trans-11-18:2) and FADS3 (fatty acid desaturase 3), another host desaturase recently described to transform vaccenic acid (trans-11-18:1) into CLA trans-11, cis-13-18:2 [27].
An estimation of SCD-1 activity was performed by calculating the ratio between the product (cis-9-16:1) and the substrate (16:0) of this enzyme, known as the “desaturation ratio”. No significant differences were observed among the various treatments for the cis-9-16:1/16:0 ratios in colon tissues (Figure 4A). In both the liver and SAT, WD feeding decreased the cis-9-16:1/16:0 ratios (Figure 4B and C). In the SAT, this ratio was significantly higher in GF mice compared to CONV mice when both were fed a LFD; however, this difference disappeared when a WD was fed (Figure 4C). Microbial status did not have an impact on hepatic cis-9-16:1/16:0 ratios (Figure 4B). No differences in the cis-9-18:1/18:0 ratios were observed in the colons, livers or SAT of mice from any treatment (data not shown).
Figure 4. SCD-1 desaturation ratios (cis-9-16:1/16:0) for colon, liver and subcutaneous adipose tissue (SAT) of GF and CONV mice fed a low fat or western diet.
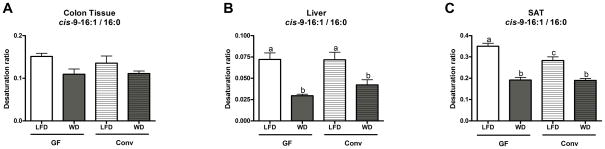
Data are presented as the mean ± SEM. Mean values with different letters are significantly different from one another (p<0.05) as determined by Tukey’s post hoc ANOVA statistical analysis.
Given the significant changes observed in the hepatic and SAT desaturation ratios, we sought to analyse desaturase mRNA expression in these tissues. No significant differences in FADS3 mRNA expression were observed between GF and CONV mice or between LFD and WD fed mice in either tissue (Figure 5A and B). In the SAT, WD feeding significantly decreased SCD-1 mRNA expression in both GF and CONV mice compared to LFD feeding; these alterations were independent of microbial status (Figure 5D). Feeding a WD significantly decreased hepatic SCD-1 expression in GF mice but not in CONV mice (Figure 5C). Of note, hepatic SCD-1 mRNA expression was 1.8 fold higher in GF mice compared to CONV mice when a LFD was fed, but that increase was not statistically significant (p = 0.08, Student t-test).
Figure 5. SCD-1 and FADS3 mRNA expression in liver and subcutaneous adipose tissue (SAT) of GF and CONV mice fed a low fat or western diet.

Data are presented as the mean ± SEM. Mean values with different letters are significantly different from one another (p<0.05) as determined by Tukey’s post hoc ANOVA statistical analysis.
Western diet feeding altered the abundance of the bacteria known to produce PUFA-derived metabolites
Given our observations of decreased PUFA derivatives in CONV mice fed a WD, we performed a next-generation sequencing analysis of the fecal microbiota to determine changes in abundance of CLA-producing bacteria. Our analysis revealed that feeding a WD to CONV mice significantly decreased abundance of Lachnospiraceae family members as well as the species Roseburia intestinalis (Table 1). WD feeding also tended to decrease numbers of Roseburia hominis (Table 1). Members of the Bifidobacterium genus were undetectable in our analysis.
Table 1.
Bioinformatics analysis using BLAST searches for bacteria known to produce PUFA-derived metabolites.
| LFD | WD | |
|---|---|---|
| Lachnospiraceae family | 51,59 ± 1,46 | 46,04 ± 1,91 * |
| Lactobacillus genus | 0,009 ± 0,0045 | 0,024 ± 0,0073 |
| Roseburia intestinalis | 9,71 ± 1,32 | 2,43 ± 0,94 *** |
| Roseburia hominis | 2,26 ± 0,50 | 1,68 ± 0,35 |
CONV mice were fed either a low fat or a western diet. Data are expressed as relative abundance (%) normalized to the total number of sequences and presented as the mean ± SEM.
p < 0.05;
p < 0.001 as determined by a Student t-test.
Discussion
Previous studies have suggested that the gut microbiota is capable of producing PUFA-derived metabolites in vivo. However, studies documenting the unequivocal contribution of gut microbial metabolism to the synthesis of PUFA-derived metabolites were lacking. By comparing the levels of PUFA-derived metabolites (mainly CLA and non-conjugated fatty acids) present in GF and CONV mice fed either a LFD or a WD, we present clear evidence that the gut microbiota is required for the synthesis of dietary PUFA-derived metabolites in colonic contents.
For most of the FA considered as bacterial PUFA-derived metabolites (vaccenic acid; trans-10-18:1; rumenic acid; CLA trans-11, trans-13-18:2; CLA trans-9, trans-11-18:2), we observed a considerable increase of their abundance in CONV compared to GF mice when a LFD was fed. The higher levels of PUFA-derived metabolites in the colonic contents of CONV mice compared to GF mice highlight the major contribution of the gut microbiota to PUFA metabolite proportions found in colonic contents. The presence of some PUFA-derived metabolites in the colonic contents of GF mice (i.e. cis-9, trans-11-18:2; trans-10, cis-12-18:2 or trans-11-18:1) must be interpreted as a consequence of their presence in the diets.
In colonic contents, WD feeding of CONV mice was associated with decreased proportions of PUFA-derived metabolites as compared to the LFD fed mice. This decrease in PUFA-derived metabolites could be due to a shift in gut microbiota composition and/or activity induced by the WD. Indeed, WD feeding significantly decreased the fecal abundance of the Lachnospiraceae family members and the species Roseburia intestinalis, two bacterial taxa known for their in vitro production of PUFA-derived metabolites.
In a previous study where mice were force-fed vegetable oils, we observed that the fatty acid profiles found in intestinal tissues were in accordance with those observed in intestinal contents [24]. However, in the present long-term study, analysis of the PUFA-derived metabolites revealed discrepancies between colonic contents and host tissues (colon, SAT). Specifically, proportions of most PUFA-derived metabolites found in the colon tissue were similar between GF and CONV mice whereas the levels of these metabolites were higher in the colonic content of CONV mice compared to GF mice.
Previous studies analysing the accumulation of CLA produced by gut microbes in host tissue provided conflicting results [10–12]. One study reported no difference in CLA accumulation in host tissue between GF and gnotobiotic rats whereas another study reported that LA supplementation led to an increased CLA content in host tissues of conventional rats but not in GF rats [10, 11]. Altogether, our results lead us to propose that in this study, the bacterial production of PUFA-derived metabolites does not influence host tissue fatty acid profiles. However, Kishino et al. have shown that higher levels of metabolites derived from PUFA saturation pathway are found in tissues of conventional but not GF mice, suggesting that gut microbe metabolism is able to modulate host fatty acid composition [12]. Furthermore, we showed in a previous study, that upon prebiotic supplementation, production of PUFA-derived metabolites was increased and able to modulate fatty acid profile in intestinal tissue and SAT [22, 23]. Therefore, as only a few subset of bacteria are able to produce these PUFA-derived metabolites [7–9], we propose that the contribution of the gut microbial metabolism to tissue fatty acid profile could only become significant upon stimulation of these bacteria (with prebiotics for instance). It is also tempting to speculate that the FA profile found in colon tissues is merely influenced by the FA profile present in the diet. However, in the colon tissues of both GF and CONV mice, we observed higher proportions of the CLA isomers trans-11, trans-13-18:2 and trans-9, trans-11-18:2 in LFD fed mice compared to WD fed mice. These results suggest that tissue levels of these two minor isomers are not directly related to their concentrations in the diets, as they were present in higher quantity in the WD compared to the LFD.
In view of these observations, we hypothesize that host metabolism influences the proportion of CLA isomers found not only in colon tissue, but also in liver and SAT, and that some lipid moieties classically attributed to bacterial metabolism are also synthesized in host tissues from precursors present in the diet. Indeed, host enzymes, mainly desaturases, can produce CLA from vaccenic acid (MUFA; trans-11-18:1). Specifically, the host enzymes SCD-1 and FADS3 are able to introduce a double bond in vaccenic acid [25–27]; SCD-1 introduces a double bond in the Δ9 position whereas FADS3 introduces a double bond in the Δ13 position, leading to the formation of CLA cis-9, trans-11-18:2 and CLA trans-11, cis-13-18:2, respectively [25–27].
To assess the role of SCD-1 in the modulation of tissue PUFA-derived metabolite profiles, we estimated SCD-1 activity by calculating “desaturation ratios” in colon, liver and adipose tissues. Desaturation ratios describe the ratio between the MUFA produced by SCD-1 (palmitoleic acid and oleic acid) and the corresponding saturated fatty acid used by SCD-1 (stearic acid and palmitic acid) [32, 33]. The cis-9-16:1/16:0 ratio was decreased by WD feeding independently of the microbial status of the mice both in the liver and in the SAT. Given the modulation of desaturation ratios in the liver and SAT, we then measured the mRNA expression of SCD-1 and FADS3 in these tissues. FADS3 mRNA expression in the liver and SAT was not influenced by microbial status or dietary treatment. This finding indicates that modulation of FADS3 expression was not involved in the changes of PUFA-derived metabolite proportions observed in the SAT (mainly CLA isomers trans-11, trans-13-18:2 and trans-9, trans-11-18:2). However, mRNA expression of FADS3 has been shown to not correlate with its translation rate [34]. Future studies assessing FADS3 protein expression and enzymatic activity may provide additional insight into the relationship between this enzyme and the changes observed in PUFA-derived metabolites in host tissues. Hepatic SCD-1 mRNA expression was decreased by WD feeding in GF mice but not in CONV mice. In the SAT, SCD-1 mRNA expression was decreased by WD feeding in both GF and CONV mice. This observation could be linked to elevated dietary levels of MUFA and PUFA since it was reported that PUFA decrease SCD-1 expression [35, 36].
In conclusion, this study provides clear evidence of the contribution of the gut microbial metabolism in PUFA-derived metabolite synthesis and abundance of these metabolites in colonic content. However, the microbial production of these metabolites in colonic contents is not necessarily associated with modifications of their concentration in host tissues. In fact, some CLA and CLnA metabolites are produced by the actions of specific enzymes expressed in liver or adipose tissues on trans fatty acids or CLA/CLnA found in fatty diets that can be absorbed mostly in the jejunum. Further exploration of host metabolism related to the oxidation/storage of those “novel” fatty acids would therefore be of great interest.
Supplementary Material
Acknowledgments
We thank Rafael Segura Munoz, Joao Carlos Gomes Neto, Elizabeth Cody, Dr. Maria Isabel Quintero-Villegas, and Hatem Kittana for assistance with tissue sampling and in vivo experiments; Dr. Inés Martínez for guidance in next-generation sequencing analysis; and Brandon White and the UNL Gnotobiotic Mouse Facility staff for skillful animal husbandry. PDC is a research associate at FRS-FNRS (Fonds de la Recherche Scientifique) and recipient of grants from the FNRS and FRSM (Fonds de la recherche scientifique médicale, Belgium) and ARC (Action de Recherche Concertée). PDC is a recipient of ERC Starting Grant 2013 (European Research Council, Starting grant 336452-ENIGMO). CD benefits from a Danone Institute grant. LBB was supported by a complementary post-doctoral grant awarded by the FSR (Fonds Spécial de Recherche, Université catholique de Louvain). AERT acknowledges funding from the Nebraska Corn Board, University of Nebraska-Lincoln, and NIH NIGMS 1P20GM104320. NMD is recipient of grants from the FNRS and FRSM (Fonds de la recherche scientifique médicale, Belgium).
List of abbreviations
- α-LnA
α-linolenic acid
- CLA
conjugated linoleic acids
- CLnA
conjugated linolenic acids
- CONV
conventionalized
- FADS3
fatty acid desaturase 3
- GC-FID
gas chromatography with flame ionization detector
- GF
germ-free
- LA
linoleic acid
- LFD
low fat diet
- RPL4
Ribosomal protein L4
- SAT
subcutaneous adipose tissue
- SCD-1
stearoyl-CoA desaturase 1
- WD
Western diet
Footnotes
Author contributions
CD and LBB performed the experiments, analyzed the data and wrote the manuscript. RS performed experiments. AMN, PDC, JW, AERT and NMD provided intellectual input and reviewed the manuscript. AERT and NMD planned and reviewed all experiments and manuscript preparation.
References
- 1.Pluznick JL. Gut microbes and host physiology: what happens when you host billions of guests? Front Endocrinol (Lausanne) 2014;5:91. doi: 10.3389/fendo.2014.00091. [DOI] [PMC free article] [PubMed] [Google Scholar]
- 2.Louis P, Hold GL, Flint HJ. The gut microbiota, bacterial metabolites and colorectal cancer. Nat Rev Microbiol. 2014;12:661–672. doi: 10.1038/nrmicro3344. [DOI] [PubMed] [Google Scholar]
- 3.Brestoff JR, Artis D. Commensal bacteria at the interface of host metabolism and the immune system. Nat Immunol. 2013;14:676–684. doi: 10.1038/ni.2640. [DOI] [PMC free article] [PubMed] [Google Scholar]
- 4.Jenkins TC, Wallace RJ, Moate PJ, Mosley EE. Board-invited review: Recent advances in biohydrogenation of unsaturated fatty acids within the rumen microbial ecosystem. J Anim Sci. 2008;86:397–412. doi: 10.2527/jas.2007-0588. [DOI] [PubMed] [Google Scholar]
- 5.Bauman DE, Baumgard LH, Corl BA, Griinari JM. Biosynthesis of conjugated linoleic acid in ruminants. J Anim Sci. 2000;77:1ae–15ae. [Google Scholar]
- 6.Chilliard Y, Glasser F, Ferlay A, Bernard L, et al. Diet, rumen biohydrogenation and nutritional quality of cow and goat milk fat. Eur J Lipid Sci Technol. 2007;109:828–855. [Google Scholar]
- 7.Gorissen L, Raes K, Weckx S, Dannenberger D, et al. Production of conjugated linoleic acid and conjugated linolenic acid isomers by Bifidobacterium species. Appl Microbiol Biotechnol. 2010;87:2257–2266. doi: 10.1007/s00253-010-2713-1. [DOI] [PubMed] [Google Scholar]
- 8.Devillard E, McIntosh FM, Duncan SH, Wallace RJ. Metabolism of linoleic acid by human gut bacteria: different routes for biosynthesis of conjugated linoleic acid. J Bacteriol. 2007;189:2566–2570. doi: 10.1128/JB.01359-06. [DOI] [PMC free article] [PubMed] [Google Scholar]
- 9.O’Shea EF, Cotter PD, Stanton C, Ross RP, Hill C. Production of bioactive substances by intestinal bacteria as a basis for explaining probiotic mechanisms: bacteriocins and conjugated linoleic acid. Int J Food Microbiol. 2012;152:189–205. doi: 10.1016/j.ijfoodmicro.2011.05.025. [DOI] [PubMed] [Google Scholar]
- 10.Chin SF, Storkson JM, Liu W, Albright KJ, Pariza MW. Conjugated linoleic acid (9,11- and 10,12-octadecadienoic acid) is produced in conventional but not germ-free rats fed linoleic acid. J Nutr. 1994;124:694–701. doi: 10.1093/jn/124.5.694. [DOI] [PubMed] [Google Scholar]
- 11.Kamlage B, Hartmann L, Gruhl B, Blaut M. Intestinal microorganisms do not supply associated gnotobiotic rats with conjugated linoleic acid. J Nutr. 1999;129:2212–2217. doi: 10.1093/jn/129.12.2212. [DOI] [PMC free article] [PubMed] [Google Scholar]
- 12.Kishino S, Takeuchi M, Park SB, Hirata A, et al. Polyunsaturated fatty acid saturation by gut lactic acid bacteria affecting host lipid composition. Proc Natl Acad Sci U S A. 2013;110:17808–17813. doi: 10.1073/pnas.1312937110. [DOI] [PMC free article] [PubMed] [Google Scholar]
- 13.Kelley NS, Hubbard NE, Erickson KL. Conjugated linoleic acid isomers and cancer. J Nutr. 2007;137:2599–2607. doi: 10.1093/jn/137.12.2599. [DOI] [PubMed] [Google Scholar]
- 14.Reynolds CM, Roche HM. Conjugated linoleic acid and inflammatory cell signalling. Prostaglandins Leukot Essent Fatty Acids. 2010;82:199–204. doi: 10.1016/j.plefa.2010.02.021. [DOI] [PubMed] [Google Scholar]
- 15.Wang YW, Jones PJ. Conjugated linoleic acid and obesity control: efficacy and mechanisms. Int J Obes Relat Metab Disord. 2004;28:941–955. doi: 10.1038/sj.ijo.0802641. [DOI] [PubMed] [Google Scholar]
- 16.Houseknecht KL, Vanden Heuvel JP, Moya-Camarena SY, Portocarrero CP, et al. Dietary conjugated linoleic acid normalizes impaired glucose tolerance in the Zucker diabetic fatty fa/fa rat. Biochem Biophys Res Commun. 1998;244:678–682. doi: 10.1006/bbrc.1998.8303. [DOI] [PubMed] [Google Scholar]
- 17.Toomey S, Harhen B, Roche HM, Fitzgerald D, Belton O. Profound resolution of early atherosclerosis with conjugated linoleic acid. Atherosclerosis. 2006;187:40–49. doi: 10.1016/j.atherosclerosis.2005.08.024. [DOI] [PubMed] [Google Scholar]
- 18.Dilzer A, Park Y. Implication of conjugated linoleic acid (CLA) in human health. Crit Rev Food Sci Nutr. 2012;52:488–513. doi: 10.1080/10408398.2010.501409. [DOI] [PubMed] [Google Scholar]
- 19.Evans M, Brown J, McIntosh M. Isomer-specific effects of conjugated linoleic acid (CLA) on adiposity and lipid metabolism. J Nutr Biochem. 2002;13:508. doi: 10.1016/s0955-2863(02)00211-5. [DOI] [PubMed] [Google Scholar]
- 20.Churruca I, Fernandez-Quintela A, Portillo MP. Conjugated linoleic acid isomers: differences in metabolism and biological effects. Biofactors. 2009;35:105–111. doi: 10.1002/biof.13. [DOI] [PubMed] [Google Scholar]
- 21.Martin JC, Valeille K. Conjugated linoleic acids: all the same or to everyone its own function? Reprod Nutr Dev. 2002;42:525–536. doi: 10.1051/rnd:2002042. [DOI] [PubMed] [Google Scholar]
- 22.Druart C, Neyrinck AM, Dewulf EM, De Backer FC, et al. Implication of fermentable carbohydrates targeting the gut microbiota on conjugated linoleic acid production in high-fat-fed mice. Br J Nutr. 2013:1–14. doi: 10.1017/S0007114513000123. [DOI] [PubMed] [Google Scholar]
- 23.Neyrinck AM, Possemiers S, Druart C, Van de Wiele T, et al. Prebiotic effects of wheat arabinoxylan related to the increase in bifidobacteria, Roseburia and Bacteroides/Prevotella in diet-induced obese mice. PLoS One. 2011;6:e20944. doi: 10.1371/journal.pone.0020944. [DOI] [PMC free article] [PubMed] [Google Scholar]
- 24.Druart C, Neyrinck AM, Vlaeminck B, Fievez V, et al. Role of the lower and upper intestine in the production and absorption of gut microbiota-derived PUFA metabolites. PLoS One. 2014;9:e87560. doi: 10.1371/journal.pone.0087560. [DOI] [PMC free article] [PubMed] [Google Scholar]
- 25.Santora JE, Palmquist DL, Roehrig KL. Trans-vaccenic acid is desaturated to conjugated linoleic acid in mice. J Nutr. 2000;130:208–215. doi: 10.1093/jn/130.2.208. [DOI] [PubMed] [Google Scholar]
- 26.Turpeinen AM, Mutanen M, Aro A, Salminen I, et al. Bioconversion of vaccenic acid to conjugated linoleic acid in humans. Am J Clin Nutr. 2002;76:504–510. doi: 10.1093/ajcn/76.3.504. [DOI] [PubMed] [Google Scholar]
- 27.Rioux V, Pedrono F, Blanchard H, Duby C, et al. Trans-vaccenate is Delta13-desaturated by FADS3 in rodents. J Lipid Res. 2013;54:3438–3452. doi: 10.1194/jlr.M042572. [DOI] [PMC free article] [PubMed] [Google Scholar]
- 28.de Jonge HJ, Fehrmann RS, de Bont ES, Hofstra RM, et al. Evidence based selection of housekeeping genes. PLoS One. 2007;2:e898. doi: 10.1371/journal.pone.0000898. [DOI] [PMC free article] [PubMed] [Google Scholar]
- 29.Eren AM, Vineis JH, Morrison HG, Sogin ML. A filtering method to generate high quality short reads using illumina paired-end technology. PLoS One. 2013;8:e66643. doi: 10.1371/journal.pone.0066643. [DOI] [PMC free article] [PubMed] [Google Scholar]
- 30.Schloss PD, Westcott SL, Ryabin T, Hall JR, et al. Introducing mothur: open-source, platform-independent, community-supported software for describing and comparing microbial communities. Appl Environ Microbiol. 2009;75:7537–7541. doi: 10.1128/AEM.01541-09. [DOI] [PMC free article] [PubMed] [Google Scholar]
- 31.Edgar RC. UPARSE: highly accurate OTU sequences from microbial amplicon reads. Nat Methods. 2013;10:996–998. doi: 10.1038/nmeth.2604. [DOI] [PubMed] [Google Scholar]
- 32.Lee KN, Pariza MW, Ntambi JM. Conjugated linoleic acid decreases hepatic stearoyl-CoA desaturase mRNA expression. Biochem Biophys Res Commun. 1998;248:817–821. doi: 10.1006/bbrc.1998.8994. [DOI] [PubMed] [Google Scholar]
- 33.Attie AD, Krauss RM, Gray-Keller MP, Brownlie A, et al. Relationship between stearoyl-CoA desaturase activity and plasma triglycerides in human and mouse hypertriglyceridemia. J Lipid Res. 2002;43:1899–1907. doi: 10.1194/jlr.m200189-jlr200. [DOI] [PubMed] [Google Scholar]
- 34.Pedrono F, Blanchard H, Kloareg M, D’Andrea S, et al. The fatty acid desaturase 3 gene encodes for different FADS3 protein isoforms in mammalian tissues. J Lipid Res. 2010;51:472–479. doi: 10.1194/jlr.M000588. [DOI] [PMC free article] [PubMed] [Google Scholar]
- 35.Ntambi JM, Miyazaki M. Regulation of stearoyl-CoA desaturases and role in metabolism. Prog Lipid Res. 2004;43:91–104. doi: 10.1016/s0163-7827(03)00039-0. [DOI] [PubMed] [Google Scholar]
- 36.Waters KM, Ntambi JM. Polyunsaturated fatty acids inhibit hepatic stearoyl-CoA desaturase-1 gene in diabetic mice. Lipids. 1996;31(Suppl):S33–36. doi: 10.1007/BF02637047. [DOI] [PubMed] [Google Scholar]
Associated Data
This section collects any data citations, data availability statements, or supplementary materials included in this article.