

Abstract
Purpose
Brain myelin plays an important role in normal brain function. Demyelination is involved in many degenerative brain diseases and thus quantitative imaging of myelin has been under active investigation. In previous work, we demonstrated the capability of the method known as Relaxation Along a Fictitious Field (RAFF) in the rotating frame of rank n (RAFFn) to provide image contrast between white and grey matter in human and rat brains. Here, we provide evidence pointing to myelin being the major source of this contrast.
Methods
RAFFn relaxation time constant (TRAFFn) was mapped in rat brain ex vivo. TRAFFn was quantified in 12 different brain areas. TRAFFn values were compared with multiple other MRI metrics (T1, T2, continuous wave T1ρ, adiabatic T1ρ and T2ρ, magnetization transfer ratio), and with histologic measurements of cell density, myelin and iron content.
Results
Highest contrast between white and grey matter was obtained with TRAFFn in the rotating frames of ranks n = 4 and 5. TRAFFn values correlated strongly with myelin content, whereas no associations between TRAFFn and iron content or cell density were found.
Conclusion
TRAFFn with n = 4 or 5 provides a high sensitivity for selective myelin mapping in the rat brain.
Introduction
Myelin measurement by MRI has the potential to provide critical information about the normal development of the nervous system as well as about a variety of neurological disorders, including Parkinson’s and Alzheimer’s diseases, traumatic brain injury, and multiple sclerosis. Quantitative myelin mapping using MRI is currently of great interest, and different methods for indirect myelin imaging and quantification have been proposed. Some MRI modalities used to assess myelin include: diffusion tensor imaging (1), magnetization transfer (2), and T1/T2 ratio (3). Although diffusion tensor imaging is sensitive to tissue microstructure, it is not specific to myelin (4). Magnetization transfer and T2-weighted MRI have been shown to be more specific to myelin, but the interpretation of the results remains somewhat obscure due to a number of experimental confounds.
The highly organized structure of myelin has been shown to contain multi-compartment water environments: myelinic, intra-axonal, and interaxonal. These pools are characterized by different T2 relaxation components which correspond, respectively, to short- (<50 ms), intermediate-, and long-lived components. The short component is attributed mainly to myelin water, whereas an ultra-short component (50 μs < T2 < 1 ms) is thought to arise from carbon-bound methylene protons (2, 5).
Ultra-short echo time imaging has been used recently for direct myelin detection (6). With this method, signal from the short T2 components was detected and attributed predominantly to myelin. It has been shown that myelin content contributes significantly to the ultra-short echo time imaging signal, however several other structures such as cell membranes, cell nuclei and mitochondria have short T2 components which may potentially impact the myelin quantification as detected using ultra-short echo time imaging.
One promising development which is useful for myelin quantification is susceptibility weighted imaging, where the phase of the MR signal is used to modulate signal in the MR image (7, 8). The grey matter (GM) white matter (WM) contrast in susceptibility weighted imaging has been found to be associated with the myelin content of white matter. The contrast originates mainly from a frequency shift between myelin-rich white and grey matter, which is in the range of a few Hz depending on B0 and brain area (7, 8).
The rotating frame relaxation time constant T1ρ has been shown to be sensitive to a molecular motional regime in the range of the effective frequency of the spin lock, which is typically from a few hundred of hertz to several kilohertz. A common limitation to the clinical application of T1ρ is its relatively high specific absorption rate (SAR). We recently introduced a method entitled Relaxation Along a Fictitious Field (RAFF) in the second rotating frame of reference (RAFF2) which can measure relaxation dispersion based on fictitious fields using decreased SAR (9). With this method, a correlation between RAFF relaxation time constant (TRAFF) and histologically derived cell density in a rat glioma gene therapy model was demonstrated (10, 11). Subsequently, this method was further extended to the rotating frames of higher ranks (n > 2), and the technique was entitled RAFFn (12). When n increases, the relative relaxation time difference (RRTD) between GM and WM in both human and rat brains becomes larger, SAR decreases, and bandwidth of the pulses increases (12). Overall, RAFFn relaxation time (TRAFFn) lengthens with the increase of n for n = 1 – 5. In addition, we have shown that relaxations in the rotating frames n > 3 are particularly sensitive to slow motion, which opens a new territory for the detection of myelin in healthy tissue and the demyelinating processes in diseased states.
In the present work, we hypothesized that increasing contrast between WM and GM with the increase of n is directly related to the myelin content in the brain. Our hypothesis was tested by making multi-parametric measurements on normal ex vivo rat brain and by conducting quantitative comparisons between MRI relaxation times TRAFF1-5, free precession longitudinal relaxation T1, transverse relaxation T2, adiabatic relaxations T1ρ and T2ρ, magnetization transfer ratio (MTR), and histologically-derived myelin, iron content and cell density.
Methods
Five healthy female Wistar rats (weight 226 ± 6 g, age 93 ± 2 days, n = 5) were deeply anesthetized with isoflurane and transcardially perfused with 0.9% sodium chloride for 2 min (30 mL/min, 4°C), followed by 4% paraformaldehyde in 0.1 M phosphate buffer, pH 7.4, for 20 min (30 mL/min, 4°C). The fixed brains were removed from the skulls, and postfixed for 4 h in the same 4% paraformaldehyde solution. Brains were washed out in 0.9% sodium chloride solution overnight and were immersed in perfluoropolyether (Galden HS240, Vacuumservice Oy, Helsinki, Finland) to avoid signal from solution. The brains were placed tightly in a Teflon cylinder and their position was maintained using plastic rings during the measurements without altering the brain morphology. MRI measurements were carried out using a vertical-bore 9.4T magnet (Oxford instruments) equipped with Agilent console (Agilent Corp., Palo Alto, CA, USA). A quadrature volume coil with inner diameter of 19 mm (Rapid Biomed, Rimpar, Germany) was used as the transceiver. The imaging slice which includes selection of brain areas with different myelin contents was selected from the level -3.80 mm from bregma according to rat brain atlas (13) and coronal gradient echo images with 0.35 mm slice thickness (TR = 120 ms, TE = 4 ms, FOV = 20 × 20 mm2, matrix size 128 × 128, 15 slices) were acquired.
To generate RAFFn contrast, trains of RAFFn (n = 1 - 5) pulses assembled in P-packets (PP−1 Pπ Pπ−1) were used as described before (12). The RAFFn pulse trains with 0, 8, 16, 24, and 32 P-packets resulted in pulse train durations of 0 – 144 ms. To estimate the steady state and its effect on the relaxation time calculations, separate measurements were performed with and without an inversion pulse preceding the RAFFn pulse trains (9). This inversion pulse was an adiabatic full passage of the hyperbolic secant family (HSn with n=1), and was implemented with pulse length (Tp) of 6 ms and peak RF amplitude ( ) of 2500 Hz. In addition to RAFFn, T1, T2, continuous wave (CW) T1ρ (T1ρ,CW), adiabatic T1ρ (T1ρ,HS1/HS4), adiabatic T2ρ,(T2ρ,HS1/HS4) MT, and B1 were measured. T1 measurements were carried out using inversion recovery, with the same inversion pulse as in RAFFn experiments, and with inversion times of 10, 25, 500, 1000 and 2000 ms. T2 measurements were performed with a double spin echo preparation block. The preparation block consisted of an adiabatic half passage excitation (Tp= 4 ms, ), two HS1 pulses (Tp= 4 ms, ), and a reversed adiabatic half passage (Tp= 4 ms, ), with symmetric delays between these pulses to yield total TE values of 0, 18, 36, 54, and 73 ms.
Continuous wave T1ρ measurement (T1ρ,CW) was conducted with spin-lock pulse durations of 0, 18, 36, and 54 ms sandwiched between forward and reverse adiabatic pulses having Tp of 1.5 ms length and of 5000 Hz. The adiabatic T1ρ measurement (T1ρ,HS1/HS4) used HS1 or HS4 pulses of length Tp = 4.525 ms and train lengths of 0, 8, 16, 24, and 32 pulses (10, 14, 15). For adiabatic T2ρ measurement (T2ρ,HS1/HS4), the adiabatic half passage was placed prior the adiabatic full passage pulse train, and the reversed adiabatic half passage pulse was placed after the pulse train. Both excitation and reverse adiabatic half passage pulses used Tp of 4 ms and of 2500 Hz (10). To measure MTR, Z-spectroscopy was performed using the alternating phase irradiation and sine modulation method with of 150 Hz, irradiation duration of 2 s, and saturation bands 5 kHz off-resonance (16). B1 mapping was carried out by increasing the duration of a hard pulse placed prior to the imaging readout (17). The pulse duration was 0-1000 μs and was 625 Hz. For all relaxation and MTR measurements, a fast spin echo pulse sequence was used for readout. The parameters for the readout were TR = 5000 ms, effective TE = 7 ms, matrix size 512 × 256, FOV = 15 × 15 mm2, ETL = 4, and slice thickness = 0.7 mm.
All relaxation time constant and B1 maps were reconstructed from signal intensities on a pixel-by-pixel basis using Aedes software package (aedes.uef.fi) on Matlab platform (MathWorks, Natick, MA). TRAFFn values were calculated with both a model taking steady state into account (9) and using a monoexponential decay function. For T2, T1ρ, and T2ρ data, a monoexponential decay function was fitted. For the analyses of T1 data, a monoexponential signal recovery model was used. To obtain MTR, the ratio of signals with and without the magnetization transfer pulse was calculated. The B1 data was fitted to a single cosine function. For regional analysis of the MRI parameters, 12 region of interests (ROI)s shown representing white and grey matter areas were determined and MRI parameters and optical densities were averaged over the areas.
After MRI experiments, the brains were washed out in 0.9% sodium chloride, cryoprotected for 36 h in 20% glycerol and 0.02 M potassium phosphate-buffered saline, frozen on dry ice and stored at -70°C until histological procedures. The brains were sectioned into 30 μm-thick sections (1-in-5 series) in the coronal plane with a sliding microtome. The first series of sections was stored in 10% formalin at room temperature. This series of sections was stained for Nissl to study the cytoarchitecture of the brain areas. The remaining series was stored in a cryoprotectant tissue-collecting solution (30% ethylene glycol, 25% glycerol in 0.05 M sodium phosphate buffer) at -20°C until stained. The second series of sections was stained with gold chloride for myelin as described in (18). The third series of sections was stained for iron using Perl’s staining with 3,3’-diaminobenzidine (DAB) enhancement (19). Briefly, sections were treated with a mixture of 2.5 % potassium ferrocyanide and 2.5 % HCl for 2 hours at 37 °C and then washed with phosphate-buffered saline three times (10 min each). Then the sections were incubated in 0.5 mg/ml DAB for 30 minutes after which they were immersed for 30 minutes in a mixture of 0.5 mg/ml DAB and 0.01% H2O2 in the dark. Following this procedure, the sections were washed three times with phosphate-buffered saline (10 min each), dehydrated in graded ethanol, air-dried and finally cover-slipped with DePeX (BDH, Laboratory Supplies, Dorset, U.K.). The density of myelin, iron and cells in selected brain areas was quantified from 5 consecutive sections covering 750 μm at the same level of MR images using ImageJ software (version 1.41o, http://rsb.info.nih.gov/ij). Briefly, digital images were captured from each section using a Leica DMRB microscope equipped with a Nikon DXM1200F digital camera. After conversion of the images to grayscale, optical intensity was obtained from regions of interest (ROI) in 12 brain regions (dentate gyrus, hippocampus, amygdala and piriform cortex, layer I of the primary somatosensory cortex, ventral posterior thalamic nuclei and posterior thalamic nucleus, layer VI of the primary somatosensory cortex, cingulum, corpus callosum, internal capsule, fimbria, optic tract, and external capsule). Optical density values were calculated by normalization of intensity values from each ROI and background intensity values from each section ((i.e., mean intensity of background – mean intensity of labeling in ROIs)/intensity of background). For correction of possible staining differences between sections, optical density values were scaled by a correction factor. This factor was obtained by sum of mean intensities of ROI of all the areas from the same section divided by the mean intensity of all intensities of ROIs of the same staining.
Pearson correlations and p values for associations between MRI parameters and optical densities obtained from histology were calculated using standard methods in GraphPad Prism package (GraphPad Software Inc., San Diego, CA, USA). Numerical values given are mean ± sd.
Results
All TRAFFn maps exhibited high RRTD = (T(GM) - T(WM)) / T(GM) × 100% between GM and WM in the brain. As n increased, TRAFFn contrast between GM and WM became more pronounced and qualitatively better resembled the brain myelin distribution seen in the histological sections (Figs. 1 and 2). The longest TRAFFn was measured in the fifth rotating frame (i.e., n=5), while the shortest TRAFFn was in the first rotating frame (Fig. 1), with the faster relaxations measured in the white matter as compared to the grey matter. To investigate an association between tissue myelin and RAFFn relaxation time constants, the optical densities were measured from 12 brain ROIs on myelin stained sections. When TRAFFn decreased, an increase of optical density and thus myelin content was detected (Fig. 2). Variabilities (SD) of <17.2% within the ROIs in all RAFFn relaxation measurements were detected, while variations in relaxation times between different brain areas were larger and varied inversely with myelin content (Fig. 3).
Fig. 1.
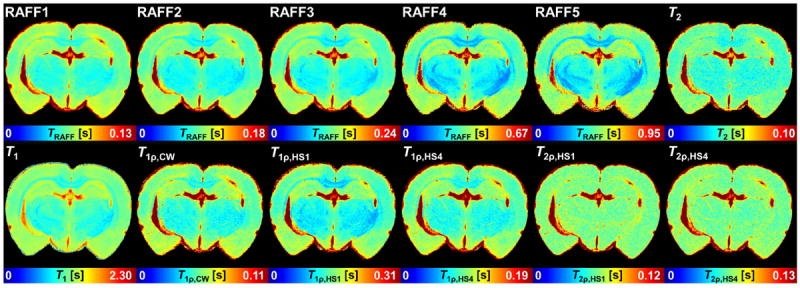
Representative example of relaxation time constant maps obtained with different techniques. The color maps were chosen such that color tone keeps constant in hippocampus area.
Fig. 2.
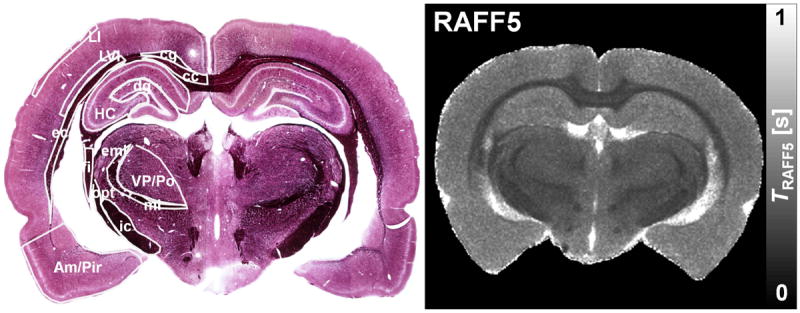
Representative photomicrograph of the myelin stained section from the MRI matched slice and RAFF5 relaxation time constant map. The ROIs are superimposed on the histological section. Light purple areas resemble grey matter and dark purple areas resemble white matter. DG: dentate gyrus; HC: hippocampus; Am/Pir: amygdala and piriform cortex; LI: layer I of the primary somatosensory cortex; VP/Po: ventral posterior thalamic nuclei and posterior thalamic nucleus; LVI: layer VI of the primary somatosensory cortex; cg: cingulum; cc: corpus callosum; ic: internal capsule; fi: fimbria; opt: optic tract; ec: external capsule.
Fig. 3.
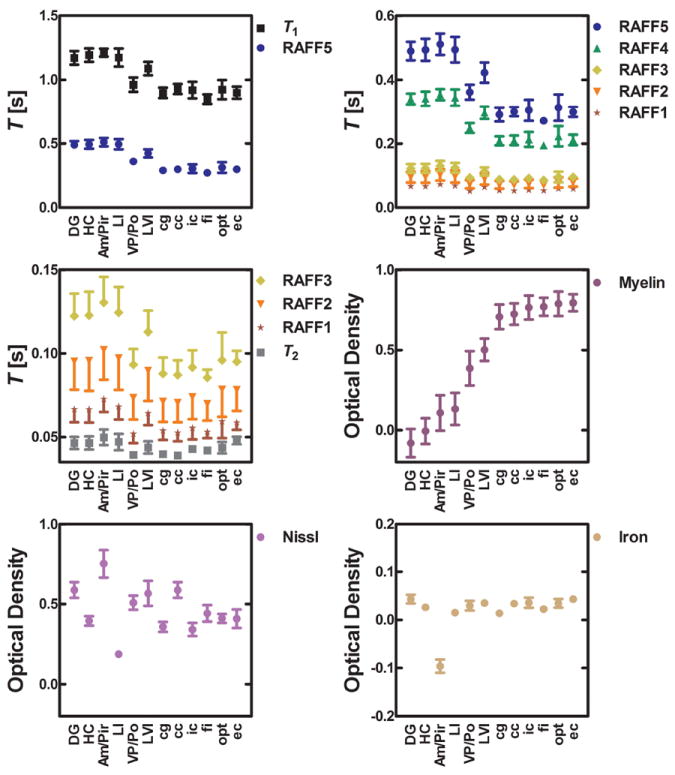
Relaxation time constants in different regions and optical density derived from myelin, Nissl, and iron stained sections. DG: dentate gyrus; HC: hippocampus; Am/Pir: amygdala and piriform cortex; LI: layer I of the primary somatosensory cortex; VP/Po: ventral posterior thalamic nuclei and posterior thalamic nucleus; LVI: layer VI of the primary somatosensory cortex; cg: cingulum; cc: corpus callosum; ic: internal capsule; fi: fimbria; opt: optic tract; ec: external capsule. Optical densities are given in arbitrary units.
To compare RRTD between brain regions, layer I (LI) of the primary somatosensory cortex was used as a reference, since it represents an example of cortical grey matter, and have low myelin content (Fig. 4ab). The highest RRTDs were found with TRAFF4 and TRAFF5, and also relatively high RRTDs were found for T1ρ,CW and T1ρ,HS1/HS4. The smallest RRTD was found for T2, and MTR also exhibited low RRTD (Fig. 4c). As was detailed in our previous publication, the MR signal during measurements with RAFFn evolves to a steady state (SS) (9). Here, we also analyzed the relative SS difference (RSSD) defined similarly as RRTD (Fig. 4 c). Highest RSSD values (up to 30%) were obtained with RAFF2 and RAFF3 methods. Interestingly, the RSSD values of RAFF2 and RAFF3 were clearly higher than the RSSD values calculated for RAFF4 and 5. To investigate the mechanism responsible for the high RRTD values of RAFF4 and 5, we performed correlations between MRI parameters and optical density values from the three different stainings. TRAFFn was plotted as a function of optical density and linear regressions were calculated. Highest correlation was found between TRAFF5 and myelin content (Fig. 5, Tab. 1 and supporting material). TRAFFn is typically measured by incrementing RAFFn preparation pulses with and without an initial inversion of magnetization. An alternative strategy however is to obtain TRAFFn by fitting the signal intensity (SI) decay curve of RAFFn without an initial inversion pulse and then fitting a single monoexponential function. Interestingly, the monoexponential fit which does not take into account the steady state provided systematically higher RRTD values than the steady state fitting (data not shown). For instance, for RAFF5, the RRTD between LI and the corpus callosum (cc) was 46% with the monoexponential fit and 39% with the steady state fit, suggesting the possibility to reduce the total measurement time.
Fig. 4.
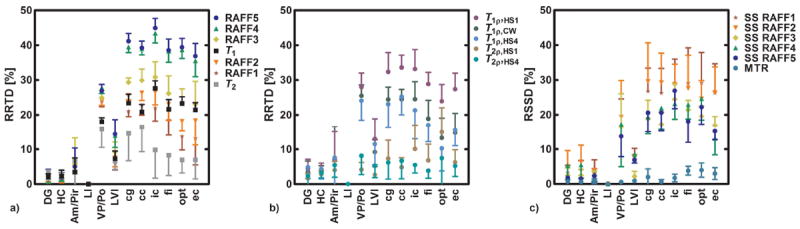
a) Relative relaxation time differences (RRTDs) for RAFFn, T1 and T2, b) RRTD for CW T1ρ, adiabatic T1ρ and T2ρ both with HS1 and HS4 pulses, and relative steady state differences (RSSD) for RAFFn steady state maps and MTR. RRTD and RSSD were calculated between brain area (X) and layer I (LI) of the primary somatosensory cortex as follows RRTD = (T(LI) - T(X)) / T(LI) × 100 % or RSSD = (SS(LI) - SS(X)) / SS(LI) × 100 %. DG: dentate gyrus; HC: hippocampus; Am/Pir: amygdala and piriform cortex; LI: layer I of the primary somatosensory cortex; VP/Po: ventral posterior thalamic nuclei and posterior thalamic nucleus; LVI: layer VI of the primary somatosensory cortex; cg: cingulum; cc: corpus callosum; ic: internal capsule; fi: fimbria; opt: optic tract; ec: external capsule.
Fig. 5.
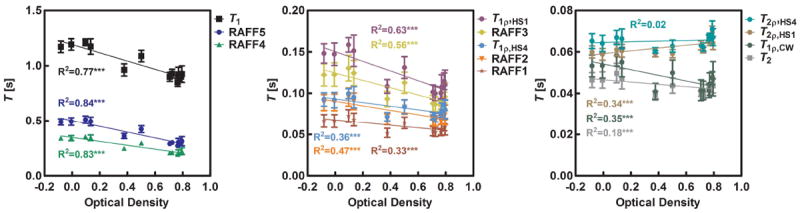
Linear regression between MRI relaxation time constants and optical density measured from gold chlorine stained histology sections representing myelin content in the tissue (* p < 0.05, ** p < 0.01, and *** p < 0.0001)
Tab. 1.
Linear regression R2 with confidence values
| Method | Myelin | Nissl | Iron |
|---|---|---|---|
| TRAFF5 | 0.84*** | 0.06 | 0.18*** |
| TRAFF4 | 0.83*** | 0.05 | 0.17*** |
| T1 | 0.77*** | 0.07* | 0.18*** |
| T1ρ,HS1 | 0.63*** | 0.04 | 0.19*** |
| TRAFF3 | 0.56*** | 0.04 | 0.16** |
| TRAFF2 | 0.47*** | 0.04 | 0.16** |
| T1ρ,HS4 | 0.36*** | 0.01 | 0.16** |
| T1ρ,CW | 0.35*** | 0.03 | 0.16** |
| T2ρ,HS1 | 0.34*** | 0.07* | 0.01 |
| MTR | 0.34*** | 0.06 | 0.02 |
| TRAFF1 | 0.33*** | 0.03 | 0.15** |
| T2 | 0.18*** | 0.01 | 0.13** |
| T2ρ,HS4 | 0.02 | 0.02 | 0.01 |
p < 0.001,
p < 0.01,
p < 0.05 between optical density from the three stainings and MRI parameters. All 12 ROIs were included in the analysis.
In this work we also investigated whether the RRTD values of the RAFF4 and RAFF5 methods could be explained by variations in cell density and iron content in tissue. The relaxation times TRAFFn did not correlate with cell density and statistically significant but low correlations were found between TRAFFn and iron content (Tab. 1). By visual inspection, a clear differentiation between WM (corpus callosum, cc) and GM (hippocampus, HC) can be seen in myelin staining as well as in RAFF5 and RAFF4, some differences in Nissl staining, and only slight difference in iron staining (Fig. 3 and Fig. 6). The pyramidal and granule cell layers in hippocampus and dentate gyrus are densely packed by the cells as seen in Nissl staining (Fig 6b) and iron content (Fig 6c) are higher than in surrounding tissue. Therefore, the hippocampus and dentate gyrus appears heterogeneous with clearly separable areas with the dense and loose cell layers within the ROIs (Fig. 6).
Fig. 6.
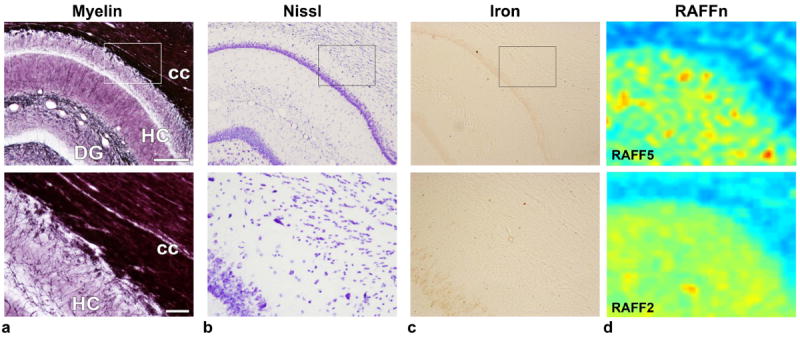
a) Photomicrograph of a myelin stained section of the dentate gyrus and corpus callosum, b) Nissl stained section from same animal from the same location, c) iron stained section, and d) TRAFF5 map upper row and TRAFF2 map lower row. In lower row a-c magnifications from rectangular showed in upper row. Scale bar in upper row 300 μm, and in lower row 50 μm. Colors in RAFFn maps are the same as in Fig. 1. DG: dentate gyrus; HC: hippocampus; cc: corpus callosum.
Discussion
In this study of ex vivo rat brain, correlation analyses revealed significant associations between the myelin content measured by the relaxation time constants TRAFF4 and TRAFF5 and histology. These relaxation time constants yielded the highest correlation with myelin content as compared to the other MRI metrics used in this study. The negligible associations between TRAFF4 or TRAFF5 with iron content or cell density, in combination with the large RRTDs observed between grey and white matter with TRAFF4 and TRAFF4, suggests a high potential of these metrics to serve as biomarkers for myelin content in tissue.
With the RAFF1-5 methods, large SS values in the range of 30% were obtained in white matter, while SS was only ~5% in grey matter. A short T1 of only ~400 ms measured for the short-lived T2 component in sciatic nerve (2) may explain the large SS value measured in white matter with the RAFF1-5 methods.
MTR measured using CW irradiation produces a direct saturation effect on the MR signal. In this work, we applied a Z-spectroscopy with alternating phase irradiation and sine modulation method (16) which minimizes direct saturation during magnetization transfer. However, reduced direct saturation leads to diminished contrast between WM and GM in the MTR image and yields low correlation between MTR and tissue myelin content, which is in contradiction to an earlier finding of decreased MTR in demyelination (20). We anticipate that MT and RAFF4 and 5 methods are sensitive to a different range of exchange regimes: MT detects intermediate-slow exchanges, while RAFF4 and 5 provide sensitivity to slow exchange regime, as was recently demonstrated in (12). Therefore, these two techniques could provide complementary information for characterizing tissue integrity. Moreover, by adopting proper modeling of the relaxation processes, it is possible to generate parametric maps using RAFF4 and 5 in analogy of macromolecular proton fraction (MPF) obtained from MT (21).
The tissues within the ROIs representing white matter were quite homogeneous. In grey matter, especially the dentate gyrus, hippocampus, and amygdala/piriform cortex, the ROIs encompassed a variety of different tissue structures in the histological sections. For instance, the dentate gyrus has negative value in the optical density measured from myelin staining because the ROI contains a dense granular cell layer which has no staining (Fig. 3 and Fig. 6). Visual inspection of the stained sections confirms that the optical densities are valid, since for instance myelin content is low in the dentate gyrus.
Correlations between TRAFF4 and TRAFF5 with cell density and tissue iron content obtained by histological methods were low (Tab. 1). In previous work, an adiabatic T2ρ-weighted relaxation time constant (T2†) was measured using a multiecho adiabatic spin echo sequence and found to be inversely correlated with tissue non-heme iron (22). Relatively low correlation between myelin content and adiabatic T2ρ was found here (R2=0.34 for HS1 pulses and R2=0.02 for HS4 pulses).
As was documented in Liimatainen et al. (12), the first rotating frame relaxation method (RAFF1) is the same as a conventional off-resonance spin - lock T1ρ experiment. The first frame rotates around the laboratory z-axis at the angular velocity of the RF field (ωRF). Therefore the RF field vector (ω1 in rad/s) is stationary in this frame, and the effective field H1 is the vector sum of the two stationary field components. In the second rotating frame relaxation method (RAFF2), one of the fields components, D1, is the same as the effective field in the first frame (i.e., D1 = H0) and the other component, C1, is the fictitious component that arises from the time-dependence of D1 in the first frame, as described by the time-dependent tilt angle in the first frame, α0. Thus C1 is a vector having amplitude dα0/dt along the y″ axis. Such transformations can be continued to create rotating frames and RAFFn pulses of higher ranks (n = 3, 4, 5, …). In this study, TRAFF4 and TRAFF5 appeared to be invariant with cell density. In our earlier study of rat glioma gene therapy model the RAFF2 method was superior in its association with cell density in different tumor zones than all other relaxation metrics used for the comparison (10). Most likely, both cell density and iron content have an effect also on RAFF4 and 5 relaxation times, but natural abundance of iron and cell density variation in normal brain is overwhelmed by the relaxation effect induced by myelin, and thus escaped detection.
Iron content is expected to also affect relaxations measured with RAFFn. We have described earlier in details that the averaged tip angle of magnetization decreases with the increase of n, being maximal for RAFF1 and 2 (12). Thus, the contribution of transverse relaxation pathway to TRAFF1 and TRAFF2 is more significant than to TRAFF3-5 which explains higher correlation with iron loads with low n in RAFFn (=1 or 2) than n=3-5. However, only low correlation was found in this study between RAFF1,2 and histology stained iron content (Tab. 1), suggesting insensitivity of RAFFn to iron-induced dynamic dephasing. This further supports our conclusion that the relaxations in high rotating frames are governed by slow motion.
To investigate the contrast mechanisms responsible for increased GM/WM RRTD, the series of sequences were measured in ex vivo brain. It was found that alteration of frequency around the carrier frequency ± 10 Hz in the RAFF5 experiment had no effect on RRTD, as should be the case if RRTD is driven by the frequency shift, similarly as susceptibility weighted contrast. When using a spin-lock pulse in the T1ρ experiment and allowing similar average flip angle during the pulse (γ-1B1max=80 Hz, off-resonance = 4100 Hz) and similar refocusing as was used in the P-packets of RAFF5, the RRTDs were found similar. This suggests that RAFF5 can produce similar contrast with small off-resonances (< 200 Hz) as the off-resonance T1ρ with off-resonance of 4100 Hz. To investigate the effect from pulse refocusing, a T1ρ pulse with parameters as earlier, but without the refocusing scheme was applied. No effects of refocusing on RRTD were found. Large R2 between myelin content and TRAFF4 and TRAFF5 values indicates that myelin content could be estimated based on relaxation times. RAFF4,5 have been shown to be sensitive to slow exchange regime. Because slow exchange is present in myelinated tissue, this most likely provides an explanation for high correlations between RAFF4 and 5 with myelin. However, in pathological conditions such as stroke, T1 and T2 change due to hemorrhage, oedema and other pathophysiological processes in brain parenchyma. These pathological tissue alterations are reflected also in TRAFF4 and TRAFF5 which limits the straightforward conclusion that RAFF4 and RAFF5 methods measure myelin content only. The developed method could be used for quantification and monitoring of demyelination/remyelination processes in several diseases, for example multiple sclerosis, spinal cord injury and other neurological disorders.
The spin-echo readout portion (although several ms) of the sequence can negatively influence the relaxation mapping assessment. The tissue components with short T2 values are filtered out during the echo time of the sequence. Therefore, utilization of the readout with no echo time (i.e., SWIFT) could be beneficial for this study (23).
The bandwidth of the RAFFn pulses significantly increase with the increase of n, which is mainly a consequence of the lower tip angle of RAFF3,4,5 as compared to RAFF1,2. Lower RF power requirements and therefore decreased SAR along with larger bandwidth promise more robust applicability of RAFFn (n>2) relaxation measurements as compared to RAFF1,2. This feature of RAFFn is essential for compensating B0 artifacts which become more severe with the increase of B0.
To conclude, the increase of GM/WM RRTD with RAFFn_(n = 4 or 5) is attributed mainly to myelin content. This may pave the way for myelin quantification and detection of demyelination in pathological conditions.
Supplementary Material
Relaxation time constants measured in different regions are shown. DG: dentate gyrus; HC: hippocampus; Am/Pir: amygdala and piriform cortex; LI: layer I of the primary somatosensory cortex; VP/Po: ventral posterior thalamic nuclei and posterior thalamic nucleus; LVI: layer VI of the primary somatosensory cortex; cg: cingulum; cc: corpus callosum; ic: internal capsule; fi: fimbria; opt: optic tract; ec: external capsule.
Acknowledgments
Authors wish to thank Ms. Maarit Pulkkinen for technical assistance and the following institutions for funding: Academy of Finland, Sigrid Juselius Foundation, and NIH Grants BTRC which are P41 EB015894, P30 NS057091, R01 NS061866.
List of abbreviations
- CW
continuous wave
- DAP
3,3’-diaminobenzidine
- GM
grey matter
- HSn
hyperbolic secant n family
- MTR
magnetization transfer ratio
- RAFF
relaxation along fictitious field
- RAFFn
RAFF in nth frame
- ROI
region of interest
- RRTD
relative relaxation time difference
- RSSD
relative steady state difference
- SS
steady state
- WM
white matter
References
- 1.Schmithorst VJ, Wilke M, Dardzinski BJ, Holland SK. Correlation of white matter diffusivity and anisotropy with age during childhood and adolescence: A cross-sectional diffusion-tensor MR imaging study. Radiology. 2002;222:212–8. doi: 10.1148/radiol.2221010626. [DOI] [PMC free article] [PubMed] [Google Scholar]
- 2.Does MD, Beaulieu C, Allen PS, Snyder RE. Multi-component T1 relaxation and magnetisation transfer in peripheral nerve. Magn Reson Imaging. 1998;16:1033–41. doi: 10.1016/s0730-725x(98)00139-8. [DOI] [PubMed] [Google Scholar]
- 3.Glasser MF, Van Essen DC. Mapping human cortical areas in vivo based on myelin content as revealed by T1- and T2-weighted MRI. J Neurosci. 2011;31:11597–616. doi: 10.1523/JNEUROSCI.2180-11.2011. [DOI] [PMC free article] [PubMed] [Google Scholar]
- 4.Le Bihan D, Johansen-Berg H. Diffusion MRI at 25: Exploring brain tissue structure and function. Neuroimage. 2012;61:324–41. doi: 10.1016/j.neuroimage.2011.11.006. [DOI] [PMC free article] [PubMed] [Google Scholar]
- 5.Bonilla I, Snyder RE. Transverse relaxation in rat optic nerve. NMR Biomed. 2007;20:113–20. doi: 10.1002/nbm.1090. [DOI] [PubMed] [Google Scholar]
- 6.Horch RA, Gore JC, Does MD. Origins of the ultrashort-T21H NMR signals in myelinated nerve: A direct measure of myelin content? Magn Reson Med. 2011;66:24–31. doi: 10.1002/mrm.22980. [DOI] [PMC free article] [PubMed] [Google Scholar]
- 7.Lee J, Shmueli K, Kang BT, Yao B, Fukunaga M, van Gelderen P, Palumbo S, Bosetti F, Silva AC, Duyn JH. The contribution of myelin to magnetic susceptibility-weighted contrasts in high-field MRI of the brain. Neuroimage. 2012;59:3967–75. doi: 10.1016/j.neuroimage.2011.10.076. [DOI] [PMC free article] [PubMed] [Google Scholar]
- 8.Lodygensky GA, Marques JP, Maddage R, Perroud E, Sizonenko SV, Huppi PS, Gruetter R. In vivo assessment of myelination by phase imaging at high magnetic field. Neuroimage. 2012;59:1979–87. doi: 10.1016/j.neuroimage.2011.09.057. [DOI] [PubMed] [Google Scholar]
- 9.Liimatainen T, Sorce DJ, Connell R, Garwood M, Michaeli S. MRI contrast from relaxation along a fictitious field (RAFF) Magn Reson Med. 2010;64:983–94. doi: 10.1002/mrm.22372. [DOI] [PMC free article] [PubMed] [Google Scholar]
- 10.Liimatainen T, Sierra A, Hanson T, Sorce DJ, Ylä-Herttuala S, Garwood M, Michaeli S, Gröhn O. Glioma cell density in a rat gene therapy model gauged by water relaxation rate along a fictitious magnetic field. Magn Reson Med. 2012;67:269. doi: 10.1002/mrm.22997. [DOI] [PMC free article] [PubMed] [Google Scholar]
- 11.Liimatainen T, Mangia S, Ling W, Ellermann J, Sorce DJ, Garwood M, Michaeli S. Relaxation dispersion in MRI induced by fictitious magnetic fields. J Magn Reson. 2011;209:269–76. doi: 10.1016/j.jmr.2011.01.022. [DOI] [PMC free article] [PubMed] [Google Scholar]
- 12.Liimatainen T, Hakkarainen H, Mangia S, Huttunen JMJ, Storino C, Idiyatullin D, Sorce D, Garwood M, Michaeli S. MRI contrasts in high rank rotating frames. 2014 doi: 10.1002/mrm.25129. [DOI] [PMC free article] [PubMed] [Google Scholar]
- 13.Paxinos G, Watson C. The Rat Brain in Stereotaxic Coordinates: Compact. 6. Elsevier/Academic Press; 2009. [Google Scholar]
- 14.Garwood M, DelaBarre L. The return of the frequency sweep: Designing adiabatic pulses for contemporary NMR. J Magn Reson. 2001;153:155–77. doi: 10.1006/jmre.2001.2340. [DOI] [PubMed] [Google Scholar]
- 15.Michaeli S, Sorce D, Garwood M. T2ρ and T1ρ adiabatic relaxations and contrasts. Current Analytical Chemistry. 2008;4:8–25. [Google Scholar]
- 16.Närväinen J, Hubbard PL, Kauppinen RA, Morris GA. Z-spectroscopy with alternating-phase irradiation. J Magn Reson. 2010;207:242–50. doi: 10.1016/j.jmr.2010.09.004. [DOI] [PubMed] [Google Scholar]
- 17.Vaughan JT, Garwood M, Collins CM, Liu W, DelaBarre L, Adriany G, Andersen P, Merkle H, Goebel R, Smith MB, Ugurbil K. 7 T vs. 4 T: Rf power, homogeneity, and signal-to-noise comparison in head images. Magn Reson Med. 2001;46:24–30. doi: 10.1002/mrm.1156. [DOI] [PubMed] [Google Scholar]
- 18.Laitinen T, Sierra A, Pitkänen A, Gröhn O. Diffusion tensor MRI of axonal plasticity in the rat hippocampus. Neuroimage. 2010;51:521–30. doi: 10.1016/j.neuroimage.2010.02.077. [DOI] [PubMed] [Google Scholar]
- 19.Fukunaga M, Li T, van Gelderen P, de Zwart JA, Shmueli K, Yao B, Lee J, Maric D, Aronova MA, Zhang G, Leapman RD, Schenck JF, Merkle H, Duyn JH. Layer-specific variation of iron content in cerebral cortex as a source of MRI contrast. Proceedings of the National Academy of Sciences. 2010 doi: 10.1073/pnas.0911177107. [DOI] [PMC free article] [PubMed] [Google Scholar]
- 20.Filippi M, Rocca M. Magnetization transfer magnetic resonance imaging of the brain, spinal cord, and optic nerve. Neurotherapeutics. 2007;4:401–13. doi: 10.1016/j.nurt.2007.03.002. [DOI] [PMC free article] [PubMed] [Google Scholar]
- 21.Underhill HR, Rostomily RC, Mikheev AM, Yuan C, Yarnykh VL. Fast bound pool fraction imaging of the in vivo rat brain: Association with myelin content and validation in the C6 glioma model. Neuroimage. 2010;54:2052–65. doi: 10.1016/j.neuroimage.2010.10.065. [DOI] [PMC free article] [PubMed] [Google Scholar]
- 22.Mitsumori F, Watanabe H, Takaya N, Garwood M. Apparent transverse relaxation rate in human brain varies linearly with tissue iron concentration at 4.7 T. Magn Reson Med. 2007;58:1054–60. doi: 10.1002/mrm.21373. [DOI] [PubMed] [Google Scholar]
- 23.Idiyatullin D, Suddarth S, Corum CA, Adriany G, Garwood M. Continuous SWIFT. J Magn Reson. 2012;220:26–31. doi: 10.1016/j.jmr.2012.04.016. [DOI] [PMC free article] [PubMed] [Google Scholar]
Associated Data
This section collects any data citations, data availability statements, or supplementary materials included in this article.
Supplementary Materials
Relaxation time constants measured in different regions are shown. DG: dentate gyrus; HC: hippocampus; Am/Pir: amygdala and piriform cortex; LI: layer I of the primary somatosensory cortex; VP/Po: ventral posterior thalamic nuclei and posterior thalamic nucleus; LVI: layer VI of the primary somatosensory cortex; cg: cingulum; cc: corpus callosum; ic: internal capsule; fi: fimbria; opt: optic tract; ec: external capsule.