

Abstract
Accurate characterization of nanomaterial properties is a critical component of any nanotoxicology testing strategy. Data that describes the performance of various laboratories in measuring the characteristics of the same nanomaterial are scarce. We conducted an inter-laboratory study to evaluate “real-world” precision and bias of specific surface area measurements using a powered material containing sub-30 nm primary crystallites. Each participant was provided a sample of NIST Standard Reference Material 1898 (Titanium Dioxide Nanomaterial) and a sample preparation and analysis protocol. Based on results from 19 laboratories, overall performance was good. Estimates of precision ranged from 0.10 to 3.96 % and measurement bias was generally within ±5 % of the certified surface area value of the material. Between-laboratory variability accounted for 91 % of the total variance and is likely explained by gravimetric errors. Reliable determination of intrinsic nanomaterial properties such as surface area will permit development of protocols for toxicity testing, verification of laboratory proficiency, and consistency in interpretation of toxicity study data.
Keywords: Surface area, Reference material, Precision, Titanium dioxide, Nanomaterial, Nanotoxicology
Introduction
Nanotoxicology is an emerging discipline that seeks to evaluate the safety of engineered nanostructures and nanodevices—herein referred to as nanomaterials (Oberdörster et al. 2005a). A key requirement for safety evaluation is the thorough and accurate characterization of intrinsic nanomaterial properties (Oberdörster et al. 2005b; Hassellöv et al. 2008; Boverhof and David 2010). Surface area is an important property for understanding toxicity of a wide variety of ultrafine particles and nanomaterials, because it is highly correlated with adverse pulmonary reactions (Donaldson et al. 2000; Duffin et al. 2002; Monteiller et al. 2007; Seaton et al. 2009; Stoeger et al. 2006). In a recent review, surface area was identified as one of the most important nanomaterial properties to characterize for toxicology studies (Stefaniak et al. 2012). Titanium dioxide (TiO2) is a specific example of a nanomaterial that can trigger pulmonary inflammation in a surface-area-dose dependent manner (Singh et al. 2007). TiO2 is a high production volume material (Robichaud et al. 2009) that is used in a wide variety of applications such as cosmetics, paints, photocatalysis, and energy storage/production and is thus of broad interest for safety evaluation (OECD 2010).
Given the fundamental importance of accurate characterization of nanomaterials for hazard and exposure assessment, we conducted an inter-laboratory study (ILS) involving 20 participants to evaluate the “real-world” measurement precision, bias, and between-laboratory variation for the specific surface area (area per unit mass) of a TiO2 nanomaterial in powder form. The ILS was organized under the auspices of the Versailles Project on Advanced Materials and Standards (VAMAS) through Technical Working Area 34 (Nanoparticle Populations).
Materials and methods
A commercially available TiO2 powder (Product Type P25, Evonik Industries AG, Essen, Germany)1 was chosen for this ILS because it represents a de facto standard used in past toxicological investigations (Maier et al. 2006) and is the source material for production of U.S. National Institute of Standards and Technology (NIST) Standard Reference Material (SRM) 1898: Titanium Dioxide Nanomaterial, certified for Brunauer–Emmett–Teller (BET) specific surface area determined by the static volumetric gas sorption method. To produce SRM 1898, approximately 11 kg of TiO2 powder was collected by sampling in roughly equal quantities from each of five original containers and homogenized in a cone blender. Although beyond the scope of the present work, SRM 1898 was fully characterized both physically and chemically, and this non-certified (informational) data is provided on the Certificate of Analysis (NIST 2012). Briefly, X-ray diffraction (XRD) measurements performed at NIST yielded relative phase fractions of approximately 76 and 24 % for the polymorphs anatase and rutile, respectively. The approximate volume-weighted primary crystallite size for anatase and rutile, based on analysis of multiple XRD reflections, is 19.4 and 37 nm, respectively; a phase-weighted average of the two crystallites yields a mean diameter of about 24 nm. This value is consistent with the surface-weighted equivalent spherical diameter derived from the certified BET specific surface area, which yields 27 nm.
Measurement of surface area by gas adsorption
Direct measurement of the specific surface area by gas adsorption involves exposing a dry powder sample to inert gas (typically N2) under varying conditions of pressure to develop an isotherm. The linearized BET equation is used to calculate the “BET surface area” from the quantity of gas molecules adsorbed to the powder and the cross-sectional area of the adsorbate:
| (1) |
where p and p0 are, respectively, the equilibrium and saturation pressure of the adsorbate gas, na is the quantity of adsorbed gas at equilibrium pressure (typically given in cm3/g at standard temperature and pressure, STP),2 is the monolayer adsorption quantity (also at STP), and C is the “BET constant” (related to the heat of adsorption). Measurements are taken under isotherm conditions (77 K for N2) over a range of p/p0 values as stipulated by common practice or according to existing measurement standards (Sing et al. 1985; Rouquerol et al. 1994; ISO 2008; ASTM 2006). By convention, values of are plotted against the p/p0 values of N2 gas within the range 0.05 and 0.3 (considered the linear range) to obtain the adsorption isotherm for determination of surface area. Values of and C (an indication of the strength of interaction between the adsorbent and adsorbate) can be obtained from the slope and intercept (which must be positive), respectively, of this BET plot. Total surface area (St) is then:
| (2) |
where N is Avogadro's number, am is the effective cross-sectional area of an adsorbed molecule (0.162 nm2 for N2,), and Vm is the molar volume of the gas at STP (in cm3). By convention, values of St are normalized to dry sample mass to obtain the specific surface area (SSA) with units of m2/g.
Test procedure
A total of 20 laboratories participated in the ILS. Participants included government, academic, and commercial organizations having a range of competence levels and instrumentation (both commercial and custom built). The study was international in scope. With two exceptions, laboratories employed the static volumetric gas sorption method; one laboratory used a gravimetric gas sorption instrument and another used a dynamic gas sorption method. Each participant was provided a test protocol that was generally compliant with international recommendations for the characterization of porous solids available at that time (Rouquerol et al. 1994; ASTM 2006; ISO 2008), a material safety data sheet, and a data reporting template. It should be noted that more recent versions of the ISO and ASTM standards cited herein became available after the initiation of this study; however, the protocol used in the study is also compliant with the updated versions.
Each participant was provided 5 g of crystalline TiO2 powder in a glass bottle and instructed to discharge any static from the sample bottle prior to removing test material. The protocol was as follows: rinse a sample tube with alcohol and dry at (100–110) °C for at least 2 h; determine to 0.1 mg precision the combined mass of the empty sample tube, fill rod (if applicable) and stopper or seal frit; weigh between (0.5 and 0.6) g of test material and transfer to the pre-weighed and static discharged sample tube; and add a fill rod (if applicable) and seal the tube.
Degassing the test sample
Prior to measurement of surface area, participants were instructed to degas the sample under vacuum by raising the temperature from ambient to 200 °C within approximately 30 min, then holding at 200 °C for 2 h. The purpose of the degas step is to remove volatiles (primarily water) from the surface of the powder. The sample was allowed to cool passively back to ambient temperature and backfilled with N2 gas after completion of the degas procedure. Next, the sample tube with powder was sealed and the post-degas mass was measured to a precision of 0.1 mg. The dry sample mass was determined by subtracting the mass of the empty tube determined before degassing.
Sample analysis
For each sample, participants were instructed to select 4–10 analysis points evenly spaced in the range p/p0 = 0.05–0.3 and to record a measurement at each point after equilibrium was established (this is the so-called `multi-point' BET analysis). Single-point BET analysis was also requested, but the results are not discussed in the present work; typically, single-point SSA values are slightly lower than multi-point for the same material and test conditions, but otherwise the two values track closely. Three separate independent samples of the test material were to be drawn from the sample bottle (i.e., after analysis a sample was discarded and a fresh sample analyzed). Analyses were performed using the instrument manufacturer's recommended settings and parameter values for routine BET surface area analysis. The following information was collected from each participant using the spreadsheet template to facilitate reporting: calculated multi-point BET SSA values (m2/g), calculated C values (non-dimensional), correlation coefficients, r2 (non-dimensional) from the linear fits of the adsorption isotherm data to the BET equation, adsorption isotherm data (na, in mol/g or cm3/g at STP) versus p/p0, and sample mass (g) after degassing. Additionally, participants were asked to report their level of competence with surface area analysis, instrument make and model, any deviations from the protocol, and any problems encountered with the test material or procedure.
Statistical analyses
Estimates of precision (coefficient of variation) and bias [(measured value – certified reference value)/certified reference value] were calculated for each laboratory and expressed as a percentage. For bias, the value for SSA was taken to be the certified value of 55.55 ± 0.70 m2/g assigned to SRM 1898. Mixed models (software package SAS 9.2, SAS Institute, Cary, NC) were used to evaluate within- and between-laboratory variability in SSA measurement and explore the fixed effects of sorption method (gravimetric, volumetric, or dynamic), sample powder mass (within, below, or above the recommended range), and level of competence with surface area analysis (novice, intermediate, or expert). General linear models were used to evaluate within and between-laboratory variation in precision and bias estimates for these same fixed effects (sorption method, powder mass, competence level).
Results
Figure 1 is a BET plot of representative isotherms from a subset of laboratories for measurements in which the test sample mass was similar and within the prescribed range. The linearity exhibited over the relative pressure range from 0.05 to 0.3 confirmed the general appropriateness of using the BET model for determination of surface area. Among all laboratories, correlation coefficients for the linear BET plot of individual measurements were in the range from 0.9998 to 1.0000 which meets international standard requirements of at least three nines (ASTM 2006; ISO 2008).
Fig. 1.
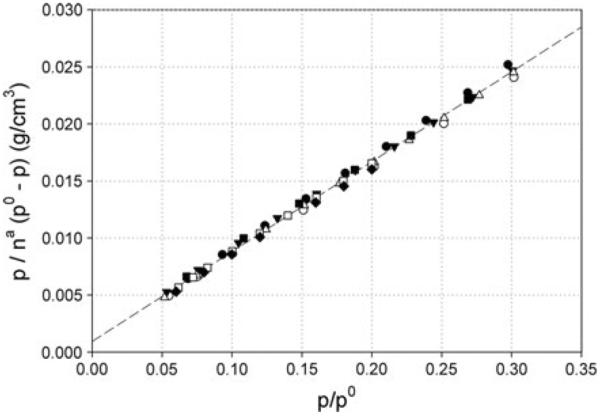
Representative BET plots selected from seven reporting laboratories (denoted by different symbols) for which the test mass was in the prescribed range. The data are linear over the relative pressure (p/p0) range 0.05–0.3, which confirms the appropriateness of the BET model for determination of surface area for this titanium dioxide nanomaterial
Table 1 is a summary of the mean calculated SSAs and estimates of precision and bias by laboratory (identification numbers were assigned randomly). For each laboratory, the average SSA, coefficient of variation, and bias were calculated using three replicate analyses. Several laboratories reported more than three replicates, in which case, a random number generator was used to select three values for averaging purposes. The average SSA reported by laboratory 18 was determined to be an outlier and was excluded from all statistical analyses. The removal of laboratory 18 was based on a follow-up quality check using a different certified reference material for surface area. Both the reference and the test material SSA results were substantially low, and the laboratory independently confirmed that their instrument was not functioning properly at the time of analysis. Among the remaining 19 laboratories, SSA (m2/g) ranged from 48.46 ± 0.78 (laboratory 17) to 58.38 ± 0.06 (laboratory 19). Estimates of within-laboratory precision ranged from 0.10 % (laboratory 2) to 3.96 % (laboratory 13). Measurement bias ranged from +0.19 % (laboratory 20) to −12.77 % (laboratory 17), though the majority of laboratories were within ±5 % of the certified SSA value for SRM 1898.
Table 1.
Average BET specific surface area and estimates of precision (coefficient of variation) and bias for all reporting laboratories
| Laboratory Number | SSA (m2/g) | Precision (%) | Bias (%) |
|---|---|---|---|
| 1 | 56.98 ± 0.06 | 0.11 | +2.57 |
| 2 | 54.67 ± 0.06 | 0.10 | −1.58 |
| 3 | 54.47 ± 0.29 | 0.54 | −1.95 |
| 4 | 53.07 ± 0.30 | 0.57 | −4.46 |
| 5 | 56.28 ± 0.23 | 0.41 | +1.31 |
| 6 | 55.37 ± 1.43 | 2.59 | −0.32 |
| 7 | 56.19 ± 0.67 | 1.19 | +1.15 |
| 8 | 53.96 ± 0.64 | 1.19 | −2.86 |
| 9 | 57.67 ± 1.09 | 1.89 | +3.82 |
| 10 | 56.24 ± 0.57 | 1.02 | +1.25 |
| 11 | 52.65 ± 1.08 | 2.05 | −5.23 |
| 12 | 50.06 ± 0.96 | 1.92 | −9.88 |
| 13 | 51.97 ± 2.06 | 3.96 | −6.44 |
| 14 | 57.00 ± 0.58 | 1.02 | +2.61 |
| 15 | 55.18 ± 0.12 | 0.21 | −0.66 |
| 16 | 55.68 ± 0.47 | 0.85 | +0.24 |
| 17 | 48.46 ± 0.78 | 1.61 | −12.77 |
| 18 | NR | NR | NR |
| 19 | 58.38 ± 0.31 | 0.52 | +5.09 |
| 20 | 55.66 ± 0.20 | 0.36 | +0.19 |
Laboratory ID numbers were randomly assigned
NR not reported; laboratory data excluded based on a follow-up quality check using a certified reference material that confirmed the instrument was not performing correctly
From the mixed model analysis of the SSA data, between-laboratory variability accounted for 91 % of the total variance and within-laboratory variability explained the remaining 9 % of the variance. To understand potential sources of variability, the influence of sorption method, nanomaterial powder mass, and level of expertise were included as fixed effects in the model. The most commonly reported deviation from the protocol involved the use of a test mass outside the prescribed range (0.5–0.6 g). The majority of laboratories (12/19) used a test mass close to or within the prescribed range, but several (6/19) deviated on the low side. Only one laboratory used a higher mass than the prescribed range. Results of the mixed model analysis indicated no significant effect of sample mass on SSA (statistical p value >0.05) and its inclusion in the mixed model reduced between-laboratory variability by just 2 %.
The type of sorption method used for analysis did not appear to influence SSA measurements. In the mixed model, the influence of the dynamic sorption method was marginally significant (p value = 0.05). Inclusion of sorption effect in the model lowered between-laboratory variability by less than 0.5 %.
Each participating laboratory categorized their level of competence in surface area analysis as expert, intermediate, or novice. Of the 19 reported laboratories, seven identified themselves as expert, 11 as intermediate, and one as novice level. Reported competence level did not influence SSA measurements and inclusion of this fixed effect in the model did not change the between-laboratory variability significantly.
Using general linear models, we explored the influence of sorption method, nanomaterial powder mass, and level of expertise (as fixed effects) on precision and bias (expressed as percentages). Precision was not influenced by type of sorption method; however, bias was greater with use of a gravimetric method (p value <0.05). It should be emphasized that only two laboratories used methods that differed substantially from the static volumetric method, so the impact of method cannot be clearly differentiated in the present study. Neither precision nor bias were influenced by level of expertise. Use of a nanomaterial powder mass below the prescribed range (6/19 laboratories) was related to greater bias (p value <0.05) whereas use of a mass above the prescribed range (1/19 laboratories) was related to higher imprecision (p value <0.05). Note that the effect of using a mass above the prescribed range on imprecision is based on data for only one laboratory and its impact cannot be clearly differentiated in the present study.
Finally, there was a roughly inverse relationship between the calculated mean SSA and the C value obtained from the BET fit (data not shown). The C value is an indication of the strength of interaction between the adsorbent and adsorbate, and is related to the heat of adsorption. The majority of SSA values exhibit C values between roughly 80 and 100; reported mean C values did not exceed 140, although a few individual replicates did exceed this value.
Discussion
In this ILS, 19 of 20 participants successfully measured the SSA of a TiO2 powder using a standardized protocol, and obtained good repeatability (precision) and generally accurate results. Among labs, the distribution of precision and bias initially appeared random. Some laboratories had relatively good precision but high bias (e.g., laboratories 17 and 19) while others had low bias but poor precision (e.g., laboratory 6). Some had both good precision and low bias (e.g., laboratories 15, 16, 20). Further exploration identified the gravimetric sorption method and use of a powder mass above the prescribed range as significant factors influencing precision; however, as noted above, these observations were based on a very limited sample size and the full impact of these factors needs to be evaluated in future studies. Bias was only influenced by use of a nanomaterial powder mass below the prescribed range. Notably, level of instrument operator self-identified competency did not have an effect on precision or bias. Error can be reduced by use of an appropriate powder mass, though a user may have less control over the sorption method of the available instrument. Follow-up discussion with participants indicated that the primary reason for using lower than recommended sample mass was due to limitations imposed by the available sample tube used for measurement; nanopowders are often highly agglomerated in the dry state resulting in a low bulk density (i.e., artificially high volume to mass ratio). The results of this ILS are important, as well-characterized materials are needed to develop or refine protocols for testing in order to elucidate mechanisms of toxicity, verify instrument performance or laboratory proficiency, and ensure consistency in interpretation of toxicity study data. The availability of NIST SRM 1898 (and other nanoscale reference materials) begins to fill the gap for such materials and should facilitate protocol development and measurement quality in nanotoxicology.
The major source of variability influencing SSA measurements in this ILS was between-laboratory variability. Factors such as sorption method and level of expertise did not contribute to between-laboratory variability in SSA values. The lack of effect of sample mass was consistent with the findings of robustness tests carried out at NIST prior to the ILS and supports the general conclusion that use of masses of approximately 0.5–0.6 g does not substantially influence the measured surface area of this TiO2 nanopowder.
Other potentially important sources of variability that were not accounted for in the study protocol include gravimetric errors and degas temperature. Gravimetric errors are most likely to arise from incomplete degassing and/or weighing errors due to powder handling (e.g., static electricity can hinder accurate weighing and transfer of insulating fine powders such as TiO2). Such errors will tend to be independent of the nominal mass used in the analysis. On the other hand, errors resulting from the use of an improperly calibrated balance to determine sample mass or due to subtraction of the mass associated with the sample holder should decrease with increasing test mass. With regards to the degas temperature, based on robustness tests conducted at NIST and published guidance (Rouquerol et al. 1994), the most critical aspect of the degas procedure is to attain the target degas temperature and hold that temperature for a sufficient period of time. Differences in the ramp routine (rate at which temperature was increased from ambient to the target value) employed to reach 200 °C were most likely not as important, and thus should not have caused any substantial variations in the reported SSA results.
Based upon the results from 19 laboratories, the requisite conditions for preparation and analysis of SSA for this TiO2 powder are as follows: use a powder mass of about 0.5–0.6 g (depending upon the instrument-specific requirements); degas the sample under vacuum at 200 °C for at least 2 h; cool to ambient, backfill sample with N2 gas and determine dry sample mass to 0.1 mg precision; record sorption measurements at 4–10 analysis points in the range p/p0 = 0.05–0.3; and, normalize the calculated BET surface area to dry sample mass. Details of this sampling, degassing, and analysis protocol are provided in the Certificate of Analysis for SRM 1898 (NIST 2012). While this protocol was evaluated using TiO2, it is believed to be broadly applicable to metal oxide nanopowders; metal nanopowders and graphitic or fullerene powders may exhibit substantially different behavior, including more complex sorption isotherms and thermal instabilities that could impact the application of the BET equation. For data reporting, the following minimum information should accompany the results for all surface area measurements:
degas conditions (time, temperature, vacuum pressure, backfill gas, and dry sample mass);
analysis conditions (adsorbate gas and cross-sectional area, number of adsorption points obtained in the linear BET range (p/p0 = 0.05–0.3), correlation coefficient of at least three nines (i.e., 0.999) for the linear fit of the BET plot, and C value); and
calculated value of SSA.
Summary
Characterization of nanomaterial surface area is a key requirement for nanotoxicology studies. Results of our ILS demonstrated that SSA of a TiO2 nanomaterial powder can be determined with good precision and generally low bias using a standard material and protocol. However, deviations from the protocol (e.g., use of a powder mass below the prescribed range) resulted in greater bias. The reliable determination of nanomaterial properties such as SSA will permit development of protocols for toxicity testing, verification of laboratory proficiency, and consistency in interpretation of toxicity study data. Between-laboratory variability accounted for 91 % of the total observed variability in SSA measurements, with little effect from sorption mass, sample mass, or laboratory competence level. Conversely, gravimetric errors are thought to contribute to variability. Use of reference materials is clearly advantageous in verifying instrument performance prior to conducting surface area measurements on unknown samples, as demonstrated by the identification of an outlier in the present study that was confirmed using an independent certified reference material. Frequently, instrument-specific systematic sources of uncertainty in gas sorption analysis arise from vacuum seal leaks and poorly performing vacuum pumps, though other potential sources do exist.
For unknown test samples, the degas routine is a potential source of uncertainty and bias; in this case, it is critical to perform robustness tests to evaluate the thermal stability of the sample and the appropriate degas parameters (ramp rate, degas temperature, and time). Thermal gravimetric analysis, for example, can be used to optimize the degas procedure. Improper degassing (e.g., incomplete removal of volatiles or temperatures in excess of the thermal stability of the test material) may lead to bias that is not necessarily obvious nor discernible simply by use of reference materials (i.e., the latter only verify basic instrument performance and user proficiency). Other sources of uncertainty may exist beyond those parameters tested in the present study. For instance, according to Badalyan and Pendleton (2003), the liquid nitrogen level relative to the sample is a significant source of uncertainty and a contributor to poor precision in the determination of BET SSA. This uncertainty is minimized by use of a porous isothermal sleeve that maintains a constant cryogen level during the duration of the isotherm determination. Many commercial instruments today use such a sleeve or similar device to control the cryogen level, but older instruments and those produced in-house may lack this control and will thus be subject to such variations.
Acknowledgments
The authors thank the participants of the inter-laboratory study, and acknowledge the Versailles Project on Advanced Materials and Standards (VAMAS) Technical Working Area 34, through which the study was conducted. The authors gratefully acknowledge Drs. R.F. LeBouf and M.A. Virji at NIOSH for helpful discussions on statistical programming and analysis. The author's thank Drs. M.A. Virji at NIOSH and B. Toman in the NIST Statistical Engineering Division for insightful comments and critical review of this manuscript. The findings and conclusions in this report are those of the authors and do not necessarily represent the views of the National Institute for Occupational Safety and Health.
Footnotes
The identification of any commercial product or trade name does not imply endorsement or recommendation by the National Institute of Standards and Technology.
For gas sorption measurements, STP refers to 273.15 K or 0 °C and 101.325 kPa or 1 atm.
References
- ASTM C1274–00 . Standard test method for advanced ceramic specific surface area by physical adsorption. ASTM International, West Conshohocken; PA: 2006. [Google Scholar]
- Badalyan A, Pendleton P. Analysis of uncertainties in manometric gas-adsorption measurements. I: propagation of uncertainties in BET analyses. Langmuir. 2003;19:7919–7928. doi: 10.1016/j.jcis.2008.07.001. doi:10.1021/la020985t. [DOI] [PubMed] [Google Scholar]
- Boverhof DR, David RM. Nanomaterial characterization: considerations and needs for hazard assessment and safety evaluation. Anal Bioanal Chem. 2010;396:953–961. doi: 10.1007/s00216-009-3103-3. doi:10.1007/s00216-009-3103-3. [DOI] [PubMed] [Google Scholar]
- Donaldson K, Stone V, Gilmour PS, Brown DM, MacNee W. Ultrafine particles: mechanisms of lung injury. Philos Trans A: Math Phys Eng Sci. 2000;358:2741–2749. [Google Scholar]
- Duffin R, Tran CL, Clouter A, Brown DM, MacNee W, Stone V, Donaldson K. The importance of surface area and specific reactivity in the acute pulmonary inflammatory response to particles. Ann Occup Hyg. 2002;46(Suppl 1):242–245. doi:10.1093/annhyg/46.suppl_1.242. [Google Scholar]
- Hassellöv M, Readman JW, Ranville JF, Tiede K. Nanoparticle analysis and characterization methodologies in environmental risk assessment of engineered nanoparticles. Ecotoxicology. 2008;17:344–361. doi: 10.1007/s10646-008-0225-x. doi:10.1007/s10646-008-0225-x. [DOI] [PubMed] [Google Scholar]
- ISO/DIS 9277 . Determination of the specific surface area of solids by gas adsorption using the BET method. International Organization for Standardization; Geneva: 2008. [Google Scholar]
- Maier M, Hannebauer B, Holldorff H, Albers P. Does lung surfactant promote disaggregation of nanostructured titanium dioxide? J Occup Environ Med. 2006;48:1314–1320. doi: 10.1097/01.jom.0000215405.72714.b2. doi:10.1097/01.jom.0000215405.72714.b2. [DOI] [PubMed] [Google Scholar]
- Monteiller C, Tran L, MacNee W, Faux S, Jones A, Miller B, Donaldson K. The pro-inflammatory effects of lowtoxicity low-solubility particles, nanoparticles and fine particles, on epithelial cells in vitro: the role of surface area. Occup Environ Med. 2007;64:609–615. doi: 10.1136/oem.2005.024802. doi:10.1136/oem. 2005.024802. [DOI] [PMC free article] [PubMed] [Google Scholar]
- National Institute of Standards and Technology [Accessed 16 October 2012];Standard Reference Material 1898, Certificate of Analysis. 2012 ( https://www-s.nist.gov/srmors/view_cert.cfm?srm=1898)
- Oberdörster G, Oberdörster E, Oberdörster J. Nanotoxicology: an emerging discipline evolving from studies of ultrafine particles. Environ Health Perspect. 2005a;113:823–839. doi: 10.1289/ehp.7339. doi:10.1289/ehp.7339. [DOI] [PMC free article] [PubMed] [Google Scholar]
- Oberdörster G, Maynard A, Donaldson K, Castranova V, Fitzpatrick J, Ausman K, Carter J, Karn B, Kreyling W, Lai D, Olin S, Monteiro-Riviere N, Warheit D, Yang H. Principles for characterizing the potential human health effects from exposure to nanomaterials: elements of a screening strategy. Part Fibre Toxicol. 2005b;2:8. doi: 10.1186/1743-8977-2-8. doi:10.1186/1743-8977-2-8. [DOI] [PMC free article] [PubMed] [Google Scholar]
- OECD . Report 27: List of manufactured nanomaterials and list of endpoints for phase one of the sponsorship programe for the testing of manufactured nanomaterials: Revision. Organization for Economic Cooperation and Development; Paris: Dec, 2010. Series on the safety of manufactured nanomaterials. [Google Scholar]
- Robichaud C, Uyar A, Darby M, Zucker L, Wiesner M. Estimates of upper bounds and trends in nano-TiO2 production as a basis for exposure assessment. Environ Sci Technol. 2009;43:4227–4233. doi: 10.1021/es8032549. doi:10.1021/es8032549. [DOI] [PubMed] [Google Scholar]
- Rouquerol J, Avnir D, Fairbridge CW, Everett DH, Haynes JH, Pernicone N, Ramsay JDF, Sing KSW, Unger KK. Recommendations for the characterization of porous solids. Pure Appl Chem. 1994;66:1739–1758. doi:10.1351/pac199466081739. [Google Scholar]
- Seaton A, Tran L, Aitken R, Donaldson K. Nanoparticles, human health hazard and regulation. J R Soc Interface. 2009;7:S119–S129. doi: 10.1098/rsif.2009.0252.focus. doi:10.1098/rsif.2009.0252.focus. [DOI] [PMC free article] [PubMed] [Google Scholar]
- Sing KSW, Everett DH, Haul RAW, Moscou L, Pierotti RA, Rouquerol J, Siemieniewska T. Reporting physisorption data for gas/solid systems with special reference to the determination of surface area and porosity (Recommendations 1984) Pure Appl Chem. 1985;57:603–619. doi: 10.1351/pac198557040603. [Google Scholar]
- Singh S, Shi T, Duffin R, Albrecht C, van Berlo D, Hohr D, Fubini B, Martra G, Fenoglio I, Borm PJA, Schins RPF. Endocytosis, oxidative stress and IL-8 expression in human lung epithelial cells upon treatment with fine and ultrafine TiO2: role of the specific surface area and of surface methylation of the particles. Toxicol Appl Pharmacol. 2007;222:141–151. doi: 10.1016/j.taap.2007.05.001. doi:10.1016/j.taap.2007.05.001. [DOI] [PubMed] [Google Scholar]
- Stefaniak AB, Hackley VA, Roebben G, Ehara K, Hankin S, Postek MT, Lynch I, Fu W-E, Linsinger TPJ, Thünemann AF. Nanotoxicology. 2012. Nanoscale reference materials for environmental, health, and safety measurements: needs, gaps, and opportunities. doi:10.3109/17435390.2012.739664. [DOI] [PubMed] [Google Scholar]
- Stoeger T, Reinhard C, Takenaka S, Schroeppel A, Karg E, Ritter B, Heyder J, Schulz H. Instillation of six different ultrafine carbon particles indicates a surface area threshold dose for acute lung inflammation in mice. Environ Health Perspect. 2006;114:328–333. doi: 10.1289/ehp.8266. doi:10.1289/ehp.8266. [DOI] [PMC free article] [PubMed] [Google Scholar]