Abstract
We demonstrate a jitter noise reduction technique for acoustic radiation force impulse microscopy via photoacoustic detection (PA-ARFI), which promises to be capable of measuring cell mechanics. To reduce the jitter noise induced by Q-switched pulsed laser operated at high repetition frequency, photoacoustic signals from the surface of an ultrasound transducer are aligned by cross-correlation and peak-to-peak detection, respectively. Each method is then employed to measure the displacements of a target sample in an agar phantom and a breast cancer cell due to ARFI application, followed by the quantitative comparison between their performances. The suggested methods for PA-ARFI significantly reduce jitter noises, thus allowing us to measure displacements of a target cell due to ARFI application by less than 3 μm.
OCIS codes: (170.7170) Ultrasound, (170.5120) Photoacoustic imaging, (170.0180) Microscopy
1. Introduction
For decades, various acoustic radiation force impulse (ARFI) imaging techniques have been developed as a non-invasive ultrasonic palpation method for quantitative measurement of elastic properties of tissues [1]. For estimation of the elastic properties of tissues, ARFI imaging utilizes short-duration focused acoustic beams to induce localized displacements within the tissues of interest and the displacements are then estimated with cross-correlation-based algorithms between echo signals acquired from the regions before and after excitation [2]. This excitation method, utilized for ARFI imaging, typically offers several advantages over other external force excitation methods such as external static compression, external dynamic vibration, or naturally occurring physiologic motion, namely [3]: 1) smaller stresses since the focused acoustic radiation force is directly applied to the region of interest during excitation and 2) only moderate challenges in coupling the excitation to the target tissue [1]. Therefore, ARFI imaging has become one of the useful elastographic techniques for diagnosing and monitoring various diseases in preclinical and clinical settings [4, 5].
In the clinical settings, ARFI imaging was employed to characterize elasticity of abdominal [6], cardiac [7], vascular [8], and breast tissues [9] for a quantitative assessment of diseased lesions. For examples, tumor regions in the gastrointestinal tract were clearly discriminated from normal regions using ARFI imaging with short-duration, impulse-like excitation [10]. Also, mechanical properties of blood clots in blood samples could be estimated using sonorheometry, which utilized ARFI to produce localized displacements, therefore enabling an assessment of thrombogenicity of the blood samples [11]. Furthermore, the ARFI imaging techniques allowed distinguishing in vivo a cyst from solid lesions in the breast [12] as well as a reactive lymph node from a breast mass [9] by estimating the visco-elastic properties of target regions.
In addition to its application in the clinical settings, more advanced ARFI imaging techniques with high-frequency ultrasound transducers were devised for preclinical applications. In particular, the stiffness of the internal micro-structures of a zebrafish embryo could be quantitatively determined by using high-frequency ARFI imaging at 100 MHz, offering a two-dimensional map of mechanical properties of the zebrafish embryo [13].
More recently, the high-frequency ARFI imaging technique was employed to measure cell mechanics in vitro. In the measurement of cell mechanics by using ARFI imaging, three types of sequences (reference, pushing and tracking) are typically required: the reference sequence for determining the initial position of the target, the pushing sequence for applying acoustic radiation force to induce localized displacement, and the tracking sequence for monitoring the displacements of the target. However, for tracking cell displacements in the conventional ARFI methods utilizing pulse-echo technique, the operating frequency of a transducer may need to be further increased to beyond 300 MHz for the discrimination of the echo signals from a cell and the substrate where the cell was cultured. Therefore, as an alternative method for the measurement of cell mechanics, ARFI microscopy via photoacoustic detection (PA-ARFI) was newly developed [14]. In the PA-ARFI, a photoacoustic (PA) detection technique with functionalized carbon nanotube was employed to acquire PA signals corresponding to the reference and tracking sequences instead of using the pulse-echo technique, which is typically utilized in the conventional ARFI imaging method. In the PA-ARFI, to precisely track fast membrane displacements due to ARFI applied to a target cell, the repetition frequency of pulsed laser light, which is delivered to a target, needed to be higher than several kHz [14]. It was however observed that jitter noises induced by a Q-switched pulsed laser became significantly higher when the repetition rate of the pulsed laser light was increased over 10 kHz, thus resulting in great challenges for measurement of the displacements of a target under such a condition with high accuracy. Therefore, for precise measurement of target displacements in PA-ARFI, it would be crucial to reduce the effects of the laser jitters since the cell displacements produced by ARFI are typically expected to be less than several micrometers.
In this paper, we thus demonstrate a jitter noise reduction technique by exploiting PA signal generated from the surface of a lithium niobate (LiNbO3) ultrasound transducer for PA-ARFI microscopy. Here in order to reduce the jitter noise, acquired PA signals were first rearranged by aligning the PA signals from the transducer surface using a cross-correlation and a peak-to-peak detection technique, and then the ARFI-induced displacements in the target PA signals were tracked by using the techniques, respectively. Their performances were quantitatively compared. For the quantitative comparison of the cross-correlation and the peak-to-peak detection methods in PA-ARFI, each method was employed to measure displacements of a target sample in an agar phantom and a breast cancer cell produced by ARFI, and the variations in the estimated target displacements were quantified.
2. Methods
2.1 PA-ARFI system
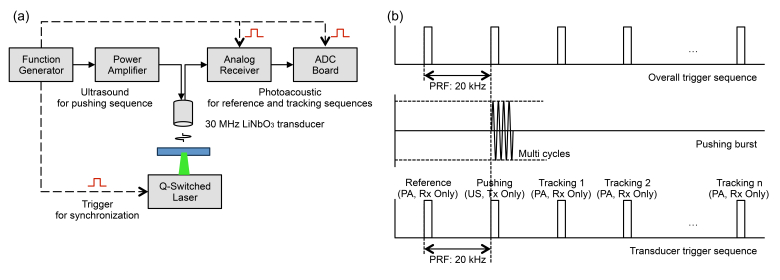
The PA-ARFI system was composed of an inverted microscope (IX71, Olympus), a Q-switched pulsed laser at 532 nm (Explorer, Spectra-physics), a function generator (AFG3252, Tektronix), a custom-built power amplifier [15], an analog receiver (5900PR, Panametrics-NDT), an analog-to-digital converter (ADC board) (CS122G1, GaGe), and a single element 30 MHz lithium niobate (LiNbO3) ultrasound transducer. Figure 1(a) illustrates the configuration of the PA-ARFI microscopy. The PA-ARFI microscopy utilized the Q-switched pulsed laser to generate PA signals from a target, and the single element ultrasound transducer was used to receive PA signals and generate acoustic radiation force. The function generator was utilized to send out trigger signals to other devices for synchronization among the analog receiver, ADC board, and laser as indicated as the dashed arrows in Fig. 1(a). The trigger signals for synchronization were here generated and distributed at the pulse repetition frequency (PRF) of 20 kHz to the system. The pulse sequences of the PA-ARFI are illustrated in Fig. 1(b). Before applying the acoustic radiation force to the target, PA signal was acquired to use as a reference for the initial position of the target. After the reference PA signal was acquired, acoustic radiation force was applied to induce the localized displacement of the target and the tracking PA signals were acquired to estimate the displacement of the target induced by the acoustic radiation force. Note that we applied the pulsed laser light to the target for very short duration (25 ms) and the total fluence of the applied laser light for PA signal excitation was less than 9 mJ cm−2 as described previously [14].
Fig. 1.
(a) The configuration of PA-ARFI microscopy and (b) the pulse sequences for PA-ARFI (reference, pushing and tracking).
2.2 Pulse to pulse timing jitter reduction and displacement tracking methods
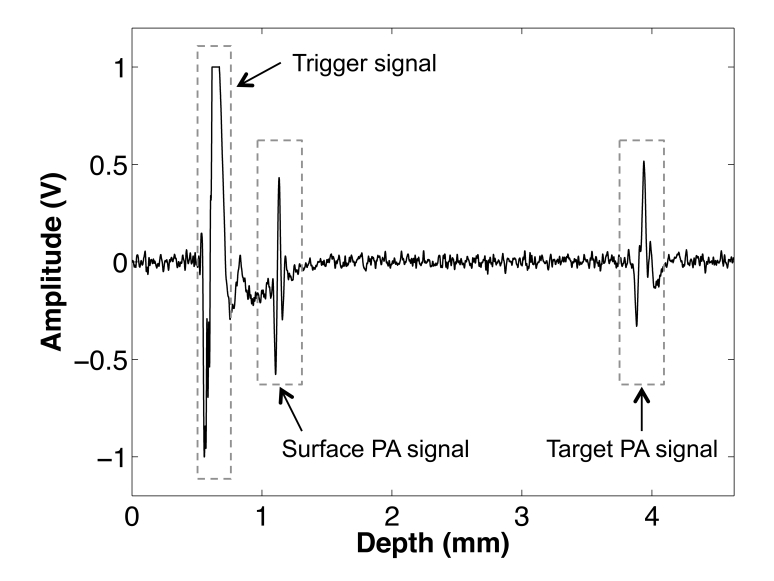
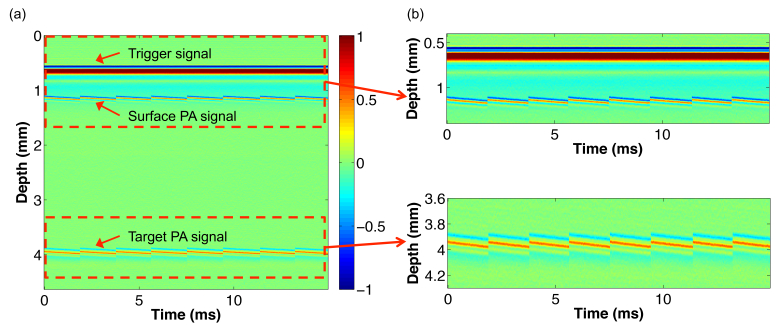
The displacement of a target induced by applied acoustic radiation force can be estimated using the radio-frequency (RF) signals acquired in the reference and tracking sequences. Figure 2 shows the representative RF signal composed of three components: a trigger signal, a surface PA signal, and a target PA signal. The trigger signal represents the signal which was generated from a function generator for the system synchronization. The surface PA signal was generated from the surface of the transducer, and the target PA signal was from the target. Figure 3(a) represents the signal intensities as a two-dimensional image along the depth at each time. The surface and target PA signals were drifted due to the pulse to pulse timing jitters of the Q-switched pulsed laser at high pulse repetition frequency (PRF = 20 kHz) while the trigger signal was not drifted as shown in Fig. 3(b). Previous study reported that pulse to pulse timing jitter of the conventional Q-switched laser was found to be ~ ± 241 nsec under the normal operation whereas it was found to be ~ ± 20 nsec under the operation with optical triggering [16]. Note that the corresponding displacements to the jitters of ± 241 and ± 20 nsec are ~ ± 356.6 μm and ~ ± 29.6 μm, respectively. Therefore, pulse to pulse timing jitters should be compensated prior to performing the tracking methods to estimate the displacement of the target. The jitters can be reduced by utilizing the surface PA signal since the position of the transducer was fixed. The received RF signals were digitized with a sampling frequency of 2 GHz and further up-sampled to 20 GHz using a simple polynomial interpolation function with symmetric coefficient in Matlab. In the filtered approach, a finite impulse response (FIR) filter centered at 30 MHz with a fractional bandwidth of 0.75 was applied to the fully sampled 2 GHz data to further remove noise components.
Fig. 2.
(a) The representative RF signal which is composed of three components: a trigger signal, a surface PA signal, and a target PA signal. The trigger signal represents the signal which was distributed from a function generator for the system synchronization. The surface and target PA signal were generated from the transducer surface and the target, respectively.
Fig. 3.
(a) Signal intensities represented as a 2-D image along the depth at each time and (b) the magnified 2-D images which contain the trigger, surface PA and target PA signal components. Both surface and target PA signals were drifted because of the pulse to pulse timing jitter of the Q-switched pulsed laser.
2.2.1 Peak-to-peak method
A peak-to-peak method utilizes the position of the positive peak amplitude of the surface PA signal to reduce the pulse to pulse timing jitter. The peak locations of the surface PA signals in both reference and tracking sequences were extracted first and the relative difference of peak locations were calculated. Based on these relative distances between reference and tracking sequences, the RF signals were rearranged to align the peak location of each surface PA signal to remain the same for further target displacement estimation. The target displacements were subsequently estimated with the peak-to-peak method, which utilizes peak locations of the target PA signal between the reference and the tracking sequences. Therefore, the peak position of the target PA signal in the reference sequence was the initial position of the target, and the relative differences in distance were the displacement of the target.
2.2.2 Cross-correlation method
Cross-correlation is a measure of similarity of two waveforms as a function of the time-lag that is applied to one of them. The maximum of the cross-correlation function indicates the point at which two signals are most similar to each other, and thus can be used to determine the displacement between signals in the reference and tracking sequences. However, due to the pulse to pulse timing jitters from the laser, cross-correlation cannot be applied directly to the target PA signals acquired in the reference and tracking sequences to calculate the target displacement. Therefore, the pulse to pulse timing jitter needs to be compensated first. Suppression of the pulse to pulse timing jitter was carried out using cross-correlation approach similar to that using the peak-to-peak approach. Based on the time-lags of the surface PA signals between the reference and tracking sequences calculated from the normalized cross-correlation, RF signals were rearranged and then normalized cross-correlation was further applied to estimate the target displacements.
The normalized cross-correlation between a reference s1[i] and tracking s2[i] sequences is defined as [17]:
| (1) |
where r is the origin of the reference window, N is the length of the windows, and τ is the search lag.
2.3 Agar phantom
In order to evaluate the performance of jitter reduction methods, tissue-mimicking phantom with three layers including a substrate, an agar gel, and a functionalized single-walled carbon nanotubes (FCNT) layer was fabricated as described previously [14].
2.4 Cell preparation
SKBR3 human breast cancer cell lines were obtained from the ATCC (Manassas, VA), and maintained in Dulbecco’s modified eagle medium (DMEM) containing 10% fetal bovine serum. SKBR3 cells were plated on 35 mm petri dish and incubated in the complete medium at 37°C for 36 hours prior to FCNT labeling of the cells. For the FCNT labeling of the cells, FCNTs diluted with HBSS (final concentration: 0.1 μg/ml) were added into the petri dish, rocked for 30 minutes, and then incubated at 37°C for 4 hours. The amine-terminated end of FCNTs here allowed to be attached to biological systems such as DNA and carbohydrates as described previously [14].
3. Results
3.1 Phantom study
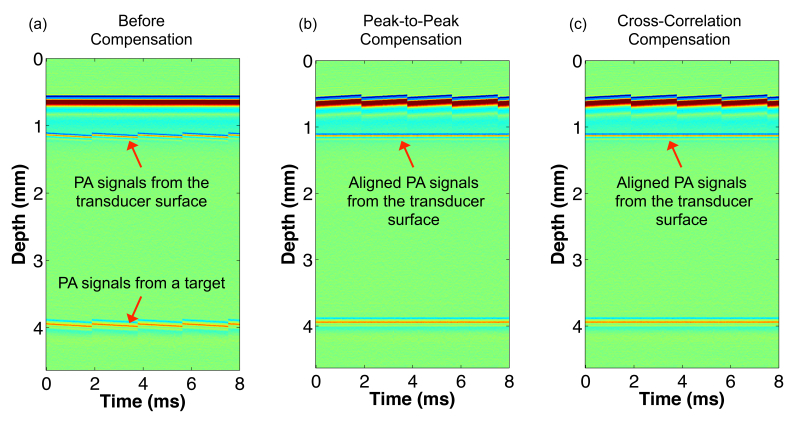
The pulse to pulse timing jitters from the Q-switched pulsed laser at high PRF were reduced by aligning the PA signals from the surface of the transducer using the peak-to-peak and cross-correlation method, respectively. The performance of each jitter reduction method was evaluated with the agar phantom without applying acoustic radiation force. Figure 4(a) shows an image of the received RF signals before applying the jitter reduction methods. Both the surface and target PA signals drift due to the pulse to pulse timing jitters. In contrast, Fig. 4(b) and 4(c) show the images of rearranged RF signals after applying the peak-to-peak and cross-correlation methods, respectively. The pulse to pulse timing jitters were reduced and aligned as shown in Figs. 4(b) and 4(c). Note that PA signals from the transducer surface were always located at an initial temporal location during the experiment since the transducer was stationary.
Fig. 4.
Images of the RF signals of (a) before applying jitter reduction method, and after applying (b) peak-to-peak and (c) cross-correlation methods.
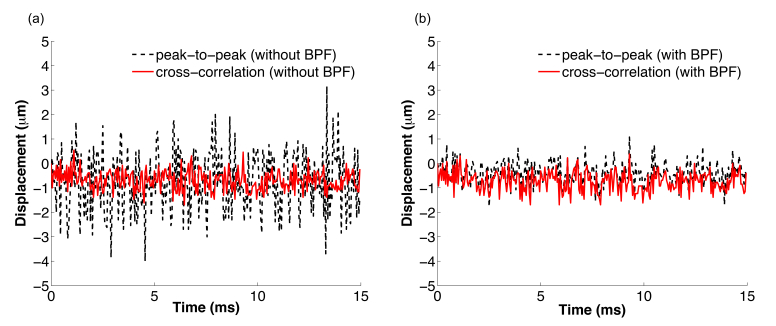
Furthermore, to evaluate the performance of two displacement tracking methods with and without bandpass filtering, temporal variations of target signals from the agar phantom were examined while acoustic radiation force was not applied to the phantom. Figure 5 shows the target signal variations obtained by both the peak-to-peak and cross-correlation method without [Fig. 5(a)] and with [Fig. 5(b)] bandpass filtering. The black-dashed and red-solid lines indicate the target signal variations at each moment calculated by applying peak-to-peak and cross-correlation method, respectively. The root mean square error (RMSE) values of the measured displacement obtained by each jitter reduction method were calculated to be 1.1893 for peak-to-peak and 0.3933 for cross-correlation without bandpass filtering. Here it was found that the peak-to-peak method produced almost three times higher fluctuation than the cross-correlation method. In contrast, when the bandpass filtering was applied to the PA signals before the signals were processed with each method, the RMSE values for the peak-to-peak method became slightly higher than those for the cross-correlation method. The RMSE values were here found to be 0.4588 and 0.4023 for the peak-to-peak and cross-correlation method with bandpass filtering, respectively.
Fig. 5.
Temporal variations of a target signal reconstructed by the peak-to-peak (black-dashed line) and cross-correlation (red-solid line) method (a) without and (b) with bandpass filtering (BPF).
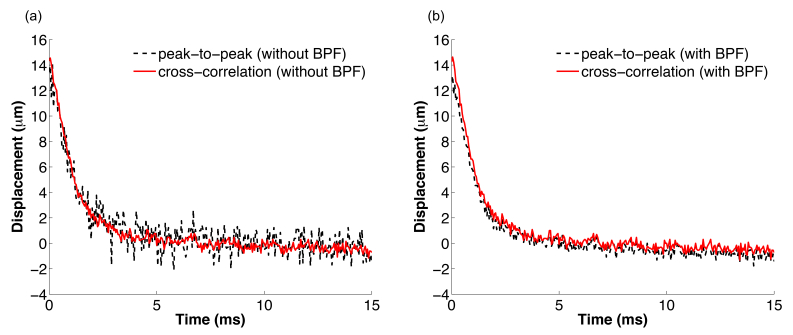
In addition, the displacements of a target in the phantom due to ARFI application were measured by using the peak-to-peak and cross-correlation method without [Fig. 6(a)] and with [Fig. 6(b)] bandpass filtering. The black-dashed and red-solid lines indicate the displacements calculated by applying the peak-to-peak and cross-correlation method, respectively. The peak displacement was estimated to be 14.17 µm by the peak-to-peak method without bandpass filtering whereas it was estimated to be 14.55 µm by the cross-correlation method without bandpass filtering. However, the fluctuations in the displacement estimated by the peak-to-peak method were much higher than those in the displacement by the cross-correlation method. In contrast, when the bandpass filtering was applied to the PA signals, the fluctuations in the displacement obtained using the peak-to-peak method were significantly reduced as shown in Fig. 6(b). The maximum displacements were here measured to be 13.17 µm and 14.63 µm by using the peak-to-peak and the cross-correlation method with bandpass filtering, respectively.
Fig. 6.
Temporal displacements of a target due to ARFI application: Temporal displacements obtained by using the peak-to-peak (black-dashed line) and cross-correlation (red-solid line) method (a) without and (b) with bandpass filtering (BPF).
3.2 Cell study
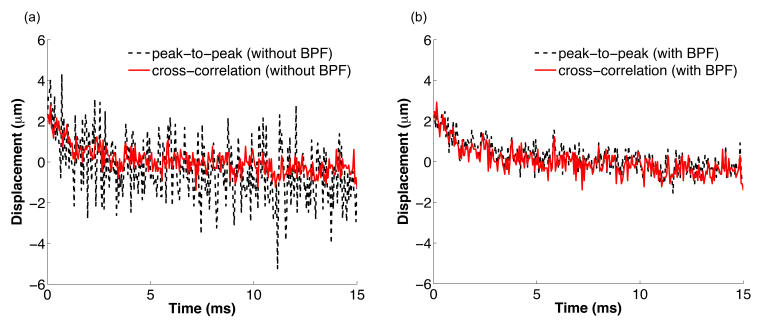
The tracking methods with and without bandpass filtering were further applied to measure ARFI-induced displacements of membrane of a SKBR3 human breast cancer cell. Figure 7 shows the displacements of cell membrane due to ARFI application. The peak displacement estimated by the peak-to-peak (black-dashed line) and cross-correlation method (red-solid line) without bandpass filtering were here found to be 4.004 µm and 2.772 µm, whereas the peak displacements by the peak-to-peak and cross-correlation method with bandpass filtering were 2.618 µm and 2.926 µm, respectively [Fig. 7]. As shown in the phantom experiments, the fluctuation in the displacement of a target cell estimated by the peak-to-peak method was also significantly reduced when the bandpass filtering was applied to the PA signals prior to performing the peak-to-peak method.
Fig. 7.
Temporal displacements of cell membrane due to ARFI application: Cell membrane displacement obtained by using the peak-to-peak (black-dashed line) and cross-correlation (red-solid line) method (a) without and (b) with bandpass filtering (BPF).
4. Discussion and conclusions
In this study, PA signals from the surface of the LiNbO3 ultrasound transducer were exploited to reduce the Q-switched laser-induced jitter noises. The ultrasound transducer consisted of several layers including backing, LiNbO3, 1st, and 2nd matching layers. In particular, the transducer surface was coated with Cr/Au electrodes to make connection between an acoustic stack and brass housing before the 2nd matching layer was deposited [18]. Recently, various forms of Au materials, including Au nanoparticles and nanorods, have been widely utilized as a contrast agent for PA imaging [19]. The Au materials typically generate strong PA signals when they absorbed short pulsed light. Therefore, the PA signals from the transducer surface may be generated by the Au material coated on the surface of the transducer.
In Fig. 4, it was observed that the jitter pattern of the PA signals from a target was similar to the jitter pattern of the PA signals from the transducer surface. Note that the transducer attached on the motorized stage was not moved during the experiment and therefore the temporal location of the PA signals from the transducer surface should not be changed under the normal condition. Therefore, the PA signals from the transducer surface were aligned with the methods aforementioned previously in order to reduce the laser-induced jitter noise. Figure 4 showed that the jitter noises in both the surface and target PA signals were significantly reduced by the suggested methods.
The cross-correlation technique, measurement of the similarity between a windowed length of data from the reference and tracking signals, has been widely used to find the peak displacement in ARFI imaging [1, 20, 21] and it has been often considered the gold standard for ultrasonic displacement estimation [21]. In this study, the cross-correlation method indeed produced lower jitter than the peak-to-peak method with and without bandpass filtering, thus allowing us to find more reliable peak displacements. In our previous study [14], a cross-correlation method without bandpass filtering was utilized to measure cell membrane displacements due to ARFI. In this study, the cross-correlation method with bandpass filtering somewhat offers somewhat the lower RMSE value than the cross-correlation method without bandpass filtering in both phantom and cell experiment. However, although the slightly lower RMSE can be achieved by using the cross-correlation method with bandpass filtering, we can intuitively infer that the cross-correlation method with bandpass filtering may offer more reliable outcomes under high frequency noises generated by electronic devices utilized for the PA-ARFI microscopy. In contrast, the peak-to-peak method measures the temporal distance between the peaks within a windowed length of data from the reference and tracking signals. In fact, the peaks of RF signals would be easily affected by high frequency noises such as the shot noise. Therefore, because of these reasons, the displacements estimated by the peak-to-peak method without bandpass filtering were likely to show such high jitters. However, with bandpass filtering, the peak-to-peak detection method produced much less jitters in the displacement estimation. Table 1 illustrates the quantitative analysis of the displacement results. As shown in Table 1, the PTP method with bandpass filtering allowed to significantly reduce the RMSE value by 0.5018 from 1.3484 compared to the PTP method without bandpass filtering. The corresponding displacement errors can be reduced by almost ~0.5 µm. The bandpass filtering here eliminated high frequency noises over the cutoff frequency in the RF signal and thus might offer a better outcome by using the peak-to-peak detection. However, although the peak-to-peak detection method with bandpass filtering resulted in the improved jitter reduction, it still produced slightly higher jitter than the cross-correlation method (Table 1). Therefore, these results suggested that the cross-correlation method is more desirable than the peak-to-peak method for PA-ARFI displacement estimation.
Table 1. Quantitative analysis of the displacement results obtained by using a peak-to-peak detection and cross-correlation method with and without bandpass filtering: root mean square error (RMSE) values were calculated after applying curve fitting on the estimated displacements by each method (BPF: bandpass filtering, C.C: cross-correlation, PTP: peak-to-peak).
| No ARFI application | Phantom experiment | Cell experiment | ||||||||||
|---|---|---|---|---|---|---|---|---|---|---|---|---|
| Without BPF | With BPF | Without BPF | With BPF | Without BPF | With BPF | |||||||
| C.C | PTP | C.C | PTP | C.C | PTP | C.C | PTP | C.C | PTP | C.C | PTP | |
| RMSE | 0.397 | 1.188 | 0.406 | 0.460 | 0.3194 | 0.9146 | 0.3178 | 0.3625 | 0.4375 | 1.3484 | 0.4261 | 0.5018 |
In conclusion, we demonstrate a jitter noise reduction technique via alignment of stationary PA signals from the surface of a 30 MHz single element LiNbO3 transducer by simple displacement estimation methods, including peak-to-peak detection and cross-correlation, for PA-ARFI microscopy. In our previous study, the PA-ARFI microscopic technique was shown to be capable of measuring the mechanics of breast cancer cells. In particular, it allowed us to discriminate between the mechanical properties of highly-invasive and weakly-invasive breast cancer cells. In this study, we underlined the jitter noise reduction technique based on the peak-to-peak detection and cross-correlation methods for measurement of cell mechanics using the PA-ARFI microscopy in detail. Here the alignment of PA signals from the surface of the transducer with peak-to-peak detection and cross-correlation significantly reduced the jitter noises in target PA signals. It was found that the cross-correlation method without bandpass filtering produced less fluctuations in target PA signals than the peak-to-peak method without bandpass filtering. Interestingly, the peak-to-peak method with bandpass filtering further reduced the fluctuations, which were found to be still slightly higher than those by the cross-correlation method with bandpass filtering. Finally, after reduction of the jitter noises induced by the Q-switched laser operated at 20 kHz using the techniques with bandpass filtering, the cell displacements of less than 3 μm due to ARFI could be measured. Altogether, these results demonstrated that the suggested technique for PA-ARFI microscopy significantly reduced jitter noises induced by the Q-switched laser, thus enabling to quantify cell mechanics by precise estimation of the displacement of a target due to ARFI application.
Acknowledgments
This work has been supported by the National Research Foundation of Korea (NRF) and DGIST grant (NRF-2014R1A1A2054934, NRF-2014M3A9D7070668, and 15-HRLA-01) funded by the Ministry of Science, ICT & Future Planning to J.Y. Hwang and by the NIH grants (P41-EB002182 and R01-EB012058) to K.K. Shung at USC.
Published with low-res figures; corrected in PDF and full-text display.
References and links
- 1.Nightingale K., “Acoustic radiation force impulse (ARFI) imaging: a review,” Curr. Med. Imaging Rev. 7(4), 328–339 (2011). 10.2174/157340511798038657 [DOI] [PMC free article] [PubMed] [Google Scholar]
- 2.Nightingale K., Soo M. S., Nightingale R., Trahey G., “Acoustic radiation force impulse imaging: in vivo demonstration of clinical feasibility,” Ultrasound Med. Biol. 28(2), 227–235 (2002). 10.1016/S0301-5629(01)00499-9 [DOI] [PubMed] [Google Scholar]
- 3.Greenleaf J. F., Fatemi M., Insana M., “Selected methods for imaging elastic properties of biological tissues,” Annu. Rev. Biomed. Eng. 5(1), 57–78 (2003). 10.1146/annurev.bioeng.5.040202.121623 [DOI] [PubMed] [Google Scholar]
- 4.Konofagou E. E., Maleke C., Vappou J., “Harmonic motion imaging (HMI) for tumor imaging and treatment monitoring,” Curr. Med. Imaging Rev. 8(1), 16–26 (2012). 10.2174/157340512799220616 [DOI] [PMC free article] [PubMed] [Google Scholar]
- 5.Ophir J., Céspedes I., Ponnekanti H., Yazdi Y., Li X., “Elastography: a quantitative method for imaging the elasticity of biological tissues,” Ultrason. Imaging 13(2), 111–134 (1991). 10.1177/016173469101300201 [DOI] [PubMed] [Google Scholar]
- 6.Fahey B. J., Nightingale K. R., Nelson R. C., Palmeri M. L., Trahey G. E., “Acoustic radiation force impulse imaging of the abdomen: demonstration of feasibility and utility,” Ultrasound Med. Biol. 31(9), 1185–1198 (2005). 10.1016/j.ultrasmedbio.2005.05.004 [DOI] [PubMed] [Google Scholar]
- 7.Hsu S. J., Bouchard R. R., Dumont D. M., Wolf P. D., Trahey G. E., “In vivo assessment of myocardial stiffness with acoustic radiation force impulse imaging,” Ultrasound Med. Biol. 33(11), 1706–1719 (2007). 10.1016/j.ultrasmedbio.2007.05.009 [DOI] [PMC free article] [PubMed] [Google Scholar]
- 8.Dahl J. J., Dumont D. M., Allen J. D., Miller E. M., Trahey G. E., “Acoustic radiation force impulse imaging for noninvasive characterization of carotid artery atherosclerotic plaques: a feasibility study,” Ultrasound Med. Biol. 35(5), 707–716 (2009). 10.1016/j.ultrasmedbio.2008.11.001 [DOI] [PMC free article] [PubMed] [Google Scholar]
- 9.Mullen R., Thompson J. M., Moussa O., Vinnicombe S., Evans A., “Shear-wave elastography contributes to accurate tumour size estimation when assessing small breast cancers,” Clin. Radiol. 69(12), 1259–1263 (2014). 10.1016/j.crad.2014.08.002 [DOI] [PubMed] [Google Scholar]
- 10.Palmeri M. L., Frinkley K. D., Zhai L., Gottfried M., Bentley R. C., Ludwig K., Nightingale K. R., “Acoustic radiation force impulse (ARFI) imaging of the gastrointestinal tract,” Ultrason. Imaging 27(2), 75–88 (2005). 10.1177/016173460502700202 [DOI] [PubMed] [Google Scholar]
- 11.Viola F., Kramer M. D., Lawrence M. B., Oberhauser J. P., Walker W. F., “Sonorheometry: a noncontact method for the dynamic assessment of thrombosis,” Ann. Biomed. Eng. 32(5), 696–705 (2004). 10.1023/B:ABME.0000030235.72255.df [DOI] [PubMed] [Google Scholar]
- 12.Nightingale K. R., Kornguth P. J., Walker W. F., McDermott B. A., Trahey G. E., “A novel ultrasonic technique for differentiating cysts from solid lesions: preliminary results in the breast,” Ultrasound Med. Biol. 21(6), 745–751 (1995). 10.1016/0301-5629(95)00020-R [DOI] [PubMed] [Google Scholar]
- 13.Park J., Lee J., Lau S. T., Lee C., Huang Y., Lien C. L., Kirk Shung K., “Acoustic radiation force impulse (ARFI) imaging of zebrafish embryo by high-frequency coded excitation sequence,” Ann. Biomed. Eng. 40(4), 907–915 (2012). 10.1007/s10439-011-0466-3 [DOI] [PMC free article] [PubMed] [Google Scholar]
- 14.Hwang J. Y., Kang B. J., Lee C., Kim H. H., Park J., Zhou Q., Shung K. K., “Non-contact acoustic radiation force impulse microscopy via photoacoustic detection for probing breast cancer cell mechanics,” Biomed. Opt. Express 6(1), 11–22 (2015). 10.1364/BOE.6.000011 [DOI] [PMC free article] [PubMed] [Google Scholar]
- 15.Park J., Hu C., Li X., Zhou Q., Shung K. K., “Wideband linear power amplifier for high-frequency ultrasonic coded excitation imaging,” IEEE Trans. Ultrason. Ferroelectr. Freq. Control 59(4), 825–832 (2012). 10.1109/TUFFC.2012.2261 [DOI] [PubMed] [Google Scholar]
- 16.Cole B., Goldberg L., Trussell C. W., Hays A., Schilling B. W., McIntosh C., “Reduction of timing jitter in a Q-Switched Nd:YAG laser by direct bleaching of a Cr4+:YAG saturable absorber,” Opt. Express 17(3), 1766–1771 (2009). 10.1364/OE.17.001766 [DOI] [PubMed] [Google Scholar]
- 17.Viola F., Walker W. F., “A spline-based algorithm for continuous time-delay estimation using sampled data,” IEEE Trans. Ultrason. Ferroelectr. Freq. Control 52(1), 80–93 (2005). 10.1109/TUFFC.2005.1397352 [DOI] [PubMed] [Google Scholar]
- 18.Lee J., Teh S. Y., Lee A., Kim H. H., Lee C., Shung K. K., “Transverse acoustic trapping using a gaussian focused ultrasound,” Ultrasound Med. Biol. 36(2), 350–355 (2010). 10.1016/j.ultrasmedbio.2009.10.005 [DOI] [PMC free article] [PubMed] [Google Scholar]
- 19.Namura K., Suzuki M., Nakajima K., Kimura K., “Photoacoustic emission from Au nanoparticles arrayed on thermal insulation layer,” Opt. Express 21(7), 8689–8700 (2013). 10.1364/OE.21.008689 [DOI] [PubMed] [Google Scholar]
- 20.Patel V., Dahl J. J., Bradway D. P., Doherty J. R., Lee S. Y., Smith S. W., “Acoustic radiation force impulse imaging (ARFI) on an IVUS circular array,” Ultrason. Imaging 36(2), 98–111 (2014). 10.1177/0161734613511595 [DOI] [PMC free article] [PubMed] [Google Scholar]
- 21.Doherty J. R., Trahey G. E., Nightingale K. R., Palmeri M. L., “Acoustic radiation force elasticity imaging in diagnostic ultrasound,” IEEE Trans. Ultrason. Ferroelectr. Freq. Control 60(4), 685–701 (2013). 10.1109/TUFFC.2013.2617 [DOI] [PMC free article] [PubMed] [Google Scholar]


