Abstract
Pheochromocytomas are relatively rare tumors of the adrenal medulla. A wide spectrum of imaging findings has been described. The aim of this article is to describe the multimodality imaging features of pheochromocytomas including diagnostic pearls that can help differentiate them from other adrenal lesions and pitfalls to avoid.
Keywords: Adrenal glands, pheochromocytoma, computed tomography (CT), magnetic resonance imaging (MRI), radionuclide imaging
Pheochromocytomas are relatively rare catecholamine-secreting tumors that arise from the chromaffin cells of the adrenal medulla or extraadrenal paraganglia. The incidence of pheochromocytoma in the general population was 0.05% in an autopsy study (1), with a prevalence of 0.1-0.6% in hypertensive adults (2-4). There is a slight female predilection, with a female:male ratio of 1.4:1 (5). The mean age of presentation of sporadic pheochromocytomas is approximately 44 years, which is older than those with a genetic predisposition who present at approximately 25 years of age (6). Pheochromocytomas are exceptionally rare in the pediatric population, however, when they do occur there is a higher incidence of both malignancy (47% vs. 10% in adults) and genetic predisposition than in adults (7,8).
Until recently, the majority of pheochromocytomas or paragangliomas were classified as sporadic, with only 10% considered genetically associated. However, due to recent advances in molecular genetics it is now thought that at least one third of all patients with either a pheochromocytoma or paraganglioma harbor a genetic mutation (6,9) and this proportion will likely rise as further genes are formally characterized. To date, there are six pheochromocytoma/paraganglioma-predisposing genes recognized: the von-Hippel Lindau tumor suppressor gene (Figures 1,2), the RET proto-oncogene leading to multiple endocrine neoplasia type 2 (Figure 3), the neurofibromatosis type 1 gene, and the three genes encoding subunits of B, C, and D of mitochondrial succinate dehydrogenase (10). Other inherited conditions (e.g., tuberous sclerosis and Carney triad) and non-familial syndromes (e.g., Sturge-Weber) are also associated with pheochromocytomas and paragangliomas. The panel at the First International Symposium on Pheochromocytoma recommended that it is neither appropriate nor currently cost effective to test every disease-causing gene in every patient with a pheochromocytoma and paraganglioma. To choose a proper genetic test, the biochemical profile of catecholamine secretion, age of the patient, location of the primary tumor, and previous family history are included in the genetic algorithm (11).
Figure 1.
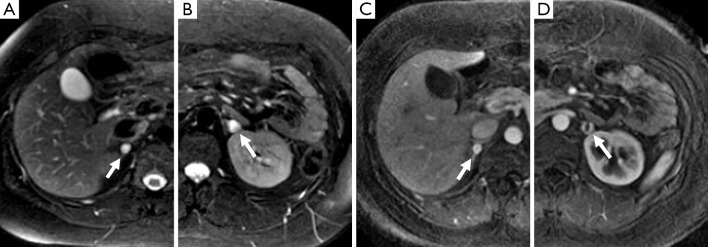
A 25-year-old woman with a history of VHL. There are T2-hyperintense lesions (arrow) in the right (A) and left (B) adrenal glands on MR. The right adrenal lesion demonstrates homogenous avid enhancement (C), while the lesion on the left (D) has a central area that does not enhance which likely represents necrosis and a peripheral rim of marked enhancement of similar intensity to the right. These were both confirmed pheochromocytomas on resection.
Figure 2.
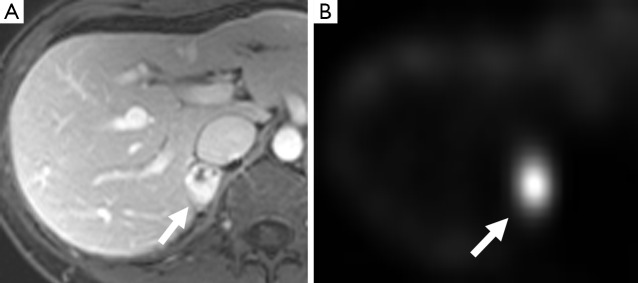
A 30-year-old woman with VHL. There is a right adrenal lesion (arrow) which demonstrates predominantly marked enhancement post gadolinium on MR (A) and shows significant uptake on MIBG (B). This was confirmed as a pheochromocytoma on resection. MIBG, metaiodobenzylguanidine.
Figure 3.
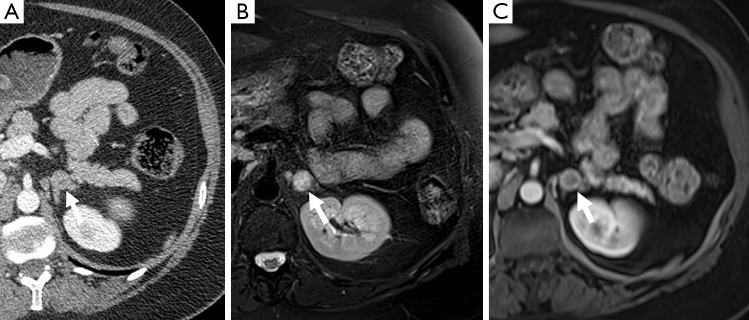
A 48-year-old woman with a history of medullary thyroid cancer. There is a left adrenal nodule (arrow) which demonstrates mild enhancement on CT (A), is T2 hyperintense on MR (B), and demonstrates heterogeneous predominantly peripheral enhancement after gadolinium administration (C). This was confirmed as a pheochromocytoma on resection. CT, computed tomography.
In approximately 3-7% of patients undergoing computed tomography (CT) an incidental adrenal lesion is identified (12). Adrenal adenomas are the most common adrenal incidentaloma in patients without cancer accounting for 80% of lesions, with myelolipoma accounting for 6% and pheochromocytoma for 3% (13,14). A wide spectrum of imaging findings on all modalities has been described for pheochromocytomas and they can mimic other benign and malignant adrenal lesions. It is important for radiologists to be aware of the spectrum of appearances that they can assume at imaging as pheochromocytomas are often clinically occult.
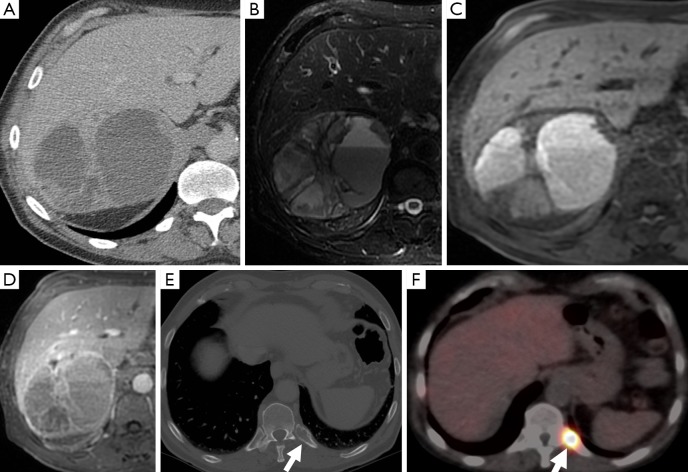
Another important role of imaging is to assess for metastases as this is the only reliable criterion for the diagnosis of malignant pheochromocytoma (Figures 4,5). Some authors have suggested that the risk of malignancy is associated with increasing tumor size, however, there is no clear cutoff size to distinguish between benign and malignant lesions. One study found that malignant pheochromocytomas were larger than benign ones (7.6±4.2 vs. 5.3±2.3 cm), however, there was no significant difference between the size of malignant pheochromocytomas without local invasion or metastases and benign pheochromocytoma (6.1±3.1 vs. 5.3±2.3 cm) (15). An other study had patients with tumors as small as 2 cm which had synchronous metastatic disease and a patient with a 1 cm tumor who developed metastatic disease within one year after surgical resection (16). It is therefore important that all patients be followed-up and not to assume that small tumors are always benign.
Figure 4.
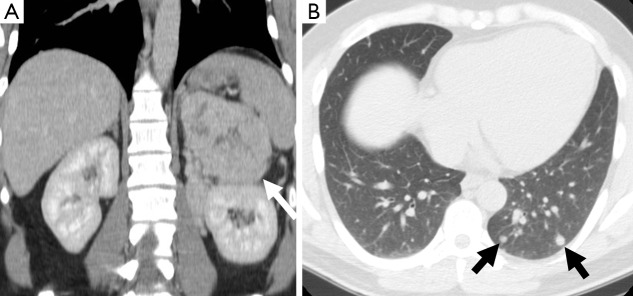
A 27-year-old man who presented with hypertensive crisis. CT scan of the abdomen revealed a large heterogeneous left adrenal mass (arrow) (A). Pulmonary nodules were seen in the left lung base (arrows) (B). The adrenal mass was confirmed as a pheochromocytoma on resection. The lung nodules increased in size on follow-up imaging consistent with metastases. CT, computed tomography.
Figure 5.
A 67-year-old man with a right adrenal mass which was heterogeneous on CT (A), had fluid-fluid levels on T2-weighted MR sequences (B), high attenuation on t1-weighted sequences consistent with hemorrhage (C), and demonstrated heterogeneous, predominantly peripheral enhancement (D). CT also demonstrated a posterior left rib lesion (arrow) (E), which showed uptake on MIBG compatible with a metastasis (F). The adrenal mass was confirmed as a pheochromocytoma on resection. CT, computed tomography; MIBG, metaiodobenzylguanidine.
Computed tomography (CT)
Pheochromocytomas can have a varied appearance on non-contrast CT ranging from low-density to soft-tissue attenuation, from solid to complex or cystic (Figure 6) (17). Almost all have an attenuation value of greater than 10 HU, however, rare fat-containing pheochromocytomas can have attenuation values similar to adenomas measuring less than 10 HU (18). Conversely pheochromocytomas can be high density sue to the presence of hemorrhage. Calcifications, which are best perceived on non-contrast studies, can be found in approximately 10% of cases and in up to 21% of symptomatic pheochromocytomas (17).
Figure 6.
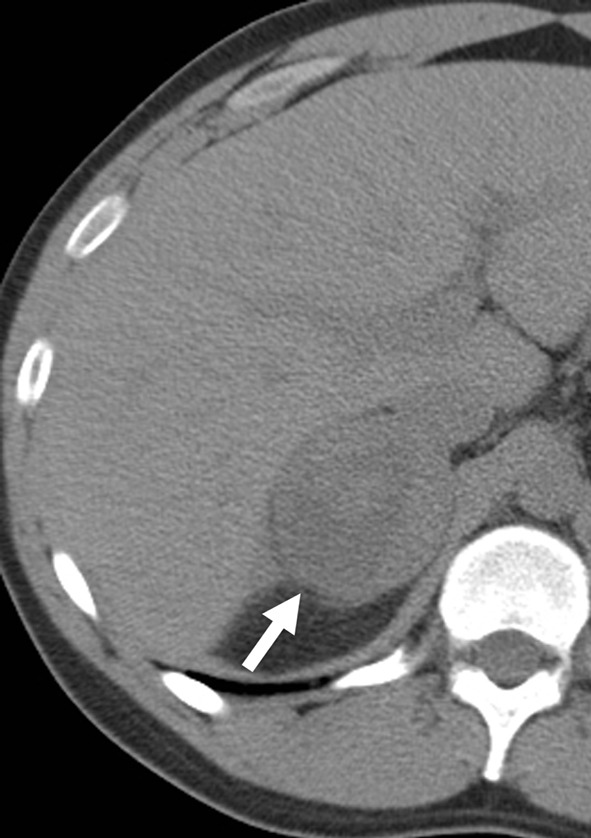
A 21-year-old man with a right adrenal mass (arrow), which demonstrates central cystic component/necrosis on this non-contrast-enhanced CT. The adrenal mass was confirmed as a pheochromocytoma on resection. CT, computed tomography.
A study comparing the imaging findings of incidentally discovered adrenal lesions on dual-phase (arterial and venous phases) CT found three criteria that may aid in differentiating adenomas and pheochromocytomas: (I) adenomas are more enhancing in the venous than in the arterial phase or have equivalent enhancement across both phases; (II) a mass than is greater than 110 HU in the arterial phase, particularly with higher enhancement in the arterial phase, is most likely a pheochromocytoma; and (III) pheochromocytomas are more likely to be heterogeneous than adenomas (19).
A dedicated adrenal-protocol CT utilizing an unenhanced, enhanced (1 minute post-contrast), and delayed enhanced (15 minutes post contrast) has been established and validated as a specific method for differentiating adrenal adenomas from non-adenomas (Figure 7) (20-23). However, more recent studies have found that pheochromocytomas can mimic adenomas demonstrating absolute contrast washout of 60% or higher, or relative contrast washout of 40% or higher (24-27).
Figure 7.

A 59-year-old woman with a large left adrenal mass (arrow) which measures 30 HU on the non-contrast study (A), 74 HU on the post-contrast study (B), and 55 HU on the 15-minute delayed scan (C), with an absolute washout of 43%. The adrenal mass also shows increased uptake on 18F-FDG PET (D). The adrenal mass was confirmed as a pheochromocytoma on resection. PET, positron emission tomography.
Magnetic resonance imaging (MRI)
The classical finding on T2-weighted sequences is a ‘light-bulb’ bright lesion comparable to the signal intensity of CSF (Figure 1), however case series have found this in only 1% to 65% of cases (28-30). Pheochromocytoma can even have low signal intensity on T2-weighted sequences in approximately 35% of cases (29).
On T1-weighted sequences pheochromocytomas are typically isointense or hypointense to muscle, however, the appearance can be quite variable if there is necrosis or hemorrhage present, which would be hyperintense on both T1- and T2-weighted sequences (Figure 8) (17). Pheochromocytomas usually do not contain enough intra-cytoplasmic fat to cause a drop of signal between in- and out-of-phase sequences similar to adenomas (Figure 9), however rarely this can occur due to fatty degeneration (31,32). Pheochromocytomas typically demonstrate avid enhancement after the administration of gadolinium, however the presence of necrosis can make the enhancement pattern variable particularly centrally (33). Pheochromocytomas can also demonstrate venous invasion (Figure 10).
Figure 8.
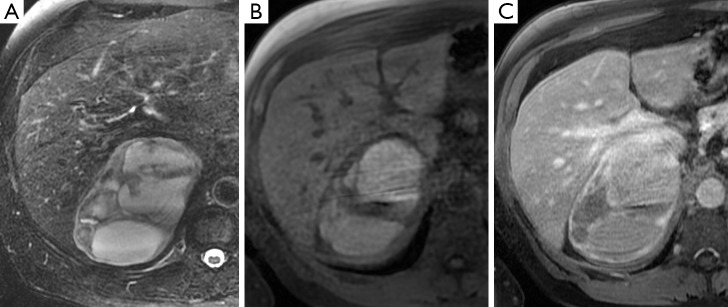
A 71-year-old man with a large right adrenal mass which is heterogeneous on T2-weighted MR sequences (A), has central high signal intensity on T1-weighted sequences consistent with hemorrhage (B), and demonstrates peripheral enhancement post administration of gadolinium (C). This was confirmed as a pheochromocytoma on resection.
Figure 9.

A 55-year-old man with a left adrenal nodule (arrow), which is slightly hyperintense on T2-weighted MR sequences (A), does not demonstrate a drop in signal between the in-phase (B) and out-of-phase (C) sequences and demonstrates avid enhancement post gadolinium administration (D). This was confirmed as a pheochromocytoma on resection.
Figure 10.
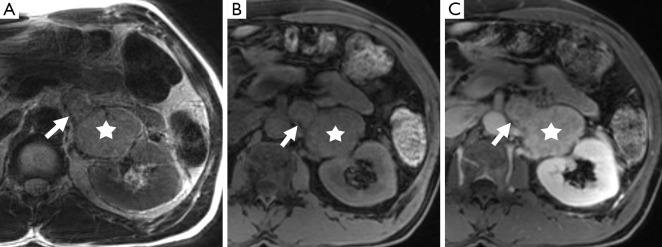
A 52-year-old man with a left adrenal mass (star) which demonstrates left renal vein invasion (arrow) on T2-weighted (A), pre-contrast T1-weighted (B), and post gadolinium (C) MR sequences. This was confirmed as a pheochromocytoma on resection.
Diffusion-weighted imaging (DWI) is an imaging technique which allows insight into tissue cellularity and cell membrane integrity. In theory, malignant tumors have lower apparent diffusion coefficient (ADC) measurements compared to benign lesions, likely related to increased cellularity leading to restriction of water diffusion. Initial studies have suggested that benign adrenal lesions cannot be distinguished from malignant lesions because of considering overlap in ADC values (34,35). However, a study evaluating DWI in distinguishing benign from malignant pheochromocytomas found that the ADC was significantly different between the two groups and suggests that DWI may have a role to play in preoperative characterization and prognosis of pheochromocytomas, especially for those without obvious metastasis or vascular invasion (36). DWI may also be particularly advantageous in depicting lymph nodes and liver metastases and may have a higher rate of detecting metastatic lesions compared with metaiodobenzylguanidine (MIBG) or FDG- positron emission tomography (PET) (37).
Another MR technique, which may help differentiate adrenal lesions, is MR spectroscopy with one study finding a unique MR spectral signature in pheochromocytomas that is thought to be due to the presence of catecholamines and their metabolites (38).
Radionuclide imaging
131I- and 123I-MIBG is the most common functional imaging technique used in the assessment of pheochromocytomas (Figures 2,5,11). MIBG is a norepinephrine analogue whose uptake is proportional to the number of neurosecretory granules within the tumor. 123I-MIBG has a reported sensitivity of 77-90% and a specificity of 95-100% (39-41). Factors involved in the lower sensitivity of MIBG include the variable affinity of MIBG to the amine transport system, the variable amount of cytoplasmic storage granules, and the loss of the amine transport system in dedifferentiated tumors (17). Other disadvantages of MIBG include expense, the length of the test as images may need to be obtained up to 72 hours after injection of the radionuclide, and the lack of sufficient anatomical detail to guide surgery. In cases of suboptimal localization of MIBG-avid foci SPECT/CT can help to define the anatomic location of these foci (42).
Figure 11.
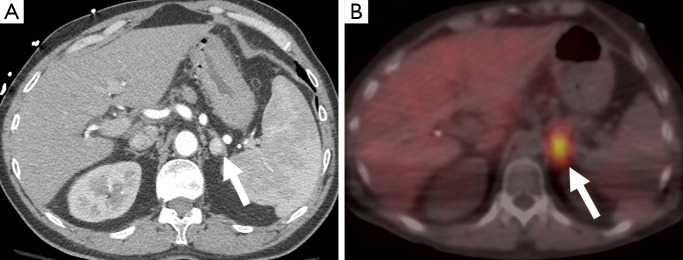
A 56-year-old man who underwent a CT scan after trauma, which demonstrated an enhancing left adrenal nodule measuring 115 HU (arrow) (A). This enhancement level has been described in pheochromocytomas (19). This also showed uptake on MIBG (B) and was confirmed as a pheochromocytoma on resection. CT, computed tomography; MIBG, metaiodobenzylguanidine.
111In-pentetreotide is an analog of somatostatin, which pheochromocytomas can sometimes express receptors for. Although it is not considered a first-line diagnostic tool, it has a role to play in the assessment of dedifferentiated pheochromocytomas that no longer express the amine transport system and are therefore MIBG-negative, and for the detection of metastases (43).
PET is also used in the diagnostic workup of pheochromocytomas (Figures 7,12). FDG is a glucose analogue that becomes trapped within cells with its concentration reflecting the intracellular metabolism. Adrenal FDG uptake is considered malignant in etiology if the intensity is higher than hepatic uptake (44). A study comparing FDG PET and MIBG found that although the sensitivity of MIBG was higher than that of FDG PET for the detection of both benign and malignant pheochromocytomas (83% and 88% vs. 58% and 82%), all the MIBG-negative lesions showed avid FDG uptake (45). FDG PET may be of value delineating the distribution of those pheochromocytomas that fail to concentration MIBG (46). Newer PET-specific tracers such as 18F-fluorodopamine, 18F-dihydroxyphenylalanine and 11C-hydroxyephedrine are under investigation and have shown promising results, however their lack of availability has limited their widespread application.
Figure 12.
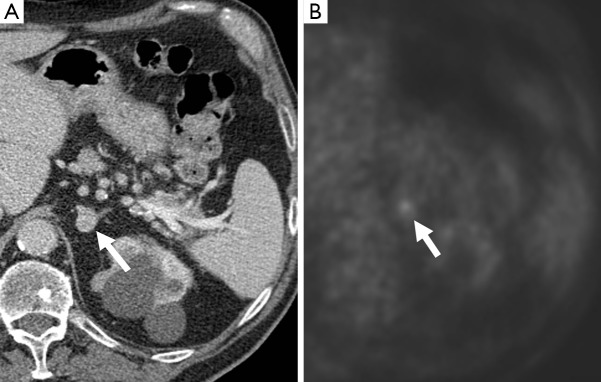
A 72-year-old man who underwent a PET-CT for work-up of a lung nodule. There was a left adrenal nodule (arrow), which demonstrated enhancement post contrast, measuring 112 HU (A). This enhancement level has been described in pheochromocytomas (19). This also showed uptake on 18F-FDG PET (B), and was confirmed as a pheochromocytoma on resection. PET, positron emission tomography; CT, computed tomography.
In conclusion, pheochromocytomas have some common imaging features that can suggest their diagnosis but also they demonstrate a variety of imaging appearances mainly due to the multiple pathological processes that they are prone to. When small in size pheochromocytomas are usually solid and hypervascular but may present as cystic/necrotic or hemorrhagic adrenal masses and indeed may mimic a number of other adrenal masses. However, the diagnosis of pheochromocytoma is important not to overlook and its typical and atypical appearances should always be borne in mind on imaging interpretation of adrenal masses.
Acknowledgements
None.
Footnotes
Conflicts of Interest: MA Blake receives royalties from the book Adrenal Imaging (Springer Verlag, 2009). S McDermott and CJ McCarthy report no disclosures.
References
- 1.McNeil AR, Blok BH, Koelmeyer TD, et al. Phaeochromocytomas discovered during coronial autopsies in Sydney, Melbourne and Auckland. Aust N Z J Med 2000;30:648-52. [DOI] [PubMed] [Google Scholar]
- 2.Anderson GH, Jr, Blakeman N, Streeten DH. The effect of age on prevalence of secondary forms of hypertension in 4429 consecutively referred patients. J Hypertens 1994;12:609-15. [DOI] [PubMed] [Google Scholar]
- 3.Omura M, Saito J, Yamaguchi K, et al. Prospective study on the prevalence of secondary hypertension among hypertensive patients visiting a general outpatient clinic in Japan. Hypertens Res 2004;27:193-202. [DOI] [PubMed] [Google Scholar]
- 4.Sinclair AM, Isles CG, Brown I, et al. Secondary hypertension in a blood pressure clinic. Arch Intern Med 1987;147:1289-93. [PubMed] [Google Scholar]
- 5.Stenström G, Svärdsudd K. Pheochromocytoma in Sweden 1958-1981. An analysis of the National Cancer Registry Data. Acta Med Scand 1986;220:225-32. [PubMed] [Google Scholar]
- 6.Neumann HP, Bausch B, McWhinney SR, et al. Germ-line mutations in nonsyndromic pheochromocytoma. N Engl J Med 2002;346:1459-66. [DOI] [PubMed] [Google Scholar]
- 7.Pham TH, Moir C, Thompson GB, et al. Pheochromocytoma and paraganglioma in children: a review of medical and surgical management at a tertiary care center. Pediatrics 2006;118:1109-17. [DOI] [PubMed] [Google Scholar]
- 8.Mannelli M, Ianni L, Cilotti A, et al. Pheochromocytoma in Italy: a multicentric retrospective study. Eur J Endocrinol 1999;141:619-24. [DOI] [PubMed] [Google Scholar]
- 9.Benn DE, Gimenez-Roqueplo AP, Reilly JR, et al. Clinical presentation and penetrance of pheochromocytoma/paraganglioma syndromes. J Clin Endocrinol Metab 2006;91:827-36. [DOI] [PubMed] [Google Scholar]
- 10.Ingram M, Barber B, Bano G, et al. Radiologic appearance of hereditary adrenal and extraadrenal paraganglioma. AJR Am J Roentgenol 2011;197:W687-95. [DOI] [PubMed] [Google Scholar]
- 11.Chen H, Sippel RS, O'Dorisio MS, et al. The North American Neuroendocrine Tumor Society consensus guideline for the diagnosis and management of neuroendocrine tumors: pheochromocytoma, paraganglioma, and medullary thyroid cancer. Pancreas 2010;39:775-83. [DOI] [PMC free article] [PubMed] [Google Scholar]
- 12.Foti G, Faccioli N, Manfredi R, et al. Evaluation of relative wash-in ratio of adrenal lesions at early biphasic CT. AJR Am J Roentgenol 2010;194:1484-91. [DOI] [PubMed] [Google Scholar]
- 13.Song JH, Chaudhry FS, Mayo-Smith WW. The incidental adrenal mass on CT: prevalence of adrenal disease in 1,049 consecutive adrenal masses in patients with no known malignancy. AJR Am J Roentgenol 2008;190:1163-8. [DOI] [PubMed] [Google Scholar]
- 14.Cawood TJ, Hunt PJ, O'Shea D, et al. Recommended evaluation of adrenal incidentalomas is costly, has high false-positive rates and confers a risk of fatal cancer that is similar to the risk of the adrenal lesion becoming malignant; time for a rethink? Eur J Endocrinol 2009;161:513-27. [DOI] [PubMed] [Google Scholar]
- 15.Shen WT, Sturgeon C, Clark OH, et al. Should pheochromocytoma size influence surgical approach? A comparison of 90 malignant and 60 benign pheochromocytomas. Surgery 2004;136:1129-37. [DOI] [PubMed] [Google Scholar]
- 16.Ayala-Ramirez M, Feng L, Johnson MM, et al. Clinical risk factors for malignancy and overall survival in patients with pheochromocytomas and sympathetic paragangliomas: primary tumor size and primary tumor location as prognostic indicators. J Clin Endocrinol Metab 2011;96:717-25. [DOI] [PubMed] [Google Scholar]
- 17.Leung K, Stamm M, Raja A, et al. Pheochromocytoma: the range of appearances on ultrasound, CT, MRI, and functional imaging. AJR Am J Roentgenol 2013;200:370-8. [DOI] [PubMed] [Google Scholar]
- 18.Blake MA, Krishnamoorthy SK, Boland GW, et al. Low-density pheochromocytoma on CT: a mimicker of adrenal adenoma. AJR Am J Roentgenol 2003;181:1663-8. [DOI] [PubMed] [Google Scholar]
- 19.Northcutt BG, Raman SP, Long C, et al. MDCT of adrenal masses: Can dual-phase enhancement patterns be used to differentiate adenoma and pheochromocytoma? AJR Am J Roentgenol 2013;201:834-9. [DOI] [PubMed] [Google Scholar]
- 20.Korobkin M, Brodeur FJ, Francis IR, et al. CT time-attenuation washout curves of adrenal adenomas and nonadenomas. AJR Am J Roentgenol 1998;170:747-52. [DOI] [PubMed] [Google Scholar]
- 21.Szolar DH, Kammerhuber FH. Adrenal adenomas and nonadenomas: assessment of washout at delayed contrast-enhanced CT. Radiology 1998;207:369-75. [DOI] [PubMed] [Google Scholar]
- 22.Peña CS, Boland GW, Hahn PF, et al. Characterization of indeterminate (lipid-poor) adrenal masses: use of washout characteristics at contrast-enhanced CT. Radiology 2000;217:798-802. [DOI] [PubMed] [Google Scholar]
- 23.Caoili EM, Korobkin M, Francis IR, et al. Adrenal masses: characterization with combined unenhanced and delayed enhanced CT. Radiology 2002;222:629-33. [DOI] [PubMed] [Google Scholar]
- 24.Park BK, Kim B, Ko K, et al. Adrenal masses falsely diagnosed as adenomas on unenhanced and delayed contrast-enhanced computed tomography: pathological correlation. Eur Radiol 2006;16:642-7. [DOI] [PubMed] [Google Scholar]
- 25.Yoon JK, Remer EM, Herts BR. Incidental pheochromocytoma mimicking adrenal adenoma because of rapid contrast enhancement loss. AJR Am J Roentgenol 2006;187:1309-11. [DOI] [PubMed] [Google Scholar]
- 26.Park BK, Kim CK, Kwon GY, et al. Re-evaluation of pheochromocytomas on delayed contrast-enhanced CT: washout enhancement and other imaging features. Eur Radiol 2007;17:2804-9. [DOI] [PubMed] [Google Scholar]
- 27.Patel J, Davenport MS, Cohan RH, et al. Can established CT attenuation and washout criteria for adrenal adenoma accurately exclude pheochromocytoma? AJR Am J Roentgenol 2013;201:122-7. [DOI] [PubMed] [Google Scholar]
- 28.Jacques AE, Sahdev A, Sandrasagara M, et al. Adrenal phaeochromocytoma: correlation of MRI appearances with histology and function. Eur Radiol 2008;18:2885-92. [DOI] [PubMed] [Google Scholar]
- 29.Varghese JC, Hahn PF, Papanicolaou N, et al. MR differentiation of phaeochromocytoma from other adrenal lesions based on qualitative analysis of T2 relaxation times. Clin Radiol 1997;52:603-6. [DOI] [PubMed] [Google Scholar]
- 30.Raja A, Leung K, Stamm M, et al. Multimodality imaging findings of pheochromocytoma with associated clinical and biochemical features in 53 patients with histologically confirmed tumors. AJR Am J Roentgenol 2013;201:825-33. [DOI] [PubMed] [Google Scholar]
- 31.Blake MA, Kalra MK, Maher MM, et al. Pheochromocytoma: an imaging chameleon. Radiographics 2004;24 Suppl 1:S87-99. [DOI] [PubMed] [Google Scholar]
- 32.Ramsay JA, Asa SL, van Nostrand AW, et al. Lipid degeneration in pheochromocytomas mimicking adrenal cortical tumors. Am J Surg Pathol 1987;11:480-6. [DOI] [PubMed] [Google Scholar]
- 33.Krestin GP, Steinbrich W, Friedmann G. Adrenal masses: evaluation with fast gradient-echo MR imaging and Gd-DTPA-enhanced dynamic studies. Radiology 1989;171:675-80. [DOI] [PubMed] [Google Scholar]
- 34.Tsushima Y, Takahashi-Taketomi A, Endo K. Diagnostic utility of diffusion-weighted MR imaging and apparent diffusion coefficient value for the diagnosis of adrenal tumors. J Magn Reson Imaging 2009;29:112-7. [DOI] [PubMed] [Google Scholar]
- 35.Miller FH, Wang Y, McCarthy RJ, et al. Utility of diffusion-weighted MRI in characterization of adrenal lesions. AJR Am J Roentgenol 2010;194:W179-85. [DOI] [PubMed] [Google Scholar]
- 36.Dong Y, Liu Q. Differentiation of malignant from benign pheochromocytomas with diffusion-weighted and dynamic contrast-enhanced magnetic resonance at 3.0 T. J Comput Assist Tomogr 2012;36:361-6. [DOI] [PubMed] [Google Scholar]
- 37.Takano A, Oriuchi N, Tsushima Y, et al. Detection of metastatic lesions from malignant pheochromocytoma and paraganglioma with diffusion-weighted magnetic resonance imaging: comparison with 18F-FDG positron emission tomography and 123I-MIBG scintigraphy. Ann Nucl Med 2008;22:395-401. [DOI] [PubMed] [Google Scholar]
- 38.Kim S, Salibi N, Hardie AD, et al. Characterization of adrenal pheochromocytoma using respiratory-triggered proton MR spectroscopy: initial experience. AJR Am J Roentgenol 2009;192:450-4. [DOI] [PubMed] [Google Scholar]
- 39.Havekes B, Lai EW, Corssmit EP, et al. Detection and treatment of pheochromocytomas and paragangliomas: current standing of MIBG scintigraphy and future role of PET imaging. Q J Nucl Med Mol Imaging 2008;52:419-29. [PubMed] [Google Scholar]
- 40.Lumachi F, Tregnaghi A, Zucchetta P, et al. Sensitivity and positive predictive value of CT, MRI and 123I-MIBG scintigraphy in localizing pheochromocytomas: a prospective study. Nucl Med Commun 2006;27:583-7. [DOI] [PubMed] [Google Scholar]
- 41.Nakatani T, Hayama T, Uchida J, et al. Diagnostic localization of extra-adrenal pheochromocytoma: comparison of (123)I-MIBG imaging and (131)I-MIBG imaging. Oncol Rep 2002;9:1225-7. [PubMed] [Google Scholar]
- 42.Rozovsky K, Koplewitz BZ, Krausz Y, et al. Added value of SPECT/CT for correlation of MIBG scintigraphy and diagnostic CT in neuroblastoma and pheochromocytoma. AJR Am J Roentgenol 2008;190:1085-90. [DOI] [PubMed] [Google Scholar]
- 43.van der Harst E, de Herder WW, Bruining HA, et al. [(123)I]metaiodobenzylguanidine and [(111)In]octreotide uptake in begnign and malignant pheochromocytomas. J Clin Endocrinol Metab 2001;86:685-93. [DOI] [PubMed] [Google Scholar]
- 44.Blake MA, Cronin CG, Boland GW. Adrenal imaging. AJR Am J Roentgenol 2010;194:1450-60. [DOI] [PubMed] [Google Scholar]
- 45.Shulkin BL, Thompson NW, Shapiro B, et al. Pheochromocytomas: imaging with 2-[fluorine-18]fluoro-2-deoxy-D-glucose PET. Radiology 1999;212:35-41. [DOI] [PubMed] [Google Scholar]
- 46.Taïeb D, Sebag F, Barlier A, et al. 18F-FDG avidity of pheochromocytomas and paragangliomas: a new molecular imaging signature? J Nucl Med 2009;50:711-7. [DOI] [PubMed] [Google Scholar]


