

Summary
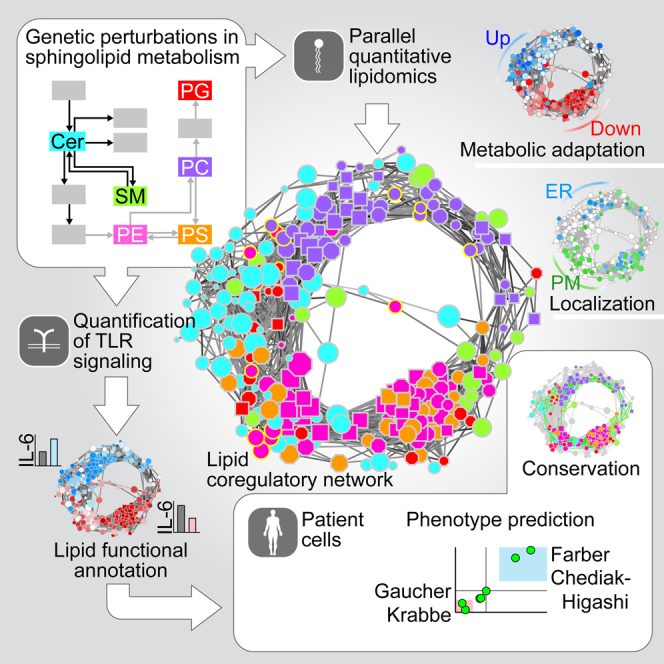
Lipid composition affects the biophysical properties of membranes that provide a platform for receptor-mediated cellular signaling. To study the regulatory role of membrane lipid composition, we combined genetic perturbations of sphingolipid metabolism with the quantification of diverse steps in Toll-like receptor (TLR) signaling and mass spectrometry-based lipidomics. Membrane lipid composition was broadly affected by these perturbations, revealing a circular network of coregulated sphingolipids and glycerophospholipids. This evolutionarily conserved network architecture simultaneously reflected membrane lipid metabolism, subcellular localization, and adaptation mechanisms. Integration of the diverse TLR-induced inflammatory phenotypes with changes in lipid abundance assigned distinct functional roles to individual lipid species organized across the network. This functional annotation accurately predicted the inflammatory response of cells derived from patients suffering from lipid storage disorders, based solely on their altered membrane lipid composition. The analytical strategy described here empowers the understanding of higher-level organization of membrane lipid function in diverse biological systems.
Graphical Abstract
Highlights
-
•
Coregulation between membrane lipid species is organized in a circular network
-
•
The lipid network is conserved and reflects metabolism, localization, and adaptation
-
•
Sphingolipid metabolism regulates TLR trafficking, signaling, and cytokine release
-
•
Network-wide functional lipid annotations predict TLR responses in patient cells
Combining lipidomics with genetic perturbations in immune cells reveals the logic of inter-lipid regulatory structure and enables the functional assignment of lipids to different steps of Toll-like receptor signaling. Moreover, quantitative lipidomics alone can predict the inflammatory response of patient-derived cells.
Introduction
The cellular membrane defines the minimal unit of life and creates the compartmentalization that orchestrates the transport of molecules, intracellular signaling, cell-cell communication, pathogen recognition, and many other processes (van Meer et al., 2008). Membrane function is an emergent property of the intricate interactions of its protein and lipid constituents, with glycerophospholipids, sphingolipids, and sterols as most abundant membrane lipids. Glycerophospholipids and sphingolipids are categorized into distinct lipid classes defined by the chemical structure of their head group. Each lipid class contains hundreds of different lipid species, further varying in fatty acid chain length, linkage, and saturation, among others (Coskun and Simons, 2011), the exact measurement of which has been empowered by the advent of lipidomics (Shevchenko and Simons, 2010; Wenk, 2005). Distinct lipid species are asymmetrically distributed across the plasma membrane (PM) and the various intracellular membranes (van Meer et al., 2008), in part due to locally confined synthesis and active transport of lipids (Maeda et al., 2013), providing a functionally distinct spatial organization to the lipid landscape of a cell (Holthuis and Menon, 2014).
The plasma membrane and endosomal membranes mediate the first line of defense in cellular innate immunity by establishing a physical barrier against microbial pathogens and constitute the main site of pathogen recognition by accommodating specialized cell surface receptors such as Toll-like receptors (TLRs). TLRs are a conserved family of transmembrane proteins that recognize distinct pathogen-associated molecular patterns and activate key signaling pathways in innate immunity (Kawai and Akira, 2010). The plasma membrane and endosomal resident TLR4, for instance, mainly recognizes gram-negative bacterial lipopolysaccharides (LPS), while the endosomal TLR7 and TLR9 recognize nucleic acids derived from a wide range of microbes. TLR ligand-binding leads to receptor dimerization and the activation of subsequent signaling cascades, which, for most TLRs, involves a partially overlapping set of accessory molecules (Bonham et al., 2014; Lee et al., 2012). This in turn leads to transcriptional and metabolic changes, including the induction and secretion of cytokines (Kawai and Akira, 2010), as well as the upregulation of sphingolipid synthesis (Memon et al., 1998). TLR signaling eventually triggers pathogen-specific responses by the adaptive immune system, thus linking cellular innate immunity to the adaptive immune system of the host (Kawai and Akira, 2010). In macrophages, TLR activation induces changes in the lipid composition and properties of cellular membranes (Andreyev et al., 2010; Dennis et al., 2010), adapting the cellular morphology for polarization and pathogen phagocytosis. TLR signaling is meticulously regulated to clear pathogens yet avoid host damage through hyperinflammation (Serhan et al., 2008). Mechanisms of regulation act, among others, at the level of transmembrane domains of TLRs, mediating dimerization and activation (Kawai and Akira, 2010) and at the level of receptor trafficking, altering the adaptor protein complexes and signaling (Bonham et al., 2014; Lee et al., 2012). While selected species of sphingolipids have been characterized in the context of inflammation (Alvarez et al., 2010; Józefowski et al., 2010; Vandanmagsar et al., 2011), the chemical complexity of biological membranes requires more global approaches to deconvolute the function of the lipid landscape (Atilla-Gokcumen et al., 2014; da Silveira Dos Santos et al., 2014).
Results
Sphingolipid Metabolism Is Regulated by TLR Stimulation and Modulates TLR-Induced IL-6 Release
Previously, quantitative lipidomics and genome-wide transcriptional changes upon TLR4 stimulation were measured in bone marrow-derived macrophages (BMDMs) and in the murine macrophage RAW264.7 (RAW) cell line (Dennis et al., 2010; Ramsey et al., 2008) (Figures S1A–S1C), which revealed sphingolipid metabolism to be strongly differentially regulated upon TLR stimulation (Figure S1B). We therefore selected 24 genes based on the sphingolipid metabolic network (Kanehisa and Goto, 2000) focusing on ceramide metabolism, including several poorly studied genes, all expressed in RAW cells (Figure S1D; Table S1) (Hannun and Obeid, 2011). Their TLR4- and TLR9-driven transcriptional regulation was measured by stimulating RAW macrophages with LPS and unmethylated CpG DNA (CpG), respectively (Figures 1A, S1D, and S1E).
Figure S1.

TLR-Driven Transcription of the Sphingolipid Metabolic Network and Characterization of Cytokine Release upon shRNA-Mediated Silencing of This Network, Related to Figure 1
(A) TLR4-induced changes in the abundance of selected sphingolipids in RAW macrophages. Data from http://lipidmaps.org (Dennis et al., 2010).
(B) Pathway enrichment analysis of all differentially regulated genes in a genome-wide analysis of TLR4-stimulated bone marrow-derived macrophages (BMDMs). Shown are the highest enriched lipid-related annotations. Data from http://systemsimmunology.org (Ramsey et al., 2008). Enrichment analyzed by DAVID.
(C) Relative expression of key regulators of sphingolipid metabolism upon TLR4 stimulation over indicated time points in BMDMs and RAW cells. Relative expression calculated as delta log10 of the FPKM, or as log2 fold-change.
(D) Scatter plot of log2 fold-change expression (x axis) versus significance (y axis; t test) of RAW macrophages stimulated with LPS or CpG for 2 and 4 hr. Red lines indicate p < 0.05. Strongest regulated genes are indicated. Data are combined of two independent experiments with two technical replicates each.
(E) Venn diagram shows the number of regulated genes upon TLR4 stimulation by LPS and/or TLR9 stimulation by CpG. Predominant TLR localizations indicated in schemas. Red and green numbers in brackets indicate down- and upregulated genes respectively.
(F) LPS- and CpG-induced relative expression of selected genes separated by different branches of the sphingolipid metabolic pathway (KEGG). Boxplots group all expression values per subnetworks, with colors corresponding to subnetwork background colors. Abbreviations are as in Figure 1. Data are combined of two independent experiments with two technical replicates each.
(G) Knockdown efficiency measured by qRT-PCR of all 129 shRNA cell lines, normalized to sh:GFP. Each dot represents one cell line. Green dots were included in the screen, red dots were excluded due to insufficient knockdown efficiency. Threshold and median knockdown efficiency are indicated. Data are mean of technical triplicates.
(H) IL-6 release after stimulation with LPS or CpG, and IFNβ release after stimulation with Interferon-stimulatory DNA (ISD) or pdAdt in sh:Sphk1_1 and sh:GFP. Data are representative of three independent experiments.
(I) IL-6 release after stimulation with LPS, CpG or IMQ after 16 hr measured in selected shRNA cell lines and sh:GFP. ∗ indicates p < 0.005. Data are representative of five independent experiments and shown as mean ± SD of four technical replicates.
See also Table S1.
Figure 1.

TLR-Driven Transcription of the Sphingolipid Metabolic Network and Characterization of Cytokine Release upon shRNA-Mediated Silencing of This Network
(A) Selected sphingolipid and glycerophospholipid metabolic reactions (KEGG), shown together with main metabolites (rounded rectangles) and 24 selected proteins (rectangles). Protein location based on KEGG where possible. Heatmaps show relative expression of 24 selected genes after stimulation of RAW cells with LPS (100 ng/ml) or CpG (5 μM) for indicated time points measured by qRT-PCR. Bold protein names indicate selection for lipidomics analysis. Metabolites are colored consistently throughout the study. Data are combined of at least two independent experiments with technical triplicates. FC, fold-change; Spha, sphinganine; Spho, sphingosine; C1P, ceramide-1-phosphate. For other abbreviations, see text or legend and Table S1.
(B) Schematic representation of the generation and characterization of stable shRNA RAW cell lines, filtered based on knockdown efficiency.
(C) IL-6 release as measured by ELISA in sh:Tlr and sh:GFP control cell lines stimulated with IMQ (5 μM), or LPS (100 ng/ml) or CpG (5 μM) for 16 hr. Data are representative of at least five independent experiments and shown as mean ± SD of four technical replicates. ∗p < 0.0001.
(D) As in (C), but for sh:Sphk1, sh:Cers2, and sh:Ormdl1 cell lines. Data are representative of at least five independent experiments and shown as mean ± SD of four technical replicates. ∗p < 0.005.
(E–G) Screening results of three IL-6 release screens in 87 loss-of-function cell lines stimulated for 16 hr with IMQ, CpG, and LPS as measured by ELISA. Values are plotted as log2 fold-change relative to the respective sh:GFP control cell line and averaged over multiple shRNA cell lines. Black dots represent the averages of two or more shRNA cell lines with consistent phenotypes, while gray dots represent averages of all shRNA cell lines per gene. Indicated genes are selected for lipidomics analysis. Data are combined of at least five independent experiments.
(H) Scatter plot of IMQ and CpG screening results. Red line indicates linear fit. Data are combined of at least five independent experiments.
(I) Heatmap shows integration of target gene expression in wild-type RAW cells after stimulation with LPS and CpG and IL-6 release screening results of shRNA cell lines. Gray triangles indicate absence of consistent phenotypes for multiple shRNAs per gene. Data are combined of at least five independent experiments.
Mapping our expression results onto the known sphingolipid metabolic pathway showed that 18 of the 24 genes were similarly regulated by both TLRs (Figures 1A and S1E), consistent with the fact that TLR4 and TLR9 activate a partially overlapping set of downstream transcription factors (Kawai and Akira, 2010). Genes induced by at least one TLR ligand were associated with the de novo synthesis of ceramides (Sptlc1 and Sptlc2, Cers5 and Cers6, and Ormdl1) and their downstream processing into other key sphingolipids including sphingomyelins (SMs) by Sgms2, sphingosine-1-phosphate (S1P) by Sphk1, and glucosylceramides (GluCers) by Ugcg (Figure 1A). In contrast, genes involved in the degradation of sphingomyelins (Smpd1 and related genes) and S1P (Sgpl1) were predominantly downregulated (Figure 1A). This significant and consistent transcriptional pattern across the network (p < 1.7 × 10⁻⁸; Figure S1F) suggested increased levels of ceramides, sphingomyelins, S1P, and glucosylceramides upon TLR stimulation, as indeed observed in the publicly available lipidomics data (Figure S1A).
To study the roles of sphingolipids in TLR biology, we genetically perturbed these 24 genes to identify reproducible and diverse effects on TLR signaling and quantify the corresponding changes in membrane lipid abundance, allowing an integrated analysis of these two cellular properties. Each of the 24 genes and three TLR controls were targeted by three to five short hairpin RNAs (shRNAs) in RAW macrophages resulting in 129 stable shRNA cell lines (Figure 1B; Table S1). Filtering for a knockdown efficiency of at least 58% resulted in 87 cell lines with a median knockdown efficiency of 88% (Figure S1G). These 87 cell lines covered the 24 genes with on average three shRNA cell lines per gene (Table S1).
In a focused screening campaign, these 87 cell lines were monitored for differences in TLR signaling as measured by the release of the cytokine interleukin 6 (IL-6) into the supernatant after stimulation, a late quantitative read-out of TLR activation (Kawai and Akira, 2010). To measure the activity of diverse TLRs, cells were stimulated with Imiquimod (IMQ) or CpG, which are recognized by the endosomal TLRs 7 or 9, respectively, or with LPS, recognized by TLR4. As expected, silencing of the TLR controls (sh:Tlr4, sh:Tlr7, sh:Tlr9) strongly attenuated their respective ligand-induced IL-6 release compared to sh:GFP control (Figure 1C). Silencing of genes involved in sphingolipid metabolism led to various TLR-induced IL-6 release phenotypes (Figure 1D). For instance, knockdown of Sphk1 or Cers2 led to significantly reduced IL-6 release after stimulation with all three TLR ligands, while knockdown of Ormdl1 led to enhanced IL-6 release upon endosomal TLR stimulation and decreased IL-6 release upon TLR4 stimulation (Figure 1D). Cytoplasmic recognition of pathogen-associated molecular patterns (Stetson and Medzhitov, 2006) was not affected by silencing of Sphk1, as stimulation with interferon stimulatory DNA or poly(dA:dT) resulted in equal levels of interferon β release for sh:Sphk1 and sh:GFP (Figure S1H). To summarize the TLR-induced IL-6 release measurements over all shRNA cell lines per gene and per stimulus, the log2 fold-change relative to the corresponding sh:GFP control value was calculated and averaged over technical and biological replicates. We next either averaged the values of consistent and strong (absolute log2 fold-change >0.7) shRNA phenotypes per gene (Figures 1E–1G, black dots), or, in case these criteria were not met, the values of all shRNAs per gene (Figures 1E–1G, gray dots). Knockdown of 18 genes affected IL-6 release after stimulation with at least one TLR ligand consistently for two or more shRNA cell lines (Figures 1E–1G), while cell viability was unaffected in all cases. In unstimulated conditions, the 87 shRNA cell lines showed only background IL-6 levels in the supernatant.
In both the IMQ and CpG screens, the associated sh:Tlr7 and sh:Tlr9 controls led to the strongest reduction in IL-6 release, respectively (Figures 1E and 1F). In contrast, the LPS screen revealed five genes whose knockdown led to an even stronger reduction than the sh:Tlr4 control (Figure 1G). The CpG and IMQ screens not only manifested decreased IL-6 release but also revealed several genes which, upon knockdown, led to increased IL-6 release after stimulation (Figures 1E and 1F). Comparing the results of the three IL-6 release screens showed that the CpG and IMQ screens were strongly correlated (r = 0.94) (Figure 1H), while the LPS screen correlated considerably less with the other two screens (mean r = 0.71). This suggested that the sphingolipid metabolic pathway affected the endosomal TLRs 7 and 9 to an equal extent, while TLR4 at the plasma membrane was differentially affected.
Integrating the TLR-induced transcriptional regulation of sphingolipid metabolism with the corresponding gene perturbation phenotypes could reveal mechanisms by which a cell either boosts or resolves inflammation through modulation of its membrane lipid composition. To reveal the presence of such mechanisms, the IL-6 screening results for all three TLR stimuli were combined with the relative expression of target genes in wild-type RAW cells after stimulation of TLR4 and TLR9 (Figure 1I). This integration revealed a group of genes acting to enhance pan-TLR signaling. Among those were Ugcg and Sphk1, associated with the synthesis of the ceramide-derived metabolites glucosylceramides and S1P, respectively, which were required for and induced by pan-TLR signaling. However, the majority of the genes appeared to dampen TLR signaling. For instance, six genes were identified as negative regulators of CpG- and IMQ-driven signaling and transcriptionally upregulated upon TLR stimulation. Four of these six genes encoded proteins that are associated with de novo ceramide synthesis (Ormdl1, Sptlc1, Cers6, and Sptlc2) (Figure 1I) and could be involved in preventing hyperinflammation and promoting the resolution of inflammation in response to endosomal TLR activation (Serhan et al., 2008). Further, a different set of genes associated with ceramide synthesis was specifically regulated by and functionally involved in TLR4 signaling (Cers5, Cers2, Smpd4, and Ormdl3) (Figure 1I). Taken together, the integration of TLR-induced transcriptional regulation of sphingolipid metabolic genes with their corresponding perturbation phenotypes revealed both positive and negative modulators of TLR function across various branches of sphingolipid metabolism.
To resolve these different phenotypes at the level of individual membrane lipids, nine gene perturbations (sh:Sptlc2_1, sh:Cers2_4, sh:Cers6_2, sh:Smpd1_4, sh:Ormdl1_3, sh:Ugcg_1, sh:Asah1_2, sh:Lyst_1, and sh:Cln3_1) were selected for further characterization by quantitative lipidomics (Table S1). The IL-6 release phenotypes upon knockdown of these genes were consistent across multiple independent shRNAs (Figures 1D and S1I). To maximize the statistical power by which lipid-phenotype relationships could be inferred, this subset of genes was chosen to represent diverse IL-6 release phenotypes across the different regulatory mechanisms and across sphingolipid metabolic branches (indicated in Figures 1A, 1E–1G, and 1I).
Genetic Perturbations of Sphingolipid Metabolism Lead to Diverse Membrane Lipid States
Mass spectrometry-based lipidomics was used to measure the abundance of 245 membrane lipids at steady state in the nine selected cell lines and the sh:GFP control (Figure 2A). Specifically, glycerophospholipids (phosphatidylcholines [PC], phosphatidylethanolamines [PE], phosphatidylglycerols [PG], and phosphatidylserines [PS]) and sphingolipids (ceramides [Cer] and sphingomyelins [SM]) were quantified. The developing field of lipidomics still lacks standardized methods for data normalization, analysis, and visualization, as well as for lipid annotation (Snijder et al., 2014). Here, lipid levels were normalized to total lipid content and transformed as log2 fold-change relative to the sh:GFP control (Figure S2A). Both raw and transformed formats are available as supplementary results, annotating all lipids with two complementary nomenclatures (Table S2). The three biological replicates displayed high reproducibility (average r = 0.89). Throughout this data set, significant increases and decreases were observed for the majority of lipid classes in each of the nine perturbations, defining the unique lipid states in which their cellular phenotypes manifested (Figure 2B).
Figure 2.

Quantitative Lipidomics of Nine Stable shRNA Cell Lines Targeting Sphingolipid Metabolism Reveals Strongly Altered Lipid States
(A) Lipidomics analysis of nine loss-of-function cell lines. Values are shown as log2 fold-change relative to sh:GFP. Each dot represents a lipid species, color coded per lipid class. Dot size indicates significance. Lipidomics data are combined of three independent experiments and represented as mean.
(B) Hierarchical clustering of average log2 fold-change lipid levels per lipid class and cell line. Lipidomics data are combined of three independent experiments and represented as mean. ∗p < 0.05.
Figure S2.

Quantitative Lipidomics of Nine Stable shRNA Cell Lines Targeting Sphingolipid Metabolism Reveals Strongly Altered Lipid States, Related to Figure 2
(A) Lipidomics measurements of sh:GFP control cell line shown as log10-transformed lipid concentrations (μM).
(B) Values are log2 fold-change relative abundance of selected ceramide species in sh:Cers2 (black bars) and sh:Cers6 (gray bars) relative to sh:GFP.
(C) Part of the sphingolipid metabolic pathway as defined by KEGG (left) compared to the hierarchical interactions (Snijder et al., 2013) between proteins inferred from changes in lipid abundance (right). Arrows indicate inferred hierarchy; known metabolic connections are indicated in black, unknown inferred interactions indicated in dark blue. Line thickness represents strength of hierarchical interaction. Spha: Sphinganine; Spho: Sphingosine; GluCer: Glucosylceramide. (A–C) Lipidomics data are combined of three independent experiments and represented as mean.
See also Table S2.
Analysis of the changes in lipid composition caused by the nine perturbations revealed both expected and unexpected results. As expected, in most cases silencing of an enzyme led to increased substrate levels and/or decreased product levels. For instance, knockdown of the serine palmitoyltransferase Sptlc2, a key enzyme for de novo synthesis of ceramides (Hanada, 2003), led to a strong reduction in ceramide levels (Figure 2B). Knockdown of ceramide synthases 2 or 6 also reduced ceramide levels, including individual species with specific fatty acid chain lengths that have previously been associated with each enzyme (Figures 2A, 2B, and S2B) (Levy and Futerman, 2010). Total ceramide levels were decreased, and sphingomyelin levels were increased, upon knockdown of the sphingomyelinase Smpd1 (Figure 2B). Following this consistent pattern, ceramide levels were significantly increased upon knockdown of Ormdl1, a negative regulator of ceramide synthesis (Breslow et al., 2010), and upon knockdown of Ugcg, the ceramide glucosyltransferase (Figure 2B). An unexpected reduction in total ceramide levels was however measured upon the depletion of the acid ceramidase ASAH1. This observation supports the notion that ASAH1 may function bimodally, mediating not just degradation but also synthesis of ceramides, consistent with previous in vitro data (Okino et al., 2003) (Figure 2B). Given that most of these perturbed genes are members of larger conserved gene families, based on either sequence similarity or enzymatic function, the strongly altered lipid states revealed an absence of redundancy between these family members. This goes against previous findings suggesting functional redundancy within the ORM1-like gene family (Siow and Wattenberg, 2012).
Perturbing sphingolipid metabolism unexpectedly led to changes in glycerophospholipid levels, with strongest changes observed upon knockdown of Sptlc2 and Ormdl1 (Figure 2B). Knockdown of Lyst and Cln3, both involved in lysosomal trafficking, only led to significantly altered glycerophospholipid levels (Figure 2B). In summary, the selected set of genetic perturbations targeting sphingolipid metabolism translated to a remarkable heterogeneity in lipid states, revealing considerable tolerance of cells to such perturbations and establishing these as an effective method to alter cellular lipid composition and study the functional consequences. Additionally, this membrane lipidomics analysis underscored a strong link between the sphingolipid and glycerophospholipid metabolic networks.
Hierarchical clustering of the average fold-changes per lipid class and per cell line separated genes associated with ceramide synthesis from those associated with other processes (Figure 2B). We therefore applied the hierarchical interaction score (HIS) for network reconstruction between perturbed genes (Snijder et al., 2013), analyzing hierarchical patterns among the measured lipid species of each perturbation (Figure S2C). The HIS correctly inferred the known metabolic hierarchy of the different enzymes starting with SPTLC2, over CERS2 and CERS6, to ASAH1 and SMPD1 (Figure S2C). This intriguingly suggested that diverse membrane lipid states resulting from genetic perturbations may be instrumental for the unbiased reconstruction of gene-centered metabolic networks, as also shown in yeast (da Silveira Dos Santos et al., 2014).
A Logical Circular Network of Coregulated Lipids
Given the broad changes in lipid composition over the diverse genetic perturbations, we next analyzed the coregulation of lipid abundance at the level of individual lipid species to expose the larger organizational principles that orchestrate membrane lipid composition. Comparing the lipid abundance of individual lipid species across all nine perturbations revealed pairs of positively and negatively correlated lipids (Figure 3A). Such positive correlations, indicative of lipid coregulation, occurred both within and between lipid classes (Figure 3B). Hierarchical clustering of the complete lipid-lipid correlation matrix describing 29,890 unique pairs of lipids revealed ten distinct lipid clusters of positively correlated lipids, organized along the diagonal of the matrix (Figure 3C). Neighboring clusters showed positive correlations, whereas distant clusters were negatively correlated with each other (Figure 3C). Intriguingly, analysis of the lipid composition per cluster revealed sphingolipids to be distributed over all clusters, whereas significant separation of glycerophospholipid classes was observed between different clusters (Figure 3D). Positively correlated glycerophospholipid classes reflected their proximity in the metabolic pathway, as clusters 8 and 9, the two largest clusters, contained most PS and PE species, and clusters 1 to 5 grouped most PC and PG species. Interestingly, the strong negative correlation between these two sets of clusters identified that a loss in PS and PE was associated with increased levels of PC, as observed for sh:Sptlc2 and sh:Ormdl1 and inversely for sh:Cln3 (Figure 2B). This general trend has also been reported in yeast and may be indicative of conserved metabolic adaptation (Boumann et al., 2006). Positive correlations therefore indicated coregulation between lipids driven by proximity in metabolic pathways and structural dependencies. Negative correlations, in turn, reflected compensation or adaptation between lipids within the cell. Analysis of fatty acid chain length properties per cluster and lipid class further revealed that separation of lipid species from the same class into different clusters was associated with significant changes in chain length, following a trend over neighboring clusters (p < 0.01 – p < 0.001, Figure 3E).
Figure 3.

Analysis of Lipid Abundance Reveals the Circular Organization of the Lipid Coregulatory Network
(A) Scatter plots show example pairs of lipids whose relative abundance over the nine perturbations is negatively (left panel) or positively (right panel) correlated. Red lines indicate linear fit. Data are combined of three independent experiments and shown as mean.
(B) Analysis of the fraction of correlations that link lipids of the same lipid class (white) or different lipid classes (gray), as function of correlation strength. Data are combined of three independent experiments and shown as mean.
(C) Hierarchical clustering of the lipid-lipid correlation matrix. Rows and columns correspond to the 245 measured lipid species. Black boxes indicate clusters of strongly positively correlated lipids. Lipid cluster numbers indicated on the right. Data are combined of three independent experiments and shown as mean.
(D) Analysis of the number of lipids in each cluster per lipid class. Width of the bars is scaled to match (C). Data are combined of three independent experiments and shown as mean.
(E) Normalized fatty acid chain lengths for selected clusters and lipid classes. Lipid classes are colored as in (D). Chain length is normalized from the shortest to the longest fatty acid side chain per class. Data are combined of three independent experiments and shown as mean. Values are mean ± SEM.
(F) Network visualization of the positive lipid-lipid correlations. Edges are correlations of r ≥ 0.7. Nodes are lipids. Node shape, size, and outline represent fatty acid bonds, chain length, and lysolipids, respectively (see legends). Data are combined of three independent experiments and shown as mean.
(G) Nodes of the network are color-coded based on the fold-change of relative lipid abundance for each of the nine shRNA cell lines as indicated in legend. Data are combined of three independent experiments and shown as mean.
(H) Cumulative percentage of lipid coregulation as a function of the maximum fatty acid chain length difference per lipid class and for all (see legend). Data are combined of three independent experiments and shown as mean.
(I) Left: network visualization of lipid enrichment in either ER (blue) or plasma membrane (PM, green) subcellular fractions. White nodes depict not enriched or not measured lipids. Right: significance of the clustering on the circular network for the enrichment in four subcellular fractions. Red lines indicate the average absolute difference between enrichment scores of direct neighbors in the network, gray areas indicate the distribution of randomized repeats. NS, not significant. Subcellular fraction data are from http://lipidmaps.org combined of three independent experiments and shown as mean.
See also Figure S3.
Interestingly, the most distant lipid clusters 1 and 10 were positively correlated, which suggested that this hierarchical view on cluster organization was a suboptimal representation of lipid coregulation (Figure 3C). We therefore transformed the lipid-lipid correlation matrix into a network where nodes represented individual lipid species and edges represented positive correlations of 0.7 or higher (Figure 3F). Strikingly, this correlation network displayed near-perfect circularity. Continuity across the different lipid clusters was revealed by mapping different lipid features, including lipid class, and fatty acid linkage and chain length, onto the network (Figures 3F, S3A, and S3B). This network view furthermore emphasized the distribution of sphingomyelins and, to a lesser extent, ceramides across the network, indicative of a general strong coregulation of individual sphingolipids with glycerophospholipids (Figure 3F).
Figure S3.

Further Characterization and Validation of the Circular Lipid Coregulatory Network, Related to Figure 3
(A) Lipid clusters as identified in Figure 3C indicated in different colors on the lipid coregulatory network. Lipids that could not be assigned to any single cluster are indicated in gray.
(B) Visualization of diverse measurements on the network: lipid abundance in sh:GFP (far left), the number of unsaturated bonds (left), the type of linkage (right), or lysolipids (far right). For lipid abundance and the number of unsaturated bonds the significance of clustering of these properties are displayed below the respective networks. Color-coded as indicated in corresponding legends.
(C) Left: Relative lipid abundance in sh:Smpdl3b (Heinz et al., 2015) mapped onto the lipid network. Color-coded as indicated in legend. Significances of clustering of these features on the network are displayed.
Color-coding each node in this network according to the log2 fold-change in lipid abundance revealed significant (p < 3.6 × 10⁻²⁸) bimodal separation of increased and decreased lipids for each of the nine perturbations (Figure 3G). These bimodalities reflected an imbalance in the lipid state of each perturbation, supporting the notion that opposite segments of the circular network were also defined by metabolic adaptation. Validating the relevance of this circular network beyond this dataset, the results of an independently performed lipidomics analysis in RAW cells stably silencing Smpdl3b were projected on this network, which also led to the significant separation of increased and decreased lipids (p < 1.2 × 10⁻⁵), revealing yet another unique lipid state (Figure S3C) (Heinz et al., 2015).
Cellular membranes are known to be comprised of lipids with similar fatty acid chain lengths (Holthuis and Menon, 2014; van Meer et al., 2008). Indeed, the majority (58%) of lipid coregulation was found between lipid species with fatty acid chain length differences of two or less, with only ceramides not following this trend (Figure 3H). To assess if the circular network reflected the spatial organization of lipids, we used publicly available lipidomics measurements of subcellular membrane fractions of RAW cells (Andreyev et al., 2010). Mapping of lipids enriched in the different fractions identified distinct segments of the circular network predominantly connecting lipids enriched in either plasma membrane (PM; p < 7.3 × 10⁻⁶) or ER (p < 0.00022) fractions (Figure 3I). Consistent with previous reports, the coregulated long-chained PS and PE species were mostly enriched in the plasma membrane fraction, while the PC species were mostly ER-enriched (Figure 3I) (van Meer et al., 2008). Calculating the significance of the clustering of enriched lipids on the circular network further revealed significant clustering of nuclear-enriched lipids (p < 4.3 × 10⁻⁶), but not of mitochondrial-enriched lipids (Figure 3I).
As an alternative to a protein-centered view on metabolic networks, this analysis of lipid coregulation offered a unique view of the mammalian lipid landscape, revealing a potentially universal logic in lipid organization. Intriguingly, circularity is not typically observed in biological coregulation networks (Costanzo et al., 2010) and may therefore be a unique property of metabolic networks.
Functional Annotation of the Lipid Landscape in TLR Signaling
We next sought to resolve the diverse TLR-phenotypes at the level of earlier TLR signaling and integrate the phenotypes with the abundance of individual lipid species. IL-6 release into the supernatant is a late read-out of TLR activation, as it depends on TLR expression, trafficking, signaling, and cytokine transcription. Therefore, TLR4 plasma membrane levels at steady state as well as LPS-induced internalization dynamics over time (Figure S4A) were monitored for all 24 genetic perturbations and controls using representative cell lines (Figure 4A; Table S1). Silencing of eight genes showed significant reductions of TLR4 surface levels at steady state (>40% reduction at p < 0.01) although none of the genetic perturbations led to a reduction stronger than sh:Tlr4 (87.5%) (Figures S4B–S4D). LPS-dependent activation of TLR4 led to partial receptor internalization at 5 min and a near complete internalization after 30 min for all monitored perturbations (Figures 4A, S4C, and S4D). Normal TLR4 surface levels at steady state were observed for most of the genetic perturbations that led to the strongest reductions in LPS-induced IL-6 release (Figure S4E). However, increased internalization of the receptor 5 min post-stimulation was observed for several perturbations including the three that led to the strongest reductions in IL-6 release (Cers2, Cers5, Ormdl2). Sphingolipid metabolism therefore mostly modulated LPS-induced IL-6 release by altering the trafficking and likely subsequent signaling of TLR4 after stimulation rather than by altering the steady-state TLR4 surface levels.
Figure S4.

Inference and Validation of Lipid Function in TLR-Related Processes, Related to Figure 4
(A) Histograms of TLR4-PE PM levels measured by FACS at steady state or after LPS (100ng/ml) stimulation at indicated time points in wild-type RAW cells.
(B) Histogram of steady-state TLR4-PE PM levels measured in sh:Tlr4 and sh:GFP cell lines analyzed by FACS.
(C and D) Screening results of TLR4 PM levels unstimulated (C) and after 5 min (D) of LPS (100 ng/ml) stimulation in loss-of-function cell lines stained with TLR4-PE and measured by FACS. Values are log2 fold-change of mean fluorescence intensity relative to sh:GFP. Indicated are genes with strongest knockdown phenotypes.
(E) Vector plot of log2 fold-change TLR4 PM levels from 0 to 5 min (x axis) versus log2 fold-change in LPS-induced IL-6 release (y axis). Vector origin (dot) indicates 0 min and end (arrow) indicates 5 min.
(F) Time course measurements of CpG-induced Il6 transcription in the nine knockdown cell lines used for lipidomics (gray line) normalized to unstimulated and 10h sh:GFP control (black line).
(G) Scatter plot of log2 fold-change CpG-induced Il6 mRNA levels (x axis) versus log2 fold-change in CpG-induced IL-6 release (y axis). Indicated are the nine genes selected for lipidomics analysis.
(H) Immunofluorescence microscopy of IL-6 protein levels in sh:Cers2_4, sh:GFP and sh:Tlr4 reveals perinuclear accumulation after 8h stimulation with LPS in sh:Cers2_4. IL-6 (red), actin (green), DAPI (blue). Scale bars indicate 10μm. Inserts show close-ups of indicated areas.
(I) IL-6 and CCL5 release after stimulation with LPS, CpG, or IMQ, in sh:GFP and sh:Cers2_4.
(J) Correlations between relative lipid abundance and measurements of LPS-induced TLR4 PM levels (top) and IMQ-induced IL-6 release (bottom) plotted on the circular network. Nodes of the network are color coded based on the strength of the correlation as indicated in legend.
(K) Average (gray bars) and SEM of the correlations between lipid abundance and IMQ-stimulated IL-6 release, per lipid fatty acid chain length, for ceramides (top) and sphingomyelins (bottom). Dark gray lines indicate chain length trends. Background colors vary with strength of correlation (red for negative, blue for positive correlations).
(L) Cell viability as measured by CellTiter-Glo luminescence, expressed in relative luminescence units (RLU) after supplementation with selected lipids (gray) or respective vehicle control (black).
(M) Scatter plots between relative lipid abundance independently measured for sh:Smpdl3b (x axis) against functional lipid correlations (y axis) for all measured TLR-induced IL-6 release. Dots represent individual lipids, colored based on the local data density. Strong and significant positive correlations of IL-6 release predict a pro-inflammatory phenotype, as confirmed (Heinz et al., 2015).
P-values are indicated above panels. (A) and (B) Data are representative of at least two independent experiments. (C) and (D) Data are combined of two independent experiments with two technical replicates each. (F) Transcriptional data are combined of two independent experiments and shown as mean ± SEM (H) Microscopy results are representative of two independent experiments. (I) Data are representative of at least two independent experiments. ∗ indicate p < 0.05. ns: not significant. (L) Data are representative of at least three independent experiments.
Figure 4.

Inference and Validation of Lipid Function in TLR-Related Processes
(A) TLR4 PM levels after stimulation with LPS for indicated time points normalized to unstained and steady-state control levels for 41 cell lines silencing 24 genes. Both box-and-whisker plots and individual line plots are shown. Lines represent mean values of two independent experiments.
(B) Il6 expression after TLR stimulation measured at indicated time points and normalized to unstimulated and 10h sh:GFP control for 14 cell lines. Lines represent mean values of two independent experiments.
(C) Scatter plot shows example correlation between relative lipid abundance and TLR4 PM levels over the nine perturbations. Red line indicates linear fit.
(D) As in (A), TLR4 PM levels for sh:Ormdl1_3, sh:Ormdl1_4 and sh:GFP control. Data are shown as mean ± SD of two technical replicates ∗p < 0.05.
(E–H) Correlations between relative lipid abundance and measurements of selected TLR-related processes plotted on the circular network.
(I and J) Network close-up of lipids positively (I) and negatively (J) correlated with LPS-induced IL-6 release.
(K) Example correlation of the relative abundance of N-C18:0(OH)-Cer with LPS-induced IL-6 release over all nine cell lines. Red line indicates linear fit.
(L) As in (K), but for the negatively correlated N-C16:0-Cer.
(M) IL-6 release as measured by ELISA after pre-treatment with N-C18:0(OH)-Cer (15μM) or N-C8:0-Cer(2H) (15 μM) or respective vehicle controls. Data are representative of three independent experiments and presented as mean ± SD of four technical replicates. ∗p < 0.005.
(N) As in (M), pre-treatment with N-C16:0-Cer (15 μM) or SM C24:0 (15 μM) or respective vehicle controls. Data are representative of three independent experiments and presented as mean ± SD of four technical replicates. ∗p < 0.005.
To monitor changes in early TLR signaling we performed time course measurements of TLR-induced Il6 transcription for a subset of genetic perturbations including the nine cell lines analyzed by lipidomics (Table S1). Strong changes in Il6 transcript levels were observed, while peak Il6 transcript levels were maintained at 10 hr post-stimulation for all tested cell lines (Figures 4B and S4F), indicating that sphingolipid metabolism affected early TLR signaling, modulating the amplitude not the dynamics of TLR-induced Il6 transcription. Integration with the corresponding IL-6 release phenotypes could separate changes in TLR signaling from defects in cytokine secretion. As expected, most of the cell lines tested displayed altered Il6 transcription coherent with the measured changes in IL-6 release (Figure S4G). Surprisingly though, knockdown of Cers2 showed increased Il6 transcription but decreased IL-6 release, suggestive of enhanced TLR signaling being followed by a post-transcriptional block, potentially at the level of secretion (Figures S4F and S4G). Indeed, intracellular staining of IL-6 after stimulation revealed a strong perinuclear accumulation in a subset of Cers2 silenced cells, while no intracellular accumulation was observed in the controls (sh:GFP or sh:Tlr4) (Figure S4H). Knockdown of Cers2 did however not affect the regulated exocytosis of chemokine CCL5 (Lacy and Stow, 2011), as its TLR-induced release was not reduced (Figure S4I).
Integration of TLR-dependent read-outs with the changes in lipid abundance could allow functional annotation of individual lipids across the lipid landscape. To identify the changes of lipid abundance associated with, for instance, TLR4 surface levels, we analyzed consistent trends over all nine perturbations. This correlation analysis revealed potential functional relationships, as exemplified by the negative correlation (r = −0.84) between the relative abundance of ceramide C20:0 and TLR4 PM levels (Figure 4C). An increase of this lipid species, strongest in sh:Ormdl1 and sh:Ugcg, was associated with reduced TLR4 levels at the plasma membrane (Figure 4D). However, the strong coregulation in the abundance of lipid species identified in this study necessitated a more global analysis of potential lipid function. Therefore, correlations between each TLR-related process and the relative abundance of each lipid were calculated (n = 2,205; Table S2) and mapped onto the lipid coregulatory network (Figures 4E–4H). This resulted in highly significant (p < 3.1 × 10−63) separations of positive and negative correlations between functional readouts and lipid abundance (Figures 4E–4H and S4J). Comparing the functional annotations for TLR4 PM levels with Il6 transcription and IL-6 release revealed different yet overlapping segments of the circular network to be positively and negatively correlated (Figure 4E–4H). This suggested that distinct sets of lipids were functionally related to each step in TLR signaling. The distribution of the functional annotations on the network did not considerably change depending on the different ligands for TLR-induced IL-6 release or time points for LPS-induced TLR4 surface levels, despite changes at the individual lipid level (Figures 4E–4H and S4J).
The similarity in predicted lipid function of neighboring and coregulated lipids in the lipid landscape is consistent with the view that the majority of membrane lipids function in concert with other lipids. Mapping the different correlations onto the circular lipid network revealed short-chained glycerophospholipids and sphingomyelins as positively associated with TLR4 surface expression (Figures 4E and 3F). The majority of ceramides were predicted to negatively modulate TLR4 surface expression, similar to studies reporting that accumulation of ceramides at the plasma membrane led to altered surface expression of the nicotinic acetylcholine receptor (Gallegos et al., 2008). Among the other lipids negatively correlated with TLR4 PM levels were the glycerophospholipids with the longest fatty acid chains associated with the plasma membrane, as well as their lysolipids (Figure 4E). Lysolipids facilitate membrane curvature required for vesicle trafficking (Holthuis and Menon, 2014). The subset of lipids negatively correlated with both IL-6 release and TLR4 PM levels contained most PS species (Figures 4E, 4G, and 4H), for which individual species have been described to negatively influence TLR-induced responses by disrupting membrane microdomains (Parker et al., 2008). Intriguingly, sphingomyelins and ceramides were predicted to both positively and negatively regulate IL-6 release: unsaturated sphingomyelins and short-chained ceramides resided within the positively correlated region of the network, while saturated or nearly saturated sphingomyelins and long-chained ceramides resided within the negatively correlated region at the opposite segment of the network (Figures 4G, 4H, and S4K).
To validate the different predicted functions of sphingolipids in TLR-induced IL-6 release, candidate lipids were selected from the coregulated lipid clusters most enriched for either positive or negative correlations (Figures 4I–4L). A determining factor in candidate selection was the availability of synthetic lipids in a chemically pure form. Compared to vehicle treatment, RAW macrophages showed enhanced LPS-stimulated IL-6 release when pre-treated with the ceramides N-C18:0(OH)-Cer or N-C8:0(2H)-Cer (Figure 4M), validating the inferred function of these two ceramides. Treatment with these lipids alone did not induce IL-6 release. Conversely, LPS-induced IL-6 release after pre-treatment with the sphingomyelin SM C24:0 or the ceramide N-C16:0-Cer was dampened compared to vehicle treatment (Figure 4N), validating the inferred inhibitory function of these lipids on IL-6 release. Lipid supplementation did not affect viability in any of the experiments (Figure S4L).
As sh:Smpdl3b was not included in the set of perturbations that led to the identification of the lipid coregulatory network and to the lipid functional annotations, the lipidomics analysis of sh:Smpdl3b, performed with different infrastructure, was used to test the predictive power of the complete functional annotation of the lipid landscape (Figure S4M). The lipid state of sh:Smpdl3b displayed a highly significant increase of lipids positively associated with, and a decrease of lipids negatively associated with LPS-induced IL-6 release (p < 2.4 × 10⁻⁸). This, therefore, correctly predicted a TLR-induced hyperinflammatory phenotype upon knockdown of Smpdl3b in the same cellular system, based solely on the changes in lipid abundance. Validation experiments confirmed increased pan-TLR signaling in Smpdl3b knockdown cells, and Smpdl3b knockout mice displayed enhanced inflammation in LPS- and Escherichia coli-induced peritonitis models (Heinz et al., 2015). Further, pre-treatment of the hyperinflammatory sh:Smpdl3b cells with a set of ceramide lipid species here predicted to act anti-inflammatory lowered LPS-induced IL-6 release to the levels observed in sh:GFP control (Heinz et al., 2015).
In conclusion, organization of the lipid coregulatory network strongly reflected lipid function across the diverse steps of TLR signaling, revealing a higher-level functional organization for membrane lipids with predictive power at the level of single lipids and the global lipid landscape.
The Lipid Coregulatory Network Is Conserved between Human and Mouse
Mutations in genes associated with sphingolipid metabolism lead to sphingolipid storage disorders associated with severe neurodegeneration and premature death (Futerman and van Meer, 2004). In both patients and mouse models of these diseases, altered cytokine levels have been reported previously (Barak et al., 1999; Wang et al., 2014). To test the validity of the functional annotation of the lipid landscape in a human setting, and independent of shRNA-mediated gene silencing, we performed quantitative lipidomics on patient-derived fibroblasts and their age-matched healthy controls at steady state (Table S3). The patient fibroblasts harbored mutations associated with Gaucher disease, Krabbe disease, Farber disease, and Chediak-Higashi syndrome (Figure 5A). Calculation of the fold-changes of membrane lipid abundance by normalizing against the corresponding healthy controls showed that the fibroblasts also displayed broadly altered lipid states, affecting both glycerophospholipids and sphingolipids (Figure S5A). Measuring lipid-lipid coregulation in this smaller dataset derived from human fibroblasts significantly confirmed the circular lipid coregulatory network derived from mouse RAW macrophages (p < 10−222, Figure 5B). This striking overlap showed conservation of the circular organization of lipid coregulation across species, cell types, and genetic perturbations. Plotting the fold-change lipid abundance for each disease onto the circular network further confirmed the bimodal separation of increased and decreased lipids, indicating that the adaptation mechanisms revealed by the circular organization also occurred in human cells (Figure 5C).
Figure 5.

Lipidomics Analysis of Patient-Derived Fibroblasts Confirms the Circular Lipid Coregulatory Network and Functional Lipid Annotations
(A) Overview of different patient-derived fibroblast samples. Mutated genes are indicated in a close-up of the ceramide metabolic network.
(B) Coregulated lipids observed in both datasets (see legend). Significance (p < 10−222) calculated by the hypergeometric distribution. Data are combined of three independent experiments.
(C) Lipid abundance plotted on the circular network for four patient fibroblast samples. Significance of the clustering on the circular network for the lipid abundance measurements is calculated and shown as in Figure 3I. Data are combined of three independent experiments.
(D) IL-6 release phenotype predictions for each of the patient fibroblast samples are based on the correlation between lipid functional annotation and lipid abundance. Red dashed line indicates p < 0.05. Colored areas indicate significant phenotype predictions (blue, increased IL-6 release; red, reduced IL-6 release).
(E) IL-6 release after stimulation with IMQ (25 μM) and LPS (1 μg/ml) as measured by ELISA for patient fibroblasts and age-matched healthy controls. Mock: unstimulated. Patient fibroblast bars are colored according to the predictions. Data are representative of three independent experiments and presented as mean ± SD of four technical replicates. ∗p < 0.001.
(F) Summary of the LPS- and CpG-induced phenotype predictions for all fibroblast samples, colored according to the agreement between predictions and experiments. Blue and red areas indicate significant (p < 0.05) phenotype predictions as in (D).
Figure S5.

Lipidomics Analysis of Patient-Derived Fibroblasts Confirms Functional Lipid Annotations, Related to Figure 5
(A) Lipidomics analysis of 245 lipid species in four human fibroblast samples. Values are shown as log2 fold-change relative to the respective healthy controls. Each dot represents a lipid species, color coded per lipid class; dot size indicates significance. Vertical gray bars separate lipid classes.
(B) IL-6 release phenotype prediction for the log2 fold-change normalized lipid states of pairs of healthy controls derived from the same biobank, based on the correlation between lipid functional annotation and lipid abundance. Red dashed line indicates p < 0.05. Colored areas indicate significant phenotype predictions (blue, increased IL-6 release; red, reduced IL-6 release).
(C) IL-6 release after stimulation with IMQ as measured by ELISA for different healthy fibroblast samples (see legend).
(D) Lipid abundance plotted on the circular network for the second Gaucher patient fibroblast sample relative to the respective healthy control. Significance of the clustering on the circular network for the lipid abundance measurements is shown. Red line indicates the average absolute difference between abundance of direct neighbors in the network; gray area indicates the distribution of randomized repeats.
(E) As in (B), for the second Gaucher patient fibroblast sample.
(F) IL-6 release after stimulation with IMQ as measured by ELISA for the second Gaucher patient fibroblast sample and age matched healthy control (see legend). Mock: Unstimulated. (A) and (D) Data are combined of three independent experiments. (C) and (F) Data are representative of three independent experiments and presented as mean ± SEM of three technical replicates. ∗ indicated p < 0.005; ns: not significant.
See also Table S3.
Lipid Functional Annotation Predicts the TLR-Induced Response of Patient-Derived Fibroblasts
To globally test the validity of the functional lipid annotations, we next used the changes in lipid abundance to predict the inflammatory states of the patient fibroblasts. The lipid states of Krabbe and Gaucher patient-derived fibroblasts displayed strong positive correlations with the functional lipid annotations for IL-6 release, predictive of a hyperinflammatory response (Figure 5D). Inversely, the lipid states of Farber and Chediak-Higashi patient-derived fibroblasts were predictive of a dampened cytokine release in response to LPS and CpG (Figure 5D). Strikingly, TLR stimulation of the four patient fibroblast samples and corresponding healthy control samples confirmed the predicted inflammatory states; with increased IL-6 release measured for Krabbe and Gaucher and decreased IL-6 release measured for Farber and Chediak-Higashi fibroblasts (Figure 5E). In unstimulated conditions, all of the human samples showed only background IL-6 levels in the supernatant (Figure 5E). When calculating the log2 fold-changes in lipid abundance between pairs of healthy controls, the resulting lipid states were not predictive of either a hyperinflammatory or dampened inflammatory response (Figures 5F and S5B). Indeed, when stimulated under equal conditions, no significant differences in TLR-induced IL-6 release were measured between the healthy control fibroblasts (Figure S5C). In total, the functional lipid annotation derived from RAW cells correctly predicted the inflammatory state of seven of the eight different human fibroblast samples (Figure 5F). The lipid state of the second Gaucher patient fibroblast sample was significantly clustered on the circular network of lipid coregulation (Figure S5D), but was not predictive of an altered IL-6 release phenotype (Figure S5E), even though this was experimentally shown (Figure S5F). Taken together, quantitative lipidomics of patient-derived fibroblasts confirmed both the lipid coregulatory network and the functional annotation of lipids in TLR-induced IL-6 release.
Discussion
Building on the previous success of network-informed perturbation strategies (Bouwmeester et al., 2004) and the ability to quantitatively measure lipid abundance of hundreds of lipid species (Shevchenko and Simons, 2010; Wenk, 2005), we have developed an integrative framework that combined quantitative lipidomics with genetic perturbations and their phenotypic assessment across various TLR-related parameters. In analogy to the early advances in transcriptomics (Eisen et al., 1998), our approach led to the discovery of the conserved circular organization of lipid coregulation and the unbiased inference of lipid function in innate immunity across the lipid landscape.
As the circular lipid network reflects the intersection of different lipid metabolic pathways, metabolic adaptability, and the spatial organization of lipids, it offers a global view of the mammalian lipid landscape. Metabolic pathways commonly display circular motifs, with the citric acid cycle and the urea cycle as well-known examples. Circularity in metabolite coregulation at the order of magnitude discovered here may therefore be a fundamental property of lipid and potentially other metabolic networks. The tight coregulation between lipid species of different classes, most notably between sphingolipids and glycerophospholipids, suggested that part of the robustness of cells to loss of certain membrane lipids may stem from the fact that they are able to functionally compensate this by increasing other lipids (Boumann et al., 2006). It is conceivable that the identified coregulatory interactions are context-dependent, as observed for genetic interactions and signaling networks (Bandyopadhyay et al., 2010). Future comparisons with lipid coregulatory networks measured in different physiological contexts and with measurements of additional lipid classes such as sterols will allow to distinguish general properties from context-dependent variation.
Since membrane lipids predominantly act in concert, and given the strong coregulation of lipids observed, annotation of functions for single lipid species in mammalian cells is challenging and may be uniquely amenable to systematic approaches such as the one developed here. The inference of lipid function, validated at the individual and global lipid level, revealed strikingly opposite functions for individual ceramide species in TLR-driven inflammation (Hannun and Obeid, 2011), consistent with previous contradictory reports on the role of ceramide in inflammation (Józefowski et al., 2010; Vandanmagsar et al., 2011). The functional annotations of membrane lipids in the different TLR-related processes were organized in a continuum on the circular lipid coregulatory network, the implication of which requires further investigation.
The finding that the inflammatory state of perturbed cells could be predicted based solely on this global functional annotation of lipids indicates that the protein state of a cell mediating the inflammatory phenotype is strongly dependent on and intertwined with the cellular lipid state. The concept of predicting functional phenotypes based on different lipid states as outlined in this work should be applicable to more membrane-dependent processes such as cell division (Atilla-Gokcumen et al., 2014), proliferation, apoptosis (Pettus et al., 2002), and autophagy (Singh et al., 2009). Since many of the lipids measured here are present in identical chemical form in different organisms (Guan et al., 2010), the conservation of the identified lipid coregulation and function is an exciting avenue for further research. The unbiased functional annotation of lipids therefore advances lipidomics to complement the genomic and proteomic characterization of cells, expanding our toolset for the investigation and diagnosis of complex diseases. Intriguingly, it may aid the informed design of therapeutic interventions that modulate the cellular lipid state. The framework developed here can identify the function of the lipid landscape in additional biological settings, is scalable to more and diverse perturbations and likely applicable to other metabolites, invaluable for a systems-level understanding of cellular physiology across organisms.
Experimental Procedures
Human Fibroblasts
The following fibroblast samples were obtained from the NIGMS Human Genetic Cell Repository at the Coriell Institute for Medical Research: (GM02075, GM02315, GM05659). The “Cell line and DNA biobank from patients affected by genetic diseases” (Istituto G. Gaslini), member of the Telethon Network of Genetic Biobanks (project no. GTB12001) funded by Telethon Italy, provided us with specimens of human fibroblasts.
Lipid Supplementation
All lipids were solubilized as previously described using ethanol/dodecane (Wijesinghe et al., 2009). RAW264.7 cells were incubated for 30 min with indicated lipid concentrations prior to LPS stimulation.
Lipidomics
Targeted lipidomics analysis was performed on an AB SCiex triple-quadrupole mass spectrometer operating in positive and negative MRM mode (BIOCRATES Life Sciences AG, Innsbruck, Austria). Forty-three Calibrators in seven levels and five internal standards (three of them were deuterated) were used to measure a panel of glycerophospholipids and sphingolipids.
Lipidomics Data Normalization
The lipidomics results were normalized based on the sum of concentrations for all lipid species measured in a single biological replicate. Values were next averaged over the three biological replicates and log2 transformed against the corresponding average concentrations measured in sh:GFP.
Network Clustering Significance
The significance of clustering of various features was calculated by comparing the absolute difference of the given feature between a node and its nearest neighbor as defined by the network, averaged over all nodes, with the distribution of over 10,000 repeats of the same calculation using randomly shuffled feature values.
Membrane Fraction Enrichment Score
The lipid subcellular membrane fraction enrichment scores were calculated as the Z score over the lipid concentrations measured for any one lipid species over all the analyzed fractions (Andreyev et al., 2010).
Lipid Function Prediction
Functional predictions or associations for lipids were performed based on Pearson’s linear correlation coefficients between the log2(FC) readouts of the TLR-related functional assays and the log2(FC) in lipid levels, over the nine shRNA cell lines.
General Statistics
P values were calculated with two-tailed t tests, unless otherwise indicated. Correlation values given are Pearson’s linear correlation coefficients, unless otherwise indicated.
See also the Supplemental Experimental Procedures.
Author Contributions
M.S.K., B.S., L.X.H., C.L.B., A.F., and G.I.V. designed and performed experiments. M.S.K., B.S., L.X.H., C.L.B., A.F., G.I.V., A.-C.G., and G.S.-F. analyzed and interpreted data. M.S.K., B.S., and G.S.-F. wrote the manuscript.
Acknowledgments
We thank Manuela Bruckner for technical assistance and Omar Sharif, Rüdiger Klein, and the entire G.S.-F. lab for feedback. We gratefully acknowledge funding from the Swiss National Science Foundation (P300P3_147897, to B.S.), EMBO (1543-2012, to G.I.V.), the Austrian Academy of Sciences (to Research Center for Molecular Medicine of the Austrian Academy of Sciences), and the ERC i-FIVE advanced investigator grant (to G.S.-F.). “Cell Line and DNA Biobank from Patients Affected by Genetic Diseases,” member of the Telethon Network of Genetic Biobanks (project GTB12001), funded by Telethon Italy, provided us with specimens. We thank Mirella Filocamo from the Instituto G. Gaslini for assistance and feedback.
Published: June 18, 2015
Footnotes
This is an open access article under the CC BY-NC-ND license (http://creativecommons.org/licenses/by-nc-nd/4.0/).
Supplemental Information includes Supplemental Experimental Procedures, five figures, and three tables and can be found with this article online at http://dx.doi.org/10.1016/j.cell.2015.05.051.
Supplemental Information
Overview of the functional characterization of the panel of shRNA cell lines. Color-coded summary table shows number of cell lines, type of read-out and TLR ligands used in each screening set-up (rows 1–7). Large table shows list of all 24 target genes included in the genetic perturbation screen. Gene products are described using Uniprot names (column A). Genes are identified by Gene ID and gene names (columns B–D). Knockdown efficiency was measured by target gene expression using qRT-PCR and normalizing to sh:GFP expression (column G). Cell lines included in the different screens are green (column G). Catalog number, TRC clone ID and shRNA Hairpin sequence are provided (columns H–J). Color-coding of the different assays as in the summary table. Cell lines included in screen indicated by 1, not included indicated by 0 (last four columns). Additional tab shows primer sequences for all 24 genes.
Measured lipid species (n = 245) are annotated with two distinct nomenclatures (columns A and B), and relative abundances are given for each of the measured knockdown cell lines as log2-transformed fold-change compared to sh:GFP (columns C–L), in the “Data” tab. Correlations between relative lipid abundance and relative activity levels of the measured TLR-related process are indicated for each lipid and process (columns M–U). The second tab, entitled “Lipid names” contains more information on the Biocrates lipid annotation scheme. Additional tabs contain raw lipidomics results (including the abundance of several sphingolipid species with odd numbered fatty acid chain lengths excluded from the analysis), annotated therein.
Structure as in Table S2.
References
- Alvarez S.E., Harikumar K.B., Hait N.C., Allegood J., Strub G.M., Kim E.Y., Maceyka M., Jiang H., Luo C., Kordula T. Sphingosine-1-phosphate is a missing cofactor for the E3 ubiquitin ligase TRAF2. Nature. 2010;465:1084–1088. doi: 10.1038/nature09128. [DOI] [PMC free article] [PubMed] [Google Scholar]
- Andreyev A.Y., Fahy E., Guan Z., Kelly S., Li X., McDonald J.G., Milne S., Myers D., Park H., Ryan A. Subcellular organelle lipidomics in TLR-4-activated macrophages. J. Lipid Res. 2010;51:2785–2797. doi: 10.1194/jlr.M008748. [DOI] [PMC free article] [PubMed] [Google Scholar]
- Atilla-Gokcumen G.E., Muro E., Relat-Goberna J., Sasse S., Bedigian A., Coughlin M.L., Garcia-Manyes S., Eggert U.S. Dividing cells regulate their lipid composition and localization. Cell. 2014;156:428–439. doi: 10.1016/j.cell.2013.12.015. [DOI] [PMC free article] [PubMed] [Google Scholar]
- Bandyopadhyay S., Mehta M., Kuo D., Sung M.K., Chuang R., Jaehnig E.J., Bodenmiller B., Licon K., Copeland W., Shales M. Rewiring of genetic networks in response to DNA damage. Science. 2010;330:1385–1389. doi: 10.1126/science.1195618. [DOI] [PMC free article] [PubMed] [Google Scholar]
- Barak V., Acker M., Nisman B., Kalickman I., Abrahamov A., Zimran A., Yatziv S. Cytokines in Gaucher’s disease. Eur. Cytokine Netw. 1999;10:205–210. [PubMed] [Google Scholar]
- Bonham K.S., Orzalli M.H., Hayashi K., Wolf A.I., Glanemann C., Weninger W., Iwasaki A., Knipe D.M., Kagan J.C. A promiscuous lipid-binding protein diversifies the subcellular sites of toll-like receptor signal transduction. Cell. 2014;156:705–716. doi: 10.1016/j.cell.2014.01.019. [DOI] [PMC free article] [PubMed] [Google Scholar]
- Boumann H.A., Gubbens J., Koorengevel M.C., Oh C.S., Martin C.E., Heck A.J., Patton-Vogt J., Henry S.A., de Kruijff B., de Kroon A.I. Depletion of phosphatidylcholine in yeast induces shortening and increased saturation of the lipid acyl chains: evidence for regulation of intrinsic membrane curvature in a eukaryote. Mol. Biol. Cell. 2006;17:1006–1017. doi: 10.1091/mbc.E05-04-0344. [DOI] [PMC free article] [PubMed] [Google Scholar]
- Bouwmeester T., Bauch A., Ruffner H., Angrand P.O., Bergamini G., Croughton K., Cruciat C., Eberhard D., Gagneur J., Ghidelli S. A physical and functional map of the human TNF-alpha/NF-kappa B signal transduction pathway. Nat. Cell Biol. 2004;6:97–105. doi: 10.1038/ncb1086. [DOI] [PubMed] [Google Scholar]
- Breslow D.K., Collins S.R., Bodenmiller B., Aebersold R., Simons K., Shevchenko A., Ejsing C.S., Weissman J.S. Orm family proteins mediate sphingolipid homeostasis. Nature. 2010;463:1048–1053. doi: 10.1038/nature08787. [DOI] [PMC free article] [PubMed] [Google Scholar]
- Coskun U., Simons K. Cell membranes: the lipid perspective. Structure. 2011;19:1543–1548. doi: 10.1016/j.str.2011.10.010. [DOI] [PubMed] [Google Scholar]
- Costanzo M., Baryshnikova A., Bellay J., Kim Y., Spear E.D., Sevier C.S., Ding H., Koh J.L., Toufighi K., Mostafavi S. The genetic landscape of a cell. Science. 2010;327:425–431. doi: 10.1126/science.1180823. [DOI] [PMC free article] [PubMed] [Google Scholar]
- da Silveira Dos Santos A.X., Riezman I., Aguilera-Romero M.A., David F., Piccolis M., Loewith R., Schaad O., Riezman H. Systematic lipidomic analysis of yeast protein kinase and phosphatase mutants reveals novel insights into regulation of lipid homeostasis. Mol. Biol. Cell. 2014;25:3234–3246. doi: 10.1091/mbc.E14-03-0851. [DOI] [PMC free article] [PubMed] [Google Scholar]
- Dennis E.A., Deems R.A., Harkewicz R., Quehenberger O., Brown H.A., Milne S.B., Myers D.S., Glass C.K., Hardiman G., Reichart D. A mouse macrophage lipidome. J. Biol. Chem. 2010;285:39976–39985. doi: 10.1074/jbc.M110.182915. [DOI] [PMC free article] [PubMed] [Google Scholar]
- Eisen M.B., Spellman P.T., Brown P.O., Botstein D. Cluster analysis and display of genome-wide expression patterns. Proc. Natl. Acad. Sci. USA. 1998;95:14863–14868. doi: 10.1073/pnas.95.25.14863. [DOI] [PMC free article] [PubMed] [Google Scholar]
- Futerman A.H., van Meer G. The cell biology of lysosomal storage disorders. Nat. Rev. Mol. Cell Biol. 2004;5:554–565. doi: 10.1038/nrm1423. [DOI] [PubMed] [Google Scholar]
- Gallegos C.E., Pediconi M.F., Barrantes F.J. Ceramides modulate cell-surface acetylcholine receptor levels. Biochim. Biophys. Acta. 2008;1778:917–930. doi: 10.1016/j.bbamem.2007.10.019. [DOI] [PubMed] [Google Scholar]
- Guan X.L., Riezman I., Wenk M.R., Riezman H. Yeast lipid analysis and quantification by mass spectrometry. Methods Enzymol. 2010;470:369–391. doi: 10.1016/S0076-6879(10)70015-X. [DOI] [PubMed] [Google Scholar]
- Hanada K. Serine palmitoyltransferase, a key enzyme of sphingolipid metabolism. Biochim. Biophys. Acta. 2003;1632:16–30. doi: 10.1016/s1388-1981(03)00059-3. [DOI] [PubMed] [Google Scholar]
- Hannun Y.A., Obeid L.M. Many ceramides. J. Biol. Chem. 2011;286:27855–27862. doi: 10.1074/jbc.R111.254359. [DOI] [PMC free article] [PubMed] [Google Scholar]
- Heinz L.X., Baumann C.L., Köberlin M.S., Snijder B., Gawish R., Shui G., Sharif O., Aspalter I.M., Müller A.C., Kandasamy R.K. The lipid-modifying enzyme SMPDL3B negatively regulates innate immunity. Cell Rep. 2015 doi: 10.1016/j.celrep.2015.05.006. Published online June 18, 2015. [DOI] [PMC free article] [PubMed] [Google Scholar]
- Holthuis J.C., Menon A.K. Lipid landscapes and pipelines in membrane homeostasis. Nature. 2014;510:48–57. doi: 10.1038/nature13474. [DOI] [PubMed] [Google Scholar]
- Józefowski S., Czerkies M., Łukasik A., Bielawska A., Bielawski J., Kwiatkowska K., Sobota A. Ceramide and ceramide 1-phosphate are negative regulators of TNF-α production induced by lipopolysaccharide. J. Immunol. 2010;185:6960–6973. doi: 10.4049/jimmunol.0902926. [DOI] [PubMed] [Google Scholar]
- Kanehisa M., Goto S. KEGG: Kyoto encyclopedia of genes and genomes. Nucleic Acids Res. 2000;28:27–30. doi: 10.1093/nar/28.1.27. [DOI] [PMC free article] [PubMed] [Google Scholar]
- Kawai T., Akira S. The role of pattern-recognition receptors in innate immunity: update on Toll-like receptors. Nat. Immunol. 2010;11:373–384. doi: 10.1038/ni.1863. [DOI] [PubMed] [Google Scholar]
- Lacy P., Stow J.L. Cytokine release from innate immune cells: association with diverse membrane trafficking pathways. Blood. 2011;118:9–18. doi: 10.1182/blood-2010-08-265892. [DOI] [PubMed] [Google Scholar]
- Lee C.C., Avalos A.M., Ploegh H.L. Accessory molecules for Toll-like receptors and their function. Nat. Rev. Immunol. 2012;12:168–179. doi: 10.1038/nri3151. [DOI] [PMC free article] [PubMed] [Google Scholar]
- Levy M., Futerman A.H. Mammalian ceramide synthases. IUBMB Life. 2010;62:347–356. doi: 10.1002/iub.319. [DOI] [PMC free article] [PubMed] [Google Scholar]
- Maeda K., Anand K., Chiapparino A., Kumar A., Poletto M., Kaksonen M., Gavin A.C. Interactome map uncovers phosphatidylserine transport by oxysterol-binding proteins. Nature. 2013;501:257–261. doi: 10.1038/nature12430. [DOI] [PubMed] [Google Scholar]
- Memon R.A., Holleran W.M., Moser A.H., Seki T., Uchida Y., Fuller J., Shigenaga J.K., Grunfeld C., Feingold K.R. Endotoxin and cytokines increase hepatic sphingolipid biosynthesis and produce lipoproteins enriched in ceramides and sphingomyelin. Arterioscler. Thromb. Vasc. Biol. 1998;18:1257–1265. doi: 10.1161/01.atv.18.8.1257. [DOI] [PubMed] [Google Scholar]
- Okino N., He X., Gatt S., Sandhoff K., Ito M., Schuchman E.H. The reverse activity of human acid ceramidase. J. Biol. Chem. 2003;278:29948–29953. doi: 10.1074/jbc.M303310200. [DOI] [PubMed] [Google Scholar]
- Parker L.C., Prestwich E.C., Ward J.R., Smythe E., Berry A., Triantafilou M., Triantafilou K., Sabroe I. A phosphatidylserine species inhibits a range of TLR- but not IL-1beta-induced inflammatory responses by disruption of membrane microdomains. J. Immunol. 2008;181:5606–5617. doi: 10.4049/jimmunol.181.8.5606. [DOI] [PMC free article] [PubMed] [Google Scholar]
- Pettus B.J., Chalfant C.E., Hannun Y.A. Ceramide in apoptosis: an overview and current perspectives. Biochim. Biophys. Acta. 2002;1585:114–125. doi: 10.1016/s1388-1981(02)00331-1. [DOI] [PubMed] [Google Scholar]
- Ramsey S.A., Klemm S.L., Zak D.E., Kennedy K.A., Thorsson V., Li B., Gilchrist M., Gold E.S., Johnson C.D., Litvak V. Uncovering a macrophage transcriptional program by integrating evidence from motif scanning and expression dynamics. PLoS Comput. Biol. 2008;4:e1000021. doi: 10.1371/journal.pcbi.1000021. [DOI] [PMC free article] [PubMed] [Google Scholar]
- Serhan C.N., Chiang N., Van Dyke T.E. Resolving inflammation: dual anti-inflammatory and pro-resolution lipid mediators. Nat. Rev. Immunol. 2008;8:349–361. doi: 10.1038/nri2294. [DOI] [PMC free article] [PubMed] [Google Scholar]
- Shevchenko A., Simons K. Lipidomics: coming to grips with lipid diversity. Nat. Rev. Mol. Cell Biol. 2010;11:593–598. doi: 10.1038/nrm2934. [DOI] [PubMed] [Google Scholar]
- Singh R., Kaushik S., Wang Y., Xiang Y., Novak I., Komatsu M., Tanaka K., Cuervo A.M., Czaja M.J. Autophagy regulates lipid metabolism. Nature. 2009;458:1131–1135. doi: 10.1038/nature07976. [DOI] [PMC free article] [PubMed] [Google Scholar]
- Siow D.L., Wattenberg B.W. Mammalian ORMDL proteins mediate the feedback response in ceramide biosynthesis. J. Biol. Chem. 2012;287:40198–40204. doi: 10.1074/jbc.C112.404012. [DOI] [PMC free article] [PubMed] [Google Scholar]
- Snijder B., Liberali P., Frechin M., Stoeger T., Pelkmans L. Predicting functional gene interactions with the hierarchical interaction score. Nat. Methods. 2013;10:1089–1092. doi: 10.1038/nmeth.2655. [DOI] [PubMed] [Google Scholar]
- Snijder B., Kandasamy R.K., Superti-Furga G. Toward effective sharing of high-dimensional immunology data. Nat. Biotechnol. 2014;32:755–759. doi: 10.1038/nbt.2974. [DOI] [PubMed] [Google Scholar]
- Stetson D.B., Medzhitov R. Recognition of cytosolic DNA activates an IRF3-dependent innate immune response. Immunity. 2006;24:93–103. doi: 10.1016/j.immuni.2005.12.003. [DOI] [PubMed] [Google Scholar]
- van Meer G., Voelker D.R., Feigenson G.W. Membrane lipids: where they are and how they behave. Nat. Rev. Mol. Cell Biol. 2008;9:112–124. doi: 10.1038/nrm2330. [DOI] [PMC free article] [PubMed] [Google Scholar]
- Vandanmagsar B., Youm Y.H., Ravussin A., Galgani J.E., Stadler K., Mynatt R.L., Ravussin E., Stephens J.M., Dixit V.D. The NLRP3 inflammasome instigates obesity-induced inflammation and insulin resistance. Nat. Med. 2011;17:179–188. doi: 10.1038/nm.2279. [DOI] [PMC free article] [PubMed] [Google Scholar]
- Wang L., Kantovitz K.R., Cullinane A.R., Nociti F.H., Jr., Foster B.L., Roney J.C., Tran A.B., Introne W.J., Somerman M.J. Skin fibroblasts from individuals with Chediak-Higashi Syndrome (CHS) exhibit hyposensitive immunogenic response. Orphanet J. Rare Dis. 2014;9:212. doi: 10.1186/s13023-014-0212-7. [DOI] [PMC free article] [PubMed] [Google Scholar]
- Wenk M.R. The emerging field of lipidomics. Nat. Rev. Drug Discov. 2005;4:594–610. doi: 10.1038/nrd1776. [DOI] [PubMed] [Google Scholar]
- Wijesinghe D.S., Subramanian P., Lamour N.F., Gentile L.B., Granado M.H., Bielawska A., Szulc Z., Gomez-Munoz A., Chalfant C.E. Chain length specificity for activation of cPLA2alpha by C1P: use of the dodecane delivery system to determine lipid-specific effects. J. Lipid Res. 2009;50:1986–1995. doi: 10.1194/jlr.M800367-JLR200. [DOI] [PMC free article] [PubMed] [Google Scholar]
Associated Data
This section collects any data citations, data availability statements, or supplementary materials included in this article.
Supplementary Materials
Overview of the functional characterization of the panel of shRNA cell lines. Color-coded summary table shows number of cell lines, type of read-out and TLR ligands used in each screening set-up (rows 1–7). Large table shows list of all 24 target genes included in the genetic perturbation screen. Gene products are described using Uniprot names (column A). Genes are identified by Gene ID and gene names (columns B–D). Knockdown efficiency was measured by target gene expression using qRT-PCR and normalizing to sh:GFP expression (column G). Cell lines included in the different screens are green (column G). Catalog number, TRC clone ID and shRNA Hairpin sequence are provided (columns H–J). Color-coding of the different assays as in the summary table. Cell lines included in screen indicated by 1, not included indicated by 0 (last four columns). Additional tab shows primer sequences for all 24 genes.
Measured lipid species (n = 245) are annotated with two distinct nomenclatures (columns A and B), and relative abundances are given for each of the measured knockdown cell lines as log2-transformed fold-change compared to sh:GFP (columns C–L), in the “Data” tab. Correlations between relative lipid abundance and relative activity levels of the measured TLR-related process are indicated for each lipid and process (columns M–U). The second tab, entitled “Lipid names” contains more information on the Biocrates lipid annotation scheme. Additional tabs contain raw lipidomics results (including the abundance of several sphingolipid species with odd numbered fatty acid chain lengths excluded from the analysis), annotated therein.
Structure as in Table S2.