

Abstract
Background
The World Health Organization (WHO) recommends treating all school children at regular intervals with deworming drugs in areas where helminth infection is common. As the intervention is often claimed to have important health, nutrition, and societal effects beyond the removal of worms, we critically evaluated the evidence on benefits.
Objectives
To summarize the effects of giving deworming drugs to children to treat soil‐transmitted helminths on weight, haemoglobin, and cognition; and the evidence of impact on physical well‐being, school attendance, school performance, and mortality.
Search methods
We searched the Cochrane Infectious Diseases Group Specialized Register (14 April 2015); Cochrane Central Register of Controlled Trials (CENTRAL), published in the Cochrane Library (2015, Issue 4); MEDLINE (2000 to 14 April 2015); EMBASE (2000 to 14 April 2015); LILACS (2000 to 14 April 2015); the metaRegister of Controlled Trials (mRCT); and reference lists, and registers of ongoing and completed trials up to 14 April 2015.
Selection criteria
We included randomized controlled trials (RCTs) and quasi‐RCTs comparing deworming drugs for soil‐transmitted helminths with placebo or no treatment in children aged 16 years or less, reporting on weight, haemoglobin, and formal tests of intellectual development. We also sought data on school attendance, school performance, and mortality. We included trials that combined health education with deworming programmes.
Data collection and analysis
At least two review authors independently assessed the trials, evaluated risk of bias, and extracted data. We analysed continuous data using the mean difference (MD) with 95% confidence intervals (CIs). Where data were missing, we contacted trial authors. We used outcomes at time of longest follow‐up. The evidence quality was assessed using GRADE. This edition of the Cochrane Review adds the DEVTA trial from India, and draws on an independent analytical replication of a trial from Kenya.
Main results
We identified 45 trials, including nine cluster‐RCTs, that met the inclusion criteria. One trial evaluating mortality included over one million children, and the remaining 44 trials included a total of 67,672 participants. Eight trials were in children known to be infected, and 37 trials were carried out in endemic areas, including areas of high (15 trials), moderate (12 trials), and low prevalence (10 trials).
Treating children known to be infected
Treating children known to be infected with a single dose of deworming drugs (selected by screening, or living in areas where all children are infected) may increase weight gain over the next one to six months (627 participants, five trials, low quality evidence). The effect size varied across trials from an additional 0.2 kg gain to 1.3 kg. There is currently insufficient evidence to know whether treatment has additional effects on haemoglobin (247 participants, two trials, very low quality evidence); school attendance (0 trials); cognitive functioning (103 participants, two trials, very low quality evidence), or physical well‐being (280 participants, three trials, very low quality evidence).
Community deworming programmes
Treating all children living in endemic areas with a dose of deworming drugs probably has little or no effect on average weight gain (MD 0.04 kg less, 95% CI 0.11 kg less to 0.04 kg more; trials 2719 participants, seven trials, moderate quality evidence), even in settings with high prevalence of infection (290 participants, two trials). A single dose also probably has no effect on average haemoglobin (MD 0.06 g/dL, 95% CI ‐0.05 lower to 0.17 higher; 1005 participants, three trials, moderate quality evidence), or average cognition (1361 participants, two trials, low quality evidence).
Similiarly, regularly treating all children in endemic areas with deworming drugs, given every three to six months, may have little or no effect on average weight gain (MD 0.08 kg, 95% CI 0.11 kg less to 0.27 kg more; 38,392 participants, 10 trials, low quality evidence). The effects were variable across trials; one trial from a low prevalence setting carried out in 1995 found an increase in weight, but nine trials carried out since then found no effect, including five from moderate and high prevalence areas.
There is also reasonable evidence that regular treatment probably has no effect on average height (MD 0.02 cm higher, 95% CI 0.14 lower to 0.17 cm higher; 7057 participants, seven trials, moderate quality evidence); average haemoglobin (MD 0.02 g/dL lower; 95% CI 0.08 g/dL lower to 0.04 g/dL higher; 3595 participants, seven trials, low quality evidence); formal tests of cognition (32,486 participants, five trials, moderate quality evidence); exam performance (32,659 participants, two trials, moderate quality evidence); or mortality (1,005,135 participants, three trials, low quality evidence). There is very limited evidence assessing an effect on school attendance and the findings are inconsistent, and at risk of bias (mean attendance 2% higher, 95% CI 4% lower to 8% higher; 20,243 participants, two trials, very low quality evidence).
In a sensitivity analysis that only included trials with adequate allocation concealment, there was no evidence of any effect for the main outcomes.
Authors' conclusions
Treating children known to have worm infection may have some nutritional benefits for the individual. However, in mass treatment of all children in endemic areas, there is now substantial evidence that this does not improve average nutritional status, haemoglobin, cognition, school performance, or survival.
Keywords: Adolescent; Child; Child, Preschool; Humans; Anthelmintics; Anthelmintics/pharmacology; Anthelmintics/therapeutic use; Child Development; Child Development/drug effects; Cognition; Cognition/drug effects; Endemic Diseases; Growth; Growth/drug effects; Helminthiasis; Helminthiasis/complications; Helminthiasis/drug therapy; Hemoglobin A; Hemoglobin A/drug effects; Intestinal Diseases, Parasitic; Intestinal Diseases, Parasitic/complications; Intestinal Diseases, Parasitic/drug therapy; Nutritional Status; Nutritional Status/drug effects; Randomized Controlled Trials as Topic; Soil; Soil/parasitology; Weight Gain; Weight Gain/drug effects
Deworming school children in developing countries
In this Cochrane Review, Cochrane researchers examined the effects of deworming children in areas where intestinal worm infection is common. After searching for relevant trials up to April 2015, we included 44 trials with a total of 67,672 participants, and an additional trial of one million children.
What is deworming and why might it be important
Soil‐transmitted worms, including roundworms, hookworms, and whipworms, are common in tropical and subtropical areas, and particularly affect children in low‐income areas where there is inadequate sanitation. Heavy worm infection is associated with malnutrition, poor growth, and anaemia in children.
The World Health Organization currently recommends that school children in endemic areas are regularly treated with drugs which kill these worms. The recommended drugs are effective at eliminating or greatly reducing worm infections, but the question remains whether doing so will reduce anaemia and improve growth, and consequently improve school attendance, school performance, and economic development, as has been claimed.
What the research says
In trials that treat only children known to be infected, deworming drugs may increase weight gain (low quality evidence), but we do not know if there is an effect on cognitive functioning or physical well‐being (very low quality evidence).
In trials treating all children living in an endemic area, deworming drugs have little or no effect on average weight gain (moderate quality evidence), haemoglobin (low quality evidence), or cognition (moderate quality evidence).
Regular deworming treatment every three to six months may also have little or no effect on average weight gain (low quality evidence). The effects were variable across trials: one trial from 1995 in a low prevalence setting found an increase in weight, but nine trials carried out since then from moderate or high prevalence settings showed no effect.
There is good evidence that regular treatment probably has no effect on average height (moderate quality evidence), haemoglobin (low quality evidence), formal tests of cognition (moderate quality evidence), or exam performance (moderate quality evidence). We do not know if there is an effect on school attendance (very low quality evidence).
Authors conclusions
Treating children known to have worm infection may improve weight gain but there is limited evidence of other benefits. For routine deworming of school children in endemic areas, there is quite substantial evidence that deworming programmes do not show benefit in terms of average nutritional status, haemoglobin, cognition, school performance, or death.
Summary of findings
Summary of findings for the main comparison.
Multiple doses of deworming drugs given to all children, longest follow‐up
| In communities where intestinal helminths are endemic, what is the effect of multiple doses of deworming drugs given to all children? | ||||||
| Patient or population: School‐aged children Settings: Areas endemic for intestinal helminths Intervention: Multiple dose deworming drugs, longest follow‐up | ||||||
| Outcomes | Illustrative comparative risks* (95% CI) | Relative effect (95% CI) | No of participants (trials) | Quality of the evidence (GRADE) | Comments | |
| Assumed risk | Corresponding risk | |||||
| Control | Deworming drugs (Multiple doses) | |||||
| Weight (kg) Follow‐up: 6 months to 3 years | The mean change in weight in the control arm ranged from 1.2 kg to 4.73 kg | The mean weight gain in the intervention groups was 0.08 kg more (0.11 kg less to 0.27 kg more) |
— | 38,392 (10 trials1) | ⊕⊕⊝⊝ low2,3 Due to risk of bias and inconsistency |
There may be little or no effect on weight gain |
| Height (cm) Follow‐up: 6 months to 2 years | The mean gain in height in the control groups ranged from 2.39 to 16.4 cm |
The mean gain in height in the intervention groups was 0.02 cm higher (0.14 lower to 0.17 higher) | — | 7057 (7 trials4) | ⊕⊕⊕⊝ moderate5 Due to risk of bias |
Probably little or no effect on height |
| Haemoglobin (g/dL) Follow‐up: 6 months to 2 years | The mean change in haemoglobin in the control groups ranged from 0.26 to 1.75 g/dL |
The mean haemoglobin in the intervention groups was 0.02 g/dL lower (0.08 lower to 0.04 higher) | — | 3595 (7 trials6) | ⊕⊕⊝⊝ low7,8 Due to risk of bias and indirectness |
There may be little or no effect on haemoglobin |
| Formal tests of cognition Follow‐up: 2 years | — | None of the trials reported a benefit of deworming across multiple tests9 | — | 32,486 (5 trials10) | ⊕⊕⊕⊝ moderate11 Due to risk of bias |
Probably little or no effect on cognition |
| Physical well‐being | — | — | — | — (0 trials) |
— | We don't know if there is an effect on physical well‐being |
| School attendance Follow‐up: 2 years (longest follow‐up) | The mean school attendance in the control groups ranged from 66% to 90% | The mean school attendance in the intervention groups was 2% higher (‐4 lower to 8 higher)12 | — | 20,243 (2 trials13) | ⊕⊝⊝⊝ very low14,15,16 Due to risk of bias and indirectness |
We don't know if there is an effect on school attendance |
| School performance | — | No difference in exam performances was detected in either trial | — | 32,659 (2 trials) |
⊕⊕⊕⊝ moderate17,18 |
Probably little or no effect on school performance |
|
Death (between ages 1 and 6 years) |
27 per 1000 | 25 per 1000 |
RR 0.95 (0.89 to 1.92) |
1,005,135 (3 trials)19 | ⊕⊕⊝⊝ low20,21 Due to risk of bias and indirectness |
May be little or no effect on death |
| *The basis for the assumed risk (eg the median control group risk across trials) is provided in footnotes. The corresponding risk (and its 95% CI) is based on the assumed risk in the comparison group and the relative effect of the intervention (and its 95% CI). CI: Confidence interval; RR: risk ratio. | ||||||
| GRADE Working Group grades of evidence High quality: Further research is very unlikely to change our confidence in the estimate of effect. Moderate quality: Further research is likely to have an important impact on our confidence in the estimate of effect and may change the estimate. Low quality: Further research is very likely to have an important impact on our confidence in the estimate of effect and is likely to change the estimate. Very low quality: We are very uncertain about the estimate. | ||||||
1Four cluster‐RCTs (302 clusters) and six individually RCTs (2552 participants). 2Downgraded by 1 for risk of bias: trials had high or unclear risk of selection bias. 3Downgraded by 1 for inconsistency. One trial had a large effect and in a sensitivity analysis only including high quality trials the heterogeneity was considerably reduced. This trial was from a low prevalence setting (Awasthi 1995 (Cluster); 0.98 kg). A subsequent trial in the same trial area as Awasthi 1995 (Cluster) found no effect. 4Two cluster‐RCTs (174 clusters) and five individually RCT (1861 participants). 5Downgraded by 1 for risk of bias: two trials were considered at high risk of selection bias (Awasthi 2000; Awasthi 1995 (Cluster)), and in the remaining trials the risk was unclear. 6All individually RCTs. In a re‐analysis of one large quasi‐experimental design (Miguel 2004 (Cluster); Aiken 2015) no difference in anaemia between deworming and control groups was reported. 7Downgraded by 1 for risk of bias: two trials (Awasthi 2000; Kirwan 2010) were considered at high risk of selection bias; in the remaining trials the risk was low or unclear. 8Downgrade by 1 for indirectness: trials were conducted in low‐ and moderate‐prevalence settings, where any putative effect may be attenuated.
9Awasthi 2000, with a follow‐up of two years, reported that there was no difference in development between treatment groups in terms of proportion with "normal" development. Ndibazza 2012 measured a range of cognitive tests with a follow‐up post‐treatment and found no effect of deworming. Miguel 2004 (Cluster) measured a range of cognitive tests with a follow‐up of two years, but no deworming effect was demonstrated. Stoltzfus 2001, with a follow‐up of 12 months, found that treatment had no significant effect on motor or language development. Watkins 1996, with a follow‐up of six months, found no difference on any of the tests between treatment groups. 10One cluster‐RCT, and four individually RCTs. 11Downgraded by 1 for risk of bias: two trials were considered at high risk of selection bias (Awasthi 2000; Miguel 2004 (Cluster)), and in the remaining trials the risk was low or unclear. 12These are the corrected effects from the Aitken replication on the 3ie website. 13One cluster‐RCT (50 clusters (20,000 participants) and one individually RCT (226 participants). The meta‐analysis includes the two year follow‐up for Miguel 2004 (Cluster). The trial has one‐year follow‐up on two other quasi‐randomized comparisons. These results are shown in Table 17. These demonstrate higher participation in both arms (9.3% and 5.4%) but these estimates are not independent because the control group in one comparison becomes the intervention group in the subsequent year. One additional trial showed no effect but did not provide measures of variance. 14Downgraded by 1 for risk of bias: Miguel 2004 (Cluster) had a high risk of bias for sequence generation, allocation concealment and blinding. 15Downgraded by 1 for imprecision: CIs include 4% lower attendance with deworming to 8% higher. 16Downgraded by 1 for indirectness: the intervention included a comprehensive health education programme in schools, and it not possible to determine which component of the complex intervention led to effects on attendance. 17Downgraded by 1 for risk of bias. A number of previously documented problems with the trial design. 18Neither trial demonstrates an effect, with narrow CIs. 19Two cluster‐RCTs (122 clusters) and one individually RCT (1423 participants). DEVTA dwarfs the other trials, none of which were adequately powered. 20Downgraded by 1 for risk of bias: none of the trials adequately described allocation concealment to be considered "low risk of bias". 21Downgraded by 1 indirectness: DEVTA was conducted in a low prevalence area and the findings may not be generalizable to higher prevalence areas.
Summary of findings 2.
Single dose of deworming drugs given to infected children
| In infected children, what is the effect of a single dose of deworming drugs? | ||||||
|
Patient or population: Children known to be infected with soil‐transmitted intestinal worms Settings: Areas hyper‐endemic for intestinal helminths, or children screened for infection Intervention: Single dose deworming drugs Control: No intervention | ||||||
| Outcomes | Illustrative comparative risks* (95% CI) | Relative effect (95% CI) | No of participants (trials) | Quality of the evidence (GRADE) | Comments | |
| Assumed risk | Corresponding risk | |||||
| Control | Deworming drugs (Single dose) | |||||
| Weight (kg) Follow‐up: 4 weeks to 6 months | The mean gain in weight in the control groups ranged from 0.54 to 2.2 kg | The gain in weight in the intervention groups ranged from 0.20 to 1.30 kg higher | Not pooled | 627 (5 trials) | ⊕⊕⊝⊝ low1,2 Due to risk of bias and inconsistency |
May increase average weight gain |
| Haemoglobin (g/dL) Follow‐up: 9 weeks to 6 months | The mean change in haemoglobin in the control groups ranged from ‐0.6 to ‐0.9 g/dL |
The mean change in haemoglobin in the intervention groups was 0.10 g/dL higher (0.65 lower to 0.86 higher) | — | 247 (2 trials) | ⊕⊝⊝⊝ very low1,2,3 Due to risk of bias, inconsistency and indirectness |
We don't know if there is an effect on average haemoglobin |
| Formal tests of cognition | — | — | Not pooled | 103 (2 trials) | ⊕⊝⊝⊝ very low4 Due to risk of bias and indirectness |
We don't know if there is an effect on cognition |
| Physical well‐being | — | — | Not pooled5 | 280 (3 trials) |
⊕⊝⊝⊝ very low5,6 due to risk of bias and indirectness |
We don't know if there is an effect on physical well‐being |
| School attendance | — | — | — | — (0 trials) |
— | We don't know if there is an effect on school attendance |
| *The basis for the assumed risk (eg the median control group risk across trials) is provided in footnotes. The corresponding risk (and its 95% CI) is based on the assumed risk in the comparison group and the relative effect of the intervention (and its 95% CI). CI: Confidence interval. | ||||||
| GRADE Working Group grades of evidence High quality: Further research is very unlikely to change our confidence in the estimate of effect. Moderate quality: Further research is likely to have an important impact on our confidence in the estimate of effect and may change the estimate. Low quality: Further research is very likely to have an important impact on our confidence in the estimate of effect and is likely to change the estimate. Very low quality: We are very uncertain about the estimate. | ||||||
1Downgraded by 1 for risk of bias: none of the trials adequately described allocation concealment. 2Downgraded by 1 for inconsistency: there is a high level of heterogeneity. 3Downgraded by 1 for indirectness: one of the trials showing large effects is from a highly endemic area in Kenya with intense worm loads and conducted 20 years ago. 4Downgraded by 2 for risk of bias and 1 for indirectness: two trials measured cognitive functioning: i) Kvalsvig 1991a, with a follow‐up of one month, did not clearly report the changes in cognitive scores since "the dose of mebendazole was inadequate to free children from infection"; and ii) Nokes 1992, with a follow‐up of nine weeks, reported that results of a multiple regression suggest a greater improvement in treated children in 3/10 tests (fluency, digit span forwards, digit span backwards). These two trials are not easily generalized to other settings. 5 Downgraded by 1 for indirectness: Small differences in Harvard Step tests in two older trials in Kenya; no differences detected in VO2 and other parameters in a third trial with a small number of participants suggested no differences (Table 18). 6Downgraded by 2 for risk of bias: only one of the trials adequately described allocation concealment to be considered low risk of selection bias. Two trials conducted Harvard step tests on small non‐random samples of larger trials.
Summary of findings 3.
Single dose of deworming drugs given to all children
| In communities where intestinal helminths are endemic, what is the effect of a single dose of deworming drugs given to all children? | ||||||
|
Patient or population: All children Settings: Areas endemic for intestinal helminths Intervention: Single dose deworming drugs Control: No intervention | ||||||
| Outcomes | Illustrative comparative risks* (95% CI) | Relative effect (95% CI) | No of participants (trials) | Quality of the evidence (GRADE) | Comments | |
| Assumed risk | Corresponding risk | |||||
| Control | Deworming drugs (Single dose) | |||||
| Weight (kg) Follow‐up: 7 weeks to 1 year | The mean weight gain in the control groups ranged from 0.45 kg to 1.19 kg |
The mean weight gain in the intervention groups was 0.04 kg less (0.11 kg less to 0.04 kg more) |
— | 2719 (7 trials) | ⊕⊕⊕⊝ moderate1 Due to risk of bias |
Probably little or no effect on average weight gain |
| Haemoglobin (g/dL) Follow‐up: 9 weeks to 6 months | The mean haemoglobin in the control groups ranged from 12.01 to 12.12 g/dL |
The mean haemoglobin in the intervention groups was 0.06 g/dL higher (0.05 lower to 0.17 higher) | — | 1005 (3 trials) | ⊕⊕⊕⊝ moderate1 Due to risk of bias |
Probably little or no effect on average haemoglobin |
| Formal tests of cognition | — | One trial reported that deworming had no effect, and the other that deworming reduces cognitive scores | Not pooled | 1361 (2 trials) | ⊕⊕⊝⊝ low1,2 due to risk of bias and indirectness |
There may be little or no effect on cognition |
| Physical well‐being | — | — | — | — (0 trials) |
— | We don't know if there is an effect on physical well‐being |
| School attendance | — | — | — | — (0 trials) |
— | We don't know if there is an effect on school attendance |
| *The basis for the assumed risk (eg the median control group risk across trials) is provided in footnotes. The corresponding risk (and its 95% CI) is based on the assumed risk in the comparison group and the relative effect of the intervention (and its 95% CI). CI: Confidence interval. | ||||||
| GRADE Working Group grades of evidence High quality: Further research is very unlikely to change our confidence in the estimate of effect. Moderate quality: Further research is likely to have an important impact on our confidence in the estimate of effect and may change the estimate. Low quality: Further research is very likely to have an important impact on our confidence in the estimate of effect and is likely to change the estimate. Very low quality: We are very uncertain about the estimate. | ||||||
1Downgraded by 1 for risk of bias: none of the trials were classified as having low risk of bias. 2Downgraded by 1 for indirectness: only two trials have assessed these outcomes and the results are not easily generalized to other settings. In the Philippines Solon 2003 reported deworming either had no effect or a negative effect on cognitive test scores, and in Vietnam Nga 2009 reported no difference detected. We could not combine data.
Background
Description of the condition
The three soil‐transmitted helminth (STH) infections, ascariasis (roundworm), trichuriasis (whipworm), and hookworm, are the main intestinal helminth infections in humans (Bethony 2006; de Silva 2003b). Specialists estimate that each type of infection causes between 600 to 800 million cases worldwide each year (de Silva 2003b; Hotez 2009), with more than a quarter of the world's population infected with one or more of the soil‐transmitted intestinal worms (Chan 1997). Estimates from 2003 suggest that global prevalence of STH infections is declining, with marked improvement in the Americas and Asia, but a static picture in sub‐Saharan Africa (de Silva 2003b). STH infections particularly affect children living in poverty, where inadequate sanitation, overcrowding, low levels of education, and lack of access to health care make them particularly susceptible (Bethony 2006; de Silva 2003b). In 1993, the World Bank ranked STH infection as a greater cause of ill health in children aged five to 15 years than any other infection (World Bank 1993), but there has been considerable variation in the quoted estimates of global burden (de Silva 2003b), which are currently being updated.
Policy makers are concerned that the long‐term effects of worm infestation impair childhood nutritional status, school performance, and long‐term cognitive development (Bethony 2006). It is thought that iron status may mediate these effects, since hookworm and whipworm disease are associated with iron‐deficiency anaemia (Crompton 2000; de Silva 2003a), and a fall in blood haemoglobin levels is associated with increasing intensity of infection (Crompton 2003). Furthermore, hookworm‐induced iron‐deficiency anaemia has been associated with decreased physical activity and worker productivity (Crompton 2003).
Worms are associated with malnutrition, impaired growth, and poor school performance. Roundworms obtain their nutrition from gastrointestinal contents. The association with malnutrition is possibly mediated through impaired fat digestion, reduced vitamin absorption (particularly vitamin A), and temporary lactose intolerance (WHO 2002). Whipworm infection has been associated with malnutrition, although the precise mechanism for this is unclear (Cappello 2004). Some suggest that the effects on nutrition are through appetite suppression, increased nutrient loss, and decreased nutrient absorption and utilization (de Silva 2003a; Stephenson 2000).
Roundworm, hookworm, and whipworm disease have all been associated with impaired growth in school children (de Silva 2003a). Observational trials have reported an association between worm infection and lower scores on tests of school performance (Kvalsvig 2003; Sakti 1999). In a multiple‐regression model based on cross‐sectional data, Sakti 1999 found that hookworm infection was associated with worse scores in six out of 14 cognitive tests in Indonesian school children. Severe whipworm (Trichuris dysentery syndrome) was associated with low intelligence quotient (IQ), school achievement, and cognitive function after a four‐year follow‐up of a specific group of Jamaican children with severe infection (Callender 1998).
While these associations would suggest potential benefits of deworming, the associations could equally be caused by the confounding factor of poverty. Even with adjustment for known confounding factors, residual confounding could be a problem. Furthermore, the causal link between chronic infection and impaired childhood development is extrapolated from the recorded improvement in these features after deworming (Bethony 2006). Hence, reliable randomized controlled trials (RCTs) are required to assess whether policies are effective. These can examine the effectiveness of treating worm infection in an individual, as evidence of efficacy, and treatment in schools or communities, as evidence of the effectiveness of programmes. The latter trials are ideally cluster‐RCTs, and thus able to detect any externalities (benefits to other children) accruing as a result of reduced transmission.
Description of the intervention
Public health interventions to reduce worm infection include improved sanitation and hygiene and drug therapy for populations or targeted groups in the community, often coupled with health education. The work of the Rockefeller Sanitary Commission in the early 1900s in the USA with a grant of USD 11 million in the Southern States was combined with efforts to improve schooling. This led to the belief that sanitary reform was needed alongside chemotherapeutic approaches to eradicate hookworm to rid children of lethargy and improve their health (Brown 1979; Horton 2003). In Japan, worms virtually disappeared over a 20‐year period after the Second World War; this has been credited to an integrated programme of sanitary reform combined with screening and treatment of positive cases (Horton 2003; Savioli 2002). A similar experience occurred in Korea (Savioli 2002). The current global decline in worm prevalence has been credited to economic development and deworming programmes (de Silva 2003b). The impact of the chemotherapeutic element is difficult to assess. In countries where an improvement in sanitation and hygiene has occurred as a component of economic growth, a parallel decline in the prevalence of soil‐transmitted helminths has occurred: for example, in Italy between 1965 and 1980, the trichuriasis prevalence dropped from 65% to less than 5% without control activity (Savioli 2002).
The World Health Organization (WHO) recommends periodic treatment with anthelminthic (deworming) medicines, without previous individual diagnosis to almost all children living in endemic areas. The WHO does not recommend individual screening, since the cost of screening is four to 10 times that of the treatment itself. Treatment is recommended once a year when the prevalence of STH infections in the community is over 20%, and twice a year when the prevalence of STH infections in the community exceeds 50% (WHO 2015). The strategy is to target drug treatment to at‐risk groups: pre‐school‐age children (between one and five years); school‐age children (between six and 15 years); and women of childbearing age. The strategy requires a population survey for prevalence and intensity of infection to determine the population worm burden. This determines the recommended frequency of treatment, updated in a WHO field manual in 2006 (WHO 2006b).
The policy promotes the use of schools, maternal and child health clinics, and vaccination campaigns to reach at‐risk groups. The WHO advocates school‐based programmes in particular, as it is easy to deliver medicines through teaching staff, with estimated costs varying from USD 0.05 to 0.65 per child per year for annual dosing (Savioli 2002; WHO 2002). In areas with a high prevalence, the current policy recommends treatment three times per year (WHO 2006b), based on modelling and reinfection prevalence trials. Following drug treatment, worm populations tend to return rapidly to pretreatment levels; with roundworm and whipworm this happens in less than a year (Anderson 1991). Anderson 1991 suggests that, in order to control morbidity in areas of endemic infection, targeted treatment should be repeated every three to four months for roundworm and whipworm, with longer intervals acceptable for longer‐lived species such as hookworm. The WHO recommends monitoring with a range of impact indicators, including prevalence and intensity, incidence, morbidity, and mortality (WHO 2010). The control programme is intended to reduce the worm burden in the 10% to 15% of children who are most heavily infected in a particular population and to keep it low through repeated treatments.
It has been argued that treating individuals in communities reduces transmission in the community as a whole (Anderson 1991), and that this can lead to health and schooling benefits for the whole population, including those who have not received deworming treatment (Bundy 2009). These 'spill over' effects, or externalities, are not captured in individually RCTs, since any benefit in the control group reduces the overall treatment effect. A cluster design is therefore required to identify these additional putative effects.
This Cochrane Review does not cover deworming and pregnancy (reviewed in Haider 2009).
How the intervention might work
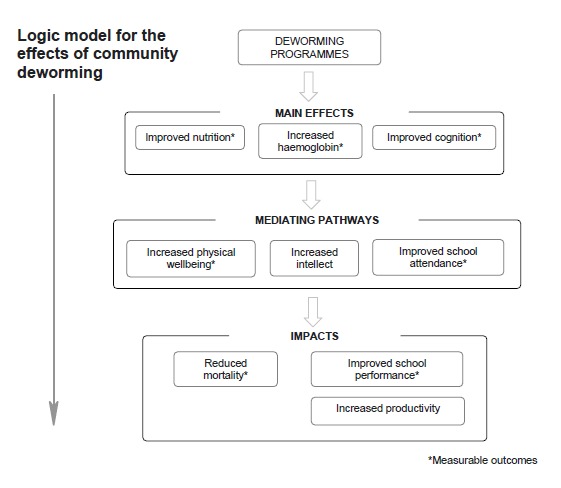
The rationale for the effects of deworming programmes on population development depend on the assumption that they improve nutrition, haemoglobin, and cognition. As a result of these benefits, children are thought to have increased physical well‐being, with improved intellect, and are better able to attend school. As a result, performance at school is enhanced, over the long‐term this benefits society as a whole, and reduces poverty (WHO 2005, WHO 2011). This is expressed in our conceptual framework (see Figure 1). The figure provides the basis for this review: the primary outcomes sought are the main effects (increased haemoglobin, nutrition, and improved cognition); measurable aspects of the mediating pathways (school attendance and physical well‐being); and measurable aspects of impact (mortality and school performance).
Figure 1.
In this review we include community trials that measure effects after a single dose of deworming drugs ('efficacy' measures in the individual), as well as trials of multiple doses with longer follow‐up periods. Multiple dose, cluster randomized trials with long follow‐up periods are the best measure of policy effectiveness since they are likely to detect externalities within schools and potential long term benefits.
Why it is important to do this review
The intended impacts of deworming programmes are clearly worthwhile goals and are heavily promoted by advocates in the field such as the WHO (Montresor 2002; WHO 2002; WHO 2006b; WHO 2011; WHO 2015), the World Bank (World Bank 2011), and the Bill & Melinda Gates Foundation (Hawkes 2013). Furthermore, deworming with albendazole was recently endorsed in the 2012 Copenhagen consensus statement, as the fourth highest ranking solution to address "big issues facing the planet" in terms of cost and benefit (Copenhagen Consensus Center 2012). The widely‐cited cost‐effectiveness estimates from the Disease Control Priorities in Developing Countries (DCP2) report (Jamison 2006) state that deworming for STH infections was one of the most cost‐effective interventions for global health. However, the reliability of these estimates has been questioned by the organization GiveWell, which suggests they have been overstated by a factor of about 100 (GiveWell 2011).
Advocates point to the favourable cost‐effectiveness estimates for deworming programmes, with a focus on the putative effect on schooling outcomes and productivity (Deworm the World 2012). The evidentiary basis for this draws on a range of trial designs, including historical econometric trials such as Bleakely 2004, which analysed the Rockefeller Sanitary Commission's campaign to eradicate hookworm in the Southern states of the USA. This showed an association between areas with higher levels of hookworm infection prior to the campaign and greater increases in school attendance and literacy after the intervention, and an association with income gains in the longer term. Another influential trial is Miguel 2004 (Cluster), which is included in this Cochrane Review.
Current policies have become even more challenging to assess, as global specialists conflate the evidence on different helminths. The WHO, for example, describes the benefits of treating all helminths, including schistosomiasis, filariasis, and STH infections. The WHO states that deworming treatment against schistosomes and STH infections helps (1) eradicate extreme poverty and hunger; (2) achieve universal primary education; (3) promote gender equality and empower women; (4) reduce child mortality and improve maternal health; and (5) combat HIV/AIDS, malaria, and other diseases (WHO 2005; WHO 2011). The evidence for the benefit of treating populations with schistosomiasis is fairly clear (Danso‐Appiah 2008), as the infection has a very substantive effect on health. However, this does not mean that a different drug treating a different helminth species is equally effective.
Despite the lack of rigour in considering the evidence for separate components of these policies, many countries are moving forward with large scale purchases of drugs. The current neglected tropical disease (NTD) policy focus has been on addressing 'polyparasitism' by treating the parasites that cause ascariasis, trichuriasis, hookworm, lymphatic filariasis, onchocerciasis, schistosomiasis, and trachoma with ivermectin, albendazole, azithromycin, and praziquantel (Hotez 2009). These four drugs are donated by pharmaceutical companies, and the 'overlapping specificity' would mean multiple pathogens would be targeted (Hotez 2006b). Thus, mass drug administration for NTDs is promoted as "one of the lowest cost and cost‐efficient mechanisms for both improving maternal child health and lifting the bottom billion out of poverty" (Hotez 2011b). Significant resources are being invested in this agenda, with the UK Department for International Development committing GBP 50 million in 2008, and the US government committing USD 65 million in 2010 as part of the US Global Health Initiative (Hotez 2011a).
Given the amount of investment of public money in these programmes, it is important to be clear whether mass or targeted drug administration is able to contribute to health and development in such a substantive way. Indeed, international donors and developed country governments and tax payers are contributing to the efforts to tackle STH infections in the belief that they will improve the health of children in the way that the WHO claims (WHO 2005). For example, Deworm the World has worked with the Indian Government to treat 140 million children across India in 2015 on the basis of the Copenhagen Consensus Statement (Evidence Action 2015; Mudur 2015).
Thus, this systematic review of reliable evidence from RCTs will help clarify whether existing evidence supports the conclusion that there is an impact of these drugs in populations with STH infections (ascariasis, trichuriasis, and hookworm) and will evaluate the strength of the evidence.
History of this Cochrane Review
Previous editions of this Cochrane Review (Dickson 2000a; Dickson 2000b; Taylor‐Robinson 2007; Taylor‐Robinson 2012) have generated considerable debate (Hawkes 2013; Hilton 2012; Savioli 2000).
Early on the debate was around medical outcomes, such as anaemia. More recently there has been a shift in focus from short‐term impacts of deworming to potential longer‐term developmental impacts (Figure 1). Indeed, Givewell suggests that the most compelling case for deworming as a cost‐effective intervention comes from "the possibility that deworming children has a subtle, lasting impact on their [children's] development, and thus on their ability to be productive and successful throughout life", but further comments that "empirical evidence on this matter is very limited" (Givewell 2014). There have been some recent observational analyses with long‐term follow‐up of dewormed children which were considered during this update. None of these trials met the inclusion criteria of this review (Baird 2011; Croke 2014; Ozier 2011; described in the Characteristics of excluded studies section).
Important new trials have been published. The DEVTA trial of over one million children was completed in 2005 and published in 2013 (Awasthi 2013 (Cluster). A second important trial with a manuscript date of 2006 of over 2500 children remains unpublished, but we have included it in this review (Hall 2006 (Cluster).
The development organization 3ie recently commissioned the replication of the influential econometric trial from Kenya (Miguel 2004 (Cluster). We highlighted concerns about the quality of the evidence for school attendance on the basis of this trial in the previous version of this Cochrane Review (Taylor‐Robinson 2012). The replication was published recently (Aiken 2014; Aiken 2015; Davey 2015). The authors checked the data and corrected any errors, and then carried out an analysis using exactly the methods in the original publication. The replication highlights important coding errors and this resulted in a number of changes to the results: the previously reported effect on anaemia disappeared; the effect on school attendance was similar to the original analysis, although the effect was seen in both children that received the drug and those that did not; and the indirect effects (externalities) of the intervention on adjacent schools disappeared (Aiken 2015). The statistical replication suggested some impact of the complex intervention (deworming and health promotion) on school attendance, but this varied depending on the analysis strategy, and there was a high risk of bias. The replication showed no effect on exam performance (Davey 2015).
In the light of the publication of the DEVTA trial of over one million children, the replication trials of the Kenya trial, the new longer term follow‐up trials, and four new RCTs, we updated Taylor‐Robinson 2012. We have added new trials and data, restructured the analysis, and updated the GRADE assessment of the quality of the evidence.
Objectives
To summarize the effects of giving deworming drugs to children to treat soil‐transmitted intestinal worms on weight, haemoglobin, and cognition; and the evidence of impact on physical well‐being, school attendance, school performance, and mortality.
Methods
Criteria for considering studies for this review
Types of studies
RCTs and quasi‐RCTs. We included cluster‐RCTs, provided more than two clusters were allocated to each treatment arm.
Types of participants
Infected children identified by screening in community trials.
All children must have lived in endemic areas.
We defined children as aged under 16 years. We excluded trials of sick children or children being treated for malnutrition.
Types of interventions
Intervention
Deworming drugs for soil‐transmitted helminths, administered at any location (including health facilities, schools, and communities). We included trials examining effects after a single dose and after multiple doses.
The deworming drugs we included are those in the WHO Model List of Essential Medicines for deworming drugs of soil‐transmitted helminths (WHO 2006a). This includes albendazole, levamisole, mebendazole, pyrantel, and ivermectin. Other drugs used are nitazoxanide, piperazine, tetrachlorethylene, and thiabendazole.
We did not exclude trials that also provided some health promotion activities supporting the deworming programmes. Studies that provided additional interventions (eg growth monitoring, micronutrient supplementation, malaria chemoprevention, or other drugs) were included when the additional intervention was given to both the control and intervention arm.
Control
Placebo or no treatment.
Types of outcome measures
Primary outcomes
Weight;
Haemoglobin;
Formal tests of cognition.
Secondary outcomes
-
Other nutritional indicators:
Height
Mid‐upper arm circumference (MUAC)
Skin fold thickness (including triceps and subscapular skin fold)
Body mass index;
Measures of physical well‐being (eg Harvard Step Test);
-
School attendance:
Days present at school
Number of children dropping out;
School performance (measured by examination results);
Death.
Adverse events
Serious adverse events (death, life‐threatening events, or events leading to hospitalization);
Other adverse events.
Search methods for identification of studies
Electronic searches
The review authors and the Cochrane Infectious Diseases Group (CIDG) Information Specialist, Vittoria Lutje, attempted to identify all relevant trials regardless of language or publication status (published, unpublished, in press, and in progress). The date of the last search was 14 April 2015. The Information Specialist searched the following databases using the search terms and strategy described in Table 11: CIDG Specialized Register (14 April 2015); Cochrane Central Register of Controlled Trials (CENTRAL), published in the Cochrane Library (2015, Issue 4); MEDLINE (2000 to 14 April 2015); EMBASE (2000 to 14 April 2015); and LILACS (2000 to 14 April 2015); and reference lists, and registers of ongoing and completed trials. We also searched the metaRegister of Controlled Trials (mRCT) using 'helminth* OR anthelminth*' (14 April 2015).
Table 1.
Detailed search strategies
| Search set | CIDG SRa | CENTRAL | MEDLINEb | EMBASEb | LILACSb |
| 1 | helmint* | helmint* | helmint* | helmint$ | helmint* |
| 2 | Ancylostoma duodenale | Ancylostoma duodenale | Ancylostoma duodenale | Ancylostoma duodenale | Ancylostoma duodenale |
| 3 | Necator americanus | Necator americanus | Necator americanus | Necator americanus | Necator americanus |
| 4 | Ascaris | Ascaris | Ascaris | Ascaris | Ascaris |
| 5 | Enterobius vermicularis | Enterobius vermicularis | Enterobius vermicularis | Enterobius vermicularis | Enterobius vermicularis |
| 6 | trichuris | trichuris | trichuris | trichuris | trichuris |
| 7 | Strongyloid* | Strongyloid* | Strongyloid* | Strongyloid* | Strongyloid* |
| 8 | albendazole | hookworm* | hookworm* | hookworm$ | 1‐7/OR |
| 9 | mebendazole | roundworm* | roundworm* | roundworm$ | albendazole |
| 10 | piperazine | pinworm* | pinworm* | pinworm$ | mebendazole |
| 11 | levamisole | whipworm* | whipworm* | whipworm$ | piperazine |
| 12 | pyrantel | 1‐11/OR | 1‐11/OR | 1‐11/OR | levamisole |
| 13 | tiabendazole | albendazole | albendazole | albendazole | pyrantel |
| 14 | — | mebendazole | mebendazole | mebendazole | tiabendazole |
| 15 | — | piperazine | piperazine | piperazine | 9‐14/OR |
| 16 | — | levamisole | levamisole | levamisole | 8 and 15 |
| 17 | — | pyrantel | pyrantel | pyrantel | Limit 16 to human |
| 18 | — | tiabendazole | tiabendazole | tiabendazole | — |
| 19 | — | 13 or 14 or 15 or 16 or 17 or 18 | 13 or 14 or 15 or 16 or 17 or 18 | 13 or 14 or 15 or 16 or 17 or 18 | — |
| 20 | — | 12 and 19 | 12 and 19 | 12 and 19 | — |
| 21 | — | — | Limit 20 to human | Limit 20 to human | — |
aCIDG Specialized Register. bSearch terms used in combination with the search strategy for retrieving trials developed by Cochrane (Lefebvre 2011).
Data collection and analysis
Selection of studies
David Taylor‐Robinson (DTR) checked the search results for potentially relevant trials and retrieved full articles as required. DTR and Paul Garner (PG) independently assessed the trial eligibility using an eligibility form based on the inclusion criteria; where there was uncertainty, all five review authors participated in the decision about inclusion. We checked that trials with multiple publications were managed as one trial. We recorded reasons for the exclusion of trials and we contacted authors of unpublished trials for information on when they intended to publish their results.
Data extraction and management
Nicola Maayan (NM), DTR, Sarah Donegan (SD), and Karla Soares‐Weiser (KSW) independently extracted data using data extraction forms. PG extracted and cross‐checked the data from a selection of papers. We resolved any differences in opinion by discussion. Where methods, data, or analyses were unclear or missing, we contacted trial authors for further details.
We extracted data on type of additional interventions (eg accompanying health promotion programme including programmes about hygiene and behaviour, water and sanitation; drug; or vitamin) and how this was delivered (mass media, community, or one‐to‐one); and whether these interventions were in both intervention and control groups, or only in the intervention group.
For each treatment group of each trial, we extracted the number of patients randomized. For each outcome of interest, we extracted the number of participants analysed in each treatment group of each trial.
RCTs that randomized individuals
For dichotomous outcomes, we planned to extract the number of patients with the event. For continuous outcomes, we aimed to extract means and standard deviations (SDs). Where these data were not reported, we extracted medians and ranges or any other summary statistics. Where change from baseline results were presented alongside results purely based on the end value, we only extracted the change from baseline results.
RCTs that randomized clusters
For each cluster‐RCT, we extracted the cluster unit, the number of clusters in the trial, the average size of clusters, and the unit of randomization (such as household or institution). Where possible, we extracted the statistical methods used to analyse the trial along with details describing whether these methods adjusted for clustering or other covariates.
Where a cluster‐RCT adjusted for clustering in their analysis, we extracted the cluster adjusted results. When the trial did not account for clustering in their analysis, we extracted the same data as for trials that randomize individuals.
For the analysis of Awasthi 1995 (Cluster) we took weight from the publication by Awasthi in 2008; height data from INCLEN 1995 monograph (references contained in the main reference). Means of cluster means were used in analysis; details of correspondence from previous review suggest that trial was ongoing; data for 3‐year follow‐up are provided from R. Dickson's correspondence with the author for the Dickson 2000a Cochrane Review, but the loss to follow up is very high: only 24% analysed.
Replication
One included trial, Miguel 2004 (Cluster), has been the subject of an independent re‐analysis, with a full report published on the 3ie website (Aiken 2014), which also includes a response from the authors (3ie 2014); and two subsequent academic papers (Aiken 2015; Davey 2015). In this edition of the Cochrane Review we used new information on conduct of the trial, on the thorough evaluation for potential biases, and also corrected data from the replication, including the measure of variance for school attendance (Aiken 2014).
Assessment of risk of bias in included studies
DTR, PG, NM, SD, and KSW independently assessed the risk of bias (Higgins 2011b). We resolved any differences through discussion. On occasion, we corresponded with trial investigators when methods were unclear.
For RCTs that randomized individuals we addressed six components: sequence generation; allocation concealment; blinding; incomplete outcome data; selective outcome reporting; and other biases. For cluster‐RCTs, we addressed additional components: recruitment bias; baseline imbalance; loss of clusters; incorrect analysis; compatibility with RCTs randomized by individual. For each component, we placed judgments of low, high, or unclear/unknown risk of bias as described in Appendix 1. We displayed the results in 'Risk of bias' tables, a 'Risk of bias' summary, and a 'Risk of bias' graph.
Measures of treatment effect
We summarized continuous data (means and SDs) using the mean differences (MDs). We planned to use the risk ratio to compare the treatment and control groups for dichotomous outcomes. All treatment effects were presented with 95% confidence intervals (CIs).
Unit of analysis issues
For a particular cluster‐RCT when the analyses had not been adjusted for clustering, we attempted to adjust the results for clustering by estimating the design effect calculated as 1+(m‐1)*ICC where m is the average cluster size and ICC is the intra‐cluster correlation coefficient. To make the adjustment, we estimated a treatment effect that did not adjust for clustering and then multiplied the standard errors of the estimate by the square root of the design effect. When the true ICC was unknown, we estimated it from other included cluster‐RCTs.
Dealing with missing data
We aimed to conduct a complete‐case analysis in this Cochrane Review, such that all patients with a recorded outcome were included in the analysis.
Assessment of heterogeneity
We inspected the forest plots to detect overlapping CIs, applied the Chi² test with a P value of 0.10 used to indicate statistical significance, and also implemented the I² statistic with values of 30 to 60%, 59 to 90%, and 75 to 100% used to denote moderate, substantial, and considerable levels of heterogeneity, respectively.
Assessment of reporting biases
We decided not to construct funnel plots to look for evidence of publication bias because there were a limited number of trials in each analysis.
Data synthesis
DTR, NM, and SD analysed data with Review Manager 5.3. We structured the analysis into four sections
Infected children‐first dose.
Infected children‐multiple dose.
All children living in an endemic area‐first dose.
All children living in an endemic area‐multiple doses, longest follow up.
For trials involving children living in an endemic area, trials were also grouped by prevalence and intensity (high/moderate/low). High prevalence or high intensity areas are referred to as 'high prevalence'; moderate prevalence and low intensity are referred to as 'moderate prevalence'; and low prevalence with low intensity are referred to as 'low prevalence'. We used the WHO technical guidelines classification (WHO 2002; Table 12), rather than the simplified prevalence based field guide categories that are now used to determine treatment frequency (WHO 2006b; Table 12). In trials where information on intensity was not provided, we estimated the community category on the basis of quoted prevalence; it is possible that the community category has been underestimated in these trials.
Table 2.
Community diagnosis categories and recommended treatment strategies
| Community category (WHO 2002) | Prevalencea | Percentageb | School intervention |
| 1. High prevalence or high intensity | > 70% | > 10% | Targeted treatment of school‐age children 2 to 3 times per year |
| 2. Moderate prevalence and low intensity | > 50% but < 70% | < 10% | Targeted treatment of school‐age children once per year |
| 3. Low prevalence and low intensity | < 50% | < 10% | Selective treatment |
| Category (WHO 2006b) | Prevalencea | Action to be taken | |
| High risk community | > 50% | Targeted treatment of pre‐school and school‐age children 2 or 3 times per year | |
| Low risk community | > 20% but < 50% | Targeted treatment of pre‐school and school‐age children once per year |
aOf any worm infection. bOf moderate to heavy infections.
When a trial reported data at multiple time points we included data collected at the longest follow‐up time in the analysis of 'after multiple doses', because long term outcomes of multiple doses of deworming are of most relevance to policymakers, and short‐term effects are captured in the single dose results. This decision was supported by findings from an exploratory meta‐regression analysis that was applied to find out whether the intervention effect was modified by the length of follow‐up (see below).
We combined cluster‐RCTs that adjusted for clustering and RCTs that randomized individuals using meta‐analysis. We used a fixed‐effect meta‐analysis when the assessments of heterogeneity did not reveal heterogeneity. In the presence of heterogeneity, we used random‐effects meta‐analysis.
For continuous data, we combined change from baseline results with end value results providing they were from distinct trials (Cochrane Collaboration 2011; Higgins 2011a). Labels on the meta‐analyses indicate when end values were used.
We presented data that could not be meta‐analysed in additional tables and reported on these in each section, under the heading 'other data'.
Subgroup analysis and investigation of heterogeneity
In the presence of statistically significant heterogeneity, we planned to explore the following potential sources using subgroup analyses: age group (< five years vs ≥ five years); manufacturer; treatment setting (community, school, health post, hospital). We did not carry out these analyses because there were too few trials in the analyses.
To find out whether the intervention effect was modified by the length of follow‐up, SD and DTR performed a random‐effects meta‐regression for the outcome weight (in all children in an endemic area after multiple doses), with length of follow‐up in months as a covariate using the 'metafor' package in R. The covariate was centred at its mean.
We also sorted the forest plot for weight (in all children in an endemic area after multiple doses) by year that the trial was carried out to visually inspect whether the intervention effect changed over time.
Sensitivity analysis
We carried out sensitivity analyses including only those trials with a low risk of bias regarding allocation concealment.
'Summary of findings' tables
We interpreted results using 'Summary of findings' tables, which provide key information about the quality of evidence for the included trials in the comparison, the magnitude of effect of the interventions examined, and the sum of available data on the main outcomes. Using GRADE profiler (GRADEpro 2014), we imported data from Review Manager 5.3; the GRADE display was based on a recent trial of what users prefer (Carrasco‐Labra 2015). We presented the primary outcomes for the review in the 'Summary of findings' tables, and added height, school attendance, and death for multiple dose trials.
Results
Description of studies
We identified 45 trials reported in 64 articles that met the inclusion criteria (see Figure 2, Characteristics of included studies and Appendix 2). For a trial completed in 2006 but never published, the trial authors provided a manuscript with data we were able to use (Hall 2006 (Cluster)). For Alderman 2006 (Cluster), the trial authors did not adjust the CIs to take into account clustering for the primary outcome. For this Cochrane Review, we used the corrected values supplied by the trial author.
Figure 2.
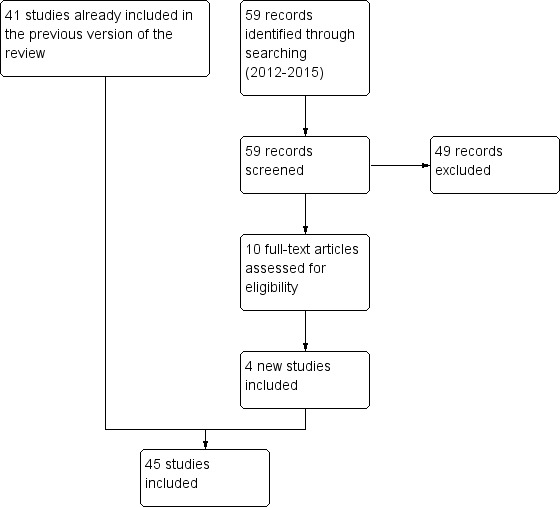
Study flow diagram.
We excluded 40 trials (see Characteristics of excluded studies), and one trial is ongoing (see Characteristics of ongoing studies).
Location
The included trials were undertaken in 23 different countries: Bangladesh (four trials); China (two trials); Ethiopia (two trials); Haiti (two trials); India (five trials); Indonesia (four trials); Jamaica (two trials); Kenya (five trials); Malaysia (two trials); Phillipines (two trials); South Africa (two trials); Uganda (two trials); Vietnam (three trials); Zanzibar (two trials); Benin, Botswana, Cameroon, Guatemala, Nigeria, Sierra Leone, Tanzania, Zaire (one trial in each); China, Philippines and Kenya; China and Myanmar (multi‐centre trials).
Population
Children were recruited from school populations in 26 trials, communities in 12 trials, and in health facilities or by health workers in seven trials. One of these trials recruited children on discharge from hospital (Donnen 1998) and another recruited children whose mothers had participated in the pregnancy phase of the trial (Ndibazza 2012). Olds 1999 and Wiria 2013 (Cluster) also included adolescents 17 to 19 years old, but most participants were under 16 years old.
Thirty‐seven trials were based on mass targeted treatment of an unscreened population. Eight trials studied children who were screened and selected on the basis of their having high worm loads and the purpose of three of these trials was to measure cognitive outcomes. One trial of unscreened children, Stephenson 1993, also studied an infected subgroup of the larger unscreened trial population for cognitive and haemoglobin outcomes. Fifteen trials were conducted in populations where worms were of high prevalence or intensity (community category 1), 12 in populations with moderate prevalence and low intensity (category 2), and 10 in populations with low prevalence and low intensity (category 3).
Interventions
Albendazole
Twenty‐eight trials had albendazole only in one treatment arm; in addition, some of these trials had arms with combinations with albendazole and: praziquantel (Olds 1999); ivermectin (Beach 1999); and diethylcarbamazine (Fox 2005); the additional drugs were also given to children in the control arms.
One trial included Giardia treatment, secnidazole, in both intervention and control arms (Goto 2009).
One trial was a deworming programme that included deworming drugs for STHs, praziquantel to treat schistosomiasis in schools with > 30% prevalence, and health promotion interventions (Miguel 2004 (Cluster)).
Other anthelminthic drugs
Seven trials used mebendazole; and two trials used mebendazole in combination with pyrantel. Other deworming drugs used included pyrantel pamoate, piperazine, piperazine citrate, tetrachloroethylene, and levamisole.
Accompanying health promotion activities
Nine trials reported on a range of child health activities (Table 13). In eight trials, the accompanying activities appeared to be applied to both intervention and control arms.
Table 3.
Accompanying health promotion activities
| Accompanying intervention | Details from trial | Trials |
| To both intervention and control | "The AWC workers, usually local women (plus assistants), give pre‐school education, give nutritional supplements to malnourished children, and record births and pre‐school deaths." | Awasthi 2013 (Cluster) |
| "The parents of all children aged < 7 years were offered a range of health services at child health days, including vaccinations, vitamin A supplements, growth monitoring and promotion, and demonstrations of complementary feeding." | Alderman 2006 (Cluster) | |
| "The primary job responsibilities of the AWW [anganwadi worker] are to run a creche and provide primary health care and supplementary nutrition for children < six years of age and pregnant and lactating women." | Awasthi 2001 (Cluster) | |
| All children received 10 mL of multivitamins (over two days) as an incentive at each time point. Each 5 mL of multivitamin contained: Vitamin A 3000 IU, Vitamin B2 2.0 mg, Nicotinamide 15.0 mg, Vitamin B1 1.5 mg, Vitamin B6 2.0 mg, Vitamin D2 400 IU, D panthenol 1.0 mg. | Kirwan 2010 | |
| Children attended a mother and child health clinic | Freij 1979a | |
| Children in both groups received treatment for other conditions in accordance with the IMCI guidelines. | Garg 2002 | |
| Children were followed up for routine immunisations, and then quarterly, to age 5 years. Children received BCG and oral polio immunisations at birth, polio, diphtheria, pertussis, tetanus, hepatitis B and Haemophilus influenzae type B immunisations at 6, 10 and 14 weeks, and measles immunisation at 9 months. | Ndibazza 2012 | |
| Three schools received fortified soup with 20 mg elemental iron per portion, and 100 mg vitamin C per portion for 6 months. | Kruger 1996 | |
| Only in the intervention group | Treatment schools received worm prevention education through regular public health lectures, wall charts, and the training of teachers in each treatment school on worm prevention. Health education stressed the importance of hand washing to avoid ingesting roundworm and whipworm larvae, wearing shoes to avoid hookworm infection, and not swimming in infected fresh water to avoid schistosomiasis. | Miguel 2004 (Cluster) |
| No additional intervention reported | — | 37 trials |
One trial had a comprehensive health promotion programme accompanying the deworming, including regular public health lectures, teacher training, and health education targeted to avoid intestinal helminths and exposure to schistosomiasis (Miguel 2004 (Cluster).
Control groups
Most trials used placebo or no treatment as a control. Others used vitamin A, vitamin C, or calcium powder.
There were 13 trials where both the treatment and control group received nutritional supplementation: multi‐nutrient, vitamin B, iron, vitamin A, or child health packages, including growth monitoring and health education (Table 13).
Trial design
Nine trials were cluster randomized, including one trial with quasi‐random allocation of the 75 clusters (Miguel 2004 (Cluster)). The rest used the individual as the unit of randomization.
Six of the nine cluster‐RCTs used an appropriate method to take clustering into account. Awasthi 2001 (Cluster) and Awasthi 1995 (Cluster) used urban slums as the unit of randomization (50 and 124 respectively), and Awasthi 2013 (Cluster) used 72 rural administrative blocks. These three trials were analysed at the cluster level (mean of cluster mean values and associated SDs). Stoltzfus 1997 (Cluster) randomized 12 schools and adjusted for within‐school correlations using generalized estimating equations. Miguel 2004 (Cluster) adjusted for clustering in their regression estimates, and presented robust standard errors. Wiria 2013 (Cluster) randomized 954 households and used generalised linear mixed‐effects models that captured the data correlations induced by clustering within households.
The three remaining cluster‐RCTs did not adjust for clustering:
Alderman 2006 (Cluster) had not adjusted the primary outcome for clustering in this trial of 48 parishes containing 27,955 children in total. Upon request, the trial authors provided the adjusted values which we have used in the analysis;
Hall 2006 (Cluster) had 80 units of randomization (schools) containing 2659 children in total. The report presents some regression modelling that adjusts for the cluster design, but the outcomes by randomized comparison do not appear to have been adjusted. We used the ICC calculated from the Alderman 2006 (Cluster) data to adjust the primary weight outcome for inclusion in meta‐analysis. As the average cluster size for Hall 2006 (Cluster) (ie 33 children) differed somewhat from that of Alderman 2006 (Cluster) (ie 582 children), the true ICC for Hall 2006 (Cluster) may be different to that of Alderman 2006 (Cluster), therefore the adjusted result for weight is merely an approximation;
Rousham 1994 (Cluster) had 13 units of randomization (villages) containing 1476 children in total and had also not adjusted for clustering, but no outcomes from this trial were suitable for meta‐analysis.
Four trials had a factorial design. Awasthi 2013 (Cluster) randomized clusters to usual care, six‐monthly vitamin A, six‐monthly 400 mg albendazole, and both vitamin A and albendazole. Kruger 1996 randomized individual participants to albendazole or placebo, and, also, three of the five schools in the trial received soup fortified with vitamins and iron, and two received unfortified soup. Le Huong 2007 randomized individual participants to iron‐fortified noodles and mebendazole, noodles without iron fortification and mebendazole, iron‐fortified noodles and placebo, noodles without iron fortification and placebo, and iron supplementation and mebendazole. Stoltzfus 2001 randomized households to iron, with random allocation of mebendazole by child, stratified by iron allocation and age grouped households; disaggregated data for each treatment allocation group was not provided for each outcome.
Follow‐up periods for the trials that used a single dose ranged from one to 21 months, while the follow‐up periods for trials that used multiple doses ranged from post‐intervention to five years.
Miguel 2004 (Cluster) is an cluster quasi‐randomized stepped‐wedge trial of a combined education and drug‐treatment intervention. The trial included 75 schools with a total of 30,000 pupils enrolled. In addition to helminth treatment, the phased complex intervention included public health lectures, teacher education, and child health education including handwashing, as noted above. In addition, a number of schools in the trial were also mass treated for schistosomiasis. In our previous update of the review we identified two potential quasi‐randomized comparisons that provide unbiased estimates, one in 1998 and one in 1999, in the stepped‐wedge design. Since our last review update this trial has been the subject of an independent reanalysis, with a full report published on the 3ie website (Aiken 2014), and two subsequent academic papers (Aiken 2015; Davey 2015). In this review update we used data from these sources to assess the methodological quality of the trial. The results are primarily draw from the replication report, Aiken 2014, which provides estimates corrected for coding errors in the original paper.
Outcome measures
Nutritional status
Forty‐six trials measured nutritional indicators. Some trials reported absolute values, or changes in absolute values of weight and height (or other anthropometric measures). Many trials presented anthropometric data in terms of z‐scores or percentiles of weight‐for‐age, weight‐for‐height, and height‐for‐age, and compared the trial results to an external reference. Sometimes these values were dichotomised and presented as the prevalence of underweight, stunting or wasting (defined as ‐2 SD z‐scores). The external standard was usually quoted as the National Centre for Health Statistics (NCHS) standard, but a variety of references were quoted (including anthropometric computer packages or country standards). These data have not been used in the meta‐analyses as the results were already incorporated in the values for weight and height. Furthermore, in some trials, outcome data were not reported or were incomplete and could not be used in meta‐analysis. A number of reports did not provide summary outcome data for each trial arm, and the results were reported in terms of regression modelling outcomes or subgroup analyses. We have described the results of these trials in Table 14.
Table 4.
Data not included in meta‐analysis
| Infected children identified by screening ‐ single dose | |
| Nokes 1992 Albendazole | Growth measured but not reported: 9 weeks cited as too short a follow‐up period to demonstrate a change. |
|
Tee 2013 Albendazole |
No significant differences in median change in weight and weight‐for‐height z‐scores, and for mean change in weight‐for‐age, and height‐for‐age z‐scores at 12 months follow‐up. Weight: Median change in weight at follow‐up in treatment group 2.6 (range 1.2 to 7.2) and control group 2.5 (range 1.2 to 6.6) Height‐for‐age z‐score: Mean change at follow‐up in treatment group 1.1 (0.2) and in control group 1.1 (0.2). Weight‐for‐age z‐score: Median change at follow‐up in treatment group ‐1.0 (range 0.6 to 2.3) and in control group 0.8 (range 0.5 to 1.6). Weight‐for‐height z‐score: Mean change at follow‐up in treatment group 0.5 (0.6) and in control group 0.1 (0.6). |
|
Yap 2014 Albendazole |
No significant differences in percentage stunted and sum of skinfolds at 6 months follow‐up. Percentage stunted (≤ ‐2 HAZ score): Mean at follow‐up in treatment group 66% (mean change from baseline ‐7.0) and in control group 69% (mean change from baseline ‐7.4). Sum of skinfolds: Mean at follow‐up in treatment group 12 mm (mean change from baseline 1 mm) and in control group 12 mm (mean change from baseline 1 mm). |
| Infected children identified by screening ‐ multiple dose | |
| Simeon 1995 Albendazole | No significant difference in any reported outcome for whole group. Height‐for‐age z‐score at baseline in treatment group ‐0.48 (0.95) and in placebo group ‐0.39 (0.90). At follow‐up in treatment group ‐0.48 (0.97) and in placebo group ‐0.41 (0.89). Body mass index (kg/m²) at baseline in treatment group 15.3 (1.3) and in placebo group 15.5 (1.3). At follow‐up in treatment group 15.6 (1.3) and in placebo group 15.8 (1.4). |
| All children living in endemic area‐ single dose | |
| Beach 1999 Albendazole |
A nutritional benefit of treatment was not detectable after 4 months for the entire trial population (853 participants, no figures provided). Stratification by infection demonstrated small positive effects in the treatment group for some anthropometric outcomes. In Ascaris‐infected children (51), height gain was 0.62 cm > placebo in the combination treatment group (P = 0.01) at 4 months. In Trichuris‐infected children (158), weight gain was 0.56 kg > placebo in the combination treatment group (P = 0.01) at 4 months. |
| Fox 2005 Albendazole |
No results provided for whole trial population. Results for height and weight only presented in the narrative for subgroups infected with hookworm and Ascaris: no significant anthropometric changes detected (no figures quoted). In those infected with Trichuris, weight gain was greater in the albendazole group (difference compared to placebo 0.28 kg, P = 0.038). Adverse events: no serious adverse events (albendazole 0/46 vs placebo 0/43). Myalgia and cough were reported significantly more frequently in the placebo group compared to albendazole. |
| Greenberg 1981 Piperazine citrate |
Treatment group tended to show worse nutrition than placebo. Comparison showed no significant difference for all measured anthropometric variables for the total group and for subgroups defined by severity of infection (no figures provided). |
| Kloetzel 1982 Mebendazole |
No significant difference was found between the groups. Results reported as the proportion of treatment or control group that improved, deteriorated, or experienced no change. Unclear which anthropological measures were used in this categorization process. Proportions in each category were not significantly different between trial arms (improved: 51% in mebendazole group vs 49% in control; deteriorated: 35% in mebendazole group vs 33% in control; no change: 14% in mebendazole group vs 18% in control; no significance test results quoted). |
| Koroma 1996 Albendazole | Significant increases in weight‐for‐height, weight‐for‐age, and height‐for‐age z‐scores recorded in rural and urban treatment groups at 6 months. Mean increase in rural treatment group compared to placebo: weight‐for‐height z‐score 0.28 (SE 0.17) P < 0.05; weight‐for‐age z‐score 1.04 (SE 0.03) P < 0.05; and height‐for‐age z‐score 0.83 (SE 0.03) P < 0.001. Mean increase in urban treatment group compared to placebo: weight‐for‐height z‐score 1.04 (SE 0.07) P < 0.05; weight‐for‐age z‐score 1.02 (SE 0.09) P < 0.001; and height‐for‐age z‐score 1.01 (SE 0.02) P <0.05. |
| Michaelsen 1985 Tetra‐chlorethylene |
No significant difference in change in mean for haemoglobin. (tetrachloroethylene 0.22 g/100 mL vs placebo 0.09 g/100 mL; quoted as non‐significant) or weight for height at 5 months (tetrachloroethylene ‐1.3% of WHO reference mean vs placebo ‐0.4%; quoted as non‐significant). Adverse events: 17% (19/119: results not given for separate trial arms) of the children suffered adverse effects (nausea and ataxia) that began one and a half hours after treatment. All symptoms disappeared within four hours. Tetrachlorethylene is not in current use as a deworming drug. |
|
Nga 2009 Albendazole |
No significant differences in weight‐for‐height, weight‐for‐age, and height‐for‐age z‐scores and skin fold thickness at 4 months. There was no statistically significant effect of deworming on weight, height, HAZ scores, WAZ scores, or WHZ scores. There were no statistically significant differences in skin fold thickness after four months of intervention. |
|
Wiria 2013 (Cluster) Albendazole |
No adverse events reported. No significant difference in BMI at 21 months follow‐up in children aged 19 years and less. Body mass index (kg/m2): median at follow‐up in treatment group 21.56 (IQR 19.44‐24.12) and in placebo group 22.42 (IQR 19.68 ‐ 25.56). |
| All children living in endemic area ‐ multiple dose | |
|
Awasthi 1995 (Cluster) Albendazole |
During the trial there were 23 deaths, 13 were in the usual care arm and 10 were in the treatment arm. These data were not adjusted for cluster randomization. |
|
Awasthi 2013 (Cluster) Albendazole |
Deworming showed no effect for death MD in deaths per child‐care centre at ages 1·0–6·0 was 0·16 (SE 0·11); mortality ratio 0·95, 95% CI 0·89 to 1·02). |
| Goto 2009 Albendazole plus secnidazole | No significant differences in mean z‐scores or prevalence of stunting, underweight or wasting between the intervention groups were found, and the changes between intervals (eg between weeks 0 to 12, 0 to 24, 0 to 36, 12 to 24, etc.) did not differ significantly between groups. Height‐for‐age z‐score: at baseline in treatment group ‐1.08 (1.02) and in control group ‐1.21 (1.0). At follow‐up in treatment group ‐1.59 (0.93) and in control group ‐1.70 (0.93). Weight‐for‐age z‐score: at baseline in treatment group ‐1.91 (1.15) and in control group ‐1.85 (1.14). At follow‐up in treatment group ‐2.62 (1.17) and in control group ‐2.59 (1.17). Weight‐for‐height z‐score: at baseline in treatment group ‐1.25 (1.18) and in control group ‐0.96 (1.17). At follow‐up in treatment group ‐1.55 (1.07) and in control group ‐1.83 (1.06). |
| Hadju 1997 Pyrantel pamoate Albendazole | No significant differences detected between treatment groups on basis of multivariate analyses controlling for age, sex, and ‘times’. Change in weight‐for‐age z‐score: placebo 0.02; pyrantel 1 x treatment 0.03; pyrantel 2 x treatments 0.08; albendazole 1 x treatment ‐0.10; albendazole 2 x treatments 0.01. Change in height‐for‐age z‐score: placebo 0.01; pyrantel 1 x treatment 0.00; pyrantel 2 x treatments 0.04; albendazole 1 x treatment ‐0.07; albendazole 2 x treatments 0.01. Change in weight‐for‐height z‐score: placebo 0.02; pyrantel 1 x treatment 0.08; pyrantel 2 x treatments 0.05; albendazole 1 x treatment ‐0.07; albendazole 2 x treatments 0.03. Change mid‐arm circumference z‐score: placebo ‐0.09; pyrantel 1 x treatment ‐0.11; pyrantel 2 x treatments ‐0.11; albendazole 1 x treatment ‐0.07; albendazole 2 x treatments ‐0.01. |
| Hall 2006 (Cluster) Albendazole |
Trial authors reported no difference in final and change in height. MUAC and subscapular skinfold thickness improved significantly in the control group compared to the albendazole group (7.87 vs 7.61, P = 0.005 and 1.22 vs 1.05, P = 0.005 respectively). These results do not appear to have been adjusted for cluster randomization. The results that show no effect, however, will not remain non‐significant even after appropriate adjustment, though the CIs may change. |
| Lai 1995 Mebendazole plus pyrantel | No difference in height or weight between treatment and control group at the end of 2‐year follow‐up. SDs not provided. Results stratified for males and females: Females: change in height in treatment arm 12.2 cm vs change in height in placebo arm 12.4 cm; change in weight in treatment arm 5.6 kg vs change in weight in placebo arm 5.6 kg. Males: change in height in treatment arm 11.8 cm vs change in height in placebo arm 11.4cm; change in weight in treatment arm 5.7 kg vs change in weight in placebo arm 4.7 kg. |
| Le Huong 2007 Mebendazole |
No obvious trend in nutrition variable. Anthropometric indices were calculated using WHO/NCHS reference data. Being wasted, stunted and underweight was defined by z‐scores ,< ‐ 2SD for weight‐for‐height, height‐for‐age and weight‐for‐age, respectively. Percentage underweight: At baseline Fe 41·9, Fe + MEB 51·9, MEB 50·6, Placebo 45·1; after treatment Fe 33·7, Fe + MEB 46·8, MEB 38, Placebo 35·4. Percentage stunted: At baseline Fe 30·2, Fe + MEB 31·6, MEB 41·8, Placebo 31·7; after treatment Fe 29·1, Fe + MEB 27·8, MEB 29·1, Placebo 29·3. Percentage wasted: At baseline Fe 9·3, Fe + MEB 16·5, MEB 13·9, Placebo 12·2; after treatment Fe 5·8, Fe + MEB 17·7, MEB 13·9, Placebo 13·4. |
|
Miguel 2004 (Cluster) Albendazole |
No effect on nutrition or haemoglobin demonstrated For haemoglobin a sample of around 4% (778/20,000) of the quasi‐randomized comparison of group 1 vs group 2 in 1998 was analysed. Height and weight data was collected on all individuals in standards 3‐8 (9102/20000) Difference in weight‐for age z‐score (treatment ‐ control): 0.00 (SE 0.04). Difference in height‐for‐age z‐score end value (treatment ‐ control): 0.09 (SE 0.05). Difference in haemoglobin (g/L) (treatment ‐ control): 1.6 (SE 1.4). |
|
Ndibazza 2012 Albendazole |
During the trial there were 16 deaths, 8 were in the placebo arm and 8 were in the treatment arm. No significant differences in mean z‐scores for weight‐for‐height, weight‐for‐age, and height‐for‐age z‐scores at 5 years of age. Height‐for‐age z‐score: at follow‐up in treatment group ‐1.33 (1.34) and in control group ‐1.27 (1.20). Weight‐for‐age z‐score: at follow‐up in treatment group ‐0.88 (0.95) and in control group ‐0.87 (0.91). Weight‐for‐height z‐score: at follow‐up in treatment group ‐0.13 (1.28) and in control group ‐0.17 (1.19). |
| Rousham 1994 (Cluster) Mebendazole |
ANOVAS of the change in z‐scores revealed no significant improvement with treatment. Change in weight‐for‐age and weight‐for‐height z‐scores were significantly worse in the treatment group. Height‐for‐age z‐score (mebendazole 0.25 vs 0.17 in placebo group, P 'non‐significant'), weight‐for‐age z‐score (mebendazole 0.03 vs 0.12 in placebo group, P < 0.05), weight‐for‐height z‐score (mebendazole ‐0.25 vs ‐0.05 in placebo group, P < 0.001), and MUAC were presented (mebendazole 0.33 vs 0.23 in placebo group, P 'non‐significant'). |
| Stoltzfus 2001 Mebendazole |
Mebendazole is reported as significantly reducing the prevalence of mild wasting malnutrition in a subgroup of children aged < 30 months only adjusted odds ratio for mebendazole 0.38 (95% CI 0.16 to 0.90) for weight‐for‐height z‐score < ‐1. Mebendazole is reported as significantly reducing the prevalence of poor appetite across the whole group (adjusted odds ratio for mebendazole 0.52 (95% CI 0.30 to 0.89) for weight‐for‐height z‐score < ‐1). Mebendazole had no impact on iron indices. Adjusted effect on motor scores had a tendency to favour mebendazole, but this was not significant. |
| Stoltzfus 1997 (Cluster) Mebendazole |
Weight gain: in a subgroup of under 10 year olds, the twice‐yearly treated group experienced significantly greater weight gain (kg) compared to control (2.38 (SE 0.08) vs 2.11 (SE 0.08), P < 0.05). In the thrice‐yearly treatment group the difference was not significant (2.31 (SE 0.08) vs 2.11 (SE 0.08), no P value stated). Height gain: in under 10 year olds the thrice‐yearly treated group experienced significantly greater height gain (cm) compared to control (4.59 (SE 0.07) vs 4.29 (SE 0.07), P < 0.01). In the twice‐yearly treatment group the difference in height gain was not significant (4.42 (SE 0.07) vs 4.29 (SE 0.07), no P value stated). There were no significant differences found in the subgroup of children aged over 10 years. Haemoglobin change: deworming had no effect on haemoglobin change in an adjusted analysis presented for the whole trial group (g/L): control 11.3 (SE 1.7); twice‐yearly treatment group 10.3 (SE 1.7); and thrice‐yearly group 12.7 (SE 1.7). |
| Willett 1979 Levamisole |
No statistical difference in nutrition in terms of height and weight differences between the 2 groups. Growth rates presented are adjusted for a number of variables. Weight gain (kg/year) in levamisole group 2.08 vs 1.92 in placebo group (P = 0.06). Height gain (cm/year) in levamisole group 7.58 vs 7.73 in placebo group (no significance quoted). |
Haemoglobin
Nineteen trials measured haemoglobin. Of these, two trials did not report the measured haemoglobin results (Olds 1999; Solon 2003), two trials only measured this outcome in a subset of the participants (Awasthi 2013 (Cluster); Miguel 2004 (Cluster)) and one trial did not report results by randomized comparisons (Stephenson 1993).
Psychometric tests of cognition
Eleven trials measured intellectual development using formal tests (Table 15).
Table 5.
Trials evaluating psychometric tests of cognition
| Trial details | Outcome measures | Results |
| Infected children identified by screening ‐ single dose | ||
|
Kvalsvig 1991a Mebendazole vs placebo, 1 month |
Card sorting task; cancellation task (number of letter 's' in text deleted in a time period). | Changes in cognitive scores are not clearly reported since "the dose of mebendazole was inadequate to free children from infection". |
|
Nokes 1992 Albendazole vs placebo 2.25 months |
Digit span (forward and backward); arithmetic and coding from Wechsler Intelligence Scale for Children; fluency; listening comprehension from the Clinical Evaluation of Language functions; matching familiar figures test. | Mean test scores pre‐ and post‐intervention presented with CIs No comment made on significance of unadjusted data. Results of multiple regression suggest a greater improvement in treated children in 3/10 tests (fluency, digit span forwards, digit span backwards). |
| Infected children identified by screening ‐ multiple dose | ||
| Simeon 1995 Albendazole vs placebo 6.5 months | 1. Main trial (264 children) Wide range achievement test: reading, arithmetic, and spelling sub tests; 2. Subgroup 1 (189 children 189 infected children from original population) Digit span; verbal fluency test; visual search; number choice; French vocabulary learning; 3. Subgroup 2 (97 children from grade 5) French learning; digit spans (forward and backward); Corsi block span; verbal fluency; picture search; silly sentences. |
|
| All children living in endemic area ‐ single dose | ||
|
Nga 2009 Albendazole |
Cognitive performance was measured using Raven's Colored Matrices and also a series of cognitive tests from Wechsler's Intelligence Scale for Children III: digit span backward and forward, block design and coding. | Deworming had no significant effect on any of the cognitive tests. |
|
Solon 2003 Albendazole vs placebo 16 weeks |
Cognitive ability was measured using a standardized written mental‐abilities test called the Primary Mental Abilities Test for Filipino Children (PMAT‐FC). The test covers general knowledge and comprehension, verbal relationships, fundamental mathematical comprehension and skills, numerical sequencing, and ability to perceive and apply relationships based on meaningless stimuli. | Deworming had either no effect or a negative effect on mental ability scores. Data was not reported. |
| All children living in endemic area ‐ multiple dose | ||
|
Awasthi 2000 Albendazole vs placebo, 2 years |
1045 participants. Developmental status (Denver Questionnaire). | No difference in development between treatment groups in terms of proportion with "normal" development. |
|
Miguel 2004 (Cluster) Deworming package including albendazole vs placebo 1 year |
30,000 participants. Cognitive tests including picture search, Raven matrix, verbal fluency, digit span, Spanish learning, and a dynamic test using syllogisms measured for all three school groups in 2000. | Outcome data not reported for cognitive tests, though authors state: "Deworming treatment effects are not significantly different than zero for any component of the cognitive exam (results available on request)". |
|
Ndibazza 2012 Albendazole vs placebo, post‐treatment |
870 participants. Block design, Picture vocabulary scale, Sentence repetition, Verbal fluency, Counting span, Running memory, Picture search, Wisconsin card sort test, Tap once tap twice task, Shapes task, Tower of London. | Deworming had no significant effect on any of the cognitive tests. |
| Stoltzfus 2001 Mebendazole vs placebo, 1 year | 359 participants. Motor and language development by parents reporting gross motor and language milestones using scoring system developed specifically for the trial. | Unadjusted data not reported. Treatment had no significant effect on motor or language development. |
| Watkins 1996 Albendazole vs placebo, 6 months | 212 participants. Interamerican vocabulary test; Interamerican reading test; Peabody picture vocabulary test. | All outcome measures reported as unadjusted scores. No difference in any of the tests found between treatment groups. |
Measures of physical well‐being
Three trials measured physical well‐being using the Harvard Step Test, 10 m shuttle run and VO2 max, grip strength and standing broad jump test (Stephenson 1989; Stephenson 1993; Yap 2014; Table 16).
Table 6.
Trials evaluating measures of physical well‐being
| Trial details | Outcome measures | Results |
| Infected children identified by screening ‐ single dose | ||
|
Yap 2014 Albendazole |
VO2 max estimate (mL kg‐1 min‐1), 20 m running laps completed grip strength (kg), standing broad jump distance (cm). Mean values reported. | No effect was detected on any of the measures of physical well‐being (99 in the albendazole group and 95 in the control) |
|
Stephenson 1989 Albendazole vs placebo, 6 months follow‐up |
Harvard Step Test | Deworming significantly improved children’s physical well‐being in a non‐randomly selected subgroup of children (33/171) Treatment group: mean = 80, SD = 5.51, N = 18 Placebo group: mean = 74, SD = 4.65, N = 15 MD = 6.00, 95% CI 2.53 to 9.4 |
|
Stephenson 1993 Albendazole vs placebo, 8 months follow‐up |
Harvard Step Test | Deworming significantly improved children’s physical well‐being in a non‐random subgroup of children (54/328) Treatment group: mean = 82, SD = 3.64, N = 27 Placebo group: mean = 76, SD = 3.57, N = 26 MD = 6.00, 95% CI 4.06 to 7.94 |
School attendance
Four trials measured school attendance (Table 17).
Table 7.
Trials evaluating school attendance (days present at school)
| Trial details | Outcome measures | Intervention | Control | Difference |
| Infected children identified by screening ‐ multiple dose | ||||
| Simeon 1995 Albendazole vs placebo 6.5 months | Mean % attendance (class registers ) N = 264 |
Baseline 62.6 (SD 20.4) Follow‐up 67.3 (SD 18.4) |
Baseline 66.3 (SD 20.8) Follow‐up 69.3 (SD 17.5) |
2.0% |
| All children living in endemic area‐ multiple dose | ||||
| Kruger 1996 | Attendance at follow‐up only (class registers) N = 143 |
97.2% (iron group) 95.6% |
98% (iron group) 95.2% |
‐0.8% 0.4% |
|
Miguel 2004 (Cluster) Group 1 vs 2+3 (1 year follow‐up) |
School participation N = 30,000 |
84.1% | 73.1% (group 2) 76.6% (group 3) |
9.3% (SE 3.0%) |
|
Miguel 2004 (Cluster) Group 2 vs 3 (1 year follow‐up) |
School participation N = 20,000 |
71.8% | 66.4% |
5.4% (SE 2.7%) |
|
Miguel 2004 (Cluster) Group 1 vs 3 1999 (2 year follow‐up) |
School participation N = 20,000 |
71.6% | 66.4% |
5.1% (SE 2.7) |
| Watkins 1996 6 months | Attendance rates of children actively attending school. N = 243 |
Baseline 92%, SEM = 1 Follow‐up 88%, SEM = 1 |
Baseline 0.90, SEM = 1 Follow‐up 89% SEM =1 |
‐3% |
School performance
Hall 2006 (Cluster) and Miguel 2004 (Cluster) measured exam performance (Table 18).
Table 8.
School performance
| Trial details | Outcome measures | Results |
| All children living in endemic area ‐ multiple dose | ||
|
Hall 2006 (Cluster) Albendazole versus placebo, 2 years |
2659 participants. Mathematics test score, Vietnamese test score. | No statistically significant differences in test results at start or end of trial. |
|
Miguel 2004 (Cluster) Deworming package including albendazole versus placebo |
30,000 participants. Exam score performance (measured by Internationaal Christelijk Steunfonds Africa (ICS) administered English, Mathematics and Science‐Agriculture exams) in pupils in grades 3 to 8. | In the original trial and the pure replication, the trial authors reported no significant difference, but data was not reported. In the statistical replication, this was confirmed. |
Death
Ndibazza 2012 provided data on mortality. Awasthi 2013 (Cluster) also monitored mortality although these data are not yet in the public domain so we are unable to report them.
Adverse events
Four trials provided information on adverse events (Fox 2005; Michaelsen 1985; Wiria 2013 (Cluster); Yap 2014).
Risk of bias in included studies
See Figure 3 and Figure 4 for 'Risk of bias' summaries and Characteristics of included studies section for details of the risk of bias and methods used in each trial.
Figure 3.
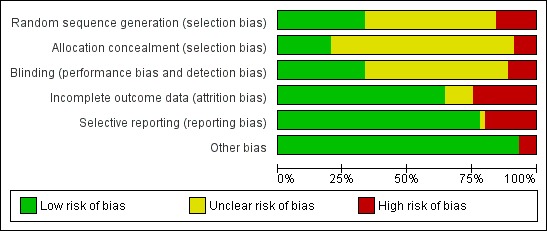
Figure 4.
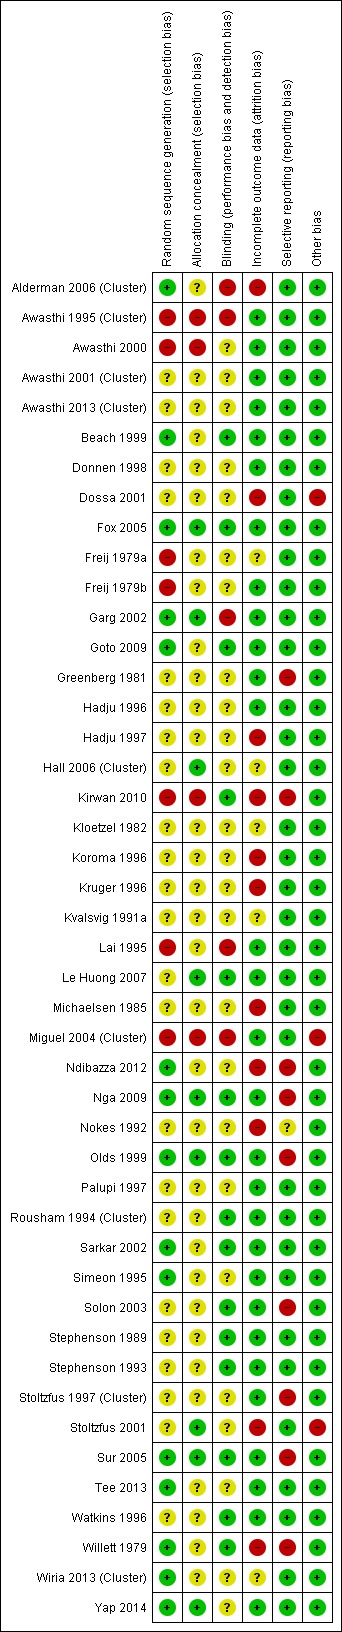
Allocation
Sequence generation
In the 38 individually RCTs, the risk of bias was low in 13 trials (see Figure 3 and Figure 4), high in five, and unclear in the other trials. For the nine cluster‐RCTs, the risk of bias was low in two trials (Alderman 2006 (Cluster); Wiria 2013 (Cluster)), high in two trials (Awasthi 1995 (Cluster); Miguel 2004 (Cluster)) and unclear in five trials (Awasthi 2001 (Cluster), Awasthi 2013 (Cluster), Hall 2006 (Cluster), Rousham 1994 (Cluster), Stoltzfus 1997 (Cluster).
Allocation concealment
For the 38 individually randomized trials, seven trials were at low risk of bias regarding allocation concealment (Fox 2005; Garg 2002; Le Huong 2007; Nga 2009; Olds 1999; Stoltzfus 2001; Sur 2005), high in two trials (Awasthi 2000; Kirwan 2010), and unclear in the other trials.
The risk of bias was low in one of the eight cluster‐RCTs (Hall 2006 (Cluster)), high in two trials (Awasthi 1995 (Cluster); Miguel 2004 (Cluster)), and unclear in the remaining six trials.
Blinding
Fifteen trials were double blinded and judged to be at low risk of bias. Five trials were at high risk of bias as they did not use blinding. Details of blinding were unclear in the remaining 26 trials.
Incomplete outcome data
Twenty nine trials appeared to have low risk of bias in relation to outcome data. Overall, the percentage of randomized participants that were evaluable ranged from 4% to 100%, with 19 trials including 90% or more of the randomized participants (low risk cut‐off). The percentage was particularly low in three of the trials measuring school performance and cognitive outcomes: 71% in Ndibazza 2012; 73% in Nokes 1992; and 52% in Stoltzfus 2001; and in one trial measuring haemoglobin: 26% in Kirwan 2010. In Miguel 2004 (Cluster) for haemoglobin a sample of around 4% (778/20,000) of the quasi‐randomized comparison of group 1 vs group 2 in 1998 was analysed. Weight and height data were collected on all individuals in standards 3.8, 48% of the total comparison (9102/20000). For exam performance and cognitive tests, 34% of eligible children were included in the treatment school (group 1) and 32% in the control school (group 2 and 3). Wiria 2013 (Cluster) did not report the number of children that were randomized, so it was not possible to calculate the percentage evaluable in this trial.
Selective reporting
Fourteen trials had evidence of selective reporting and were judged to be at high risk of bias (Goto 2009; Greenberg 1981; Kirwan 2010; Koroma 1996; Nga 2009; Nokes 1992; Olds 1999; Simeon 1995; Solon 2003; Stoltzfus 1997 (Cluster); Stoltzfus 2001; Sur 2005; Willett 1979). The remaining trials did not show evidence of selective reporting.
Other potential sources of bias
In general, quality of the design of the nine cluster‐RCTs was good: they were judged as low risk for recruitment bias (six trials), baseline imbalance (nine trials), loss of clusters (nine trials), compatibility with RCTs that randomized individuals (one trial).These data are included in the "table of characteristics").
There were problems with incorrect analysis noted above: Alderman 2006 (Cluster) did not adjust for clustering in the published trial, but gave us the adjusted data (see trial design above), and we used this to adjust the analysis in Hall 2006 (Cluster).
One trial was potentially confounded by co‐interventions noted under "accompanying health promotion activities" under interventions (above).
Effects of interventions
See: Table 1; Table 2; Table 3
The effects were grouped into trials in children known to be infected, and trials of all children in endemic areas. In the trials treating whole populations, we stratified the results by community worm prevalence. We have detailed the prevalence strata in Table 12 (high prevalence or high intensity areas (referred to as 'high prevalence'); moderate prevalence and low intensity referred to as ('moderate prevalence'); and low prevalence with low intensity referred to as 'low prevalence'). Within each section, we present the results of the meta‐analysis, and then report any other data from trials that we could not include in the meta‐analysis.
Comparison 1. Children with infection: single dose of deworming drugs vs no intervention
These trials screened for infection, and then included only children with proven infection; or were conducted in settings where all the children were known to be infected. None of these trials provided data for the outcomes school attendance (number of children dropping out), school performance, mortality, or adverse events. No trials appeared to have potentially confounding health promotion activities (Table 13). For single dose, see Table 2.
Nutritional measures
Trials measured weight (n = 5), height (n = 5), MUAC (n = 4), triceps (n = 3), subscapular skinfold (n = 2) and BMI (n = 1). Large effects were seen in two trials for weight, MUAC, and skinfold, with an average weight gain of over one kg in both trials (Stephenson 1989; Stephenson 1993). These trials were in a high prevalence area of Kenya. The gain in weight in the deworming group ranged from 0.2 kg to 1.3 kg more (627 participants, five trials, Analysis 1.1), height gain (0.25 cm, 95% CI 0.01 to 0.49; 647 participants, five trials, Analysis 1.2), and gains in MUAC, triceps and subscapular skinfold values (Analysis 1.3; Analysis 1.4; Analysis 1.5). No difference in body mass index was detected after a single dose (Analysis 1.6).
Analysis 1.1.
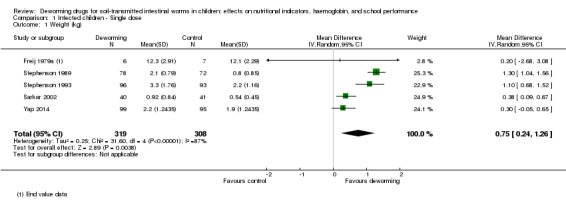
Comparison 1 Infected children ‐ Single dose, Outcome 1 Weight (kg).
Analysis 1.2.
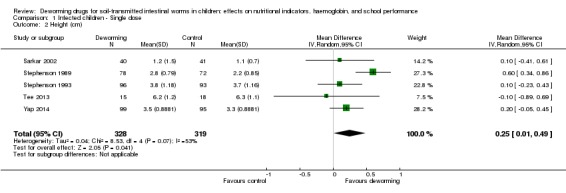
Comparison 1 Infected children ‐ Single dose, Outcome 2 Height (cm).
Analysis 1.3.
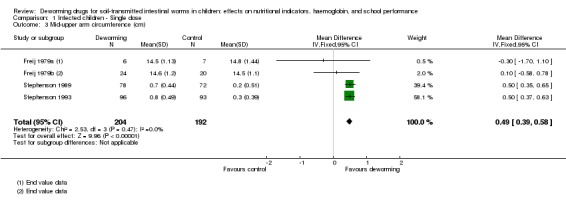
Comparison 1 Infected children ‐ Single dose, Outcome 3 Mid‐upper arm circumference (cm).
Analysis 1.4.
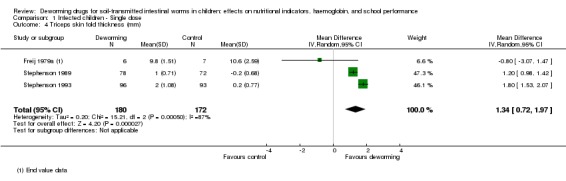
Comparison 1 Infected children ‐ Single dose, Outcome 4 Triceps skin fold thickness (mm).
Analysis 1.5.
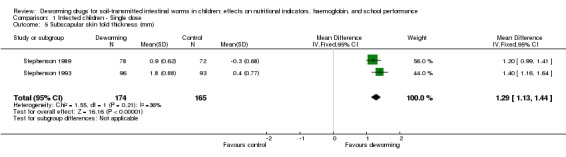
Comparison 1 Infected children ‐ Single dose, Outcome 5 Subscapular skin fold thickness (mm).
Analysis 1.6.
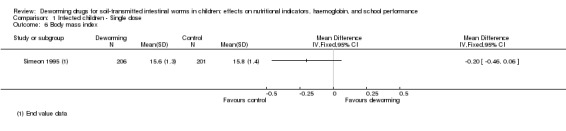
Comparison 1 Infected children ‐ Single dose, Outcome 6 Body mass index.
Nokes 1992 did not provide data for nutritional outcomes as nine weeks was cited as too short a follow‐up period to demonstrate a change (Table 14).
Haemoglobin
There was no difference in overall mean haemoglobin at the end of two trials with deworming (Analysis 1.7).
Analysis 1.7.
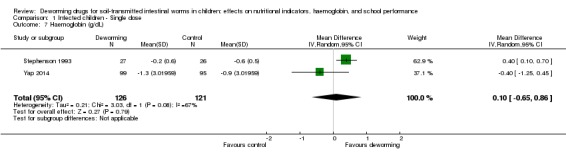
Comparison 1 Infected children ‐ Single dose, Outcome 7 Haemoglobin (g/dL).
Psychometric tests of cognition
Two trials reported on formal tests (Table 15). Kvalsvig 1991a did not clearly report change in cognitive scores; Nokes 1992 did not report unadjusted data, but results of multiple regression suggested an improvement in treated children in three of the 10 tests carried out (fluency, digit span forwards, digit span backwards).
Measures of physical well‐being
Two trials in the same high prevalence area of Kenya measured performance on the Harvard Step Test in non‐randomly selected subgroups (Stephenson 1989; Stephenson 1993), and both indicated benefit. Yap 2014 found no effect on any of the measures of physical well‐being (Table 16).
Other data
Three trials did not provide data in a form that we could use in meta‐analysis. We have collated these data in Table 14, and this information is summarized below:
Nokes 1992 measured growth but did not report the results, as nine weeks was cited as too short a follow‐up period to demonstrate a change;
Tee 2013 found no significant differences in median change in weight and weight‐for‐height z‐scores, and for mean change in weight‐for‐age, and height‐for‐age z‐scores at 12 month follow‐up;
Yap 2014 found no significant differences in percentage stunted and sum of skinfolds at six month follow‐up.
Comparison 2. Children with infection: multiple doses of deworming drugs vs no intervention
Nutritional measures
Stephenson 1993 demonstrated weight, MUAC, triceps, subscapular and skinfold gains, but no improvements in height (Analysis 2.1; Analysis 2.2; Analysis 2.5; Analysis 2.6; Analysis 2.7). For body mass index, Simeon 1995 did not demonstrate a difference (Analysis 2.3). They also reported height for age z‐score and did not detect a difference (Table 14).
Analysis 2.1.
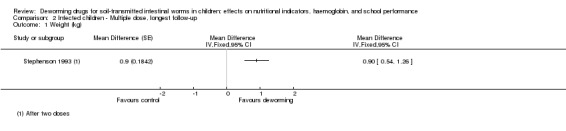
Comparison 2 Infected children ‐ Multiple dose, longest follow‐up, Outcome 1 Weight (kg).
Analysis 2.2.
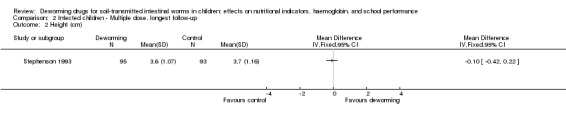
Comparison 2 Infected children ‐ Multiple dose, longest follow‐up, Outcome 2 Height (cm).
Analysis 2.5.

Comparison 2 Infected children ‐ Multiple dose, longest follow‐up, Outcome 5 Mid‐upper arm circumference (cm).
Analysis 2.6.
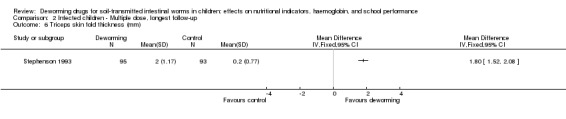
Comparison 2 Infected children ‐ Multiple dose, longest follow‐up, Outcome 6 Triceps skin fold thickness (mm).
Analysis 2.7.
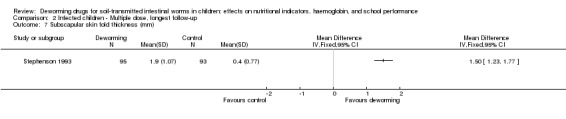
Comparison 2 Infected children ‐ Multiple dose, longest follow‐up, Outcome 7 Subscapular skin fold thickness (mm).
Analysis 2.3.
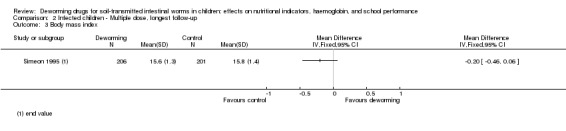
Comparison 2 Infected children ‐ Multiple dose, longest follow‐up, Outcome 3 Body mass index.
Psychometric tests of cognition
Simeon 1995 measured intellectual development using a wide range achievement test in the main trial, and digit spans and verbal fluency tests in subgroups. The trial authors reported that deworming had no effect on intellectual development scores, but did not report the data (Table 15).
School attendance (days present at school)
Simeon 1995 found no demonstrable effect on school attendance rates of children actively attending school (MD ‐2.00, 95% CI ‐5.49 to 1.49; 407 participants, one trial, Analysis 2.4).
Analysis 2.4.
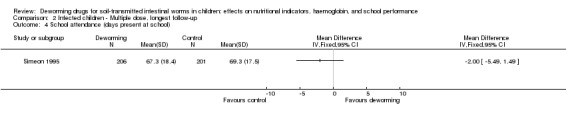
Comparison 2 Infected children ‐ Multiple dose, longest follow‐up, Outcome 4 School attendance (days present at school).
Comparison 3. All children living in endemic area: single dose of deworming drugs
One trial had substantive health promotion activities accompanying the deworming group (Table 13).
See Table 3.
No trials provided data for the outcomes school attendance, physical well‐being, and mortality.
Nutritional measures
Trials measured weight in high (n = 2), moderate (n = 2), and low (n = 3) prevalence areas. The trials demonstrated no effect on weight (‐0.04 kg, 95% CI ‐0.11 to 0.04; 2719 participants, seven trials; Analysis 3.1), height (‐0.12 cm, 95% CI ‐0.33 to 0.10; 1974 participants, five trials; Analysis 3.2) or MUAC (0.04 cm, 95% CI ‐0.19 to 0.26; 911 participants, three trials; Analysis 3.3).
Analysis 3.1.
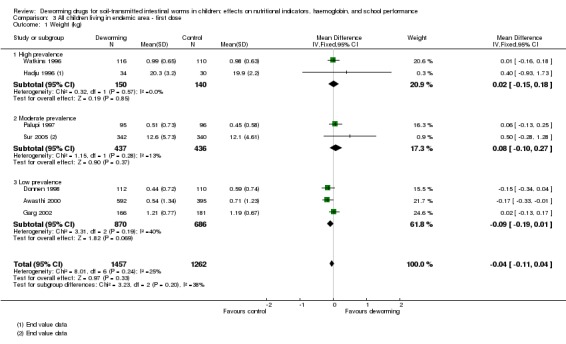
Comparison 3 All children living in endemic area ‐ first dose, Outcome 1 Weight (kg).
Analysis 3.2.
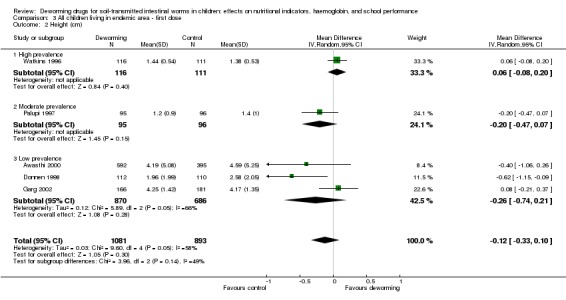
Comparison 3 All children living in endemic area ‐ first dose, Outcome 2 Height (cm).
Analysis 3.3.
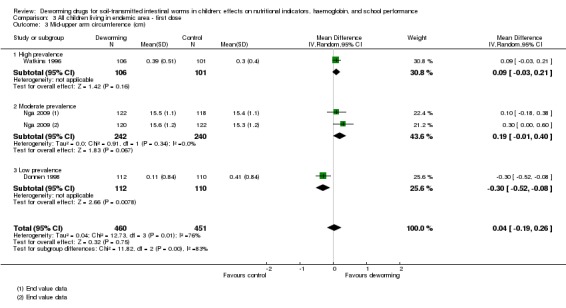
Comparison 3 All children living in endemic area ‐ first dose, Outcome 3 Mid‐upper arm circumference (cm).
Haemoglobin
Two trials were in moderate prevalence areas, and one in low prevalence areas. No effect was demonstrable in individual trials or on meta analysis (MD 0.06 g/dL, 95% CI ‐0.05 to 0.17; 1005 participants, three trials; Analysis 3.4).
Analysis 3.4.
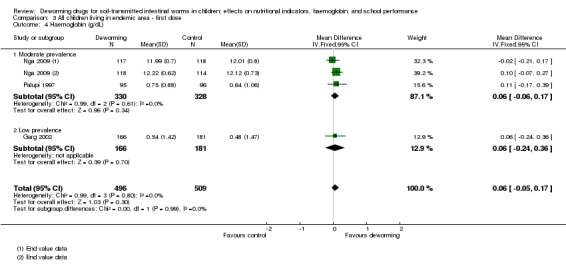
Comparison 3 All children living in endemic area ‐ first dose, Outcome 4 Haemoglobin (g/dL).
Psychometric tests of cognition
Solon 2003 measured cognitive ability using a standardized written mental‐abilities test, and reported that deworming had either no effect or a negative effect on mental ability scores, but did not report the data. Nga 2009 reported no effects on any cognitive tests measured (Table 15).
Adverse events
Fox 2005 reported none in 46 patients given albendazole. Michaelsen 1985 reported a number of adverse events with tetra‐chloroethylene, a drug no longer used (Table 14).
Other data
Some trials did not provide data in a form that we could use in meta‐analysis. We have collated these data in Table 14, and we have summarized this information below:
Beach 1999 did not detect a nutritional benefit of treatment after four months for the entire trial population (no figures provided);
Fox 2005 only reported on subgroups infected with worms;
Greenberg 1981 stated there was no significant difference for all measured anthropometric variables for the total group and for subgroups defined by severity of infection (no figures provided);
Kloetzel 1982 reported the proportion of treatment or control group that improved, deteriorated, or experienced no change, but it is not known what anthropological measures were used;
Koroma 1996 found significant increases in weight‐for‐height, weight‐for‐age, and height‐for‐age z‐scores recorded in rural and urban treatment groups at six months;
Michaelsen 1985 found no significant difference in change in mean for haemoglobin or weight for height at five months;
Nga 2009 found not significant difference in weight‐for‐height, weight‐for‐age, and height‐for‐age z‐scores at four months.
Wiria 2013 (Cluster) found no significant difference in BMI at 21 months follow‐up in children aged 19 years and less.
Sensitivity analysis
In the sensitivity analysis including only trials where the risk of bias for allocation concealment was low, no difference between treatment and control groups in weight, height, MUAC, or haemoglobin was evident (Analysis 5.1; Analysis 5.2; Analysis 5.3; Analysis 5.4).
Analysis 5.1.
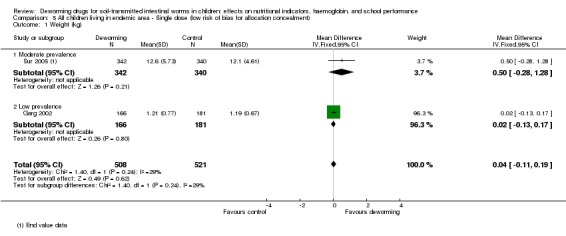
Comparison 5 All children living in endemic area ‐ Single dose (low risk of bias for allocation concealment), Outcome 1 Weight (kg).
Analysis 5.2.
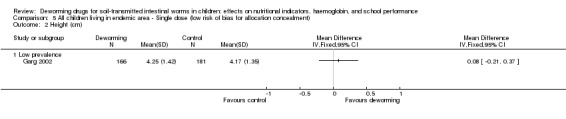
Comparison 5 All children living in endemic area ‐ Single dose (low risk of bias for allocation concealment), Outcome 2 Height (cm).
Analysis 5.3.
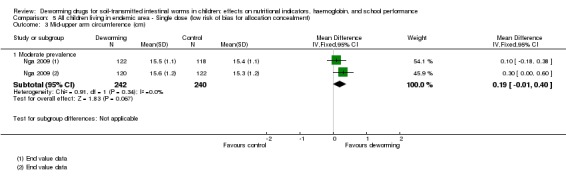
Comparison 5 All children living in endemic area ‐ Single dose (low risk of bias for allocation concealment), Outcome 3 Mid‐upper arm circumference (cm).
Analysis 5.4.
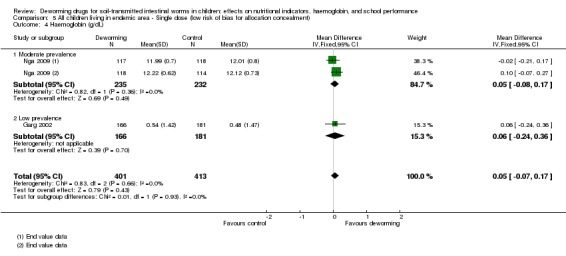
Comparison 5 All children living in endemic area ‐ Single dose (low risk of bias for allocation concealment), Outcome 4 Haemoglobin (g/dL).
Comparison 4. All children living in endemic area: multiple doses of deworming drugs, longest follow‐up
See Table 1.
No trials provided data for adverse events.
Nutritional measures
Trials were in high (n = 2), moderate (n = 3), and low (n = 5) prevalence areas. For weight, overall there was no evidence of an effect (Analysis 4.1), although one trial (Awasthi 1995 (Cluster) (low prevalence) showed a large weight gain of almost 1 kg in the treatment groups. Notably two subsequent trials in the same area as Awasthi 1995 (Cluster) did not demonstrate an effect (Awasthi 2000; Awasthi 2001 (Cluster)). Overall, the meta‐analysis did not demonstrate a difference in weight gain between intervention and control (MD 0.08 kg, 95% CI ‐0.11 to 0.27; 36,038 participants from cluster trials and 2354 individually randomized participants, 10 trials), but the heterogeneity was high (I² statistic = 83%). When the trials were stratified by community category, heterogeneity was explained for the high and moderate prevalence trials, but not for the low prevalence trials. No significant effect was apparent in any subgroup. For MUAC (two trials) and triceps skinfold (one trial), no overall effects were evident (Analysis 4.3; Analysis 4.4). No effect on height was demonstrated in any of the trials measuring this (5384 participants from cluster trials and 1673 participants from individually randomized, seven trials; Analysis 4.2).
Analysis 4.1.
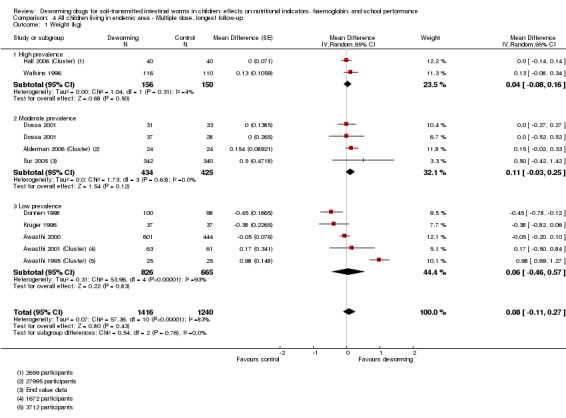
Comparison 4 All children living in endemic area ‐ Multiple dose, longest follow‐up, Outcome 1 Weight (kg).
Analysis 4.3.
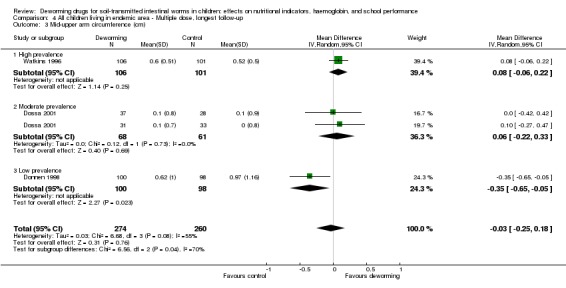
Comparison 4 All children living in endemic area ‐ Multiple dose, longest follow‐up, Outcome 3 Mid‐upper arm circumference (cm).
Analysis 4.4.
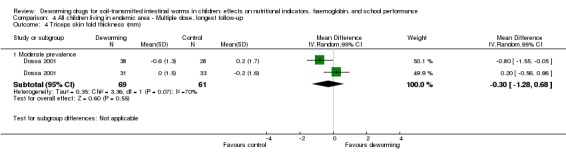
Comparison 4 All children living in endemic area ‐ Multiple dose, longest follow‐up, Outcome 4 Triceps skin fold thickness (mm).
Analysis 4.2.
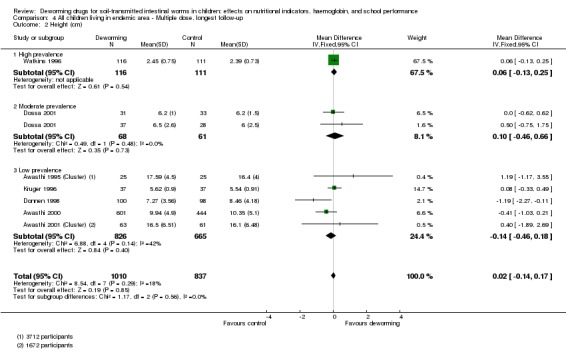
Comparison 4 All children living in endemic area ‐ Multiple dose, longest follow‐up, Outcome 2 Height (cm).
Haemoglobin
Seven trials reported this, with no difference between intervention and control apparent (Analysis 4.5). In addition, the re‐analysis of Miguel and Kremer (Aiken 2015) reported no difference in the prevalence of anaemia between the groups.
Analysis 4.5.
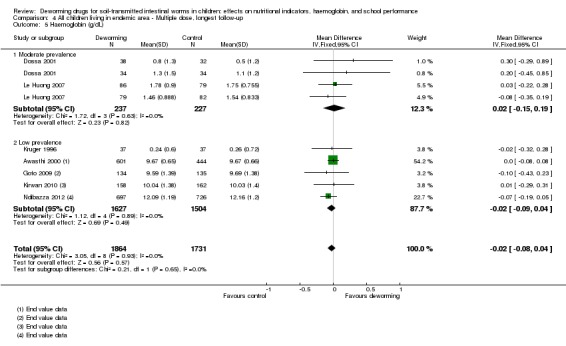
Comparison 4 All children living in endemic area ‐ Multiple dose, longest follow‐up, Outcome 5 Haemoglobin (g/dL).
Psychometric tests of cognition
Five trials (30,000 participants from cluster trials and 2486 individually randomized participants) measured this outcome (Table 15). Ndibazza 2012 measured a range of cognitive tests, Watkins 1996 measured reading and vocabulary, and Stoltzfus 2001 measured motor and language development. All reported that no effect was demonstrated. Miguel 2004 (Cluster) also measured a range of cognitive tests. The results were not reported, but the trial authors stated that no deworming effect was demonstrated. Awasthi 2000 measured developmental status using the Denver Questionnaire, and did not demonstrate an effect of deworming.
School attendance (days present at school)
Three trials reported on this outcome (Kruger 1996; Miguel 2004 (Cluster); Watkins 1996; Table 17). Watkins reported attendance rates of children actively attending school on the basis of school registers, at baseline and after treatment, and no effect was demonstrated. Miguel 2004 (Cluster) reported on end value differences in attendance for girls under 13 years of age and all boys based on direct observation.
For outcomes measures at the longest follow‐up point we found no difference in school attendance (MD 2%, 95% CI ‐4 to 8%; Analysis 4.6; 20,000 participants in cluster trials and 243 participants from an individually RCT, two trials) ). This uses the longest point of follow‐up from Miguel 2004 (Cluster) at two years (group 1 vs group 3), in line with our analytical plan.
Analysis 4.6.
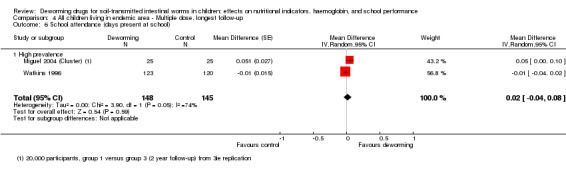
Comparison 4 All children living in endemic area ‐ Multiple dose, longest follow‐up, Outcome 6 School attendance (days present at school).
School performance
Two trials measured this (Hall 2006 (Cluster); Miguel 2004 (Cluster); Table 18). Miguel 2004 (Cluster) measured exam score performance (English, Mathematics, and Science‐Agriculture exams in pupils in grades 3 to 8). Results showed no difference in performance. This included the results in the original trial analysis, Miguel 2004 (Cluster), in the analysis after coding errors had been corrected, Aiken 2015), and in the statistical replication, Davey 2015. Hall 2006 (Cluster) found no difference in test scores at the end of the trial.
Death
Deworming showed no effect in the DEVTA cluster trial of over one million children (Awasthi 2013 (Cluster)) (MD in deaths per child‐care centre at ages 1.0 to 6.0 was 0.16 (SE 0.11); mortality ratio 0.95, 95% CI 0.89 to 1.02). Ndibazza 2012 reported that during the trial there were 16 deaths, eight in the placebo arm and eight in the treatment arm. Awasthi 1995 (Cluster) reported 23 deaths during the trial, 13 of which were in the usual care arm, and 10 were in the treatment arm.
Other data
Some trials did not provide data in a form that we could use in meta‐analysis. We have collated these data in Table 14 and Table 17, and have summarized this information below:
Goto 2009 reported no significant differences in mean z‐scores or prevalence of stunting, underweight or wasting between the intervention groups, and the changes between intervals (ie between weeks 0 to 12, 0 to 24, 0 to 36, 12 to 24, etc.) did not differ significantly between groups;
Hadju 1997 reported no significant differences detected between treatment groups on basis of multivariate analyses;
Hall 2006 (Cluster) reported no difference in final and change in height;
Kruger 1996 found that "the rates of absenteeism were similar for all groups", but no measures of variance were provided;
Lai 1995 found no difference in height or weight between treatment and control group at the end of two‐year follow‐up;
Le Huong 2007 reported no obvious trend in nutritional variable;
Miguel 2004 (Cluster) demonstrated no significant effect on weight‐for‐age z‐score, height‐for‐age z‐score, and haemoglobin;
Rousham 1994 (Cluster) reported that ANOVAS of the change in z‐scores revealed no significant improvement with treatment;
Ndibazza 2012 found no significant differences in mean z‐scores for weight‐for‐height, weight‐for‐age, and height‐for‐age z‐scores at five years of age;
Stoltzfus 2001 reported that mebendazole significantly reduced the prevalence of mild wasting malnutrition in a subgroup of children aged < 30 months;
Stoltzfus 1997 (Cluster) reported that in a subgroup of under 10 year olds, the twice‐yearly treated group experienced significantly greater weight gain (kg) compared to control (2.38 (SE 0.08) vs 2.11 (SE 0.08), P < 0.05);
Willett 1979 reported no statistical difference in growth rates in terms of height and weight between the two groups.
Comparisons 5 and 6. Sensitivity analysis
Including only trials with low risk of bias for allocation of concealment, no significant difference between treatment and control groups was detected in weight, height, or haemoglobin (Analysis 5.1; Analysis 5.2, Analysis 5.3, Analysis 5.4; Analysis 6.1, Analysis 6.2; Analysis 6.3).
Analysis 6.1.
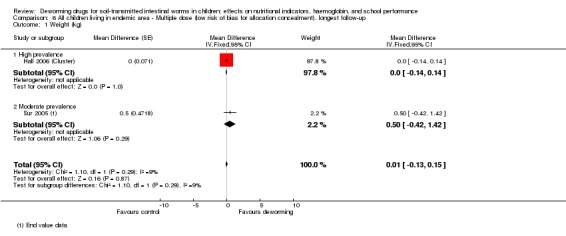
Comparison 6 All children living in endemic area ‐ Multiple dose (low risk of bias for allocation concealment), longest follow‐up, Outcome 1 Weight (kg).
Analysis 6.2.
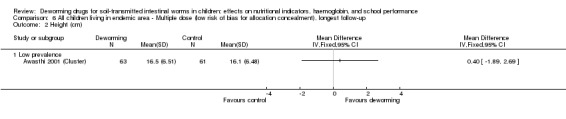
Comparison 6 All children living in endemic area ‐ Multiple dose (low risk of bias for allocation concealment), longest follow‐up, Outcome 2 Height (cm).
Analysis 6.3.
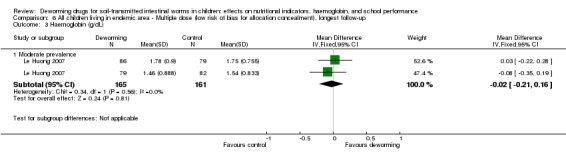
Comparison 6 All children living in endemic area ‐ Multiple dose (low risk of bias for allocation concealment), longest follow‐up, Outcome 3 Haemoglobin (g/dL).
Comparison 7. Exploring whether the intervention effect changed over time
The MD in weight (between deworming drugs vs control in children in an endemic area after multiple doses) did not differ by length of follow‐up (results not presented) or by publication year (Analysis 7.1).
Analysis 7.1.
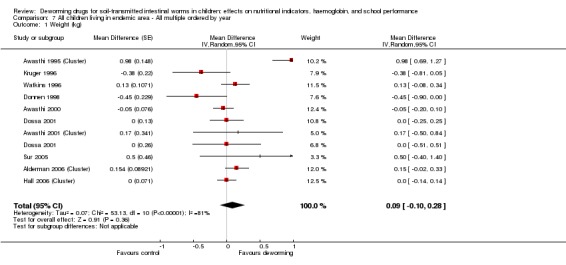
Comparison 7 All children living in endemic area ‐ All multiple ordered by year, Outcome 1 Weight (kg).
Discussion
Summary of main results
We identified 45 trials, including nine cluster‐RCTs, that met the inclusion criteria. One trial that assessed mortality in addition to other endpoints included over one million children, and the remaining 44 trials included a total of 67,672 participants.
For infected children, deworming drugs may increase average weight gain over one to six months, but we do not know if there is an effect on haemoglobin or cognitive functioning.
In trials treating all children living in endemic areas of varying endemicity (15 in high prevalence areas, 12 in moderate prevalence, and 10 in low prevalence areas), a single dose of deworming drugs probably has little or no effect on average weight gain or average haemoglobin, and may have little or no effect on cognition or physical well‐being. For multiple doses of deworming drugs over six months to three years after the intervention started, there was little or no effect on average weight gain, height, or haemoglobin, and probably little or no effect on formal tests of cognition. We do not know if there was an effect on school attendance, but there is probably no effect on exam performance or death.
Overall completeness and applicability of evidence
Since the previous version of this review, the DEVTA trial has been published and is now included in this Cochrane Review. One further trial (of 2660 children in Vietnam from 1999) remains unpublished (Hall 2006 (Cluster)). In May 2015 we offered the trial investigators an opportunity to present the trial as an annex to this review, and await a response from them. Meanwhile, the data from the unpublished manuscript are included in this review.
In children infected with worms, a single dose of deworming medicine appears to result in some weight gain. This evidence comes from trials conducted in a single school in Kenya more than 20 years ago, where all of the children were infected—the majority with heavy worm loads of both hookworm and Trichuris (Stephenson 1989;Stephenson 1993). However, when the intervention is used in the way the WHO currently recommends — giving treatment to whole school populations — an overall average effect is not evident. An effect on average weight was seen in one cluster‐RCT assessing long‐term multiple dosing in a low‐burden community undertaken in 1995 in India (Awasthi 1995 (Cluster)). Trials conducted subsequently, some in the same area, including large cluster‐RCTs, have not demonstrated effects.
Some policy arguments point out that deworming programmes will not provide a detectable average effect on nutritional status, but actually will provide a substantial effect in a proportion of children with heavy worm load infections. Even if this were the case, there should be an effect on average values, and in this review treating children known to be infected may have some effect on weight gain (driven mainly by data from Kenya from a highly endemic area conducted over twenty years ago) but not other variables. If policy makers feel this is credible even in the absence of differences in average effect, then further trials are needed to evaluate this.
Ten trials measured intellectual development using formal tests. Only one of these trials demonstrated an effect on cognitive outcomes in 3/10 of the outcomes measured (Nokes 1992; Table 15). The trials used a range of cognitive tests, which seems to reflect the difficulty inherent in choosing appropriate cognitive performance tests since there is no accepted test battery that can be applied across cultures and settings, and, as Miguel 2004 (Cluster) pointed out, the mechanisms for any putative effects are unknown.
For school attendance, one quasi‐RCT reported an effect, which was apparent in only one of the two comparisons in up to a year of follow‐up, and not apparent in the one comparison after one year (Miguel 2004 (Cluster)). Miguel 2004 (Cluster) measured attendance outcomes directly, unlike the other two trials (Simeon 1995; Watkins 1996) which measured attendance using school registers, which may be inaccurate in some settings. Two large cluster‐RCTs measured school performance and neither demonstrated an effect of deworming (Hall 2006 (Cluster); Miguel 2004 (Cluster)).
For children living in endemic areas, in terms of the logic framework (Figure 1) evidence on the desired impacts (child mortality and school performance) is absent. The evidence for school attendance is limited, and there is no evidence of effects on physical well‐being. In terms of the main effects there may be no effect on weight, and there is fairly good evidence of no impact on haemoglobin, cognition, and school performance.
Long‐term outcomes
There have been some recent trials on long‐term follow‐up, none of which met the quality criteria needed in order to be included in this review (Baird 2011; Croke 2014; Ozier 2011; described in Characteristics of excluded studies). Baird 2011 and Ozier 2011 are follow‐up trials of the Miguel 2004 (Cluster) trial. Ozier 2011 studied children in the vicinity of the Miguel 2004 (Cluster) to assess long‐term impacts of the externalities (impacts on untreated children). However, in the replication trials (Aiken 2014; Aiken 2015; Davey 2015), these spill‐over effects were no longer present, raising questions about the validity of a long‐term follow‐up. Baird 2011 compared children who received two years more deworming to those who received less in the Miguel 2004 (Cluster) analysis.
Croke 2014 is a follow‐up of the Alderman 2006 (Cluster), but assessed only 3% (1097/37,165) of the original randomized participants, and furthermore all children were offered treatment after the original follow‐up period in the Alderman 2006 (Cluster) trial.
Overall, given the growing evidence of a lack of short‐term effects, arguments for long‐term population impacts appear implausible in our view.
Externalities
There have been previous claims that deworming benefits not only the individuals, but also those around them. Whilst not ignoring this, we tried to establish first that there was a benefit to individuals; as this seems debatable, examining for externalities seems less important. Miguel 2004 (Cluster), in their original analysis, stated their analysis demonstrated externalities. After correction of coding errors, the pure replication failed to find any evidence of externalities (Aiken 2015).
Completeness of the analysis
Critics of a previous version of this review, Dickson 2000a, stated that the impact must be considered stratified by the intensity of the infection (Cooper 2000; Savioli 2000). We have done this comprehensively in this edition and no clear pattern of effect has emerged. Other criticisms were that trials of short‐term treatment cannot assess the long‐term benefits of regular treatment (Bundy 2000). However, this analysis clearly examines long‐term outcomes from trials conducted over the last 10 years.
Extrapolating evidence on selective deworming to targeted deworming
Advocates of deworming argue that the evidence of benefit seen in selective deworming provides an evidential base for targeted deworming, because the latter reduces costs due to diagnostic screening. The argument is that population treatment benefits those infected, but this benefit is simply not detectable. Even among those children known to be infected, this Cochrane Review does not clearly demonstrate a consistent benefit on weight: there are two trials from 20 years ago in which all the children were heavily infected and had large weight gain, but this was not consistent across all trials (Table 2).
Choking
The WHO has raised concerns about the prevalence of choking in young children (aged between one to three years), with several pages of recommendations in a newsletter about how to administer albendazole in tablet form without children choking. Although common sense might suggest this is a rare occurrence, nevertheless some might argue there is a lack of evidence on the safety of administering deworming drugs to young children in tablet form in a community setting.
Polyparasitism
Individuals and communities are often infected with more than one helminth infection (Molyneux 2005) and the WHO is currently promoting the large‐scale use of 'preventive chemotherapy'. This involves use of multiple anthelminthic drugs to treat a range of diseases, including STHs, schistosomiasis, and filariasis. Engels 2009 comments on the need for a comprehensive assessment of the impact of deworming. In the absence of such evidence, there is a need to demonstrate that a drug is effective against a particular parasite and to quantify its effects on people before combining all the drugs into a basket treatment for all helminth infections, and assuming that all components are effective.
Secular trends in worm burden
Evidence of the benefit of deworming on nutrition appears to depend on three trials, all conducted more than 15 years ago, with two from the same area of Kenya where nearly all children were infected with worms and worm burdens were high. Later and much larger trials have failed to demonstrate the same effects. It may be that over time the intensity of infection has declined, and that the results from these few trials are simply not applicable to contemporary populations with lighter worm burdens.
Quality of the evidence
Conducting field trials to test this intervention is complex and challenging, and researchers have worked hard to generate this body of research evidence. There is now a reasonable amount of evidence from trials in a range of settings, including high, moderate, and low burden areas. There have also been ten trials (Analysis 4.1) that have assessed the effects of multiple doses of deworming, four of which were cluster‐RCTs. These are particularly important because they can detect the 'real life' community level effects of treatment that include possible effects from a reduction in worm transmission (Bundy 2009).
Potential biases in the review process
Statistical errors in analysis
Of the eight cluster‐RCTs, three did not take adequate account of cluster randomization (Alderman 2006 (Cluster); Hall 2006 (Cluster); Rousham 1994 (Cluster)). This has the potential substantive impact on the interpretation of the trials. For example, the significant difference between intervention and control quoted on the cover of the BMJ for Alderman 2006 (Cluster) assumed 27,995 children had been individually randomized. When we clarified this with the trial authors, they provided the BMJ with a correction, which showed that no significant difference was detected in weight gain between intervention and control groups; this corrected result has been used in the meta‐analysis in this trial.
School attendance
Advocates of deworming have emphasised the potential impacts on school attendance, on the basis of the influential econometric trial Miguel 2004 (Cluster). The recent replication trials of Miguel 2004 (Cluster) substantiate our concerns in the previous version of this Cochrane Review about the high risk of bias in this trial (Aiken 2015; Davey 2015). In particular the replication trials raise concerns about the validity of combining the school attendance data across years, since this involves a non‐randomized before and after comparison. We have thus presented the corrected separate year estimates in this review, and present the longest follow‐up time point in line with our a priori analysis strategy.
Miguel 2004 (Cluster) also reported data on school attendance at one year of follow‐up, in two groups: group 1 versus group 2+3; and group 2 versus group 3. As outlined in the previous edition of the review, it is methodologically incorrect to combine these in meta‐analysis as they are not independent (Taylor‐Robinson 2012). The analysis in the previous edition presents each comparison separately (Analysis 4.7 in Taylor‐Robinson 2012), both with modest effects, and both non‐significant in the meta‐analysis (including Watkins 1996) and this is not repeated in this edition.
Nutritional outcomes
The included trials reported a range of nutritional status outcomes. For meta‐analysis, we did not use nutritional data expressed as z‐scores or percentile scores calculated on the basis of reference standards, or dichotomised z‐ or percentile scores (eg proportion stunted with height‐for‐age z‐score < ‐2). As these data were derived from the absolute values, we used these values for evidence of benefit. We knew the nutritional data would be captured in the absolute values and wanted to reduce selective reporting through collection of multiple variables from papers that are all derived from the same basic outcomes measured in the trial. We noted that in some trials there was a discrepancy between what was measured and what was reported; eg Nokes 1992 recorded but did not report anthropometric data. This is a concern as it may indicate selective reporting. However, we have systematically reported all relevant outcomes not included in meta‐analysis in Table 14.
Subgroup analyses
Some trials presented data from subgroups, selected on the basis of factors such as infection status (Beach 1999; Fox 2005; Greenberg 1981), location (Koroma 1996), age (Stoltzfus 2001), frequency of treatment (Stoltzfus 1997 (Cluster)), and sex (Lai 1995). These comparisons were not randomized and have not been included in meta‐analysis. Two trials, one of which one was a cluster‐RCT, demonstrated improvements in nutritional outcomes in subgroup analyses (Stoltzfus 1997 (Cluster); Stoltzfus 2001). We have reported these data in Table 14.
Agreements and disagreements with other studies or reviews
A review and meta‐analysis by Hall 2008, funded by the World Bank, presented evidence in favour of an effect of deworming on weight gain (MD 0.21 kg, 95% CI 0.17 to 0.26, 11 trials). This analysis differs from our analyses of weight gain in a number of respects: it was not a protocol‐driven systematic review; the review excluded trials in lower prevalence areas (< 50%); pooled results were presented without exploration of significant heterogeneity; it combined trials that included both screened and unscreened children; it included trials excluded from our review on the basis of methodological quality; it included data from subgroup analyses; and included data unadjusted for cluster randomization.
The narrative review, Albonico 2008, explored the evidence for the impact of deworming on pre‐school age children, and concluded that deworming has been shown to improve growth. Their analysis differed from our analyses in a number of ways: a different population was considered, although our review considers data from this subgroup; it was not a protocol‐driven systematic review; it included trials excluded from our review; it was a narrative summary rather than meta‐analysis of data; it reported results from subgroup analyses; it reported point estimates without taking into account statistical significance; and it included data unadjusted for cluster randomization. The authors state: "A few trials have failed to show any impact of deworming on growth". This is at odds with our interpretation of the reliable randomized comparisons of nutritional outcomes in this review, which suggests that most trials have failed to show an effect on nutrition.
Gulani 2007 undertook a systematic review of the effects of deworming on haemoglobin, and reported a marginal increase in mean values that could translate into small reduction (5% to 10%) in anaemia in a population with a high prevalence of intestinal helminths. This systematic review differs from our analysis of haemoglobin in a number of respects: it included trials in adults and pregnant women and it included trials excluded from our review on the basis of methodological quality.
Other advocates of deworming, such as Bundy 2009, have argued that many of the underlying trials of deworming suffer from three critical methodological problems: treatment externalities in dynamic infection systems, inadequate measurement of cognitive outcomes and school attendance, and sample attrition. We agree with these points. However, externalities will be detected by large cluster‐RCTs and there are now nine trials such as this included in this review, and the externalities previously reported in Miguel 2004 (Cluster) were not found in the replication analysis after various coding and classification errors had been corrected (Aiken 2015).
Authors' conclusions
It is good medical practice that children known to be infected with worms should receive treatment. This is obvious and not the subject of this Cochrane Review.
There is now good evidence to show that routine, repeated deworming public health programmes at a large scale have little or no benefit on average biomedical parameters or school performance. Current evidence does not support large public health programmes of deworming in developing countries.
The replication of the Miguel and Kremer trial highlighted a number of errors in the original analysis which have been corrected. This demonstrates the value of replication in trials that are controversial and where there is a lack of clarity over methods and the analysis.
The quality of evidence is graded as moderate on most of the outcomes, in relation to demonstrating little or no effect of community deworming. This means that research could possibly have important impact on the confidence of the results and alter the effect. Therefore, further research may be useful, but this needs to be balanced against the declining worm burdens worldwide and the absence of any good evidence of an effect given the current research.
Authors of trials, whether they are small or large, should publish the results of the trials promptly irrespective of the findings, in line with the basic principles of research integrity (Garner 2013). We encourage the authors of the Vietnam trial to publish their results.
Feedback
Ted Miguel and Michael Kremer, 11 January 2013
Summary
Dear Dr. Taylor‐Robinson, Dr. Maayan, Dr. Soares‐Weiser, Dr. Donegan, and Dr. Garner:
We are writing to clarify several points that you raise in your recent 2012 Cochrane review of deworming regarding our 2004 paper "Worms: Identifying impacts on education and health in the presence of treatment externalities" in Econometrica.
In particular, we have four main concerns about the discussion of our piece in the recent review, and believe that they could change the assessment of the quality of the evidence presented in our paper. We list these points here in the letter below, with a brief discussion of each point. We then discuss several additional points in the attached document below, following this letter. We hope that these detailed responses to your review will start a productive discussion about the interpretation of the evidence in the Miguel and Kremer (2004) paper.
(All page numbers listed below refer to the July 2012 version of your review, with "assessed as up‐to‐date" as May 31, 2012.)
We recognize that writing a Cochrane review is a major undertaking, and we appreciate the time you have taken to read our paper, and the dozens of other papers covered in the review. We hope that this note can serve as the starting point for discussion, both in writing and via phone, if appropriate.
Our four points all relate to the claim made on page 6 of your review, and repeated throughout the review, about the Miguel and Kremer (2004) paper:
"Miguel 2004 (Cluster) has a high risk of bias for sequence generation, allocation concealment, blinding, incomplete outcome data and baseline imbalance."
We have serious concerns about the claims you make about the risk of bias for baseline imbalance, incomplete outcome data, and sequence generation. We discuss these in turn below.
Point (1): A leading issue is your current assessment of the quality of evidence on school attendance and participation, which is the main outcome measure in the Miguel and Kremer (2004) trial. Several concerns are raised, including: a lack of baseline values for these measures (leading to a risk of baseline imbalance), and statistically significant impacts for only one of the comparisons considered. The quotes from your review are as follows:
[p. 21] "For school attendance (days present at school): (Miguel 2004 (Cluster) Table 6; Analysis 5.4) reported on end values for attendance rates of children (1999, Group 1 versus Group 3), and found no significant effect (mean difference 5%, 95% CI ‐0.5 to 10.5). No baseline values were given so there is potential for any random differences between the groups to confound the end values."
[p. 24] "Similarly, for school attendance, the GRADE quality of the evidence was very low. One quasi‐randomized trial (Miguel 2004 (Cluster) reported an effect, which was apparent in only one of the two comparisons in up to a year of follow up, and not apparent in the one comparison after one year. Miguel 2004 (Cluster) measured attendance outcomes directly, unlike the other two trials (Simeon 1995; Watkins 1996) which measured attendance using school registers, which may be inaccurate in some settings. However, in Miguel 2004 (Cluster), the values for school attendance were end values and not corrected for baseline. Thus random differences in baseline attendance between the two groups could have confounded any result."
We feel that these concerns are misplaced, and explain why here. We first discuss concerns about "baseline imbalance".
First, we in fact do have baseline data on school participation (our preferred measure) for one of the comparisons that you focus on. The authors of the Cochrane appear to have missed this data in our paper. In Table VIII, Panel A, there is a comparison of 1998 school participation for both Group 2 and Group 3, when both were control schools. There is no statistically significant difference in school participation across Group 2 and Group 3 in 1998, and if anything school participation is slightly lower in Group 2 (‐0.037, s.e. 0.036). This makes the difference between Group 2 and Group 3 in 1999 (0.055, s.e. 0.028), when Group 2 had become a treatment school, even more impressive, since at baseline Group 2 had slightly lower school participation. We respectfully request that the authors of the Cochrane review include this data as evidence of baseline balance in our key outcome measure, school participation, and that they edit their claim that we do not have any such evidence.
It is interesting to note that, if we take the difference between Group 2 and Group 3 at baseline seriously, then the overall effect for this "year 1" comparison is 3.7 + 5.5 = 9.2 percentage points. This is almost exactly the same as the 9.3 percentage point effect in the other "year 1" comparison that the Cochrane authors focus on (Group 1 versus Groups 2 and 3 in 1998). Taken together, this is quite striking evidence that the first year of deworming treatment significantly improves school participation. The Cochrane authors' repeated concerns in their review about baseline balance being critical in randomized experiments suggests (to us) that they might find it methodologically preferable to use a "difference‐in‐difference" design that explicitly controls for any baseline differences across treatment groups, rather than the standard unbiased "endline" comparison across treatment groups. If this is in fact the case, then the relevant year 1 deworming treatment effect for the Group 2 versus Group 3 comparison (for which we have baseline data, as noted above) is the 9.2 percentage point estimate, which we note is significant at 99% confidence.
Second, regarding baseline data on school attendance, we discuss that there is indeed evidence from school registers that recorded attendance is indistinguishable in the three groups of schools in early 1998 (in Table I). While the register data has its weaknesses – precisely the reason we developed the much more rigorous approach of unannounced school participation checks, combined with tracking of school transfers and drop‐outs – it is used in other trials, and in fact the Cochrane review considers school register data sufficiently reliable to include a trial (Watkins 1996) that uses it in their meta‐analysis of school attendance.
We are puzzled as to why the evidence in the Watkins (1996) trial is included at all in the Cochrane review if similar register data is considered unreliable when Miguel and Kremer (2004) use it. If school register data is considered (largely) unreliable, then the Watkins (1996) article should be excluded from the review, in which case the "meta‐analysis" of school attendance and participation impacts will yield estimated effects that are much larger and statistically significant (since the Watkins impact estimates are close to zero). If the register data is considered (largely) reliable, then the Watkins (1996) trial should be included in the review, but the baseline register data in Miguel and Kremer (2004) should be considered as evidence that we do in fact have baseline balance on school participation. But there is an inconsistency in how register data is considered across the two trials. This seemingly inconsistent approach taken by the authors raises questions about the evenhandedness of the Cochrane review.
In fact, the appropriate use of school register data is more subtle than the Cochrane authors currently consider, since its use as baseline data may in fact be appropriate even if it is inappropriate for use as outcome data. There are at least two reasons why. First, one of the major weaknesses of the school register data used in Watkins (1996) is that it excludes any students who have dropped out, potentially giving a misleading picture about school participation over time. However, this concern about drop‐outs is irrelevant when we use school register data at baseline, since the universe of students considered in the Miguel and Kremer (2004) article was restricted to those currently enrolled in school in January 1998 (at the start of the school year), and thus the exclusion of drop‐outs is not a concern. Note that our use of the school register data at the start of the school year is a likely explanation for why the baseline average attendance rates we obtain using this data are much higher than the average school participation rate that we estimate over the course of the entire school year.
A second related issue is the quality of measured school attendance data conditional on student enrollment in school. Note that to the extent that differences in attendance record‐keeping prior to the introduction of the program are random across schools, they will not bias estimates of treatment impact and any "noise" in these measures will be correctly captured by reported standard errors. However, there are plausible concerns about the quality of school register data collected in treatment versus control schools in the context of an experimental evaluation, with a leading concern being that school officials could erroneously inflate figures in the treatment group. Yet once again these concerns are irrelevant in the Miguel and Kremer (2004) trial context since the baseline 1998 school register data that we present (in Table I, Panel B) was collected before any interventions had even been carried out in the sample schools, once again making the baseline school register data potentially more reliable than school register data used as an outcome.
While the data and measurement issues here are somewhat subtle, if anything they argue in favor of including the baseline school register data in assessing the baseline balance in the Miguel and Kremer (2004) paper, while excluding the school register outcome data in Watkins (1996) as potentially unreliable. Instead, the Cochrane authors completely dismiss the baseline register data in Miguel and Kremer (2004) as unreliable evidence for baseline balance, while including the Watkins (1996) data in their meta‐analysis of school participation impacts, giving it equal weight with the Miguel and Kremer (2004) school participation impact evidence (which uses more rigorous outcome data). Once again, the seemingly selective approach taken by the authors raises questions about the evenhandedness of the Cochrane review.
An important final point has to do with the claim that there might have been "random differences" across groups. Given the randomized design of Miguel and Kremer (2004), there is no systematic difference to expect there to have been such random differences. The endline comparison of outcomes across treatment groups yields unbiased treatment effect estimates. The remarkable balance across the three groups in terms of dozens academic, nutritional, and socioeconomic outcomes at baseline (Table I) makes it even more unlikely that there were large differences in school participation solely by chance. If the Cochrane authors would like to consider other characteristics (other than school participation) to gauge the likelihood that Groups 1, 2 and 3 in our trial are in fact balanced at baseline they should look at the whole range of outcomes presented in Table I of Miguel and Kremer (2004). The lack of significant baseline academic test scores across Groups 1, 2 and 3 in our sample (Table 1, Panel C) is particularly good evidence that schooling outcomes were in fact balanced at baseline, for instance. It is not clear to us why the Cochrane authors remain so concerned about baseline imbalance issues given the experimental design (which leads to unbiased estimates) and the remarkable balance we observe along so many characteristics in Table I of Miguel and Kremer (2004), and their review does not provide compelling justification for their concerns.
Moreover, in the standard statistical methods that we use, only those differences across groups that are too large to have been generated "by chance" are considered statistically significant impacts. In other words, the standard errors generated in the analysis itself are precisely those that address the risk of imbalance "by chance" given our research design and sample size. Of course, random variation that is orthogonal to treatment assignment does not alone generate bias.
Speculating about the possibility that there were simply positive impacts "by chance" in order to cast doubt on one set of results, but not doing the same when there are zero estimated impacts, again raises questions about the evenhandedness of the Cochrane review. (For instance, perhaps the “zero” impacts on Hb outcome measures in our sample were zero simply "by chance", when the real point estimates are in fact strongly positive, like the large school participation impacts we estimate. Yet this possibility is not mentioned in the Cochrane review.) In our view, the Cochrane authors do not provide sufficient justification for their fears about imbalance "by chance" in our sample, and we feel further concrete details about these concerns are needed to substantiate their assertions.
Taken together, the Cochrane review's claim that there is a "high risk of bias for … baseline imbalance" (the claim made on p. 6 and p. 136, and throughout the review) appears highly misleading to us, given the: balance in school participation we observe between Group 2 and Group 3 in 1998; the balanced school attendance based on register data across Groups 1, 2 and 3 at baseline; the balance in other measures of academic performance (including academic test scores) as well as multiple socioeconomic and nutritional characteristics at baseline; and most importantly given the randomized experimental design, which implies that there is no systematic reason why the three treatment groups would differ significantly along unobservable dimensions.
We respectfully request that the authors of the review consider these factors and reconsider their assessment regarding the claimed "high risk of bias for … baseline imbalance" in Miguel and Kremer (2004).
Point (2): There is also an important methodological point to make regarding how the authors of the Cochrane review assess the school participation evidence. At several points they note that only some of the school participation comparisons are statistically significant at 95% confidence. To be specific, the comparisons they focus on have the following estimated impacts and standard errors (from p. 130‐131 of their review):
School participation outcomes measured £ 1 year:
9.3 percentage point gain (s.e. 3.1 percentage points)
5.5 percentage point gain (s.e. 2.8 percentage points) School participation outcomes measured > 1 year:
5.0 percentage point gain (s.e. 2.8 percentage points)
It is unclear to us why the reviewers separate out the three comparisons, rather than combining the groups in a single analysis using standard analytical methods, as their principal assessment of the impact of deworming on school participation. They give no clear methodological justification for this separation. Pooling data from three valid and unbiased "comparisons" still yields an unbiased treatment effect estimate, but with much greater statistical precision, and is thus a methodologically preferable approach. At a minimum, the Cochrane authors should discuss the pooled estimates (which are the focus of Miguel and Kremer 2004) in addition to the three separate comparisons.
One simple approach to doing so that maintains the "comparisons" above, and at least goes part of the way towards using the full sample, would be to pool 1998 and 1999 data for the Group 1 versus Group 3 comparison, since Group 1 is treatment during this entire period and Group 3 is control for the entire period. The distinction between < 1 year and > 1 year outcomes seems rather artificial to us, as discussed further below. It is unclear to us why the Cochrane authors never present this comparison of Group 1 versus Group 3 for 1998 and 1999 pooled together.
The preferred analysis in the Miguel and Kremer (2004) paper pools multiple years of data, and all groups, to arrive at the most statistically precise estimated impact of deworming on schooling outcomes. This includes both school participation outcomes, as well as academic test score outcomes (which the Cochrane authors currently exclude since in the paper we only present these “pooled” test score results, rather than the simple differences across treatment groups). If the Cochrane authors would like to see the simple differences across treatment groups for the academic test scores, we would be delighted to share the data with them. (To be clear, the test score impact estimates in Miguel and Kremer (2004) come from a regression analysis that relies on the experimental comparison between the treatment and control groups, and is not a retrospective analysis based on non‐experimental data.)
In our view, the Cochrane authors do not provide adequate statistical justification for splitting results into the different "comparisons", or into "year 1" versus "year 2" impacts. "Pooling" these different comparisons, as we do in the Miguel and Kremer (2004) paper, is standard with longitudinal (panel) data analysis with multi‐year panels, and is appropriate for those that care about deworming impacts at multiple time frames, ie at less than one year and at more than one year of treatment. Use of our full sample would immediately lead to the conclusion that there are in fact positive impacts of deworming on school participation in our sample, with very large impact magnitudes and high levels of statistical significance. This is the conclusion of the Miguel and Kremer (2004) paper, and a quick look at the comparisons presented above also indicate that there are strong impacts: all three of the comparisons have large impact estimates and all three are statistically significant at over 90% confidence, with one significant at over 99% confidence and another nearly significant at 95% confidence (despite the data being split up into the three different comparisons). By treating each comparison independently and in isolation, the authors are reaching inappropriate conclusions, in our view.
To illustrate why the approach taken by the current version of the Cochrane review is inappropriate, imagine the simple thought experiment of splitting up the data from Miguel and Kremer (2004) into "quarters" (three month intervals) rather than years of treatment. There is no obvious a priori reason why this should not be as valid an alternative approach as the >1 year and <1 year approach in the Cochrane review, as some other reviewers might instead have been interested in the impact of deworming treatment over intervals shorter than one year. Then we would have 2 comparisons in quarter 1 of treatment (Group 1 versus Groups 2 and 3 in early 1998, and Group 2 versus Group 3 in early 1999), 2 comparisons in quarter 2 of treatment, 2 comparisons in quarter 3, 2 comparisons in quarter 4, and 1 comparison in each quarter from 5 through 8 (Group 1 versus Group 3 in 1999). This approach would generate 12 valid "comparisons" of treatment and control schools over multiple time periods, but by slicing up the data ever more finely and reducing the sample size considered in each comparison, it is almost certain that none of these comparisons would yield statistically significant impacts of deworming on school participation at 95% confidence, even though the average estimated effect sizes would remain just as large. This would clearly not be an attractive methodological approach. You could even imagine considering a month by month treatment effect estimate, which would yield 36 different “comparisons”, all of which would be severely underpowered statistically.
However, we view the Cochrane review's slicing of our full dataset into three comparisons (two for year 1 treatment, and one for year 2), rather than conducting the analysis in the full dataset in much the same way. As we show in Miguel and Kremer (2004), when the data from all valid comparisons is considered jointly, in order to maximize statistical precision using standard longitudinal (panel) data regression methods, the estimated impacts are large and highly statistically significant. Just to be clear, we do not use any controversial statistical methods, and our results do not rely on any non‐experimental comparisons. The regression analyses in our paper rely entirely on the variation in treatment status induced by the experimental design of the trial, and thus are just as appropriate analytically as the simple "treatment minus control" differences that the Cochrane authors focus on. In our view, the most robust analytical approach should use our full dataset, rather than the (in our view) more fragmented way of presenting the results in Table 6 of your review, which leads to less statistical precision and no greater insight.
If the Cochrane authors feel that there is a strong a prior reason to focus on year 1 treatment results separately from year 2 treatment results, then at a minimum they should consider both of the year 1 "comparisons" that they focus on jointly (ie Group 1 versus Groups 2 and 3 in 1998, and Group 2 versus Group 3 in 1999), in order to improve statistical precision and thus generate impact estimates with tighter confidence intervals. If they wish to strictly employ the same exact "comparison" groups over time, then they should at a minimum pool the 1998 and 1999 data and focus on the Group 1 versus Group 3 comparison. Doing either would yield an unambiguous positive and statistically significant impact of deworming on school participation in our sample.
We respectfully request that the authors of the review consider these suggestions and reconsider their assessment regarding the claimed lack of statistically significant school participation impacts in Miguel and Kremer (2004).
Point (3): The Cochrane review concludes that our trial has a "high risk of bias for … incomplete outcome data" (p. 90). We believe this point is simply incorrect when applied to our school participation data, as we explain here. The review authors focus on the lack of detail in Miguel and Kremer (2004) regarding the collection of Hb data, but then unfairly use this lack of clarity to downgrade the reliability of all data in the trial, including the school participation data. The exact quote from the review is as follows:
[p. 15] However, results for health outcomes were presented for the 1998 comparison of Group 1 (25 schools) versus Group 2 (25 schools). Details of the outcomes we extracted and present are:
• Haemoglobin. This was measured in 4% of the randomized population (778/20,000). It was unclear how the sample were selected.
The Hb sample was a random (representative) sub‐sample of the full sample, chosen by a computer random number generator. Appendix Table AI of the Miguel and Kremer (2004) paper does discuss how the parasitological and Hb surveys were collected jointly in early 1999. Table V mentions that the parasitological data in 1999 was collected for a random sub‐sample. A random subset of those individuals sampled for parasitological tests also had Hb data collected; this was not explicitly stated but should have been. The reason for the relatively small sample for Hb testing was simply that a random (representative) sub‐sample was selected for this testing. For both Hb and parasitological tests, the time and expense of testing the entire sample of over 30,000 school children was prohibitive, hence the decision to draw a representative sub‐sample. Collection of this data for a representative sample should reduce concerns about bias due to incomplete outcome data and selective attrition.
[p. 15] • Weight and height. This was measured in an unknown sample of the 20,000 children. No sampling method was given.
Section 3.1 of Miguel and Kremer (2004) does state explicitly that the anthropometric data was collected during pupil questionnaires at school during 1998 and 1999. These were collected in standards (grades) 3‐8, rather than in all grades, and for that reason there is only data on a subset of the full sample. Height and weight data was collected on all individuals in standards 3‐8.
We acknowledge that the discussion of sampling for hemoglobin outcomes was unclear in Miguel and Kremer (2004). However, the fact that we only have Hb data for a random subset in no way affects the attrition rate for school participation data, which was collected for the entire sample. There is no problem with attrition in the main outcome measure in the Miguel and Kremer (2004) trial, namely, school participation. In fact the school participation data is unusually rigorous. We tracked individuals as they transferred across schools, or dropped out of schools, and collected school attendance on unannounced visit days to get a more representative picture of actual school participation. This is in sharp contrast to most other trials.
For instance, Watkins (1996), which shows smaller school attendance impacts than Miguel and Kremer (2004), only considers school attendance based on register data, among those attending school regularly, missing out on school drop‐outs and transfers entirely. Yet that trial surprisingly received equal weight with Miguel and Kremer (2004) in the meta‐analysis of school attendance carried out in this Cochrane review.
Taken together, the claim that there is a "high risk of bias for … incomplete outcome data" (the claim made on p. 6 and p. 136, and throughout the review) appears incorrect to us, given the remarkably high quality of follow up data for school participation, which serves as the main outcome of the trial, and the collection of a representative sub sample for both Hb and nutritional measures.
We respectfully request that the authors of the review consider these factors and reconsider their assessment regarding the claimed “high risk of bias for … incomplete outcome data” in Miguel and Kremer (2004), especially in regards to the school participation data.
(One small point: In the summary of findings table on page 5, it is stated that we only have school participation data for 50 clusters, rather than 75 clusters. This is incorrect, since even using the Cochrane authors' three "comparisons", there are 75 distinct clusters that contribute to the year 1 evidence for Group 1 versus Groups 2 and 3 in 1998, for instance.)
Point (4): The Cochrane review also considers the Miguel and Kremer (2004) trial to have “a high risk of bias for sequence generation” [p. 6].
In particular, it discusses the quasi‐random allocation of the 75 clusters:
[p. 14] "Eight trials were cluster randomized (Alderman 2006 (Cluster); Awasthi 2008 (Cluster); Awasthi 2001 (Cluster); DEVTA (unpublished); Hall 2006 (Cluster); Rousham 1994 (Cluster); Stoltzfus 1997 (Cluster)), one was a trial with quasi‐random allocation of the 75 clusters (Miguel 2004 (Cluster))".
It is never clearly specified why the randomization approach makes the trial "quasi‐randomized". It may be due to the use of an alphabetical "list randomization" approach, rather than a computer random number generator, but if so, this is never laid out explicitly by the Cochrane authors. The remarkable baseline balance on a wide range of characteristics (educational, nutritional, socioeconomic, etc. shown in Table I of Miguel and Kremer 2004) across 75 clusters and over 30,000 individuals surely helps alleviate these concerns. We would like to obtain more detailed information from the Cochrane authors on why the research design in Miguel and Kremer (2004) is considered to have a "high risk of bias". This is never explicitly discussed in the review.
We respectfully request that the authors of the review consider these factors and reconsider their assessment regarding the claimed "high risk of bias for … sequence generation" in Miguel and Kremer (2004).
We carefully read through the entire document and noted additional instances where we had questions and concerns below (following this letter), and note the relevant page numbers in your review.
Finally, we also would like to briefly mention two working papers that we believe could usefully be incorporated into future versions of the Cochrane review on deworming. One working paper (Baird et al.) trials long‐term impacts of deworming treatment on labor market outcomes. We are both co‐authors on this paper. We are currently finishing the write up of this paper and hope to submit it to a working paper series and a journal in 2013, and at that point we will share that paper with your group. That trial shows very large long‐run impacts of deworming treatment on labor market outcomes, up to ten years after the start of the primary school deworming project that we trial. The second is a working paper by Dr. Owen Ozier of the World Bank, which examines long‐run educational impacts on individuals who were very young children at the start of the Kenya deworming project, and finds large positive test score effects. One advantage of Ozier’s trial is his ability to compare outcomes across schools and across birth cohorts within those school communities, allowing him to include "school fixed effects" that control for any baseline differences across schools. This methodological approach addresses any lingering concerns about baseline "imbalance" across treatment groups.
We look forward to starting a discussion of these issues with your team, and we thank you for the time you have taken to consider them. We realize that this is an extremely time‐consuming process for your entire team, given the detailed reading you need to carry out for literally dozens of trials, and we appreciate your willingness to consider these points.
Additional comments on the Cochrane review: (Cochrane text noted in italics, page numbers noted)
The Cochrane authors have the following discussion of the exam score data and school sample:
[p. 67] "Participants Number analysed for primary outcome: … Unclear for exam performance and cognitive tests Inclusion criteria: none explicitly stated. “Nearly all rural primary schools” in Busia district, Kenya, involved in a NGO deworming programme were studied, with a total enrolment of 30,000 pupils aged six to eighteen. Exclusion criteria: girls > 13 years old".
The claim that there was no explicit inclusion criteria stated in the paper for the exam data appears inaccurate. Section 7.2 of Miguel and Kremer (2004) discusses our attempts to test all students, including efforts to administer exams even to those students who had since dropped out of school (see footnote 52).
In terms of the inclusion of schools in the sample, there were a total of 92 primary schools in the trial area of Budalangi and Funyula divisions in January 1998. Seventy‐five of these 92 schools were selected to participate in the deworming program, and they form the analysis sample here. The 17 schools excluded schools from the program (and thus the analysis) include: town schools that were quite different from other local schools in terms of student socioeconomic background; single‐sex schools; a few schools located on islands in Lake Victoria (posing severe transportation difficulties); and those few schools that had in the past already received deworming and other health treatments under an earlier small‐scale ICS (NGO) program.
The Cochrane authors make the following point about worm infection rates, which relates to potential baseline imbalance across treatment groups:
[p. 68] "Group 1 schools have an overall prevalence of 38% heavy/moderate worm infection in 1998, compared to the initial survey in control schools in 1999, where it was 52%."
This is a misleading comparison. The comparison of Group 1 worm infection in 1998 versus Group 2 worm infection in 1999 is simply inappropriate, given the well‐known variability across seasons and years in worm infection rates (as a function of local weather, precipitation, temperature, etc.). There is abundant health and nutritional data from pupil surveys for Groups 2 and 3 at baseline in 1998, and they indicate that these groups appear very similar to Group 1 at baseline (see Table I of Miguel and Kremer 2004) but no parasitological data was collected for Groups 2 and 3 in 1998, nor for Group 3 in 1999, since it was considered unethical to collected detailed worm infection data in a group that was not scheduled to receive deworming treatment in that year. Once again, standard errors for the comparison of outcomes among different treatment groups take into account the possibility of random differences at baseline, and thus statistical significance levels already reflect the possibility that there is some random baseline variation across schools, but this variation alone of course does not cause bias.
The Cochrane authors have the following discussion of our health data:
[p. 68] "However, in a personal correspondence the authors state that there is no health data for Group 3 schools for 1999."
This claim is not entirely accurate, and must be the result of a misunderstanding. There is abundant health and nutritional data from pupil surveys for Group 3 in 1999, but no parasitological data was collected for Group 3 in 1999, since it was considered unethical to collected detailed worm infection data in a group that was not scheduled to receive deworming treatment in that year.
[p. 68] 27/75 schools were involved in other NGO projects which consisted of financial assistance for textbook purchase and classroom construction, and teacher performance incentives. The distribution of these other interventions is not clear, but the authors state that these schools were stratified according to involvement in these other programmes.
[p. 70] The intervention was a package including deworming drugs for soil transmitted helminths, praziquantel to treat schistosomiasis in schools with > 30% prevalence, and health promotion interventions. In addition 27/75 schools were involved in other NGO projects which consisted of financial assistance for textbook purchase and classroom construction, and teacher performance incentives. The distribution of the latter interventions is not clear. These co‐interventions confound the potential effects of deworming drugs to treat STHs. However, the authors kindly provided a re‐analysis of their data, with the praziquantel treated schools removed from the analysis. This represents as subgroup analysis of the original quasi‐randomized comparison".
Given that these other interventions had no measurable impacts on educational outcomes (as reported in several other articles), and that they are balanced across our treatment groups, these prior interventions are not a major concern for the analysis.
Sincerely,
Ted Miguel and Michael Kremer
I agree with the conflict of interest statement below:
I certify that we have no affiliations with or involvement in any organization or entity with a financial interest in the subject matter of our feedback.
Reply
We appreciate these helpful and detailed comments. We have checked through these carefully, and responded to the key points below.
Risk of bias assessment contested (point 1).
Miguel and Kremer were concerned that we had been unduly harsh on assessing the risk of bias of their trial in several points in their comments. We have reassessed this in the light of their comments and the recent replication, which is helpful as it clarifies more details on the methods.
Baseline imbalance: We agree and now move the risk of bias in relation to imbalance at baseline to "low". The remaining criteria of the risk of bias remain unaltered.
Incomplete data: Thank you for your additional information about the methods. This is also contained in the replication analysis, and this has been adjusted to low.
Quality of the evidence in relation to schooling and advocacy of combining results (point 2).
Miguel and Kremer were concerned that the quality of the evidence on school attendance was ranked as "very low". We thank them for their concern and have revaluated the reasons for downgrading, taking into account the pure and the statistical replication. It remains ranked as very low with full justification given in the 'Summary of findings' table footnotes.
Miguel and Kremer also advocate combining results for school participations from the three school participation results from quasi‐randomized comparisons. Just to recap, for year 1 follow‐up, there are results from:
Group 1 vs Groups 2+3;
Group 2 vs Group 3.
And at two years of follow‐up, results from Group 1 vs Group 3.
We have not combined the estimates from the quasi‐randomized comparisons in meta‐analysis because they are not independent. However the separate estimates are all documented in the review.
Due to the trial design the pooled estimate that Miguel and Kremer prefer contains a non‐randomized before and after comparison, as clarified in the replication trials.
The second point the authors raise in the paragraph "However, we view the Cochrane's slicing…". We have addressed this by combining the multiple dose trials in one analysis, using the longest follow‐up time point. Justification for this is provided in the review text. This is a helpful comment and has helped with shortening the review.
Losses to follow‐up on haemoglobin and school attendance (point 3).
Thanks for these clarifications about the sampling for height, weight, and Hb. These are noted in the review.
For school attendance, there is downgrading as stated in the table so that the GRADE assessment of the quality is very low, for risk of bias, imprecision, and indirectness. The missing data and many of the methodological issues debated here are now made much clearer in the replication trials. The other information that is highly relevant is the health promotion co‐intervention.
The GRADE table is agreed by all authors after considerable discussion. It is also checked by two other editors. This is based on information in the original trial reports and now, with your trial, the two papers concerning the replication.
Risk of bias on sequence generation; and additional papers (point 4).
Thank you for this information.
This is a quasi‐randomized method of allocation, as described in the Cochrane Handbook for Systematic Reviews of Interventions, and as clarified in the replication trials.
Thanks for these additional papers you mention. They were considered by the authorship team and do not meet the inclusion criteria for the review.
Contributors
David Taylor‐Robinson, Paul Garner, Karla Soares‐Weiser, Sarah Donegan.
Harold Alderman, 14 January 2013
Summary
Shortly after my paper on deworming in Uganda was published in the BMJ, I had an exchange of correspondence with Dr. Garner regarding the standard errors reported in one table. After that exchange I shared the following letter with the BMJ and with him in April 2007:
Dear Editor,
Prof. Paul Garner has kindly pointed out that, in an article published in the BMJ, my coauthors and I inadvertently failed to adjust standard errors in one of the tables for cluster based sampling. While table 2 of that paper reports means for growth in grams of 2413 [CI=2373 ‐ 2454] and 2259 [CI=2216 ‐ 2301] for the treatment and control groups respectively, once the design effect is taken into consideration the confidence intervals should, in fact, be [CI=2295 ‐ 2533] and [CI=2121 ‐ 2396].
The conclusions of the trial, however, are unaffected as they are based on the multivariate regressions reported in table 3 for which the standard errors had been corrected for cluster based sampling. For example, the confidence interval for the finding that the children who attended child health days every six months where deworming medicine was provide had a significantly greater weight gain than similar children who attended child health days at which albendazole was not provided is unaffected; the CI for the difference in weight gain remains [59g ‐ 262 g]."
Recently the BMJ has invited me to submit a letter addressing the earlier comments as well as more recent variations of that theme. I believe that it is sufficient to indicate that the results presented in the multivariate analysis remain the basis for the conclusion of the trial. Given the heterogeneity of ages in the trial population and the fact that the velocity of weight gain is dependent on age, table 2 was presented for background only while the primary analysis was presented in table 3. The results in this table control for these covariates as well as the duration of time between visits or the total time a child participated in the child health days organized for his or her community. These results provide more precise estimates.
Harold Alderman
International food Policy Research Institute
I agree with the conflict of interest statement below:
I certify that I have no affiliations with or involvement in any organization or entity with a financial interest in the subject matter of my feedback.
Reply
Thank you for this information which is duly noted.
Contributors
David Taylor‐Robinson, Paul Garner, Sarah Donegan.
Christian Smith (Givewell ‐ Research Analyst), 4 October 2016
Summary
| Feedback Comments | Author response |
| Comment: The research team at GiveWell has a handful of clarifying questions for the authors of the review on deworming treatments for children. | |
| Was there a protocol for the most recent update to the Cochrane Review? If so, could it be shared? | Updates are broadly guided by the original protocol and review and standard practice is to document the changes made in the “history” section. This protocol was first published in 1997 and the first edition of the review was published in 1998. At this time there was no online repository for Cochrane protocols; we have therefore made the original protocol available via the "Related content" section here: http://cidg.cochrane.org/our‐reviews Cochrane policy is that when a team continue updating a review where the question and inclusion criteria stay the same, the team draw on new information, comments and criticisms, and a review of the current debates, background, objectives, inclusion criteria and methods (see Table 2. In Garner et al. BMJ 2016; 354: i3507). No fresh protocol is prepared unless it is a new team, or there are substantial changes to the inclusion criteria or methods used in the analysis. However, the author team should ensure the changes are transparent and summarized in the “What’s new/history section” and that is present. |
| ‐The "History" section at the end of the review notes: "We changed the classification of Stephenson 1989 and Stephenson 1993. Previously these trials were in the ‘all children in an endemic area’ category, whereas now they are classified in the 'children with infection'. This decision was based on reviewing the trials with parasitologists and examining the prevalence and intensity of the infection where clearly the whole community was heavily infected” (p. 154). Could any information be shared about the process of consulting parasitologists on this topic or the output of those consultations?’ | The Stephenson studies were reviewed as part of our last update, since they were a source of heterogeneity. We were examining how best to take this into account. We noted that in the methods section the authors noted: "The subjects consisted of all available children in the lower grades (Standards I and II) in Mvindeni Primary School in Kwale District, Coast Province, Kenya, an area where our previous work had shown that virtually all of the primary schoolchildren had hookworm (predominantly Necator americanus) and T. trichiura infections and that 50% were infected with A. lumbricoides."We had missed this information earlier. We consulted with LSTM parasitologists on this. They noted that virtually everyone was infected, and most were infected with at least two parasites and at least a third with three. In addition, the average hookworm loads put all the children into the moderate/heavy infection category. This is why this population was selected for the Stephenson studies. In this respect, the population chosen were equivalent to a population that had been screened to just include infected children. These indeed were quite old studies. So we made a decision that these studies were wrongly included in “treating the whole community” as everyone in the study population was infected. Hence they were reclassified. |
| ‐Did you consult parasitologists about Watkins 1996? If so, how did you reach the conclusion to include that study in the “all children in an endemic area” category? | Our reading of the Stephenson studies was that the intention was to include a population where all children were infected. You ask about some other studies and why these were not reclassified as well (Watkins, Cruz, and Pollitt 1996). These were not in such high prevalence areas, but we take the point about the need to be systematic and will indeed have a closer look at their background prevalence in the update of the review. |
| ‐Could you share any information about the rationale for the change in your classification schema from using "target population treated" to "all children in an endemic area" and "screened for infection" to "children with infection"? Does the change affect the classification of any studies included in the 2012 review other than Stephenson 1989 and Stephenson 1993? | This is because we judged that this was a better way of doing it. If all the children were infected (either because of the massively high worm infection burden, or as a result of screening), this was a clear way to describe the population. This is the whole reason for carrying out updates, to refine the analysis and make it clearer for the reader. |
| ‐Is it the case that the Stephenson 1989 and Stephenson 1993 involved populations where every individual was infected? If not, was there a clear process for determining which studies fit under the "children with infection" classification? We are particularly curious about the rationale for including Stephenson 1993 under the "children with infection" classification while excluding Watkins 1996 from that classification. | As above. Virtually all of the children in the Stephenson studies had hookworm and Trichuris, and half had ascaris. Indeed, the intention of the authors was to select them on this basis. |
| ‐Croke et al. reported that adding Stephenson 1993 back into a fixed effects version of Analysis 4.1 leads to a statistically significant weight effect, but they do not appear to report the random effects meta‐analysis result (Croke at al. 2016, Table 2, p. 27). How would adding the relevant Stephenson 1993 result affect the random effects meta‐analysis results in Analysis 4.1? | When we realised that Stephenson 1993 was in an area where everyone included was infected we moved the study into a more appropriate comparison, as outlined above. We stand by this analysis and change. What you are proposing is not a sensitivity analysis, but seems to be “what would we get if we did this‐and would it be significant?” We believe it is not helpful to shift the study around or tweak the statistical analysis retrospectively as there is a risk of the analysis being driven by the outcome of the analysis rather than first principles of whether the analysis is appropriate. In addition, statistical significance is not a critical flag of whether something works: the size of the effect is also critical (see below). |
| ‐If Analysis 4.1 resulted in a statistically significant weight gain, would the authors still maintain their position that mass deworming of children in endemic areas “does not improve average nutritional status" (p. 2)? | It is not just a matter of statistical significance. There is a danger in chasing whether a result is statistically significant, this can be misleading, particularly when combined with multiple analyses of the same data. What is more important in drawing conclusions with limited and mixed data is to consider heterogeneity in the meta‐analysis, and to interpret the results in light of this. The GRADE approach is used in the review, and the assessment takes into account the effect size, the precision, the risk of bias, the directness of evidence, and heterogeneity between estimates. The GRADE assessment draws on the estimate of weight change from the main analysis (0.08 kg, 95%CI 0.11 to 0.27; analysis 4.1); and the GRADE uses a sensitivity analysis (6.1). In this analysis, which includes only studies with low risk of bias for allocation concealment, there was no evidence of an effect (0.01, 95%CI ‐0.13 to 0.15; analysis 6.1). This analysis is dominated by a single study, so to double check our inferences for this response, we conducted a further sensitivity analysis with studies at clear risk of bias excluded (Awasthi 2000, and Awasthi 1995); this provides an estimate of ‐0.01 kg (95% CI ‐0.15 to 0.13). Thus our published estimate and GRADE stand, downgraded on risk of bias and inconsistency, and we conclude “there may be little to no effect on weight" based on the main analysis estimate. |
Christian Smith,
Do you have any affiliation with or involvement in any organisation with a financial interest in the subject matter of your comment?
As of October 2016, GiveWell recommends two charities that conduct mass drug administration programs for STH and Schistosomiasis—The Schistosomiasis Control Initiative and the Deworm the World Initiative, led by Evidence Action.
Reply
In the column above.
Contributors
David Taylor‐Robinson, Paul Garner.
Acknowledgements
We thank all people who gave of their time and expertise to comment on this Cochrane Review and also the authors of the first version of this Cochrane Review (Dickson 2000a). We are grateful to Dr. David Sinclair for his advice and assistance in preparing 'Summary of findings' tables.
This document is an output from a project funded by the UK Department for International Development (DFID) for the benefit of developing countries. The views expressed are not necessarily those of DFID.
This 2015 review update was partly supported by a grant from the Evidence and Programme Guidance Unit, Department of Nutrition for Health and Development, WHO.
The academic editors for this Cochrane Review are Hellen Gelband and David Sinclair.
Appendices
Appendix 1. Authors' judgment on risk of bias
| Potential bias | Authors' judgement |
| Random sequence generation (selection bias) |
High – not randomized or quasi‐randomized Unclear – states "randomized", but does not report method Low – describes method of randomization |
| Allocation concealment (selection bias) |
High – not concealed, open label trial for individually randomized, method of concealment not adequate Unclear – details of method not reported or insufficient details Low – central allocation, sequentially numbered opaque sealed envelopes |
| Blinding (performance bias and detection bias) |
High – personnel, participants or outcome assessors not blinded Unclear – no details reported, insufficient details reported Low – personnel, participants and outcome assessors blinded |
| Incomplete outcome data (attrition bias) |
High – losses to follow‐up not evenly distributed across intervention and control group, high attrition rate (20% or more for the main outcome) Unclear ‐ no details reported, insufficient details reported Low – no losses to follow‐up, losses below 20% and evenly distributed across groups, ITT analysis used. Note: for cluster‐RCTs, the loss relates to the clusters |
| Selective reporting (reporting bias) |
High – did not fully report measured or relevant outcomes Unclear – not enough information reported to judge Low – all stated outcomes reported |
| Other bias |
Low – no obvious other source of bias of concern to reviewers High – major source of bias such as unexplained differences in baseline characteristics |
Appendix 2. Abridged table of characteristics
| TrialID Country | Who was treated? (Age) | How long was the follow‐up? | Trialdesign? (No. of participantsa) | Was it a cluster‐RCT? (No. of clusters) | What intervention? (Dose) | Co‐interventions?b | What control? | How long was the treatment? | Endemic area? (Community category number) |
|
Alderman 2006 (Cluster) Uganda |
Children (1 to 7 years) | 3 years | RCT (27,995) | Yes (48) | Albendazole (400 mg) | Child health package – both groups | No treatment | Every 6 months | Yes (2) |
|
Awasthi 1995 (Cluster) India |
Children (1 to 4 years) | 2 years | Quasi‐RCT (3712) | Yes (50) | Albendazole (400 mg) | None | Placebo | Every 6 months | Yes (3) |
|
Awasthi 2000 India |
Children (1.5 to 3.5 years) | 2 years | Quasi‐RCT (1045) | No | Albendazole (600 mg) | None | Placebo | Every 6 months | Yes (3) |
|
Awasthi 2001 (Cluster) India |
Children (1 to 4 years) | 1.5 years | RCT (1672) | Yes (124) | Albendazole ± vitamin A (100,000 units) | Child health package – both groups | Placebo + vitamin A | Every 6 months | Yes (3) |
|
Awasthi 2013 (Cluster) India |
Children (≤ 5 years) | 5 years | RCT factorial (8338) | Yes (72) | Albendazole (400 mg) ± vitamin A | Child health package – both groups | Usual care | Every 6 months | Yes (3) |
|
Beach 1999 Haiti |
Children (grades 1 to 4) | 4 months | RCT (853) | No | Albendazole (400 mg) Ivermectin (200 to 400 μg/kg) |
None | Placebo + vitamin C (250 mg) | Single dose | Yes (3) |
|
Donnen 1998 Zaire |
Children (0 to 72 months) | 1 year | RCT (222) | No | Mebendazole (500 mg) | None | Placebo + vitamin A (60 mg) No treatment |
Every 3 months | Yes (3) |
|
Dossa 2001 Benin |
Children (3 to 5 years) | 10 months | RCT (65) | No | Albendazole (200 mg) ± iron | None | Placebo | Repeated 1 month later | Yes (2) |
|
Fox 2005 Haiti |
Children (5 to 11 years) | 6 months | RCT (626) | No | Albendazole (400 mg) ± vitamin C (250 mg) Diethylcarbamazine (DEC, 6 mg/kg) |
None | Placebo | Single dose | Yes (2) |
|
Freij 1979a Ethiopia |
Children (1.5 to 5 years) | 28 days | Quasi‐RCT (13) | No | Piperazine (3 g) | Child health package – both groups | Placebo | Single dose | Infected children (unclear) |
|
Freij 1979b Ethiopia |
Children (1 to 5 years) | 34 days | Quasi‐RCT (44) | No | Piperazine (3 g x 2) | None | Placebo | Single dose | Infected children (3) |
|
Garg 2002 Kenya |
Children (2 to 4 years) | 6 months | RCT (347) | No | Mebendazole (500 mg) | Child health package – both groups | Placebo | Single dose | Yes (2) |
|
Goto 2009 Bangladesh |
Children (≤ 11 months) | 36 weeks | RCT (410) | No | Albendazole (200 mg) ± secnidazole (0.5 mL/kg, anti‐Giardia) | None | Placebo | Every 12 weeks | Yes (2) |
|
Greenberg 1981 Bangladesh |
Children (1.5 to 8 years) | 11 months | RCT (152) | No | Piperazine citrate (80 mg/kg) | None | Placebo | Two doses in 2 weeks | Yes (1) |
|
Hadju 1996 Indonesia |
Children (6 to 10 years) | 7 weeks | RCT (64) | No | Pyrantel pamoate (10 mg/kg) | None | Placebo | Single dose | Yes (1) |
|
Hadju 1997 Indonesia |
Children (± 8.3 years) | 1 year | RCT (330) | No | Albendazole (400 mg) Pyrantel pamoate (10 mg/kg) |
None | Placebo | Single dose or every 6 months | Yes (1) |
|
Hall 2006 (Cluster) Vietnam |
Children (± 104.5 months) | 2 years | RCT (2,659) | Yes (80) | Albendazole (400 mg) ± retinol (200,000 IU) | None | Placebo | Every 6 months | Yes (1) |
|
Kirwan 2010 Nigeria |
Children (1 to 5 years) | 14 months | RCT (320) | No | Albendazole (200 to 400 mg) | Child health package – both groups | Placebo | Every 4 months | Yes (3) |
|
Kloetzel 1982 Cameroon |
Children (1 to 8 years) | 10 months | RCT (337) | No | Mebendazole (100 mg x3) | None | Placebo | 3 doses in 3 days | Yes (1) |
|
Koroma 1996 Sierra Leone |
Children (6 to 10 years) | 6 months | RCT (187) | No | Albendazole (400 mg) | None | Placebo | Single dose | Yes (2) |
|
Kruger 1996 South Africa |
Children (6 to 8 years) | 11 months | RCT (74) | No | Albendazole (400 mg) ± soup fortified with iron and vitamin C | Child health package – both groups | Placebo | Repeated at 4 months | Yes (3) |
|
Kvalsvig 1991a South Africa |
Children (primary school) | 1 month | RCT (unclear) | No | Mebendazole (500 mg) | None | Placebo | Single dose | Infected children (1) |
|
Lai 1995 Malaysia |
Children (8 years) | 2 years | RCT (314) | No | Mebendazole (100 mg) + pyrantel (200 mg) | None | Placebo | Every 3 months | Yes (1) |
|
Le Huong 2007 Vietnam |
Children | 6 months | RCT factorial (510) | No | Mebendazole (500 mg) | Iron‐fortified noodles | Placebo | Twice 3 months apart | Yes (2) |
|
Michaelsen 1985 Botswana |
Children (5 to 14 years) | 5 months | RCT (121) | No | Tetrachloroethylene (0.1 mL/kg) | None | Placebo | Single dose | Yes (1) |
|
Miguel 2004 (Cluster) Kenya |
Children (8 years) | 2 years | RCT (9102) | Yes (65) | Albendazole (400 to 600 mg) | Child health package – only intervention group | No treatment | Every 6 months | Yes (1) |
|
Ndibazza 2012 Uganda |
Children (± 15 months) | Post‐treatment | RCT factorial (1423) | No | Albendazole (200 to 400 mg) | Child health package – both groups | Placebo | ?? | Yes (3) |
|
Nga 2009 Vietnam |
Children (6 to 8 years) | 4 months | RCT (510) | No | Albendazole (400 mg) ± multi‐micronutrient fortified biscuit | None | Placebo | Single dose | Yes (2) |
|
Nokes 1992 Jamaica |
Children (9 to 12 years) | 9 weeks | RCT (103) | No | Albendazole (400 mg x3) | None | Placebo | Single dose | Infected children (1) |
|
Olds 1999 China, Philippines and Kenya |
Children (school children) | 6 months | RCT (103) | No | Albendazole (400 mg) ± praziquantel (40 mg/kg) | None | Placebo | Single dose | Yes (1) |
|
Palupi 1997 Indonesia |
Children (2 to 5 years) | 9 weeks | RCT (191) | No | Albendazole (400 mg) | Iron | Iron (30 mg weekly) | Single dose | Yes (2) |
|
Rousham 1994 (Cluster) Bangladesh |
Children (2 to 6 years) | 18 months | RCT (1,402) | Yes (13) | Mebendazole (500 mg) Pyrantel pamoate (10 mg/kg) |
None | Placebo | Every 2 months | Yes (1) |
|
Sarkar 2002 Bangladesh |
Children (2 to 12 years) | 16 weeks | RCT (81) | No | Pyrantel pamoate (11 mg/kg) | None | Placebo | Single dose | Infected children (1) |
|
Simeon 1995 Jamaica |
Children (6 to 12 years) | 26 weeks | RCT (392) | No | Albendazole (800 mg) | None | Placebo | Repeated 3 to 6 months after | Infected children (1) |
|
Solon 2003 Philippines |
Children (grades 1 to 6) | 16 weeks | RCT (851) | No | Albendazole (400 mg) ± multivitamin and iron | None | Placebo | Repeated 3 to 6 months after | Yes (2) |
|
Stephenson 1989 Kenya |
Children (grades 1 to 2) | 6 months | RCT (150) | No | Albendazole (400 mg) | None | Placebo | Single dose | Yes (1) |
|
Stephenson 1993 Kenya |
Children (grades 1 to 5) | 8 months | RCT (284) | No | Albendazole (600 mg) | None | Placebo | Repeated 3 to 6 months after | Yes (1) |
|
Stoltzfus 1997 (Cluster) Tanzania, Zanzibar |
Children (± 10.5 years) | 12 months | RCT (3063) | Yes (12) | Mebendazole (500 mg, 2x or 3x) | None | Placebo | Every 4 or 6 months | Yes (1) |
|
Stoltzfus 2001 Tanzania, Zanzibar |
Children (6 to 59 months) | 12 months | RCT factorial (359) | No | Mebendazole (500 mg) ± iron | None | Placebo | Every 3 months | Yes (2) |
|
Sur 2005 India |
Children (2 to 5 years) | 12 months | RCT (683) | No | Albendazole (400 mg) ± vitamin B | None | Placebo | Every 6 months | Yes (2) |
|
Tee 2013 Malaysia |
Children | 12 months | RCT (33) | No | Albendazole (400 mg x 2) | None | Placebo | Single dose | Yes (NA) |
|
Watkins 1996 Guatemala |
Children (7 to 12 years) | 6 months | RCT (226) | No | Albendazole (400 mg) | None | Placebo | Repeated at 12 weeks | Yes (1) |
|
Willett 1979 Tanzania |
Children (6 to 91 months) | 12 months | RCT (268) | No | Levamisole (2.5 mg/kg) | None | Placebo | Every 3 months | Yes (3) |
|
Wiria 2013 (Cluster) Indonesia |
Children and adults ≥ 2 years | 21 months | RCT (855) | Yes (954) | Albendazole (400 mg x 3) | None | Placebo | Single dose | Yes (1) |
|
Yap 2014 Myanmar, China |
Children (9 to 12 years) | 6 months | RCT (194) | No | Albendazole (400 mg x 3) | None | Placebo | Single dose | Infected children (NA) |
aNumber of participants analysed for primary outcome. bFor details on "child health package" please see Table 13: Accompanying health promotion activities.
Data and analyses
Comparison 1.
Infected children ‐ Single dose
| Outcome or subgroup title | No. of studies | No. of participants | Statistical method | Effect size |
|---|---|---|---|---|
| 1 Weight (kg) | 5 | 627 | Mean Difference (IV, Random, 95% CI) | 0.75 [0.24, 1.26] |
| 2 Height (cm) | 5 | 647 | Mean Difference (IV, Random, 95% CI) | 0.25 [0.01, 0.49] |
| 3 Mid‐upper arm circumference (cm) | 4 | 396 | Mean Difference (IV, Fixed, 95% CI) | 0.49 [0.39, 0.58] |
| 4 Triceps skin fold thickness (mm) | 3 | 352 | Mean Difference (IV, Random, 95% CI) | 1.34 [0.72, 1.97] |
| 5 Subscapular skin fold thickness (mm) | 2 | 339 | Mean Difference (IV, Fixed, 95% CI) | 1.29 [1.13, 1.44] |
| 6 Body mass index | 1 | Mean Difference (IV, Fixed, 95% CI) | Totals not selected | |
| 7 Haemoglobin (g/dL) | 2 | 247 | Mean Difference (IV, Random, 95% CI) | 0.10 [‐0.65, 0.86] |
Comparison 2.
Infected children ‐ Multiple dose, longest follow‐up
| Outcome or subgroup title | No. of studies | No. of participants | Statistical method | Effect size |
|---|---|---|---|---|
| 1 Weight (kg) | 1 | Mean Difference (Fixed, 95% CI) | Totals not selected | |
| 2 Height (cm) | 1 | Mean Difference (IV, Fixed, 95% CI) | Totals not selected | |
| 3 Body mass index | 1 | Mean Difference (IV, Fixed, 95% CI) | Totals not selected | |
| 4 School attendance (days present at school) | 1 | Mean Difference (IV, Fixed, 95% CI) | Totals not selected | |
| 5 Mid‐upper arm circumference (cm) | 1 | Mean Difference (IV, Fixed, 95% CI) | Totals not selected | |
| 6 Triceps skin fold thickness (mm) | 1 | Mean Difference (IV, Fixed, 95% CI) | Totals not selected | |
| 7 Subscapular skin fold thickness (mm) | 1 | Mean Difference (IV, Fixed, 95% CI) | Totals not selected |
Comparison 3.
All children living in endemic area ‐ first dose
| Outcome or subgroup title | No. of studies | No. of participants | Statistical method | Effect size |
|---|---|---|---|---|
| 1 Weight (kg) | 7 | 2719 | Mean Difference (IV, Fixed, 95% CI) | ‐0.04 [‐0.11, 0.04] |
| 1.1 High prevalence | 2 | 290 | Mean Difference (IV, Fixed, 95% CI) | 0.02 [‐0.15, 0.18] |
| 1.2 Moderate prevalence | 2 | 873 | Mean Difference (IV, Fixed, 95% CI) | 0.08 [‐0.10, 0.27] |
| 1.3 Low prevalence | 3 | 1556 | Mean Difference (IV, Fixed, 95% CI) | ‐0.09 [‐0.19, 0.01] |
| 2 Height (cm) | 5 | 1974 | Mean Difference (IV, Random, 95% CI) | ‐0.12 [‐0.33, 0.10] |
| 2.1 High prevalence | 1 | 227 | Mean Difference (IV, Random, 95% CI) | 0.06 [‐0.08, 0.20] |
| 2.2 Moderate prevalence | 1 | 191 | Mean Difference (IV, Random, 95% CI) | ‐0.20 [‐0.47, 0.07] |
| 2.3 Low prevalence | 3 | 1556 | Mean Difference (IV, Random, 95% CI) | ‐0.26 [‐0.74, 0.21] |
| 3 Mid‐upper arm circumference (cm) | 3 | 911 | Mean Difference (IV, Random, 95% CI) | 0.04 [‐0.19, 0.26] |
| 3.1 High prevalence | 1 | 207 | Mean Difference (IV, Random, 95% CI) | 0.09 [‐0.03, 0.21] |
| 3.2 Moderate prevalence | 1 | 482 | Mean Difference (IV, Random, 95% CI) | 0.19 [‐0.01, 0.40] |
| 3.3 Low prevalence | 1 | 222 | Mean Difference (IV, Random, 95% CI) | ‐0.3 [‐0.52, ‐0.08] |
| 4 Haemoglobin (g/dL) | 3 | 1005 | Mean Difference (IV, Fixed, 95% CI) | 0.06 [‐0.05, 0.17] |
| 4.1 Moderate prevalence | 2 | 658 | Mean Difference (IV, Fixed, 95% CI) | 0.06 [‐0.06, 0.17] |
| 4.2 Low prevalence | 1 | 347 | Mean Difference (IV, Fixed, 95% CI) | 0.06 [‐0.24, 0.36] |
Comparison 4.
All children living in endemic area ‐ Multiple dose, longest follow‐up
| Outcome or subgroup title | No. of studies | No. of participants | Statistical method | Effect size |
|---|---|---|---|---|
| 1 Weight (kg) | 10 | 2656 | Mean Difference (Random, 95% CI) | 0.08 [‐0.11, 0.27] |
| 1.1 High prevalence | 2 | 306 | Mean Difference (Random, 95% CI) | 0.04 [‐0.08, 0.16] |
| 1.2 Moderate prevalence | 3 | 859 | Mean Difference (Random, 95% CI) | 0.11 [‐0.03, 0.25] |
| 1.3 Low prevalence | 5 | 1491 | Mean Difference (Random, 95% CI) | 0.06 [‐0.46, 0.57] |
| 2 Height (cm) | 7 | 1847 | Mean Difference (IV, Fixed, 95% CI) | 0.02 [‐0.14, 0.17] |
| 2.1 High prevalence | 1 | 227 | Mean Difference (IV, Fixed, 95% CI) | 0.06 [‐0.13, 0.25] |
| 2.2 Moderate prevalence | 1 | 129 | Mean Difference (IV, Fixed, 95% CI) | 0.10 [‐0.46, 0.66] |
| 2.3 Low prevalence | 5 | 1491 | Mean Difference (IV, Fixed, 95% CI) | ‐0.14 [‐0.46, 0.18] |
| 3 Mid‐upper arm circumference (cm) | 3 | 534 | Mean Difference (IV, Random, 95% CI) | ‐0.03 [‐0.25, 0.18] |
| 3.1 High prevalence | 1 | 207 | Mean Difference (IV, Random, 95% CI) | 0.08 [‐0.06, 0.22] |
| 3.2 Moderate prevalence | 1 | 129 | Mean Difference (IV, Random, 95% CI) | 0.06 [‐0.22, 0.33] |
| 3.3 Low prevalence | 1 | 198 | Mean Difference (IV, Random, 95% CI) | ‐0.35 [‐0.65, ‐0.05] |
| 4 Triceps skin fold thickness (mm) | 1 | Mean Difference (IV, Random, 95% CI) | Subtotals only | |
| 4.1 Moderate prevalence | 1 | 130 | Mean Difference (IV, Random, 95% CI) | ‐0.30 [‐1.28, 0.68] |
| 5 Haemoglobin (g/dL) | 7 | 3595 | Mean Difference (IV, Fixed, 95% CI) | ‐0.02 [‐0.08, 0.04] |
| 5.1 Moderate prevalence | 2 | 464 | Mean Difference (IV, Fixed, 95% CI) | 0.02 [‐0.15, 0.19] |
| 5.2 Low prevalence | 5 | 3131 | Mean Difference (IV, Fixed, 95% CI) | ‐0.02 [‐0.09, 0.04] |
| 6 School attendance (days present at school) | 2 | 293 | Mean Difference (Random, 95% CI) | 0.02 [‐0.04, 0.08] |
| 6.1 High prevalence | 2 | 293 | Mean Difference (Random, 95% CI) | 0.02 [‐0.04, 0.08] |
Comparison 5.
All children living in endemic area ‐ Single dose (low risk of bias for allocation concealment)
| Outcome or subgroup title | No. of studies | No. of participants | Statistical method | Effect size |
|---|---|---|---|---|
| 1 Weight (kg) | 2 | 1029 | Mean Difference (IV, Fixed, 95% CI) | 0.04 [‐0.11, 0.19] |
| 1.1 Moderate prevalence | 1 | 682 | Mean Difference (IV, Fixed, 95% CI) | 0.5 [‐0.28, 1.28] |
| 1.2 Low prevalence | 1 | 347 | Mean Difference (IV, Fixed, 95% CI) | 0.02 [‐0.13, 0.17] |
| 2 Height (cm) | 1 | Mean Difference (IV, Fixed, 95% CI) | Totals not selected | |
| 2.1 Low prevalence | 1 | Mean Difference (IV, Fixed, 95% CI) | 0.0 [0.0, 0.0] | |
| 3 Mid‐upper arm circumference (cm) | 1 | Mean Difference (IV, Fixed, 95% CI) | Subtotals only | |
| 3.1 Moderate prevalence | 1 | 482 | Mean Difference (IV, Fixed, 95% CI) | 0.19 [‐0.01, 0.40] |
| 4 Haemoglobin (g/dL) | 2 | 814 | Mean Difference (IV, Fixed, 95% CI) | 0.05 [‐0.07, 0.17] |
| 4.1 Moderate prevalence | 1 | 467 | Mean Difference (IV, Fixed, 95% CI) | 0.05 [‐0.08, 0.17] |
| 4.2 Low prevalence | 1 | 347 | Mean Difference (IV, Fixed, 95% CI) | 0.06 [‐0.24, 0.36] |
Comparison 6.
All children living in endemic area ‐ Multiple dose (low risk of bias for allocation concealment), longest follow‐up
| Outcome or subgroup title | No. of studies | No. of participants | Statistical method | Effect size |
|---|---|---|---|---|
| 1 Weight (kg) | 2 | Mean Difference (Fixed, 95% CI) | 0.01 [‐0.13, 0.15] | |
| 1.1 High prevalence | 1 | Mean Difference (Fixed, 95% CI) | 0.0 [‐0.14, 0.14] | |
| 1.2 Moderate prevalence | 1 | Mean Difference (Fixed, 95% CI) | 0.5 [‐0.42, 1.42] | |
| 2 Height (cm) | 1 | Mean Difference (IV, Fixed, 95% CI) | Totals not selected | |
| 2.1 Low prevalence | 1 | Mean Difference (IV, Fixed, 95% CI) | 0.0 [0.0, 0.0] | |
| 3 Haemoglobin (g/dL) | 1 | Mean Difference (IV, Fixed, 95% CI) | Subtotals only | |
| 3.1 Moderate prevalence | 1 | 326 | Mean Difference (IV, Fixed, 95% CI) | ‐0.02 [‐0.21, 0.16] |
Comparison 7.
All children living in endemic area ‐ All multiple ordered by year
| Outcome or subgroup title | No. of studies | No. of participants | Statistical method | Effect size |
|---|---|---|---|---|
| 1 Weight (kg) | 10 | Mean Difference (Random, 95% CI) | 0.09 [‐0.10, 0.28] |
What's new
| Date | Event | Description |
|---|---|---|
| 13 January 2017 | Feedback has been incorporated | Comments were received for this review in October 2016. The authors have responded to the queries in the appropriate section of this review. A full update of the review is pending. |
| 13 January 2017 | Amended | Feedback received and responded to. |
History
Protocol first published: Issue 3, 1997 Review first published: Issue 2, 1998
| Date | Event | Description |
|---|---|---|
| 27 July 2015 | Amended | We added an external source of support, the Evidence and Programme Guidance Unit, Department of Nutrition for Health and Development, World Health Organization (WHO), to the Acknowledgements and Sources of support sections. |
| 8 July 2015 | New citation required but conclusions have not changed | A new search was conducted and new trials added. We also responded to feedback. |
| 26 February 2015 | New search has been performed |
|
| 10 October 2012 | New citation required but conclusions have not changed | We updated the 'Summary of findings' tables, updated the abstract, and made minor corrections. |
| 10 October 2012 | New search has been performed | In September 2012, we identified a minor data entry error with a haemoglobin value, which we corrected. We also received feedback on the GRADE assessments. This led to changes in the assessment of the quality of the evidence for several outcomes. Most changes were towards higher quality evidence. We refined the table by adding additional footnotes to clarify the classification. The specific changes were:
We adjusted the wording in the abstract to take these changes into account. |
| 31 May 2012 | New search has been performed | Substantive update:
|
| 31 May 2012 | New citation required but conclusions have not changed | We updated the review and added new studies. |
| 7 May 2008 | Amended | There are two alterations to the review:
|
| 12 August 2007 | New citation required and conclusions have changed | 2007, Issue 4 (substantive update): author team changed; we modified the review title from the original title of "Anthelmintic drugs for treating worms in children: effects on growth and cognitive performance"; we updated methods, reapplied the inclusion criteria, repeated data extraction, added new trials, and included additional analyses as recommended by policy specialists. |
| 31 March 2000 | New citation required and conclusions have changed | 2000, Issue 2 (substantive update): we added new trials and updated the review. |
Differences between protocol and review
Not applicable.
Characteristics of studies
Characteristics of included studies [ordered by study ID]
| Methods | Cluster‐RCT Method to adjust for clustering: Not adjusted Cluster unit: parish Average cluster size: 560 ICCs: not reported but calculated from adjusted and unadjusted figures to be 0.01. Length of follow‐up: 3 years |
|
| Participants | All children living in endemic area Number analysed for primary outcome: 48 parishes randomized containing 27,995 children Age range: 1 to 7 years Inclusion criteria: children aged 1 to 7 in 50 parishes in Uganda selected by the government on the basis that around 60% of children aged 5 to 10 years in these parishes were infected with intestinal nematodes Exclusion criteria: sick children |
|
| Interventions | Multiple dose vs no treatment
|
|
| Outcomes |
|
|
| Notes | Location: Uganda Community category: 2 Weight gain data taking into account the effects of cluster randomization provided by the author. Source of funding: the nutrition and early child development project, government of Uganda, the Institute of Public Health and the research committee of the World Bank. |
|
| Risk of bias | ||
| Bias | Authors' judgement | Support for judgement |
| Random sequence generation (selection bias) | Low risk | Coin toss "The randomization was done by a member of the research team (HA) by assigning numbers to all of the parishes and converting these to base two and then determining which of the parishes were to be in the treatment by coin flips". |
| Allocation concealment (selection bias) | Unclear risk | No details reported. |
| Blinding (performance bias and detection bias) All outcomes | High risk | None. "It was not possible for us to carry out a double blind trial because of the scale of the programme and because we aimed to assess the effectiveness of giving albendazole […] during standard child health days without any trial specific inputs". |
| Incomplete outcome data (attrition bias) All outcomes | High risk | 75% (27,995/37,165) of randomized participants were evaluated. |
| Selective reporting (reporting bias) | Low risk | All stated outcomes reported. |
| Other bias | Low risk | Recruitment bias: low risk Baseline imbalance: characteristics similar (low risk) Loss of clusters: nil (low risk) Incorrect analysis: primary outcome in paper not adjusted for clustering (personal communication Harold Alderman), but Cochrane Review adjusts this (low risk) Comparability with RCTs randomizing individuals: unclear |
| Methods | Cluster‐quasi‐RCT Method to adjust for clustering: cluster used as unit of analysis Cluster unit: urban slum Average cluster size: 74 ICCs: not reported. Length of follow‐up: 2 years |
|
| Participants | All children living in endemic area Number analysed for primary outcome: 50 slums randomized containing 3712 children Age range: 1 to 4 years Inclusion criteria: children aged 1 to 4 from 50 urban slums in Lucknow selected on the basis of geographic convenience Exclusion criteria: none stated |
|
| Interventions | Multiple doses vs placebo
|
|
| Outcomes |
|
|
| Notes | Location: Lucknow, India Community category: 3 Trial carried out in 1995 and published in 2008. Source of funding: Clinical Trial Service Unit (CTSU), University of Oxford, United Kingdom, and co‐funded by the International Clinical Epidemiology Network Inc., Philadelphia, United States of America. Albendazole was donated by SmithKline Beecham (now GlaxoSmithKline). |
|
| Risk of bias | ||
| Bias | Authors' judgement | Support for judgement |
| Random sequence generation (selection bias) | High risk | Quasi‐randomized: "Random allocation was done by SA, listing the anganwadi centers of each slum area serially in alphabetical order, numbering them from 1 to 50, and then generating a single random number by computer that allocated either all odd or all even numbers to a specific intervention type" |
| Allocation concealment (selection bias) | High risk | Not concealed. |
| Blinding (performance bias and detection bias) All outcomes | High risk | Cluster‐RCT with health staff and participants knowing which group they were allocated to. |
| Incomplete outcome data (attrition bias) All outcomes | Low risk | 1852/1968 children in the treatment group completed all follow‐up visits; 1860/1967 children in the usual care group completed all follow‐up visits. Inclusion of all randomized participants (number evaluable/number randomized): 94% (3712/3935). |
| Selective reporting (reporting bias) | Low risk | All stated outcomes reported. |
| Other bias | Low risk | Recruitment bias: unclear (Not known if children shift clinics in the light of the intervention) Baseline imbalance: unclear Loss of clusters: low (none reported) Incorrect analysis: cluster adjusted (low risk) Comparability with RCTs randomizing individuals: unclear |
| Methods | Quasi‐RCT Length of follow‐up: 2 years |
|
| Participants | All children living in endemic area Number analysed for primary outcome: 1045 Age range: 1.5 to 3.5 years Inclusion criteria: children living in 32 randomly selected urban slums; registered with an Anganwadi worker (health worker); between 1.5 to 3.5 years of age Exclusion criteria: none stated |
|
| Interventions | Multiple doses vs placebo
|
|
| Outcomes |
Not included in review: prevalence of underweight and stunting over 2 years as defined by z‐scores, haemoglobin (visual colour estimation), stool examination (non‐concentration method), incidence of illness, and death |
|
| Notes | Location: Lucknow, India Community category: 3 Source of funding: International Clinical Epidemiology Network (INCLEN), Philadelphia, USA grant #2002‐94‐623 under the Clinical Economics Small Grants Program. |
|
| Risk of bias | ||
| Bias | Authors' judgement | Support for judgement |
| Random sequence generation (selection bias) | High risk | 32 Anganwadi centres randomly selected, and then children allocated to a serial number; those with odd or non‐zero ending numbers were assigned to placebo. |
| Allocation concealment (selection bias) | High risk | Not concealed. |
| Blinding (performance bias and detection bias) All outcomes | Unclear risk | Single blind. |
| Incomplete outcome data (attrition bias) All outcomes | Low risk | 9/610 children in the albendazole group and 7/451 in the placebo group were lost to follow‐up. Inclusion of all randomized participants (number evaluable/number randomized): 98% (1045/1061). |
| Selective reporting (reporting bias) | Low risk | All stated outcomes reported. |
| Other bias | Low risk | No other obvious source of bias. |
| Methods | Cluster‐RCT Method to adjust for clustering: cluster used as unit of analysis. Cluster unit: urban slums Average cluster size: 13.5 ICCs: not reported. Length of follow‐up: 1.5 years |
|
| Participants | All children living in endemic area Number analysed for primary outcome: 124 slums randomized containing 1672 children Age range/ mean age: 0.8 years Inclusion criteria: clusters selected if they had functional community workers in slum areas of Lucknow; within each cluster, children recruited if aged between 0.5 and 1 year, on basis of survey register held by each worker of their particular area Exclusion criteria: none stated |
|
| Interventions | Multiple doses vs placebo
|
|
| Outcomes |
Not included in review: stool smear for Ascaris prevalence on a subsample of the group; death rates |
|
| Notes | Location: Lucknow, India Community category: 3 Means of cluster means used in analysis. The results (weight gain) in the abstract differ from the text. Source of funding: International Clinical Epidemiological Network (INCLEN) Inc, USA and Clinical Trials Unit (CTSU), Oxford, UK. |
|
| Risk of bias | ||
| Bias | Authors' judgement | Support for judgement |
| Random sequence generation (selection bias) | Unclear risk | Cluster‐randomized trial, no further details. |
| Allocation concealment (selection bias) | Unclear risk | No details reported. |
| Blinding (performance bias and detection bias) All outcomes | Unclear risk | No details reported. |
| Incomplete outcome data (attrition bias) All outcomes | Low risk | Intention‐to‐treat (ITT) analysis; 13.9% lost to follow‐up in albendazole group and 16.2% in the placebo group. Inclusion of all randomized participants (number evaluable/number randomized): 83% (1672/2010). |
| Selective reporting (reporting bias) | Low risk | All stated outcomes reported. |
| Other bias | Low risk | Recruitment bias: unclear (Not known if children shift clinics in the light of the intervention) Baseline imbalance: characteristics similar (low risk) Loss of clusters: no loss reported (low risk) Incorrect analysis: cluster adjusted (low risk) Comparability with RCTs randomizing individuals: low |
| Methods | Cluster‐RCT Method to adjust for clustering: cluster used as unit of analysis ('means of block‐specific numbers of deaths per AWC') Cluster unit: a block of 10,000 to 20,000 children Average cluster size: 9259 approximately (under‐5 population 1 million/108 clusters). ICCs: not reported Length of follow‐up: 5 years |
|
| Participants | All children living in endemic area Number analysed for primary outcome: total population of 1 million children at any one time, with a total of 2 million children ever in the trial Age range: 1 to 6 years Inclusion criteria: all preschool children then aged 1 to 6.0 years in 72 participating blocks near Lucknow that were considered to have a well‐functioning ICDS system with willing district and block directors and with paid workers in most of the block's anganwadi centres Exclusion criteria: severe anaemia (haemoglobin < 75 g/L) |
|
| Interventions | Multiple doses vs placebo Factorial design in four arms:
|
|
| Outcomes |
Not included in review: A subset of 5165 children were assessed for other outcomes (height, weight, BMI, haemoglobin, prevalence of illness in past 4 weeks) |
|
| Notes | Location: Lucknow, India Community category: 3 Annually about 30 non‐randomly selected preschool children were surveyed for growth, nutritional and morbidity outcomes from one randomly selected AWC per block (10,000 to 20,000 children in about 120 AWCs per block). Source of funding: UK Medical Research Council, USAID OMNI project, World Bank. Albendazole (Zentel) was donated by SmithKlineBeecham. |
|
| Risk of bias | ||
| Bias | Authors' judgement | Support for judgement |
| Random sequence generation (selection bias) | Unclear risk | "randomly allocated"; "Randomisation (in Oxford) was stratified in groups of 4 neighbouring blocks, where possible in the same district." |
| Allocation concealment (selection bias) | Unclear risk | See above. |
| Blinding (performance bias and detection bias) All outcomes | Unclear risk | All cause mortality is the outcome. |
| Incomplete outcome data (attrition bias) All outcomes | Low risk | 89 AWCs (2%) in the albendazole block lost to follow‐up, 86 AWCs (2%) in the placebo block lost to follow‐up. "Loss to follow‐up is defined by having only 1‐6 follow‐up visits (mean only 3, as against 12 in the included AWCs), and was generally because the AWC had ceased to function." Inclusion of all randomized participants (number evaluable/number randomized): Denominator for mortality was all children. A subset of 5165 non‐randomly selected children were assessed for other outcomes. |
| Selective reporting (reporting bias) | Low risk | Mortality is the single outcome for this trial. |
| Other bias | Low risk | Recruitment bias: unclear Baseline imbalance: unclear Loss of clusters: unclear Incorrect analysis: Cluster adjusted (low risk) Comparability with RCTs randomizing individuals: unclear |
| Methods | RCT Length of follow‐up: 4 months |
|
| Participants | All children living in endemic area Number analysed for primary outcome: 853 Age range/ mean age: 5 to 11 years Inclusion criteria: all children attending 5 schools (grades 1 to 4) Exclusion criteria: haematocrit < 22% |
|
| Interventions | Single dose vs placebo
|
|
| Outcomes |
|
|
| Notes | Location: Haiti Community category: 3 Results presented in a stratified analysis as per individual infection: disaggregated results not presented; measures of error not given in tables. Source of funding: USAID. Invermectin provided by Philippe Gaxotte (Merck, Inc.) and albendazole by John Horton (SmithKline Beecham). |
|
| Risk of bias | ||
| Bias | Authors' judgement | Support for judgement |
| Random sequence generation (selection bias) | Low risk | Random number table. |
| Allocation concealment (selection bias) | Unclear risk | No details reported. |
| Blinding (performance bias and detection bias) All outcomes | Low risk | Participants, provider, and assessors were blind. |
| Incomplete outcome data (attrition bias) All outcomes | Low risk | 29/229 were lost to follow‐up in the placebo group and 25/244 were lost to follow‐up in the albendazole group. Inclusion of all randomized participants (number evaluable/number randomized): 88.4% (853/965). |
| Selective reporting (reporting bias) | Low risk | All stated outcomes reported. |
| Other bias | Low risk | No other obvious source of bias. |
| Methods | RCT Length of follow‐up: 1 year |
|
| Participants | All children living in endemic area Number analysed for primary outcome: 222 Age range: 0 to 72 months Inclusion criteria: children aged 0 to 72 months eligible on discharge from hospital where primary cause for admission is malnutrition Exclusion criteria: none stated |
|
| Interventions | Multiple doses vs placebo and no treatment
|
|
| Outcomes |
Not included in review: vitamin A levels; z‐scores for height‐for‐age, weight‐for‐age, weight‐for‐height (NCHS reference); egg counts (eggs/g: Kato Katz method). |
|
| Notes | Location: Zaire Community category: 3 Unadjusted data not provided in original paper; results of multiple‐regression models presented on basis of stratifications into vitamin A status and sex; results in meta‐analysis from R Dickson's correspondence with author when preparing the Dickson 2000a Cochrane Review. Source of funding: Fonds de la Recherche Scientifique et Medicale (FRSM), contract 3.4505.94 and the David and Alice Van Buuren Foundation. |
|
| Risk of bias | ||
| Bias | Authors' judgement | Support for judgement |
| Random sequence generation (selection bias) | Unclear risk | "randomized". No further details reported. |
| Allocation concealment (selection bias) | Unclear risk | No details reported. |
| Blinding (performance bias and detection bias) All outcomes | Unclear risk | No details reported. |
| Incomplete outcome data (attrition bias) All outcomes | Low risk | Overall, 6% of children were lost to follow‐up, with approximately equal proportions from each group. During the follow‐up period, 25 children died. The final sample included 311 children Inclusion of all randomized participants (number evaluable/number randomized): 86% (311/358). |
| Selective reporting (reporting bias) | Low risk | All stated outcomes reported. |
| Other bias | Low risk | No other obvious source of bias. |
| Methods | RCT Length of follow‐up: 10 months |
|
| Participants | All children living in endemic area Number analysed for primary outcome: 65 Age range: 3 to 5 years Inclusion criteria: children aged 3 to 5 years; not acutely unwell Exclusion criteria: none stated |
|
| Interventions | Multiple doses vs placebo:
|
|
| Outcomes |
Not included in review: weight‐for‐height z‐score and height‐for‐age z‐score at 3 and 10 months (both after 2 doses). Measured but not reported: z‐scores for weight‐for‐height, height for age using NCHS reference data; egg count (arithmetic and geometric mean); prevalence, intensity; food intake over 3 days in subset at end of trial (not at baseline). |
|
| Notes | Location: Benin Community category: 2 Source of funding: The Nestle Foundation (Lausanne, Switzerland).Smithkline Beecham provided the deworming and placebo tablets. |
|
| Risk of bias | ||
| Bias | Authors' judgement | Support for judgement |
| Random sequence generation (selection bias) | Unclear risk | "Randomly assigned". No further details provided. |
| Allocation concealment (selection bias) | Unclear risk | No details reported. |
| Blinding (performance bias and detection bias) All outcomes | Unclear risk | "Double‐blind". No further details provided. |
| Incomplete outcome data (attrition bias) All outcomes | High risk | 175/177 children finished the trial, but 140 were included in the final analysis: “One child was treated for severe worm infection and 34 children received other pills during the trial period (iron, vitamins/minerals or deworming pills that were not provided by our research team).” Inclusion of all randomized participants (number evaluable/number randomized): 79% (140/177). |
| Selective reporting (reporting bias) | Low risk | All stated outcomes reported. |
| Other bias | High risk | No obvious other source of bias. |
| Methods | RCT Length of follow‐up: 6 months |
|
| Participants | All children living in endemic area Number analysed for primary outcome: 626 Age range: 5 to 11 years Inclusion criteria: children aged 5 to 11 years attending any of 12 primary schools in Haiti where no other deworming activity was taking place Exclusion criteria: none stated |
|
| Interventions | Single dose vs placebo
|
|
| Outcomes |
Not included in review: worm intensity and prevalence; microfilarial density. |
|
| Notes | Location: Haiti Community category: 2 Weight and height outcomes are only presented for a subgroup of children infected with Trichuris Source of funding: Emerging Infections Program of the Centers for Disease Control and Prevention (CDC) and an Institutional Strengthening Grant from the WHO to the Hopital Sainte Croix. |
|
| Risk of bias | ||
| Bias | Authors' judgement | Support for judgement |
| Random sequence generation (selection bias) | Low risk | Random‐number table. |
| Allocation concealment (selection bias) | Low risk | Centrally‐coded allocation system broken after baseline measures taken. |
| Blinding (performance bias and detection bias) All outcomes | Low risk | "Double‐blind". Laboratory personnel, measurement teams and personnel evaluating students for adverse reactions were all blinded. |
| Incomplete outcome data (attrition bias) All outcomes | Low risk | 626/646 participants analysed for the primary outcome. Reasons for loss to follow‐up unclear. Inclusion of all randomized participants (number evaluable/number randomized): 97% (626/646). |
| Selective reporting (reporting bias) | Low risk | All stated outcomes reported. |
| Other bias | Low risk | No obvious other source of bias. |
| Methods | Quasi‐RCT Length of follow‐up: 28 days |
|
| Participants | Infected children identified by screening Number analysed for primary outcome: 13 Age range: 1.5 to 5 years Inclusion criteria: boys attending mother and child clinic with Ascaris on stool smear; aged 1.5 to 5 years with no history of diarrhoea for preceding 2 weeks; no fever; no respiratory symptoms; no signs of severe disease Exclusion criteria: children diagnosed with other parasites; excluded girls to eliminate the contamination of samples with urine |
|
| Interventions | Single dose vs placebo
|
|
| Outcomes |
Not included in review: Ascaris worm count |
|
| Notes | Location: Ethiopia Community category: N/A The trial authors mention that boys were matched in pairs so that if there were drop outs they could be replaced. They do not indicate if there were any drop outs. SDs calculated from individual data. Freij 1979a and Freij 1979ai were reported in the same article. Source of funding: Semper Nutrition Fund, Stockholm; Swedish Medical Research Council. |
|
| Risk of bias | ||
| Bias | Authors' judgement | Support for judgement |
| Random sequence generation (selection bias) | High risk | Quasi‐RCT: boys matched into pairs of equal age and nutritional status. |
| Allocation concealment (selection bias) | Unclear risk | No details reported. |
| Blinding (performance bias and detection bias) All outcomes | Unclear risk | Described as double blind, no further details reported. |
| Incomplete outcome data (attrition bias) All outcomes | Unclear risk | 100% (13/13) of enrolled participants were evaluated. The authors mention that boys were matched in pairs so that if there were drop outs they could be replaced. They do not indicate if there were any drop outs. Inclusion of all randomized participants (number evaluable/number randomized): 100% (13/13). |
| Selective reporting (reporting bias) | Low risk | Authors had intended to measure bicep and tricep skinfolds, but staff were unable to take these measurements. |
| Other bias | Low risk | No obvious other source of bias. |
| Methods | Quasi‐RCT Length of follow‐up: 34 days |
|
| Participants | Infected children identified by screening Number analysed for primary outcome: 44 Age range: 1 to 5 years Inclusion criteria: 92 children 1 to 5 years from a community morbidity trial Exclusion criteria: none stated |
|
| Interventions | Single dose vs placebo
|
|
| Outcomes |
Not included in review: weight in % of Harvard standard; authors had intended to measure bicep and tricep skinfolds, but staff were unable to take these measurements |
|
| Notes | Location: Ethiopia Community category: 3 Freij 1979a and Freij 1979ai were reported in the same article. Source of funding: Semper Nutrition Fund, Stockholm; Swedish Medical Research Council. |
|
| Risk of bias | ||
| Bias | Authors' judgement | Support for judgement |
| Random sequence generation (selection bias) | High risk | Quasi‐RCT: children matched into pairs of equal age and nutritional status. |
| Allocation concealment (selection bias) | Unclear risk | No details reported. |
| Blinding (performance bias and detection bias) All outcomes | Unclear risk | Described as double blind, no further details reported. |
| Incomplete outcome data (attrition bias) All outcomes | Low risk | 100% (44/44) of enrolled participants were evaluated. Inclusion of all randomized participants (number evaluable/number randomized): 100% (44/44). |
| Selective reporting (reporting bias) | Low risk | Trial authors had intended to measure bicep and tricep skinfolds, but staff were unable to take these measurements. |
| Other bias | Low risk | No obvious other source of bias. |
| Methods | RCT Length of follow‐up: 6 months |
|
| Participants | All children living in endemic area Number analysed for primary outcome: 347 Age range: 2 to 4 years Inclusion criteria: sick children 2 to 4 years old presenting to 3 government health centres in Bungamo district, without palmar pallor Exclusion criteria: children with palmar pallor |
|
| Interventions | Single dose vs placebo
|
|
| Outcomes |
Not included in review: z‐scores for weight‐for‐age, height‐for‐age, and weight‐for‐height; egg count (formol‐ethyl acetate concentration method) in categories of intensity. |
|
| Notes | Location: Kenya Community category: 3 Source of funding: the CDC, Atlanta, USA. |
|
| Risk of bias | ||
| Bias | Authors' judgement | Support for judgement |
| Random sequence generation (selection bias) | Low risk | Computer‐generated list of random numbers. |
| Allocation concealment (selection bias) | Low risk | Drugs kept in envelope until after baseline assessment. |
| Blinding (performance bias and detection bias) All outcomes | High risk | "the trial was not double‐blinded". Assessors were blinded; participants unclear; provider not blinded. |
| Incomplete outcome data (attrition bias) All outcomes | Low risk | 93% (347/370) of randomized participants were evaluated, loss to follow‐up balanced across groups. Inclusion of all randomized participants (number evaluable/number randomized): 93% (347/370). |
| Selective reporting (reporting bias) | Low risk | All stated outcomes included. |
| Other bias | Low risk | No obvious other source of bias. |
| Methods | RCT Length of follow‐up: 36 weeks |
|
| Participants | All children living in endemic area Number analysed for primary outcome: 410 Age range: 0 to 11 months Inclusion criteria: infants under 11 months of age in the local area Exclusion criteria: not stated |
|
| Interventions | Multiple doses vs placebo
Secnidazole: a 70 mg/mL suspension with about 0.5 g of sweetener was made up, and 0.5 mL per kg body weight was given by spoon. If the infant was sick immediately, secnidazole was re‐administrated. Albendazole: a 200 mg (5 mL) suspension given by spoon. |
|
| Outcomes |
Not included in review:
|
|
| Notes | Location: Dhamrai Upazila, located 40 km northwest of Dhaka, Bangladesh. Community category: 3. "Prevalences and intensities of geohelminths were consistently low throughout the intervention". Drug source: Dhaka, Bangladesh (Essential Drugs Company Ltd for secnidazole; Square Pharmaceuticals Ltd for the secnidazole placebo; Opsonin Chemical Industries Ltd for albendazole; and UniMed and UniHealthManufacturing Ltd for albendazole placebo). |
|
| Risk of bias | ||
| Bias | Authors' judgement | Support for judgement |
| Random sequence generation (selection bias) | Low risk | Computer generated. Randomized on the basis of their age, sex, height‐for‐age, weight‐for‐age and weight‐for‐height z‐scores, socio‐demographic and economic data and presence of any parasitic infection. |
| Allocation concealment (selection bias) | Unclear risk | Unclear whether the allocation was concealed since patients were randomized by their characteristics. |
| Blinding (performance bias and detection bias) All outcomes | Low risk | Double‐blind. "Bottles containing the two medications and placebo suspensions were labelled with different colours corresponding to the three intervention groups, but the assistants did not know the relationship between the colour codings and the contents of the bottles." |
| Incomplete outcome data (attrition bias) All outcomes | Low risk | 394/410 (96.10%) of randomized participants were evaluated. "A total of 16 infants were excluded from the trial, as they had either moved away from the trial area (n = 12), or were absent during the trial period (n = 2) or the parents subsequently refused to participate (n = 2). Of the infants who completed the trial (n = 394), data on 96 infants was incomplete (ie they did not provide information for all the ten z‐scores and four intestinal permeabilities, serological variables and prevalences of parasite infections), and severe anaemic infants were also omitted from the trial". Inclusion of all randomized participants (number evaluable/number randomized): 96% (394/410). |
| Selective reporting (reporting bias) | Low risk | All stated outcomes reported. |
| Other bias | Low risk | No obvious other source of bias. |
| Methods | RCT Length of follow‐up: 11 months |
|
| Participants | All children living in endemic area Number analysed for primary outcome: 152 aged 1.5 to 8 years Age range: 1.5 to 8 years Inclusion criteria: children aged 1.5 to 8 years living in Nandipara, Bangladesh; 50% entered into trial; only those who provided stool sample and had anthropometric measurements taken at first visit entered Exclusion criteria: none stated |
|
| Interventions | Single dose vs placebo
|
|
| Outcomes |
|
|
| Notes | Location: Bangladesh Community category: 1 Groups stratified by intensity of Ascaris infection Source of funding not reported. |
|
| Risk of bias | ||
| Bias | Authors' judgement | Support for judgement |
| Random sequence generation (selection bias) | Unclear risk | "Randomly assigned", no further details provided. |
| Allocation concealment (selection bias) | Unclear risk | No details reported. |
| Blinding (performance bias and detection bias) All outcomes | Unclear risk | "Double‐blind". Participants blinded both placebo and treatment given as a flavoured syrup, no information about provider and assessor blinding. |
| Incomplete outcome data (attrition bias) All outcomes | Low risk | 82% (152/185) of randomized participants were evaluated. Reasons for leaving the trial early not reported. Inclusion of all randomized participants (number evaluable/number randomized): 82% (152/185). |
| Selective reporting (reporting bias) | High risk | Not all stated outcomes reported. |
| Other bias | Low risk | No obvious other source of bias. |
| Methods | Quasi‐RCT Length of follow‐up: 1.75 months (7 weeks) |
|
| Participants | All children living in endemic area Number analysed for primary outcome: 64 Age range: 6 to 10 years Inclusion criteria: boys aged 6 to 10 years attending second grade at 3 primary schools; completed assessment and provided a stool sample; randomized by descending hookworm count (all treated) Exclusion criteria: none stated |
|
| Interventions | Single dose vs placebo
|
|
| Outcomes |
Not included in review: egg counts arithmetic and geometric means (Kato‐Katz); weight‐for‐age (NCHS reference) |
|
| Notes | Location: Indonesia Community category: 1 Large drops in geometric mean egg counts in placebo noted Source of funding not reported. |
|
| Risk of bias | ||
| Bias | Authors' judgement | Support for judgement |
| Random sequence generation (selection bias) | Unclear risk | Randomized: "Randomly assigned" by descending A. lubricoides egg count" |
| Allocation concealment (selection bias) | Unclear risk | No details reported. |
| Blinding (performance bias and detection bias) All outcomes | Unclear risk | "Double‐blind". Participants blinded both placebo and treatment identical round white tablets, no information about provider and assessor blinding. |
| Incomplete outcome data (attrition bias) All outcomes | Low risk | 85% (64/75) of randomized participants were evaluated. Reasons for loss to follow‐up included: moved away, refused to be examined, did not return a stool sample, absent during examination. Not clear how many lost from each treatment group. Inclusion of all randomized participants (number evaluable/number randomized): 85% (64/75). |
| Selective reporting (reporting bias) | Low risk | All stated outcomes reported. |
| Other bias | Low risk | No obvious other source of bias. |
| Methods | RCT Length of follow‐up: 12 months |
|
| Participants | All children living in endemic area Number analysed for primary outcome: 330; mean age 8.3 years Inclusion criteria: all primary school children in grades 1, 2, and 3 in 2 schools in slum areas in Indonesia; randomized according to Ascaris egg count and age Exclusion criteria: children > 11; signs of puberty; signs of severe protein energy malnutrition |
|
| Interventions | Multiple doses vs placebo
|
|
| Outcomes |
Results of multivariate analysis using z‐scores presented and could not be used in meta‐analysis; unadjusted results not reported |
|
| Notes | Location: Indonesia Community category: 1 Placebo group showed an unexplained drop in egg counts at the 3‐month exam Source of funding: Directorate of Higher Education, Department of Education and Culture, Government of Indonesia through Hibah Bersaing Project I & II. Albendazole and placebo provided by Smithkline Beecham Pharmaceuticals Indonesia. |
|
| Risk of bias | ||
| Bias | Authors' judgement | Support for judgement |
| Random sequence generation (selection bias) | Unclear risk | Randomly assigned "by sex and egg count". |
| Allocation concealment (selection bias) | Unclear risk | No details reported. |
| Blinding (performance bias and detection bias) All outcomes | Unclear risk | No details reported. |
| Incomplete outcome data (attrition bias) All outcomes | High risk | 65% (330/507) of randomized participants were evaluated, number lost from each treatment group not reported. Inclusion of all randomized participants (number evaluable/number randomized): 65% (330/507). |
| Selective reporting (reporting bias) | Low risk | All stated outcomes reported. |
| Other bias | Low risk | No obvious other source of bias. |
| Methods | Cluster‐RCT Method to adjust for clustering: not adjusted (review authors adjusted using the ICC from Alderman 2006) Cluster unit: school Average cluster size: 33 ICCs: not reported Length of follow‐up: 2 years |
|
| Participants | All children living in endemic area Number analysed for primary outcome: 80 schools randomized containing 2659 children in class 3 Mean age: 104.5 months Inclusion criteria: children from class 3 and born in 1990 of 80/81 schools in the Red River delta of north Vietnam Exclusion criteria: none stated |
|
| Interventions | Multiple doses vs placebo
|
|
| Outcomes | Measured:
|
|
| Notes | Location: Vietnam Community category: 1 It is unclear what is meant by "randomization was adjusted so that there were equal numbers of schools in each district of the trial group". It is also appears as if the analysis has not taken into account the effects of cluster randomization. Source of funding not reported. |
|
| Risk of bias | ||
| Bias | Authors' judgement | Support for judgement |
| Random sequence generation (selection bias) | Unclear risk | "randomization was adjusted so that there were equal numbers of schools in each district of the trial group" (unclear what this means) |
| Allocation concealment (selection bias) | Low risk | Central allocation. "...using a list provided by the Ministry of Education". |
| Blinding (performance bias and detection bias) All outcomes | Unclear risk | Placebo was used, blinding not reported. |
| Incomplete outcome data (attrition bias) All outcomes | Unclear risk | Insufficient reporting of attrition/exclusions. 80 schools containing 56,444 pupils randomized, and those from class 3 used in trial. Inclusion of all randomized participants (number evaluable/number randomized): unclear; 80 schools containing 56,444 pupils randomized, and those from class 3 used in trial. |
| Selective reporting (reporting bias) | Low risk | All stated outcomes reported. |
| Other bias | Low risk | Although not adjusted for clustering, we used estimates to adjust in the review. Recruitment bias: low (schools) Baseline imbalance: low (characteristics similar) Loss of clusters: low (no loss reported) Incorrect analysis: not cluster adjusted (high risk) Comparability with RCTs randomizing individuals: unclear |
| Methods | RCT Length of follow‐up: 14 months |
|
| Participants | All children living in endemic area Number analysed for primary outcome: 320 Age range: 12 to 59 months Inclusion criteria: pre‐school children aged 12 to 59 months, either sex Exclusion criteria: severe anaemia < 5 g/dL, severe malaria |
|
| Interventions | Multiple doses vs placebo
Treatment strategy: 200 mg (one tablet) albendazole was given to children aged 1 year, 400 mg (two tablets) albendazole was given to children aged 2, 3, and 4 years. Children who were in the placebo group were given one or two (1 year) placebo (2 to 4 years) tablets. Treatment or placebo was given at baseline, 4, 8, and 12 months and then followed up for the last time at 14 months. Children in the placebo group were treated with albendazole at 14 months. |
|
| Outcomes |
Unable to use: nutritional status and anthropometric measures, at baseline and 14 months, no data was reported for these outcomes. Not included in review: infection with STHs, measured at baseline and 4, 8, 12, and 14 months (eggs or worms in stool sample). Incidence of malaria and malaria attacks, measured at baseline and 4, 8, 12, and 14 months. Adverse events not fully reported for albendazole treatment vs placebo. |
|
| Notes | Location: 4 semi‐urban villages, Osun State, Nigeria Community category: 3 No adverse events reported in the albendazole treatment group. Not reported for control group. Source of funding: Health Research Board (HRB) (Ireland). GlaxoSmithKline sponsored the drug albendazole which was used in the trial. |
|
| Risk of bias | ||
| Bias | Authors' judgement | Support for judgement |
| Random sequence generation (selection bias) | High risk | Quasi‐randomized, "During the first assessment each alternate child was assigned tablet B". |
| Allocation concealment (selection bias) | High risk | Alternation, one of the investigators "placed the albendazole and placebo tablets in containers labelled either A or B" later "The treatment coordinator [...] oversaw the allocation of treatments to the children". |
| Blinding (performance bias and detection bias) All outcomes | Low risk | Participants and key personnel were blinded. "Experienced physicians […] enrolled all participants, measured all trial endpoints, and were kept masked to treatment allocation of children. Field workers involved in data collection and mothers of participating children were also masked to the treatment allocation." "Albendazole and placebo tablets were identical". |
| Incomplete outcome data (attrition bias) All outcomes | High risk | 320 children (out of 1228, 26.1%) complied with all the follow‐up assessments and were included in the analyses. Inclusion of all randomized participants (number evaluable/number randomized): 26% (320/1228). |
| Selective reporting (reporting bias) | High risk | Nutritional status and anthropometric measures not reported. Main paper states these outcomes are reported in the companion paper; no data reported for these outcomes in the companion paper. |
| Other bias | Low risk | No obvious other source of bias. |
| Methods | RCT Length of follow‐up: 10 months |
|
| Participants | All children living in endemic area Number analysed for primary outcome: 337; unclear how many randomized Age range: 1 to 8 years old Inclusion criteria: enlisted from 9 rural communities in Pariquera‐Acu state of Sao Paulo Exclusion criteria: none stated |
|
| Interventions | Single dose vs placebo
|
|
| Outcomes |
|
|
| Notes | Location: Cameroon Community category: 1 Results reported as changes in nutritional status grouped into 3 categories: improved, deteriorated, no change (unclear on basis of which parameter), and proportions compared Source of funding: Fundação de Amparo à Pesquisa do Estado de São Paulo (FAPESP). |
|
| Risk of bias | ||
| Bias | Authors' judgement | Support for judgement |
| Random sequence generation (selection bias) | Unclear risk | "Randomized", no further details provided. |
| Allocation concealment (selection bias) | Unclear risk | No details reported. |
| Blinding (performance bias and detection bias) All outcomes | Unclear risk | Described as double blind, no details reported. |
| Incomplete outcome data (attrition bias) All outcomes | Unclear risk | No details about losses to follow‐up reported; "the present report only deals with those 337 that could be followed throughout the entire 10 months". Inclusion of all randomized participants (number evaluable/number randomized): unclear (337 analysed). |
| Selective reporting (reporting bias) | Low risk | All stated outcomes reported. |
| Other bias | Low risk | No obvious other sources of bias. |
| Methods | RCT Length of follow‐up: 6 months |
|
| Participants | All children living in endemic area Number analysed for primary outcome: 187 Age range: 6 to 10 years Inclusion criteria: selected (unclear how) urban and rural school primary children aged 6 to 10 years Exclusion criteria: not stated |
|
| Interventions | Single dose vs placebo
|
|
| Outcomes |
|
|
| Notes | Location: Sierra Leone Community category: 2 Source of funding: Fundação de Amparo à Pesquisa do Estado de São Paulo (FAPESP). |
|
| Risk of bias | ||
| Bias | Authors' judgement | Support for judgement |
| Random sequence generation (selection bias) | Unclear risk | "Randomized", no further details provided. |
| Allocation concealment (selection bias) | Unclear risk | No details reported. |
| Blinding (performance bias and detection bias) All outcomes | Unclear risk | No details reported. |
| Incomplete outcome data (attrition bias) All outcomes | High risk | 76% (187/247) of randomized participants were evaluated. Reasons for loss to follow‐up not reported. Inclusion of all randomized participants (number evaluable/number randomized): 76% (187/247). |
| Selective reporting (reporting bias) | Low risk | All stated outcomes reported. |
| Other bias | Low risk | No obvious other sources of bias. |
| Methods | RCT Length of follow‐up: 11 months |
|
| Participants | All children living in endemic area Number analysed for primary outcome: 74 Age range: 6 to 8 years Inclusion criteria: 65 pupils in first year of school randomly selected from each of 5 primary schools; schools included in a feeding scheme Exclusion criteria: age > 9 years; current use of iron supplements; inclusion in an iron fortification trial; infection (raised white cell count) |
|
| Interventions | Multiple doses vs placebo
Also: whole population 3/5 schools also allocated soup fortified with 20 mg elemental iron per day, and 100 mg vitamin C for 6 months; unclear whether this intervention was cluster randomized. All schools taking part in feeding programme providing bread, soup, and peanut butter to all pupils. |
|
| Outcomes |
Not included in review: other iron indices; stool egg counts (Visser filter method); z‐scores for weight‐for‐age, height for age, and weight‐for‐height. |
|
| Notes | Location: South Africa Community category: 3 In the Dickson 2000a Cochrane Review, the data were combined irrespective of the possible confounding effects of iron allocation; data extracted for albendazole‐iron placebo vs placebo‐placebo groups only for this review. Data stratified by baseline iron stores into 2 groups that were combined for meta‐analysis. Source of funding: Fortified and unfortified soup provided by Funa Foods, Zentel and placebo provided by SmithKline Beecham Pharmaceuticals (Pty) Ltd. |
|
| Risk of bias | ||
| Bias | Authors' judgement | Support for judgement |
| Random sequence generation (selection bias) | Unclear risk | "Randomly assigned", no further details provided. |
| Allocation concealment (selection bias) | Unclear risk | No details reported. |
| Blinding (performance bias and detection bias) All outcomes | Unclear risk | No details reported. |
| Incomplete outcome data (attrition bias) All outcomes | High risk | 72% (179/247) of randomized participants were evaluated. Reasons for loss to follow‐up not reported. Inclusion of all randomized participants (number evaluable/number randomized): 72% (179/247). |
| Selective reporting (reporting bias) | Low risk | All stated outcomes reported. |
| Other bias | Low risk | No obvious other source of bias. |
| Methods | RCT Length of follow‐up: 1 month |
|
| Participants | Infected children identified by screening Number analysed for primary outcome: unclear Age range: unclear Inclusion criteria: most severely infected 100 children in a primary school Exclusion criteria: children with schistosomiasis |
|
| Interventions | Single dose vs placebo
|
|
| Outcomes |
Not included in review: height; weight at baseline; standardized using NCHS standards; stool examination (intensity index designed for this trial); no nutritional outcomes reported that can be used in the review |
|
| Notes | Location: South Africa Community category: 1 No data used in meta‐analysis since SDs not provided. Source of funding: Janssen Pharmaceutica, South African Medical Research Council. |
|
| Risk of bias | ||
| Bias | Authors' judgement | Support for judgement |
| Random sequence generation (selection bias) | Unclear risk | "Assigned randomly", no further details provided. |
| Allocation concealment (selection bias) | Unclear risk | No details reported. |
| Blinding (performance bias and detection bias) All outcomes | Unclear risk | "A 'blind' procedure was adopted; the research assistant did not know whether a particular child had received drug or placebo". No further details provided. |
| Incomplete outcome data (attrition bias) All outcomes | Unclear risk | No details reported. Inclusion of all randomized participants (number evaluable/number randomized): unclear. |
| Selective reporting (reporting bias) | Low risk | All stated outcomes reported. |
| Other bias | Low risk | No obvious other source of bias. |
| Methods | Quasi‐RCT Length of follow‐up: 2 years |
|
| Participants | All children living in endemic area Number analysed for primary outcome: 314 Mean age: 8 years Inclusion criteria: school children aged 8 who provided a stool sample Exclusion criteria: concurrent illness; anthelminth treatment in previous 3 months |
|
| Interventions | Multiple doses vs placebo
|
|
| Outcomes | Measured:
|
|
| Notes | Location: Malaysia Community category: 1 No data used in meta‐analysis since SDs not provided Source of funding not reported. |
|
| Risk of bias | ||
| Bias | Authors' judgement | Support for judgement |
| Random sequence generation (selection bias) | High risk | Quasi‐randomized: block assignment design by school, then by sex, then by presence of worms as none, light, or moderate/heavy, and then by rank order of body weight in the group; used odd and even numbers; in urban area the odd numbered children were assigned to treatment; in the peri‐urban area the even numbered children were assigned to the treatment group. |
| Allocation concealment (selection bias) | Unclear risk | No details reported. |
| Blinding (performance bias and detection bias) All outcomes | High risk | Participants were blinded; trial staff not blinded to group assignment. |
| Incomplete outcome data (attrition bias) All outcomes | Low risk | 89% (314/353) of randomized participants were evaluated. Inclusion of all randomized participants (number evaluable/number randomized): 89% (314/353). |
| Selective reporting (reporting bias) | Low risk | All stated outcomes reported. |
| Other bias | Low risk | No obvious other sources of bias. |
| Methods | RCT Length of follow‐up: 6 months |
|
| Participants | All children living in endemic area (children screened for anaemia then randomized and all children treated) Number analysed for primary outcome: 510 randomized Mean age: ˜7.3 years Inclusion criteria: children in Grades 1 to 3 with haemoglobin < 110 g/L but not < 70 g/L Exclusion criteria: haemoglobin concentrations < 70 g/L |
|
| Interventions | Multiple dose vs placebo Factorial design Mebendazole 500 mg at 0 and 3 months
|
|
| Outcomes |
Not included in review: Ferritin; serum transferrin; worm prevalence; CRP. |
|
| Notes | Location: Vietnam Community category: 2 Source of funding: Neys‐van Hoogstraten Foundation, Ellison Medical Foundation and the Ministry of Education and Training, Vietnam. |
|
| Risk of bias | ||
| Bias | Authors' judgement | Support for judgement |
| Random sequence generation (selection bias) | Unclear risk | Randomized, no further details. |
| Allocation concealment (selection bias) | Low risk | Central allocation. "Randomization was carried out by a researcher [...] who did not know the children and could not introduce bias in the randomization". |
| Blinding (performance bias and detection bias) All outcomes | Low risk | Participants and key personnel blinded. "Children, teachers and researchers were blinded to the treatment". Placebo identical to intervention drug. |
| Incomplete outcome data (attrition bias) All outcomes | Low risk | 409/425 participants were evaluated. Reason for drop‐out: refusal (n = 16, intervention: 4.7%, placebo: 2.3%). Inclusion of all randomized participants (number evaluable/number randomized): 96% (409/425). |
| Selective reporting (reporting bias) | Low risk | Pre‐specfied outcomes reported. |
| Other bias | Low risk | No obvious other sources of bias. |
| Methods | RCT Length of follow‐up: 5 months |
|
| Participants | All children living in endemic area Number analysed for primary outcome: 121 for nutritional outcomes Age range: 5 to 14 years Inclusion criteria: children from a school identified as having high prevalence of hookworm on the basis of a previous survey Exclusion criteria: children with height above 137 cm girls and 145 cm for boys since these were the upper limits in the reference ranges |
|
| Interventions | Single dose vs placebo
|
|
| Outcomes | Measured:
Reported:
|
|
| Notes | Location: Botswana Community category: 1 Source of funding not reported. |
|
| Risk of bias | ||
| Bias | Authors' judgement | Support for judgement |
| Random sequence generation (selection bias) | Unclear risk | "Random sample of half the children" were give the treatment and the remaining the placebo; no further details reported. |
| Allocation concealment (selection bias) | Unclear risk | No details reported. |
| Blinding (performance bias and detection bias) All outcomes | Unclear risk | No details reported. |
| Incomplete outcome data (attrition bias) All outcomes | High risk | 53% (121/228) of randomized participants were evaluated. Inclusion of all randomized participants (number evaluable/number randomized): 53% (121/228). |
| Selective reporting (reporting bias) | Low risk | Pre‐specfied outcomes reported. |
| Other bias | Low risk | No obvious other sources of bias. |
| Methods | Cluster quasi‐randomized stepped‐wedge trial Method to adjust for clustering: CIs adjusted for clustering in regression modelling, robust standard errors presented (confirmed in correspondence with authors) Cluster unit: schools Average cluster size: 400 ICCs: not reported Length of follow‐up: one year for phased quasi‐randomized comparisons for health outcomes. Two years for school attendance |
|
| Participants | All children living in endemic area Number analysed for primary outcomes: 75 primary schools randomized containing 778 children analysed for haemoglobin. 9102 children analysed for weight and height, 32% and 34% of eligible population analysed for exam performance and cognitive tests, and 100% of eligible population analysed for school attendance Age range/mean age: school children 12 years or under Inclusion criteria: children from 75 primary schools in the trial area Exclusion criteria: girls > 13 years old |
|
| Interventions | Deworming package of interventions vs no treatment
|
|
| Outcomes |
Not included in review: worm prevalence and intensity, self reported sickness, worm prevention behaviours: proportion "clean" as per health worker observation, proportion wearing shoes as per health worker observation, self‐reported contact with fresh‐water in past week, access to home latrine, malaria/fever. |
|
| Notes | Location: Kenya Community category: 1 Source of funding: Sponsored by the World Bank and the Partnership for Child Development. |
|
| Risk of bias | ||
| Bias | Authors' judgement | Support for judgement |
| Random sequence generation (selection bias) | High risk | Schools in a deworming project were stratified by zone, their involvement with other NGO programmes, and then listed alphabetically and every third school assigned to start the programme in 1998, to start it in 1999, or to be a control. |
| Allocation concealment (selection bias) | High risk | Not concealed (see above). |
| Blinding (performance bias and detection bias) All outcomes | High risk | Pragmatic cluster implementation trial with no blinding. |
| Incomplete outcome data (attrition bias) All outcomes | Low risk | For haemoglobin, weight and height the outcomes have been measured on a random sub‐sample of the quasi‐randomized population. |
| Selective reporting (reporting bias) | Low risk | Outcome data not reported for cognitive tests, though authors state: Deworming treatment effects are not significantly different than zero for any component of the cognitive exam (results available on request). |
| Other bias | High risk | Recruitment bias: low (no asymmetric migration between schools) Baseline imbalance: low Loss of clusters: low (none reported) Incorrect analysis: low (correctly adjusted for clustering). Comparability with RCTs randomizing individuals: low Other sources of bias: high for confounding due to a co‐intervention. The drug intervention is accompanied by intensive health promotion that could account for some of the effects with key outcomes such as school attendance. |
| Methods | RCT Length of follow‐up: 5 years |
|
| Participants | All children living in endemic area Number analysed for primary outcome: 1423 Mean age: 15 months (randomized at 1.5 years) Inclusion criteria: 15 month old children whose mothers participated in the pregnancy phase of the trial (pregnant healthy women from the area, planning to deliver at Entebbe Hospital) Exclusion criteria: none stated |
|
| Interventions | Multiple dose vs placebo Factorial designa
aMothers when pregnant had been randomized in a 1:1:1:1 ratio to receive single‐dose albendazole (400 mg) + praziquantel (40 mcg/kg), albendazole + praziquantel placebo, albendazole placebo + praziquantel, or albendazole placebo + praziquantel placebo. |
|
| Outcomes |
Not included in review: immune response at age 5 years to BCG and tetanus immunisation, incidence of malaria, diarrhoea, pneumonia, measles, and tuberculosis, measures of fine motor function and gross motor function. |
|
| Notes | Location: Entebbe, Uganda Community category: 3 Source of funding: Wellcome Trust |
|
| Risk of bias | ||
| Bias | Authors' judgement | Support for judgement |
| Random sequence generation (selection bias) | Low risk | Randomization code generated by statistician using Stata version 7. |
| Allocation concealment (selection bias) | Unclear risk | No details reported. |
| Blinding (performance bias and detection bias) All outcomes | Unclear risk | Participants and provider blinded. Not reported for assessors. |
| Incomplete outcome data (attrition bias) All outcomes | High risk | Inclusion of all randomized participants (number evaluable/number randomized): 71% (1423/2016) of randomized participants. |
| Selective reporting (reporting bias) | High risk | Serious adverse events not reported. |
| Other bias | Low risk | No other obvious source of bias. |
| Methods | RCT Length of follow‐up: 4 months |
|
| Participants | All children living in endemic area Number analysed for primary outcome: 510 randomized Age range: 6 to 8 years Inclusion criteria: school children aged 6 to 8 years and written informed consent from parents/caregivers Exclusion criteria: haemoglobin concentrations < 80 g/L, chronic illness, congenital abnormalities, mental or severe physical handicap, severe malnutrition ([z‐scores for weight‐for‐height (WHZ) < ‐3.0 SD), obesity (BMI ≥ 25 or z‐scores for WHZ > +2 SD), or receiving deworming within the previous 6 months |
|
| Interventions | Single dose vs placebo
|
|
| Outcomes |
Not included in review: changes in zinc, iodine, and ferritin concentration; worm prevalence Measured but not reported: weight and height recorded at baseline and end point but only baseline data reported. Skin fold thickness recorded at baseline and end point, but no data reported. |
|
| Notes | Location: Vietnam Community category: 2 This trial was supported by the Neys‐van Hoogstraten Foundation, The Netherlands, and the Ellison Medical Foundation. |
|
| Risk of bias | ||
| Bias | Authors' judgement | Support for judgement |
| Random sequence generation (selection bias) | Low risk | Computer generated. "pupils were allocated to 1 of the 4 intervention groups based on a computer generated list, matched on age (12‐mo age groups) and sex, and using a block size of 8 by one of the researchers not involved in the field work". |
| Allocation concealment (selection bias) | Low risk | Central allocation. |
| Blinding (performance bias and detection bias) All outcomes | Low risk | Participants and key personnel were blinded. "All investigators, field assistants, teachers, and children did not know the codes of the trial groups". Placebo identical to treatment (orange chewable tablet). |
| Incomplete outcome data (attrition bias) All outcomes | Low risk | 482/510 randomized participants were evaluated. Reasons for drop‐out: moved (n =12), surgery (n = 2), refusal to participate (n = 14), balanced across intervention groups. Inclusion of all randomized participants (number evaluable/number randomized): 94.5% (482/510). |
| Selective reporting (reporting bias) | High risk | Three outcomes (weight, height and skin fold thickness) not reported adequately. |
| Other bias | Low risk | No obvious other source of bias. |
| Methods | RCT Length of follow‐up: 2.25 months (9 weeks) |
|
| Participants | Infected children identified by screening Number analysed for primary outcome: 103 Age range: 9 to 12 years Inclusion criteria: children from 3 schools in Mandeville; Trichuris egg counts > 1900, but low hookworm counts on 2 occasions before the trial separated by 3 months Exclusion criteria: twins; severe illness; physical handicaps; neurological disorders |
|
| Interventions | Single dose vs placebo
|
|
| Outcomes | Cognitive tests: digit span forwards/backwards; arithmetic and coding from Wechsler Intelligence Scale for Children; fluency and listening comprehension from the Clinical Evaluation of Language functions; and matching familiar figures test. Not included in review: stool egg counts at baseline and 10 days (prevalence and arithmetic mean); height and weight (expressed as % NCHS standard) iron status; school attendance; IQ; socioeconomic status; educational opportunity measures at baseline. Outcomes not reported: nutritional outcomes at 9 weeks cited as too short a follow‐up period to demonstrate a change;school attendance only measured at baseline. |
|
| Notes | Location: Jamaica Community category: 1 There was an infected placebo group and an "uninfected control group" Source of funding not reported. |
|
| Risk of bias | ||
| Bias | Authors' judgement | Support for judgement |
| Random sequence generation (selection bias) | Unclear risk | "Randomly assigned"; no further details reported. |
| Allocation concealment (selection bias) | Unclear risk | No details reported. |
| Blinding (performance bias and detection bias) All outcomes | Unclear risk | No details reported. |
| Incomplete outcome data (attrition bias) All outcomes | High risk | 73% (103/140) of randomized participants were evaluated. Inclusion of all randomized participants (number evaluable/number randomized): 73% (103/140). |
| Selective reporting (reporting bias) | Unclear risk | Pyschometric tests reported; other outcomes such as nutrition not reported. |
| Other bias | Low risk | No obvious other source of bias. |
| Methods | RCT Length of follow‐up: 6 months for randomized comparison |
|
| Participants | All children living in endemic area Number analysed for primary outcome: 1518 randomized, 90% followed up at 6 months Age range/mean age: 10.5 years Inclusion criteria: school age children Exclusion criteria: failure to submit 2 stool specimens prior to the initial treatment, known allergy to either drug, treatment with either drug within 6 months, lack of consent, and marriage or possible pregnancy |
|
| Interventions | Single dose vs placebo Albendazole (400 mg) plus praziquantel (40 mg/kg) Praziquantel plus an albendazole placebo Albendazole plus a praziquantel placebo Both placebos |
|
| Outcomes | No useable data. Not included in review: ultrasound, physical examination and history findings, duplicate stool and urine measurements of egg counts Measured but not reported: weight, height, skinfold thickness (subscapular, triceps, and abdominal) and haemoglobin recorded at baseline and end point but only baseline data reported; data for side effects not useable in review |
|
| Notes | Location: China, Philippines and Kenya Community category: 1 randomized comparison up to 6 months at which point all infected children were treated as needed, and followed up until one year. There was no difference between the side effect rate from albendazole or the double placebo Result text: "No statistically significant improvement was seen in haemoglobin after albendazole treatment. In the trial population as a whole, no significant differences between treatment groups were seen in any of the growth and anthropometric measurements." Source of funding: Tropical Disease Research of the WHO. |
|
| Risk of bias | ||
| Bias | Authors' judgement | Support for judgement |
| Random sequence generation (selection bias) | Low risk | Computer generated. "Randomization lists were prepared by WHO/TDR using a randomized block design with a block size of 80". |
| Allocation concealment (selection bias) | Low risk | Central allocation. |
| Blinding (performance bias and detection bias) All outcomes | Low risk | Participants, key personnel, and outcome assessment was blinded. "The randomization code was not broken until after the 6‐month results were tabulated and submitted to WHO". |
| Incomplete outcome data (attrition bias) All outcomes | Low risk | 1518 participants, 90% at 6 months follow‐up, 83% at one year, no further details. Inclusion of all randomized participants (number evaluable/number randomized): 90% (1366/1518). |
| Selective reporting (reporting bias) | High risk | Weight, height, skinfold thickness, and haemoglobin recorded at baseline and end point but only baseline data reported. |
| Other bias | Low risk | No obvious other source of bias. |
| Methods | RCT Length of follow‐up: 9 weeks (2.25 months) |
|
| Participants | All children living in endemic area Number analysed for primary outcome: 191 Age range: 2 to 5 years Inclusion criteria: children ages 2 to 5 years registered at village health centres Exclusion criteria: none stated |
|
| Interventions | Single dose vs placebo
|
|
| Outcomes |
Not included in review: z‐scores for height‐for‐age, weight‐for‐age, and weight‐for‐height (NCHS reference) |
|
| Notes | Location: Java, Indonesia Community category: 2 Source of funding: Kimia Farma Indonesia. |
|
| Risk of bias | ||
| Bias | Authors' judgement | Support for judgement |
| Random sequence generation (selection bias) | Unclear risk | "The children were randomly divided into three, equal‐sized treatment groups". No further details reported. |
| Allocation concealment (selection bias) | Unclear risk | No details reported. |
| Blinding (performance bias and detection bias) All outcomes | Unclear risk | Described as double blind. Participants were blinded, unclear whether provider and assessor were blinded. |
| Incomplete outcome data (attrition bias) All outcomes | Low risk | 97% (289/299) of enrolled participants were evaluated. Inclusion of all randomized participants (number evaluable/number randomized): 97% (289/299). |
| Selective reporting (reporting bias) | Low risk | Pre‐specfied outcomes reported. |
| Other bias | Low risk | No obvious other source of bias. |
| Methods | Cluster‐RCT Method to adjust for clustering: not adjusted Cluster unit: village Average cluster size: 114 ICCs: not reported Length of follow‐up: 18 months |
|
| Participants | All children living in endemic area Number analysed for primary outcome: 13 villages randomized containing 1402 children Age range: 2 to 6 years Inclusion criteria: children ages 2 to 6 years from 13 villages surrounding a mother and child health centre; subgroup living in 8 villages within waking distance of health centre analysed for additional outcomes Exclusion criteria: none stated |
|
| Interventions | Multiple doses vs placebo
|
|
| Outcomes |
|
|
| Notes | Location: Bangladesh Community category: 1 No adjustment made for cluster randomization Source of funding: the Overseas Development Administration and the University of Cambridge Maintenance Fund. |
|
| Risk of bias | ||
| Bias | Authors' judgement | Support for judgement |
| Random sequence generation (selection bias) | Unclear risk | The trial was described as randomized, no further details reported. |
| Allocation concealment (selection bias) | Unclear risk | No details reported. |
| Blinding (performance bias and detection bias) All outcomes | Low risk | Participants and field workers were blinded, unclear if assessment was blinded. "The treatment and placebo tablets were given in a double‐blind manner; neither the fieldworkers nor the parents were aware of the group to which they belonged". |
| Incomplete outcome data (attrition bias) All outcomes | Low risk | 94% (1402/1476) of enrolled participants were evaluated. Inclusion of all randomized participants (number evaluable/number randomized): 94% (1402/1476). |
| Selective reporting (reporting bias) | Low risk | Not all pre‐specified outcomes reported. |
| Other bias | Low risk | Recruitment bias: unclear (not known if children shift clinics in the light of the intervention) Baseline imbalance: low (no differences apparent) Loss of clusters: low (none reported) Incorrect analysis: not adjusted (high risk) Comparability with RCTs randomizing individuals: unclear |
| Methods | RCT Length of follow‐up: 4 months (16 weeks) |
|
| Participants | Infected children identified by screening Number analysed for primary outcome: 81 Age range: 2 to 12 years Inclusion criteria: children ages 2 to 12 living in Mirpur slum infected with Ascaris Exclusion criteria: none stated |
|
| Interventions | Single dose vs placebo
|
|
| Outcomes |
Not included in review: median % weight‐for‐age, weight‐for‐height, and height‐for‐age |
|
| Notes | Location: Bangladesh Community category: 1 Source of funding: research grant from the World Bank and was funded by the Bangladesh National Nutrition Council. |
|
| Risk of bias | ||
| Bias | Authors' judgement | Support for judgement |
| Random sequence generation (selection bias) | Low risk | "Random table". |
| Allocation concealment (selection bias) | Unclear risk | No details reported. |
| Blinding (performance bias and detection bias) All outcomes | Low risk | "Double‐blind"; "The syrups were identical in appearance and flavor and were packaged in identical containers. Randomized patient numbers were labeled on the bottles to maintain the double blind design". |
| Incomplete outcome data (attrition bias) All outcomes | Low risk | 94% (81/85) of randomized participants were evaluated. Inclusion of all randomized participants (number evaluable/number randomized): 94% (81/85). |
| Selective reporting (reporting bias) | Low risk | Pre‐specfied outcomes reported. |
| Other bias | Low risk | No obvious other source of bias. |
| Methods | RCT Length of follow‐up: 6.5 months (26 weeks) |
|
| Participants | Infected children identified by screening Number analysed for primary outcome: 392 Age range: 6 to 12 years Inclusion criteria: children in grades 2 to 5 of 14 schools in Jamaica with intensities of Trichura > 1200 eggs/g Exclusion criteria: children with mental handicaps identified by their teachers |
|
| Interventions | Multiple doses vs placebo
|
|
| Outcomes | 1. Main trial (264 children) Wide range achievement test: reading, arithmetic, and spelling subtests; school attendance from children with class registers pre‐ and post‐intervention, height‐for‐age z‐score, body mass index pre‐ and post‐intervention 2. Subgroup 1 (189 infected children from original population) Digit span; verbal fluency test; visual search; number choice; French vocabulary learning 3. Subgroup 2 (97 children from grade 5) French learning; digit spans (forward and backward); Corsi block span; verbal fluency; picture search; silly sentences Other outcomes measured but not reported: stool at baseline and at 8 weeks after second treatment round (Kato): prevalence and intensity, weight, height, z‐scores (NCHS standard) |
|
| Notes | Location: Jamaica Community category: 1 Source of funding: grant from the James S. McDonnell Foundation. |
|
| Risk of bias | ||
| Bias | Authors' judgement | Support for judgement |
| Random sequence generation (selection bias) | Low risk | Random‐numbers table. |
| Allocation concealment (selection bias) | Unclear risk | No details reported. |
| Blinding (performance bias and detection bias) All outcomes | Unclear risk | Paricipants blinded; unclear whether assessors were blinded. |
| Incomplete outcome data (attrition bias) All outcomes | Low risk | 96% (392/407) of randomized participants were evaluated. Inclusion of all randomized participants (number evaluable/number randomized): 96% (392/407). |
| Selective reporting (reporting bias) | Low risk | All stated outcomes reported. |
| Other bias | Low risk | No obvious other source of bias. |
| Methods | RCT Length of follow‐up: 16 weeks |
|
| Participants | All children living in endemic area Number analysed for primary outcome: 808/851 Age range/ mean age: 10 years Inclusion criteria: Children in grades 1 to 6 Exclusion criteria: Children with Haemoglobin < 8 g/dL |
|
| Interventions | Single dose vs placebo
|
|
| Outcomes | No useable data Not included in review: urine iodine, stool egg count. Measured but not reported: weight, height, haemoglobin, physical fitness (Harvard step test), heart rate, cognitive ability measured by the Primary Mental Abilities Test for Filipino Children. The test measures verbal, non verbal and quantitative skills. |
|
| Notes | Location: Philippines Community category: 2 Narrative results: No significant difference in change in weight. Deworming improved the iron status of a subgroup of moderately to severely subjects. Deworming had either no effect or a negative effect on fitness scores, and the effect on heart rate was inconclusive. Deworming had either no effect or a negative effect on mental ability scores. Sources of support: The Nutrition Center of the Philippines, The Procter & Gamble Co. |
|
| Risk of bias | ||
| Bias | Authors' judgement | Support for judgement |
| Random sequence generation (selection bias) | Unclear risk | Randomization at individual level, no further details. |
| Allocation concealment (selection bias) | Unclear risk | No details reported. |
| Blinding (performance bias and detection bias) All outcomes | Low risk | Double‐blind trial. "Both the researchers and the trial participants were blinded to the treatment assignment of each child". "Placebo beverage and placebo anthelmintic pills were indistinguishable from their counterparts in appearance, smell and taste". |
| Incomplete outcome data (attrition bias) All outcomes | Low risk | 808/851 (95%) enrolled participants were evaluated, no reasons for withdrawal reported. Inclusion of all randomized participants (number evaluable/number randomized): 95% (808/851). |
| Selective reporting (reporting bias) | High risk | Nutritional and haemoglobin outcomes not fully reported. |
| Other bias | Low risk | No obvious other source of bias. |
| Methods | RCT Length of follow‐up: 6 months |
|
| Participants | Infected children (all children in the school were known to be infected) Number analysed for primary outcome: 150 Age range/mean age: 8.5 years Inclusion criteria: all available children in lower grades (standards 1 and 2) in Mvindeni Primary School, Kwale district (unscreened); subgroup of 36 boys chosen; haemoglobin > 8 g/dL; willing to co‐operate in physical tests; pre‐pubertal Exclusion criteria: haemoglobin < 8 g/dL |
|
| Interventions | Single dose vs placebo
|
|
| Outcomes |
Not included in review: all above converted to % median for sex and age; prevalence and mean egg counts (arithmetic and geometric means) Test heart rates and score for subgroup |
|
| Notes | Location: Kenya Community category: 1 Source of funding: Smith Kline & French Laboratories, Ltd., and the Edna McConnell Clark Foundation, grant 284‐0120. |
|
| Risk of bias | ||
| Bias | Authors' judgement | Support for judgement |
| Random sequence generation (selection bias) | Unclear risk | "allocated at random within sex", no further details reported. |
| Allocation concealment (selection bias) | Unclear risk | No details reported. |
| Blinding (performance bias and detection bias) All outcomes | Low risk | Participants blinded, tablets identical for treatment and placebo; "Both examinations were carried out with the same team of workers, each doing the same procedures, and were done in a blind fashion". |
| Incomplete outcome data (attrition bias) All outcomes | Low risk | 88% (150/171) of randomized participants were evaluated, reasons for losses to follow‐up not reported. Inclusion of all randomized participants (number evaluable/number randomized): 88% (150/171). |
| Selective reporting (reporting bias) | Low risk | Pre‐specified outcomes reported. |
| Other bias | Low risk | No obvious other source of bias. |
| Methods | RCT Length of follow‐up: 3.6 months (subgroup) and 8.2 months (main trial) |
|
| Participants | Infected children (all children in the school were known to be infected) Number analysed for primary outcome: 284 Age range/ mean age: 7 to 13 years Inclusion criteria: all school children (unscreened) in grades 1 to 5 in Mvindeni Primary School Subgroup (53 analysed) of 60 boys chosen because haemoglobin > 80 g/L, willing to cooperate in physical tests and appetite tests, pre‐pubertal, infected with at least 1 of helminths (screened), hookworm < 20,000 eggs/g; hookworm or Trichuris count > 1000 eggs/g or Ascaris > 4000 eggs/g Exclusion criteria: Severe anaemia (haemoglobin < 75 g/L) |
|
| Interventions | Multiple doses vs placebo
|
|
| Outcomes |
Not included in review: prevalence, eggs/g: geometric and arithmetic mean; converted to percentage of median for age and sex using NCHS references; % weight‐for‐age, % height for age; % weight‐for‐height; % arm circumference for age; % triceps for age; % subscapular for age; appetite (self‐rating and snack consumed intake in kJ) |
|
| Notes | Location: Kwale, Kenya Community category: 1 Source of funding: supported in part by Thrasher Research Fund and SmithKline Beecham, Ltd. |
|
| Risk of bias | ||
| Bias | Authors' judgement | Support for judgement |
| Random sequence generation (selection bias) | Unclear risk | "at random within sex by descending hookworm egg count". |
| Allocation concealment (selection bias) | Unclear risk | No details reported |
| Blinding (performance bias and detection bias) All outcomes | Low risk | Participants blinded, tablets identical for treatment and placebo; "Both examinations were conducted by the same team, each doing the same procedures, and were done in a blind fashion". |
| Incomplete outcome data (attrition bias) All outcomes | Low risk | 86% (284/328) of randomized participants were evaluated, reasons for losses to follow‐up not reported. Inclusion of all randomized participants (number evaluable/number randomized): 86% (284/328). |
| Selective reporting (reporting bias) | Low risk | Pre‐specified outcomes reported |
| Other bias | Low risk | No obvious other source of bias |
| Methods | Cluster‐RCT Method to adjust for clustering: generalised estimating equations Cluster unit: school Average cluster size: 255 ICCs: not reported Length of follow‐up: 12 months |
|
| Participants | All children living in endemic area Number analysed for primary outcome: 12 schools randomized containing 3063 children Mean age: 10.5 years Inclusion criteria: children in grades 1 to 5 from 12 randomly selected schools on Pemba island; only grades 1 to 4 included in evaluation of nutritional effect Exclusion criteria: none stated |
|
| Interventions | Multiple doses vs placebo
|
|
| Outcomes |
Estimates are provided from multiple regression models taking into account various baseline differences for 2 subgroups above and below 10 years old. Unadjusted outcomes not presented. (These 2 groups were combined in the Dickson 2000a Cochrane Review.) Other outcomes measured but not reported: micronutrient status (blood) for protoporphyrin and serum ferritin; stool egg count (Kato‐Katz); z‐scores for height‐for‐age and weight‐for‐height; body mass index. |
|
| Notes | Location: Zanzibar, Tanzania Community category: 1 Appropriate adjustment made for cluster randomization using general estimating equation Source of funding: funded through cooperative agreement DAN‐5116‐1‐00‐8051‐00 between The Johns Hopkins University and the Office of Health and Nutrition, United States Agency for International Development. |
|
| Risk of bias | ||
| Bias | Authors' judgement | Support for judgement |
| Random sequence generation (selection bias) | Unclear risk | 3 schools randomly selected from each of the 4 districts, and then allocated. |
| Allocation concealment (selection bias) | Unclear risk | No details reported. |
| Blinding (performance bias and detection bias) All outcomes | Unclear risk | No details reported. |
| Incomplete outcome data (attrition bias) All outcomes | Low risk | 84% (3063/3605) of randomized participants were evaluated, reasons for losses to follow‐up not reported. Inclusion of all randomized participants (number evaluable/number randomized): 84% (3063/3605). |
| Selective reporting (reporting bias) | High risk | Not all pre‐specified outcomes reported adequately. |
| Other bias | Low risk | Recruitment bias: low (Unlikely to change schools) Baseline imbalance: low (no differences apparent) Loss of clusters: low (none reported) Incorrect analysis: cluster adjusted (low risk) Comparability with RCTs randomizing individuals: unclear |
| Methods | RCT (factorial design) Length of follow‐up: 12 months |
|
| Participants | All children living in endemic area Number analysed for primary outcome: 359 in Mebendazole arm aged 6 to 59 months Age range: 3 to 56 months Inclusion criteria: all children in Kengeja village, with age reported as 3 to 56 months by parents; 3 months before planned start of trial (pre‐school children) Exclusion criteria: severe anaemia (< 70 g/L) |
|
| Interventions | Multiple doses vs placebo
Treatment strategy: randomized and treated all children Both groups also received: 0.5 mL ferrous sulfate (20 mg/mL); 10 mg iron daily for 1 year or placebo as per factorial design |
|
| Outcomes |
Not included in review: prevalence and egg counts (no SD/SEM); motor and language scores (results of multiple regression and correlations; raw data not reported) haemoglobin (results not reported by randomized comparisons) Others measured but not reported: stool (Kato‐Katz); weight; height; malaria film; ferritin; appetite as reported by mothers |
|
| Notes | Location: Zanzibar, Tanzania Community category: 2 Factorial design, with households randomized to iron, random allocation of mebendazole by child, stratified by iron allocation and age grouped households. An iron with mebendazole treatment term was tested in all regression models, but it did not reach significance Source of funding: Thrasher Research Fund between The Johns Hopkins University and the United States Agency for International Development, AL Pharma, Baltimore, MD, and Pharmamed, Malta. |
|
| Risk of bias | ||
| Bias | Authors' judgement | Support for judgement |
| Random sequence generation (selection bias) | Unclear risk | Randomized by "blocks of 4", no further details reported. |
| Allocation concealment (selection bias) | Low risk | Pills in bottles with unique treatment codes, assigned by 1 investigator, codes kept in sealed envelopes. |
| Blinding (performance bias and detection bias) All outcomes | Unclear risk | Participants and provider were blinded; unclear whether assessor was blinded. |
| Incomplete outcome data (attrition bias) All outcomes | High risk | 52% (359/684) enrolled participants were evaluated. Inclusion of all randomized participants (number evaluable/number randomized): 52% (359/684 = 52%). |
| Selective reporting (reporting bias) | Low risk | All prespecified outcomes reported. |
| Other bias | High risk | No obvious other source of bias. |
| Methods | RCT Length of follow‐up: 12 months |
|
| Participants | All children living in endemic area Number analysed for primary outcome: 683 Age range: 2 to 5 years Inclusion criteria: all children aged 2 to 5 in slum area of Tiljala identified and enrolled Exclusion criteria: major illnesses; birth defects; and unwillingness to participate |
|
| Interventions | Multiple doses vs placebo
|
|
| Outcomes |
Other outcomes measured but not reported: stool samples from random sample of 30% (formalin concentration technique) for prevalence of Ascaris; weight‐for‐age; diarrhoeal episodes |
|
| Notes | Location: India Community category: 2 Source of funding: Indian Council of Medical Research, New Delhi, India. |
|
| Risk of bias | ||
| Bias | Authors' judgement | Support for judgement |
| Random sequence generation (selection bias) | Low risk | Computer‐generated random numbers sequence. |
| Allocation concealment (selection bias) | Low risk | Identical coded bottles. |
| Blinding (performance bias and detection bias) All outcomes | Low risk | Participants and key personnel were blinded. |
| Incomplete outcome data (attrition bias) All outcomes | Low risk | 97% (683/702) of enrolled participants were evaluated. Inclusion of all randomized participants (number evaluable/number randomized): 97% (683/702). |
| Selective reporting (reporting bias) | High risk | Incomplete reporting of some outcomes (prevalence of Ascaris in stools; weight‐for‐age; diarrhoeal episodes). |
| Other bias | Low risk | No obvious other source of bias. |
| Methods | RCT Length of follow‐up: 12 months |
|
| Participants | Infected children identified by screening Mean age: 7.3 years Number analysed for primary outcome: 33 Inclusion criteria: children with confirmed Trichus trichiura in a rural school Exclusion criteria: none reported |
|
| Interventions | Single dose vs placebo
|
|
| Outcomes |
Not included in review: urinary TNF‐alpha levels |
|
| Notes | Location: Sekolah Rendah Kebangsaan Tawang, Kelantan, Malaysia Community category: NA Source of funding: Universiti Sains Malaysia Short Term Grant. |
|
| Risk of bias | ||
| Bias | Authors' judgement | Support for judgement |
| Random sequence generation (selection bias) | Low risk | Randomization software was used. |
| Allocation concealment (selection bias) | Unclear risk | No details reported. |
| Blinding (performance bias and detection bias) All outcomes | Unclear risk | For participants and assessors, no details were reported. " Both the active drug and placebo were repackaged by a pharmacist blinded to the trial groups". |
| Incomplete outcome data (attrition bias) All outcomes | Low risk | 33/37 participants analysed for the primary outcome; reasons for loss to follow‐up unclear. Inclusion of all randomized participants (number evaluable/number randomized): 89% (33/37). |
| Selective reporting (reporting bias) | Low risk | All stated outcomes reported. |
| Other bias | Low risk | No obvious other source of bias. |
| Methods | RCT Length of follow‐up: 6 months |
|
| Participants | All children living in endemic area Number analysed for primary outcome: 226 for nutritional outcomes, reduced for cognitive outcomes Age range: 7 to 12 years Inclusion criteria: children attending grades 1 to 4 in primary schools in the Guatemalan highlands Exclusion criteria: > 12 years; deworming medicine in last year |
|
| Interventions | Multiple doses vs placebo
|
|
| Outcomes |
Not included in review: egg counts (Kato‐Katz: arithmetic and geometric mean); z‐scores (NCHS‐CDC‐WHO reference) for weight‐for‐age, change in weight‐for‐age, height, change in height, height‐for‐age, change in height‐for‐age, weight‐for‐height, and change in height‐for‐age. |
|
| Notes | Location: Guatemala Community category: 1 Source of funding: Pew Charitable Trusts, the US Agency for International Development University Development and Linkage Program, the Children’s Miracle Network Telethon, and the ARCS Foundation. |
|
| Risk of bias | ||
| Bias | Authors' judgement | Support for judgement |
| Random sequence generation (selection bias) | Unclear risk | "stratified by gender and age and then randomly assigned". |
| Allocation concealment (selection bias) | Unclear risk | No details reported. |
| Blinding (performance bias and detection bias) All outcomes | Low risk | "The children and field workers were unaware of treatment group assignment". |
| Incomplete outcome data (attrition bias) All outcomes | Low risk | 90% (226/250) of randomized participants were evaluated. “No differences were detected in treatment group assignment, initial age, anthropometry, SES, and worm status between the 228 children who remained in the trial and the 18 who dropped out.” Sample size for nutritional data is smaller due to missing data. Inclusion of all randomized participants (number evaluable/number randomized): 90% (226/250). |
| Selective reporting (reporting bias) | Low risk | Pre‐specified outcomes reported. |
| Other bias | Low risk | No other obvious source of bias. |
| Methods | RCT Length of follow‐up: 12 months |
|
| Participants | All children living in endemic area Number analysed for primary outcome: 268 Age range: 6 to 91 months Inclusion criteria: pre‐school children from Ubiri village who attended clinic and produced a stool sample Exclusion criteria: none stated |
|
| Interventions | Multiple doses
|
|
| Outcomes |
Measured but not reported: height; length; stool egg count in subgroup (Kato method); growth rates using least square method. |
|
| Notes | Location: Tanzania Community category: 3 Source of funding: Research and Publications Committee, University of Dar es Salaam. Analysis was supported by a training grant (HL 05998‐04) from the National Heart, Lung and Blood Institute, NIH, DHEW Bethesda, MD. |
|
| Risk of bias | ||
| Bias | Authors' judgement | Support for judgement |
| Random sequence generation (selection bias) | Low risk | Random‐numbers table. |
| Allocation concealment (selection bias) | Unclear risk | No details reported. |
| Blinding (performance bias and detection bias) All outcomes | Low risk | "children were weighed and measured as before by a person unaware of their treatment status"; placebo and treatment given as a flavoured syrup. |
| Incomplete outcome data (attrition bias) All outcomes | High risk | 78% (268/341) of randomized participants were evaluated; inclusion of all randomized participants (number evaluable/number randomized): 78% (268/341). |
| Selective reporting (reporting bias) | High risk | Not all pre‐specified outcomes reported. |
| Other bias | Low risk | No obvious other source of bias. |
| Methods | Cluster RCT Method to adjust for clustering: primary outcome of BMI was not adjusted for clustering Cluster unit: household Average cluster size: 4 ICCs: not reported Length of follow‐up: 21 months |
|
| Participants | All children living in endemic area Number analysed for primary outcome: 954 households containing 855 participants Age range/mean age: Children aged 19 years and less Inclusion criteria: all household in members except those < 2 years old or pregnant Exclusion criteria: none stated |
|
| Interventions | Single dose vs placebo
|
|
| Outcomes |
aBMI measured in children aged 19 years and less. Not included in review: Malaria‐like symptoms questionnaire, finger prick blood test for malaria, skin prick tests, symptoms of asthma and atopic dermatitis, stool sample for Tichuris and hookworms. |
|
| Notes | Location: Ende district of Flores Island, Indonesia Community category: 1 Source of funding: The Royal Netherlands Academy of Arts and Science (KNAW), European, Prof. Dr. P.C. Flu Foundation. |
|
| Risk of bias | ||
| Bias | Authors' judgement | Support for judgement |
| Random sequence generation (selection bias) | Low risk | "Random Allocation software" used. |
| Allocation concealment (selection bias) | Unclear risk | No details reported. |
| Blinding (performance bias and detection bias) All outcomes | Unclear risk | Participants and personnel blinded. "The treatment code was concealed from trial investigators and participants. The un‐blinding of treatment codes occurred after all laboratory results had been entered into the database." Not reported whether the assessors for height and weight were blinded. |
| Incomplete outcome data (attrition bias) All outcomes | Unclear risk | Number of children randomized was not reported. |
| Selective reporting (reporting bias) | Low risk | All stated outcomes reported. |
| Other bias | Low risk | Recruitment bias: low (unlikely to change households) Baseline imbalance: low (no differences apparent) Loss of clusters: low (ITT analysis done; in the albendazole arm 61 people moved to a house that was assigned to placebo while in the placebo arm 62 people moved to a house that was assigned to albendazole) Incorrect analysis: cluster adjusted (low risk) Comparability with RCTs randomizing individuals: unclear |
| Methods | RCTRCT Length of follow‐up: 6 months |
|
| Participants | Infected children identified by screening Number analysed for primary outcome: 194 Age range: 9 to 12 years Inclusion criteria: children aged 9 to 12 years from 5 primary schools, with at least one type of STH infection. Exclusion criteria: deworming treatment within 6 months before the current trial. |
|
| Interventions | Single dose vs placebo
|
|
| Outcomes |
Not included in review: parasitological examination. |
|
| Notes | Location: Bulanghsam township bordering Myanmar, a sub‐division of Menghai county in Xishuangbanna Dai autonomous prefecture, situated in Yunnan province, P.R. China Community category: N/A Source of funding: Swiss Tropical and Public Health Institute in Basel, Switzerland and the National Institute of Parasitic Diseases, Chinese Center of Diseases Control and Prevention in Shanghai, P.R. China. |
|
| Risk of bias | ||
| Bias | Authors' judgement | Support for judgement |
| Random sequence generation (selection bias) | Low risk | "The treatment allocation sequence was generated by a statistician using block randomization with randomly varying block sizes of 2, 4, and 6." |
| Allocation concealment (selection bias) | Low risk | "Albendazole and placebo tablets were packaged by staff not involved in the field work into sealed envelopes marked with unique identifiers." |
| Blinding (performance bias and detection bias) All outcomes | Unclear risk | Participants and personnel blinded. Not reported whether the assessors for height and weight were blinded. |
| Incomplete outcome data (attrition bias) All outcomes | Low risk | Inclusion of all randomized participants (number evaluable/number randomized): 92% (194/211). |
| Selective reporting (reporting bias) | Low risk | All stated outcomes reported. |
| Other bias | Low risk | No other obvious risk of bias. |
CI: confidence interval; Community category: a measure of the prevalence and intensity of infection (see Table 11); NCHS: National Center for Health Statistics; SD: standard deviation; SEM: standard error of the mean.
Characteristics of excluded studies [ordered by study ID]
| Study | Reason for exclusion |
|---|---|
| Araujo 1987 | Not a RCT. |
| Baird 2011 | Not a comparison of deworming with placebo or no treatment. |
| Beasley 1999 | Treatment regimen comprised of albendazole for soil‐transmitted helminths and praziquantel against schistosomiasis vs placebo. |
| Bhargava 2003 | Treatment regimen comprised of albendazole for soil‐transmitted helminths and praziquantel against schistosomiasis vs placebo. |
| Bhutta 2009 | Population with significant comorbidity – 6 to 24 month old children with severe anaemia (<70 g/L). In population with severe anaemia. |
| Boivin 1993 | Factorial‐designed RCT with children allocated to deworming and iron supplementation, and in which the analysis compares the results for the levamisole and iron group against all the other groups combined. Thus the analysis is confounded by the iron co‐intervention (Included in the Dickson 2000a Cochrane Review). |
| Cooper 2006 | Trial of allergy with no outcomes of interest. |
| Cowden 2000 | Not a RCT. |
| Croke 2014 | 3% (1097/37,165) of randomized participants were evaluated in 46% (22/48) of the original parishes from the initial Alderman 2006 (Cluster) trial. All children were offered treatment after the initial trial, and therefore potentially all of these children received treatment for deworming. |
| Diouf 2002 | Intervention comprised mebendazole, vitamin A, and iron supplementation and metronidazole as a combined intervention vs placebo. |
| Evans 1986 | Treatments randomized, but some placebo groups accessed treatment. Analysis was by the treatment received, and randomization was ignored (included in the Dickson 2000a Cochrane Review). |
| Fernando 1983 | 2 villages allocated to treatment or no treatment on the basis of a coin toss. Essentially a cluster‐RCT with 2 large clusters (Included in the Dickson 2000a Cochrane Review, which reported that no conclusions could be drawn from the results due to selective reporting). |
| Forrester 1998 | Treatment regimen comprised of 3 days of albendazole vs 1 day of albendazole and 2 days of placebo vs 1 day of pyrantel and 2 days of placebo. |
| Friis 2003 | Combined treatment regimen albendazole for soil‐transmitted helminths and praziquantel for Schistosoma mansoni vs placebo. |
| Gilgen 2001 | Population consisted of adults. |
| Gupta 1982 | Only two units of allocation for relevant comparison. Children randomly divided into 4 groups, "taking care that age distribution was similar in each group". The 4 groups were then allocated 1 of 4 different single treatment regimens; no details given. |
| Hadidjaja 1998 | Cluster‐RCT with 2 units of allocation to mebendazole and placebo. Trial authors stated that there were differences in environmental sanitary conditions in the clusters (Included in the Dickson 2000a Cochrane Review, but it was noted that the groups were not comparable and there was high loss to follow‐up). |
| Hathirat 1992 | Treatment regimen comprised of albendazole for soil‐transmitted helminths and iron vs placebo. |
| Jalal 1998 | No relevant outcomes. |
| Jinabhai 2001a | Treatment regimen comprised of albendazole for soil‐transmitted helminths and praziquantel against schistosomiasis vs placebo. |
| Jinabhai 2001b | Treatment regimen comprised of albendazole for soil‐transmitted helminths and praziquantel against schistosomiasis vs placebo. |
| Karyadi 1996 | Not a RCT. |
| Krubwa 1974 | Not a RCT. |
| Kvalsvig 1991b | The researchers were unable to collect outcome data after treatment due to major floods in the area. |
| Latham 1990 | Population with schistosomiasis treated with praziquantel. |
| Marinho 1991 | Treatment regimen comprised of mebendazole and metronidazole vs placebo. |
| Mwaniki 2002 | Treatment regimen albendazole for soil‐transmitted helminths and praziquantel for schistosomiasis vs placebo. |
| Ozier 2011 | Not a comparison of deworming with placebo or no treatment. |
| Pollitt 1991 | Not described as randomized; conference proceedings. |
| Rohner 2010 | Treatment regimen albendazole for soil‐transmitted helminths and praziquantel for schistosomiasis vs placebo. |
| Steinmann 2008 | No relevant outcomes. |
| Stephenson 1980 | Treatment consisted of levamisole with no untreated controls. |
| Stephenson 1985 | Treatment regimen metrifonate used to treat Schistosoma haematobium vs placebo. |
| Tanumihardjo 1996 | No relevant outcomes. |
| Tanumihardjo 2004 | The only randomization is the timing of the deworming medicine. |
| Taylor 2001 | Treatment regimen albendazole for soil‐transmitted helminths and praziquantel for S. haematobium vs placebo. |
| Thein‐Hlaing 1991 | 3/21 intervention villages were not randomly allocated, and unclear how intervention and control villages were allocated as there was a large imbalance (8 intervention and 13 non‐intervention villages). |
| Uscátegui 2009 | Trial in population with malaria. |
| Wright 2009 | No relevant outcomes. |
| Yang 2003 | Did not consider nutritional or cognitive outcome measures. |
Characteristics of ongoing studies [ordered by study ID]
| Trial name or title | Relative efficacy of two regimens of ante‐helminthic treatment |
| Methods | Clinical trial |
| Participants | Total enrolment: 200 Inclusion criteria: age 2 to 5 years; not suffering from serious chronic illness; stool test positive for STHs; not taken any anthelminthic drug in previous 6 months; parents/guardian agree their child's participation Exclusion criteria: age < 2 years and > 5 years; stool test negative for any intestinal helminth; suffering from serious chronic illness; parents/guardian not willing to give consent for their child's participation; if he/she receives any anthelminthic drug after survey but before the trial interventions |
| Interventions |
|
| Outcomes | Primary
Secondary
|
| Starting date | Not yet recruiting |
| Contact information | Mohammad M Alam MBBS, Principal Investigator, ICDDR,B: Centre for Health and Population Research, masud_icddrb@yahoo.com |
| Notes | ClinicalTrials.gov identifier: NCT00367627 Sources of support: International Centre for Diarrhoeal Disease Research, Bangladesh (sponsor) |
Contributions of authors
DTR wrote the protocol, applied inclusion criteria, assessed quality, extracted data, conducted data analysis, and wrote the first draft of the review. KSW and NM applied inclusion criteria, assessed quality, extracted data, conducted data analysis, and drafted the results of the update. SD assessed risk of bias and extracted data for a subset of the trials, and contributed to the analysis and the writing of the review. PG provided advice at all stages of the review production, applied inclusion criteria, assessed quality, quality assured data extraction, helped construct the comparisons, and helped write the review.
Sources of support
Internal sources
Liverpool School of Tropical Medicine, UK.
External sources
Department for International Development, UK.
Evidence and Programme Guidance Unit, Department of Nutrition for Health and Development, WHO, Switzerland.
Declarations of interest
This Cochrane Review is supported by a DFID grant aimed at ensuring the best possible systematic reviews, particularly Cochrane Reviews, are completed on topics relevant to the poor, particularly women, in low‐ and middle‐income countries. DFID does not participate in the selection of topics, in the conduct of the review, or in the interpretation of findings. The grant provides partial salary support for PG, SD, and the funds for the contract with Enhance Reviews Ltd.
PG receives additional salary support from the COUNTDOWN Research Consortium, which is funded by the DFID. COUNTDOWN is committed to trials and development of mass treatment programmes related to NTDs.
Notes
Not applicable.
Unchanged, comment added to review
References
References to studies included in this review
- Alderman H, Konde‐Lule J, Sebuliba I, Bundy D, Hall A. Effect on weight gain of routinely giving albendazole to preschool children during child health days in Uganda: cluster randomised controlled trial. BMJ 2006;333(7559):122. [DOI] [PMC free article] [PubMed] [Google Scholar]
- Awasthi S, Peto R, Fletcher R, Glick H. Controlling parasitic infection in children under five years of age: giving albendazole in conjunction with an Indian government Vitamin A supplement program. Treating parasitic infestations in children [Monograph No. 3]. Philadelphia: International Clinical Epidemiology Network (INCLEN), 1995. [Google Scholar]; Awasthi S, Peto R, Pande VK, Fletcher RH, Read S, Bundy DA. Effects of deworming on malnourished preschool children in India: an open‐labelled, cluster‐randomized trial. PLoS Neglected Tropical Diseases 2008;2(4):e223. [DOI] [PMC free article] [PubMed] [Google Scholar]
- Awasthi S, Pande VK, Fletcher RS. Effectiveness and cost‐effectiveness of albendazole in improving nutritional status of pre‐school children in urban slums. Indian Pediatrics 2000;37(1):19‐29. [PubMed] [Google Scholar]
- Awasthi S, Pande VK. Six‐monthly de‐worming in infants to study effects on growth. Indian Journal of Pediatrics 2001;68(9):823‐7. [DOI] [PubMed] [Google Scholar]
- Awasthi S, Peto R, Read S, Richards S, Pande V, Bundy DA, DEVTA team. Population de‐worming with 6‐monthly albendazole: DEVTA, a cluster‐randomised trial among 1 million preschool children in North India. [unpublished manuscript]. ; University of Oxford and the United States Agency for International Development (USAID). Deworming and Enhanced Vitamin A Supplementation DEVTA Project (The DEVTA Trial). https://clinicaltrials.gov/ct2/show/NCT00222547 (accessed 23 February 2012).
- Beach MJ, Streit TG, Addiss DG, Prospere R, Roberts JM, Lammie PJ. Assessment of combined ivermectin and albendazole for treatment of intestinal helminth and Wuchereria bancrofti infections in Haitian schoolchildren. American Journal of Tropical Medicine and Hygiene 1999;60(3):479‐86. [DOI] [PubMed] [Google Scholar]
- Donnen P, Brasseur D, Dramaix M, Vertongen F, Zihindula M, Muhamiriza M, et al. Vitamin A Supplemenation but not deworming improves growth of malnourished preschool children in eastern Zaire. Journal of Nutrition 1998;128(8):1320‐7. [DOI] [PubMed] [Google Scholar]
- Dossa RA, Ategbo EA, Koning FL, Raaij JM, Hautvast JG. Impact of iron supplementation and deworming on growth performance in preschool Beninese children. European Journal of Clinical Nutrition 2001;55(4):223‐8. [DOI] [PubMed] [Google Scholar]
- Fox LM, Furness BW, Haser JK, Desire D, Brissau JM, Milord MD, et al. Tolerance and efficacy of combined diethylcarbamazine and albendazole for treatment of Wuchereria bancrofti and intestinal helminth infections in Haitian children. American Journal of Tropical Medicine and Hygiene 2005;73(1):115‐21. [PubMed] [Google Scholar]
- Freij L, Meeuwisse GW, Berg NO, Wall S, Gebre‐Medhin M. Ascariasis and malnutrition. A study in urban Ethiopian children. American Journal of Clinical Nutrition 1979;32(7):1545‐53. [DOI] [PubMed] [Google Scholar]
- Freij L, Meeuwisse GW, Berg NO, Wall S, Gebre‐Medhin M. Ascariasis and malnutrition. A study in urban Ethiopian children. American Journal of Clinical Nutrition 1979;32(7):1545‐53. [DOI] [PubMed] [Google Scholar]
- Garg R, Lee LA, Beach MJ, Wamae CN, Ramakrishnan U, Deming MS. Evaluation of the Integrated Management of Childhood Illness guidelines for treatment of intestinal helminth infections among sick children aged 2‐4 years in western Kenya. Transactions of the Royal Society of Tropical Medicine and Hygiene 2002;96(5):543‐8. [DOI] [PubMed] [Google Scholar]
- Goto R, Mascie‐Taylor CG, Lunn PG. Impact of anti‐Giardia and anthelminthic treatment on infant growth and intestinal permeability in rural Bangladesh: a randomised double‐blind controlled study. Transactions of the Royal Society of Tropical Medicine and Hygiene 2009;103(5):520‐9. [DOI] [PubMed] [Google Scholar]
- Greenberg BL, Gilman RH, Shapiro H, Gilman JB, Mondal G, Maksud M, et al. Single dose piperazine therapy for Ascaris lumbricoides: an unsuccessful method of promoting growth. American Journal of Clinical Nutrition 1981;34(11):2508‐16. [DOI] [PubMed] [Google Scholar]
- Hadju V, Stephenson LS, Abadi K, Mohammed HO, Bowman DD, Parker RS. Improvements in appetite and growth in helminth‐infected schoolboys three and seven weeks after a single dose of pyrantel pamoate. Parasitology 1996;113(Pt 5):497‐504. [DOI] [PubMed] [Google Scholar]
- Hadju V, Satriono, Abadi K, Stephenson LS. Relationship between soil‐transmitted helminthiases and growth in urban slum school children in Ujung Pandang, Indonesia. International Journal of Food Sciences and Nutrition 1997;48(2):85‐93. [DOI] [PubMed] [Google Scholar]
- Hall A, Nguyen Bao Khanh L, Bundy D, Quan Dung N, Hong Son T, Lansdown R. A randomized trial of six monthly deworming on the growth and educational achievements of Vietnamese school children. Unpublished manuscript.
- Kirwan P, Asaolu SO, Molloy SF, Abiona TC, Jackson AL, Holland CV. Patterns of soil‐transmitted helminth infection and impact of four monthly albendazole treatments in preschool children from semi‐urban communities in Nigeria: a double‐blind placebo‐controlled randomised trial. BMC Infectious Diseases 2009;9:20. [DOI] [PMC free article] [PubMed] [Google Scholar]; Kirwan P, Jackson AL, Asaolu SO, Molloy SF, Abiona TC, Bruce MC, et al. Impact of repeated four‐monthly anthelmintic treatment on Plasmodium infection in preschool children: a double‐blind placebo‐controlled randomized trial. BMC Infectious Diseases 2010;10:277. [DOI] [PMC free article] [PubMed] [Google Scholar]
- Kloetzel K, Merluzzi Filho TJ, Kloetzel D. Ascaris and malnutrition in a group of Brazilian children ‐ a follow‐up study. Journal of Tropical Pediatrics 1982;28(1):41‐3. [DOI] [PubMed] [Google Scholar]
- Koroma MM, Williams RA, Haye RR, Hodges M. Effects of albendazole on growth of primary school children and the prevalence and intensity of soil‐transmitted helminths in Sierra Leone. Journal of Tropical Pediatrics 1996;42(6):371‐2. [DOI] [PubMed] [Google Scholar]
- Kruger M, Badenhorst CJ, Mansvelt EPG, Laubscher JA, Benade AJS. The effect of iron fortification in a school feeding scheme and anthelminthic therapy on the iron status and growth of 6‐8 year old school children. Food and Nutrition Bulletin 1996;17(1):11‐21. [Google Scholar]
- Kvalsvig JD, Cooppan RM, Connolly KJ. The effects of parasite infections on cognitive processes in children. Annals of Tropical Medicine and Parasitology 1991;85(5):551‐68. [DOI] [PubMed] [Google Scholar]
- Lai KP, Kaur H, Mathias RG, Ow‐Yang CK. Ascaris and Trichuris do not contribute to growth retardation in primary school children. Southeast Asian Journal of Tropical Medicine and Public Health 1995;26(2):322‐8. [PubMed] [Google Scholar]
- Huong T, Brouwer ID, Nguyen KC, Burema J, Kok FJ. The effect of iron fortification and de‐worming on anaemia and iron status of Vietnamese schoolchildren. British Journal of Nutrition 2007;97(5):955‐62. [DOI] [PubMed] [Google Scholar]
- Michaelsen KF. Hookworm infection in Kweneng District, Botswana. A prevalence survey and a controlled treatment trial. Transactions of the Royal Society of Tropical Medicine and Hygiene 1985;79(6):848‐51. [DOI] [PubMed] [Google Scholar]
- Aiken A, Davey C, Hargreaves J, Hayes R. Re‐analysis of health and educational impacts of a school‐based deworming program in western Kenya: a pure replication. International Journal of Epidemiology2015; Vol. DOI 10.1093/ije/dyv127. [DOI] [PMC free article] [PubMed]; Aiken AM, Davey C, Hargreaves JR, Hayes RJ. Reanalysis of health and educational impacts of a school‐based deworming program in western Kenya: Part 1, pure replication, 3ie Replication Paper 3, part 1. Washington, DC: International Initiative for Impact Evaluation (3ie). http://www.3ieimpact.org/media/filer_public/2015/01/07/3ie_rps3_worms_replication_1.pdf 2014(accessed 10 July 2015). ; Davey C, Aiken A, Hayes R. Re‐analysis of health and educational impacts of a school based deworming program in Western Kenya: a statistical replication of a cluster quasi‐randomised stepped‐wedge trial. International Journal of Epidemiology in press; Vol. 10.1093/ije/dyv128. [DOI] [PMC free article] [PubMed]; Miguel E, Kremer M. Worms: Identifying impacts on education and health in the presence of treatment externalities. Econometrica 2004;72(1):159‐217. [Google Scholar]
- Ndibazza J, Mpairwe H, Webb EL, Mawa PA, Nampijja M, Muhangi L, et al. Impact of anthelminthic treatment in pregnancy and childhood on immunisations, infections and eczema in childhood: a randomised controlled trial. PLoS One 2012;7(12):e50325. [DOI: 10.1371/journal.pone.0050325] [DOI] [PMC free article] [PubMed] [Google Scholar]
- Nga TT, Winichagoon P, Dijkhuizen MA, Khan NC, Wasantwisut E, Furr H, et al. Multi‐micronutrient‐fortified biscuits decreased prevalence of anemia and improved micronutrient status and effectiveness of deworming in rural Vietnamese school children. Journal of Nutrition 2009;139(5):1013‐21. [DOI] [PubMed] [Google Scholar]; Nga TT, Winichagoon P, Dijkhuizen MA, Khan NC, Wasantwisut E, Wieringa FT. Decreased parasite load and improved cognitive outcomes caused by deworming and consumption of multi‐micronutrient fortified biscuits in rural Vietnamese schoolchildren. American Journal of Tropical Medicine and Hygiene 2011;85(2):333‐40. [DOI] [PMC free article] [PubMed] [Google Scholar]
- Nokes C, Grantham‐McGregor SM, Sawyer AW, Cooper ES, Bundy DA. Parasitic helminth infection and cognitive function in school children. Proceedings of The Royal Society of London. Series B: Biological sciences 1992;247(1319):77‐81. [DOI] [PubMed] [Google Scholar]; Nokes C, Grantham‐McGregor SM, Sawyer AW, Cooper ES, Robinson BA, Bundy DA. Moderate to heavy infections of Trichuris trichiura affect cognitive function in Jamaican school children. Parasitology 1992;104(Pt 3):539‐47. [DOI] [PubMed] [Google Scholar]
- Olds GR, King C, Hewlett J, Olveda R, Wu G, Ouma J, et al. Double‐blind placebo‐controlled study of concurrent administration of albendazole and praziquantel in school children with schistosomiasis and geohelminths. Journal of Infectious Diseases 1999;179(4):996‐1003. [DOI] [PubMed] [Google Scholar]
- Palupi L, Schultink W, Achadi E, Gross R. Effective community intervention to improve hemoglobin status in preschoolers receiving once‐weekly iron supplementation. American Journal of Clinical Nutrition 1997;65(4):1057‐61. [DOI] [PubMed] [Google Scholar]
- Northrop‐Clewes CA, Rousham EK, Mascie‐Taylor CN, Lunn PG. Anthelmintic treatment of rural Bangladeshi children: effect on host physiology, growth, and biochemical status. American Journal of Clinical Nutrition 2001;73(1):53‐60. [DOI] [PubMed] [Google Scholar]; Rousham EK, Mascie‐Taylor CG. An 18‐month study of the effect of periodic anthelminthic treatment on the growth and nutritional status of pre‐school children in Bangladesh. Annals of Human Biology 1994;21(4):315‐24. [DOI] [PubMed] [Google Scholar]
- Sarkar NR, Anwar KS, Biswas KB, Mannan MA. Effect of deworming on nutritional status of ascaris infested slum children of Dhaka, Bangladesh. Indian Pediatrics 2002;39(11):1021‐6. [PubMed] [Google Scholar]
- Gardner JM, Grantham‐McGregor S, Baddeley A. Trichuris trichiura infection and cognitive function in Jamaican school children. Annals of Tropical Medicine and Parasitology 1996;90(1):55‐63. [DOI] [PubMed] [Google Scholar]; Simeon DT, Grantham‐McGregor SM, Callender JE, Wong MS. Treatment of Trichuris trichiura infections improves growth, spelling scores and school attendance in some children. Journal of Nutrition 1995;125(7):1875‐83. [DOI] [PubMed] [Google Scholar]; Simeon DT, Grantham‐McGregor SM, Wong MS. Trichuris trichiura infection and cognition in children: results of a randomized clinical trial. Parasitology 1995;110(Pt 4):457‐64. [DOI] [PubMed] [Google Scholar]
- Solon FS, Sarol JN, Bernardo ABI, Solon JA, Mehansho H, Sanchez‐Fermin LE, et al. Effect of a multiple‐micronutrient‐fortified fruit powder beverage on the nutrition status, physical fitness, and cognitive performance of schoolchildren in the Philippines. Food and Nutrition Bulletin 2003;24(4 Suppl):S129‐40. [DOI] [PubMed] [Google Scholar]
- Stephenson LS, Latham MC, Kinoti SN, Kurz KM, Brigham H. Improvements in physical fitness of Kenyan school boys infected with hookworm, Trichuris trichiura, and Ascaris lumbricoides following a single dose of albendazole. Transactions of the Royal Society of Tropical Medicine and Hygiene 1990;84(2):277‐82. [DOI] [PubMed] [Google Scholar]; Stephenson LS, Latham MC, Kurz KM, Kinoti SN, Brigham H. Treatment with a single dose of albendazole improves growth of Kenyan schoolchildren with hookworm, Trichuris trichiura, and Ascaris lumbricoides infections. American Journal of Tropical Medicine and Hygiene 1989;41(1):78‐87. [PubMed] [Google Scholar]
- Adams EJ, Stephenson LS, Latham MC, Kinoti SN. Physical activity and growth of Kenyan school children with hookworm, Trichuris trichiura and Ascaris lumbricoides infections are improved after treatment with albendazole. Journal of Nutrition 1994;124(8):1199‐206. [DOI] [PubMed] [Google Scholar]; Stephenson LS, Latham MC, Adams EJ, Kinoti SN, Pertet A. Physical fitness, growth and appetite of Kenyan school boys with hookworm, Trichuris trichiura and Ascaris lumbricoides infections are improved four months after a single dose of albendazole. Journal of Nutrition 1993;123(6):1036‐46. [DOI] [PubMed] [Google Scholar]; Stephenson LS, Latham MC, Adams EJ, Kinoti SN, Pertet A. Weight gain of Kenyan school children infected with hookworm, Trichuris trichiura and Ascaris lumbricoides is improved following once‐ or twice‐yearly treatment with albendazole. Journal of Nutrition 1993;123(4):656‐65. [DOI] [PubMed] [Google Scholar]
- Stoltzfus RJ, Albonico M, Chwaya HM, Tielsch JM, Schulze KJ, Savioli L. Effects of the Zanzibar school‐based deworming program on iron status of children. American Journal of Clinical Nutrition 1998;68(1):179‐86. [DOI] [PubMed] [Google Scholar]; Stoltzfus RJ, Albonico M, Tielsch JM, Chwaya HM, Savioli L. School‐based deworming program yields small improvement in growth of Zanzibari school children after one year. Journal of Nutrition 1997;127(11):2187‐93. [DOI] [PubMed] [Google Scholar]
- Stoltzfus RJ, Chway HM, Montresor A, Tielsch JM, Jape JK, Albonico M, et al. Low dose daily iron supplementation improves iron status and appetite but not anemia, whereas quarterly anthelminthic treatment improves growth, appetite and anemia in Zanzibari preschool children. Journal of Nutrition 2004;134(2):348‐56. [DOI] [PubMed] [Google Scholar]; Stoltzfus RJ, Kvalsvig JD, Chwaya HM, Montresor A, Albonico M, Tielsch JM, et al. Effects of iron supplementation and anthelmintic treatment on motor and language development of preschool children in Zanzibar: double blind, placebo controlled study. BMJ 2001;323(7326):1389‐93. [DOI] [PMC free article] [PubMed] [Google Scholar]
- Sur D, Saha DR, Manna B, Rajendran K, Bhattacharya SK. Periodic deworming with albendazole and its impact on growth status and diarrhoeal incidence among children in an urban slum of India. Transactions of the Royal Society of Tropical Medicine and Hygiene 2005;99(4):261‐7. [DOI] [PubMed] [Google Scholar]
- Tee MH, Lee YY, Majid NA, Noori NM, Raj SM. Growth reduction among primary school children with light trichuriasis in Malaysia with albendazole. Southeast Asian Journal of Tropical Medicine and Public Health 2013;44(1):19‐24. [PubMed] [Google Scholar]
- Watkins WE, Cruz JR, Pollitt E. The effects of deworming on indicators of school performance in Guatemala. Transactions of the Royal Society of Tropical Medicine and Hygiene 1996;90(2):156‐61. [DOI] [PubMed] [Google Scholar]; Watkins WE, Pollitt E. Effect of removing Ascaris on the growth of Guatemalan schoolchildren. Pediatrics 1996;97(6 Pt 1):871‐6. [PubMed] [Google Scholar]
- Willett WC, Kilama WL, Kihamia CM. Ascaris and growth rates: a randomized trial of treatment. American Journal of Public Health 1979;69(10):987‐91. [DOI] [PMC free article] [PubMed] [Google Scholar]
- Wiria AE, Hamid F, Wammes LJ, Kaisar MM, May L, Prasetyani MA, et al. The effect of three‐monthly albendazole treatment on malarial parasitemia and allergy: a household‐based cluster‐randomized, double‐blind, placebo‐controlled trial. PLoS One 2013;8(3):e57899. [DOI: 10.1371/journal.pone.0057899] [DOI] [PMC free article] [PubMed] [Google Scholar]
- Yap P, Wu FW, Du ZW, Hattendorf J, Chen R, Jiang JY, et al. Effect of deworming on physical fitness of school‐aged children in Yunnan, China: a double‐blind, randomized, placebo‐controlled trial. PLoS Neglected Tropical Diseases 2014;8(7):e2983. [DOI: 10.1371/journal.pntd.0002983] [DOI] [PMC free article] [PubMed] [Google Scholar]
References to studies excluded from this review
- Araujo RL, Araujo MB, Machado RD, Braga AA, Leite BV, Oliveira JR. Evaluation of a program to overcome vitamin A and iron deficiencies in areas of poverty in Minas Gerais, Brazil. Archivos Latinoamericanos de Nutrición 1987;37(1):9‐22. [PubMed] [Google Scholar]
- Baird S, Hicks JH, Kremer M, Miguel E. Worms at Work: Long‐run Impacts of Child Health Gains. http://eml.berkeley.edu//˜emiguel/pdfs/miguel_wormsatwork.pdf (accessed 10 July 2015. [DOI] [PMC free article] [PubMed]
- Beasley NM, Tomkins AM, Hall A, Kihamia CM, Lorri W, Nduma B, et al. The impact of population level deworming on the haemoglobin levels of schoolchildren in Tanga, Tanzania. Tropical Medicine and International Health 1999;4(11):744‐50. [DOI] [PubMed] [Google Scholar]
- Bhargava A, Jukes M, Lambo J, Kihamia CM, Lorri W, Nokes C, et al. Anthelmintic treatment improves the hemoglobin and serum ferritin concentrations of Tanzanian schoolchildren. Food and Nutrition Bulletin 2003;24(4):332‐42. [DOI] [PubMed] [Google Scholar]
- Bhutta Z, Klemm R, Shahid F, Rizvi A, Rah JH, Christian P. Treatment response to iron and folic acid alone is the same as with multivitamins and/or anthelminthics in severely anemic 6‐ to 24‐month‐old children. Journal of Nutrition 2009;139(8):1568‐74. [DOI] [PubMed] [Google Scholar]
- Boivin MJ, Giordani B. Improvements in cognitive performance for schoolchildren in Zaire, Africa, following an iron supplement and treatment for intestinal parasites. Journal of Pediatric Psychology 1993;18(2):249‐64. [DOI] [PubMed] [Google Scholar]
- Cooper PJ, Chico ME, Vaca MG, Moncayo AL, Bland JM, Mafla E, et al. Effect of albendazole treatments on the prevalence of atopy in children living in communities endemic for geohelminth parasites: a cluster‐randomised trial. Lancet 2006;367(9522):1598‐603. [DOI] [PubMed] [Google Scholar]
- Cowden J, Hotez P. Mebendazole and albendazole treatment of geohelminth infections in children and pregnant women. Pediatric Infectious Disease Journal 2000;19(7):659‐60. [DOI] [PubMed] [Google Scholar]
- Croke K. The long run effects of early childhood deworming on literacy and numeracy: Evidence from Uganda. http://scholar.harvard.edu/files/kcroke/files/ug_lr_deworming_071714.pdf (accessed 10 July 2015). [DOI] [PMC free article] [PubMed]
- Diouf S, Diagne I, Moreira C, Signate SY, Faye O, Ndiaye O, et al. Integrated treatment of iron deficiency, vitamin A deficiency and intestinal parasitic diseases: impact on Senegalese children's growth [Traitement integre de la carence en fer, de l'avitaminose A et des parasitoses intestinales: impact sur la croissance des enfants senegalais]. Archives de Pédiatrie 2002;9(1):102‐3. [DOI] [PubMed] [Google Scholar]
- Evans J, Martin J, Mascie‐Taylor CGN. The effect of periodic deworming with pyrantel pamoate on the growth and nutritional status of pre‐school children in northern Bangladesh [Monograph No. 3]. London: Save the Children Fund, 1986. [Google Scholar]
- Fernando MA, Balasuriya, Somaratne. Effect of Ascaris lumbricoides infestation on growth of children. Indian Pediatrics 1983;20(10):721‐31. [PubMed] [Google Scholar]
- Forrester JE, Bailar JC 3rd, Esrey SA, José MV, Castillejos BT, Ocampo G. Randomised trial of albendazole and pyrantel in symptomless trichuriasis in children. Lancet 1998;352(9134):1103‐8. [DOI] [PubMed] [Google Scholar]
- Friis H, Mwaniki D, Omondi B, Muniu E, Thiong'o F, Ouma J, et al. Effects on haemoglobin of multi‐micronutrient supplementation and multi‐helminth chemotherapy: a randomized, controlled trial in Kenyan school children. European Journal of Clinical Nutrition 2003;57(4):573‐9. [DOI] [PubMed] [Google Scholar]
- Gilgen D, Mascie‐Taylor CG. The effect of anthelmintic treatment on helminth infection and anaemia. Parasitology 2001;122(Pt 1):105‐10. [DOI] [PubMed] [Google Scholar]; Gilgen DD, Mascie‐Taylor CG, Rosetta L. Intestinal helminth infections, anaemia and labour productivity of female tea pluckers in Bangladesh. Tropical Medicine and International Health 2001;6(6):449‐57. [DOI] [PubMed] [Google Scholar]
- Gupta MC, Urrutia JJ. Effect of periodic antascaris and antigiardia treatment on nutritional status of preschool children. American Journal of Clinical Nutrition 1982;36(1):79‐86. [DOI] [PubMed] [Google Scholar]
- Hadidjaja P, Bonang E, Suyardi MA, Abidin SA, Ismid IS, Margono SS. The effect of intervention methods on nutritional status and cognitive function of primary school children infected with Ascaris lumbricoides. American Journal of Tropical Medicine and Hygiene 1998;59(5):791‐5. [DOI] [PubMed] [Google Scholar]
- Hathirat P, Valyasevi A, Kotchabhakdi NJ, Rojroongwasinkul N, Pollitt E. Effects of an iron supplementation trial on the Fe status of Thai schoolchildren. British Journal of Nutrition 1992;68(1):245‐52. [DOI] [PubMed] [Google Scholar]
- Jalal F, Nesheim MC, Agus Z, Sanjur D, Habicht JP. Serum retinol concentrations in children are affected by food sources of beta‐carotene, fat intake, and anthelmintic drug treatment. American Journal of Clinical Nutrition 1998;68(3):623‐9. [DOI] [PubMed] [Google Scholar]
- Jinabhai CC, Taylor M, Coutsoudis A, Coovadia HM, Tomkins AM, Sullivan KR. Epidemiology of helminth infections: implications for parasite control programmes, a South African perspective. Public Health Nutrition 2001;4(6):1211‐9. [DOI] [PubMed] [Google Scholar]
- Jinabhai CC, Taylor M, Coutsoudis A, Coovadia HM, Tomkins AM, Sullivan KR. A randomized controlled trial of the effect of antihelminthic treatment and micronutrient fortification on health status and school performance of rural primary school children. Annals of Tropical Paediatrics 2001;21(4):319‐33. [DOI] [PubMed] [Google Scholar]
- Karyadi E, Gross R, Sastroamidjojo S, Dillon D, Richards AL, Sutanto I. Anthelminithic treatment raises plasma iron levels but dose not decrease the acute‐phase response in Jakarta School children. Southeast Asian Journal of Tropical Medicine and Public Health 1996;27(4):742‐53. [PubMed] [Google Scholar]
- Krubwa F, Gatti F, Lontie M, Nguete M, Vandepitte J, Thienpont D. Quarterly administration of mebendazole to suburban school children [Administration trimestrielle de mebendazole en milieu scolaire suburbain]. Médecine Tropicale 1974;34(5):679‐87. [Google Scholar]
- Kvalsvig JD, Cooppan RM, Connolly KJ. The effects of parasite infections on cognitive processes in children. Annals of Tropical Medicine and Parasitology 1991;85(5):551‐68. [DOI] [PubMed] [Google Scholar]
- Latham MC, Stephenson LS, Kurz KM, Kinoti SN. Metrifonate or praziquantel treatment improves physical fitness and appetite of Kenyan schoolboys with Schistosoma haematobium and hookworm infections. American Journal of Tropical Medicine and Hygiene 1990;43(2):170‐9. [DOI] [PubMed] [Google Scholar]
- Marinho HA, Shrimpton R, Giugliano R, Burini RC. Influence of enteral parasites on the blood vitamin A levels in preschool children orally supplemented with retinol and/or zinc. European Journal of Clinical Nutrition 1991;45(11):539‐44. [PubMed] [Google Scholar]
- Mwaniki D, Omondi B, Muniu E, Thiong'o F, Ouma J, Magnussen P, et al. Effects on serum retinol of multi‐micronutrient supplementation and multi‐helminth chemotherapy: a randomised, controlled trial in Kenyan school children. European Journal of Clinial Nutrition 2002;56(7):666‐73. [DOI] [PubMed] [Google Scholar]
- Ozier O. Exploiting externalities to estimate the long‐term effects of early childhood deworming. http://files.givewell.org/files/DWDA%202009/Interventions/Deworming/Ozier%20Yale.pdf (accessed 10 July 2015).
- Pollitt E, Wayne W, Perez‐Escamilla R, Latham M, Stephenson LS. Double blind clinical trial on the effects of helminth infection on cognition. FASEB Journal 1991;5:A1081. [Google Scholar]
- Rohner F, Zimmermann MB, Amon RJ, Vounatsou P, Tschannen AB, N'goran EK, et al. In a randomized controlled trial of iron fortification, anthelmintic treatment and intermittent preventive treatment of malaria for anemia control in Ivorian children, only anthelmintic treatment shows modest benefit. Journal of Nutrition 2010;140(3):635‐41. [DOI] [PubMed] [Google Scholar]
- Steinmann P, Zhou XN, Du ZW, Jiang JY, Xiao SH, Wu ZX, et al. Tribendimidine and albendazole for treating soil‐transmitted helminths, Strongyloides stercoralis and Taenia spp.: open‐label randomized trial. PLoS Neglected Tropical Diseases 2008;2(10):e322. [DOI] [PMC free article] [PubMed] [Google Scholar]
- Stephenson LS, Crompton DW, Latham MC, Schulpen TW, Nesheim MC, Jansen AA. Relationships betweenAscaris infection and growth of malnourished preschool children in Kenya. American Journal of Clinical Nutrition 1980;33(5):1165‐72. [DOI] [PubMed] [Google Scholar]
- Stephenson LS, Latham MC, Kurz KM, Kinoti SN, Oduori ML, Crompton DW. Relationships of Schistosoma hematobium, hookworm and malarial infections and metrifonate treatment to hemoglobin level in Kenyan school children. American Journal of Tropical Medicine and Hygiene 1985;34(3):519‐28. [DOI] [PubMed] [Google Scholar]
- Tanumihardjo SA, Permaesih D, Muherdiyantiningsih, Rustan E, Rusmil K, Fatah AC, et al. Vitamin A status of Indonesian children infected with Ascaris lumbricoides after dosing with vitamin A supplements and albendazole. Journal of Nutrition 1996;126(2):451‐7. [DOI] [PubMed] [Google Scholar]
- Tanumihardjo SA, Permaesih D, Muhilal. Vitamin A status and hemoglobin concentrations are improved in Indonesian children with vitamin A and deworming interventions. European Journal of Clinical Nutrition 2004;58(9):1223‐30. [DOI] [PubMed] [Google Scholar]
- Taylor M, Jinabhai CC, Couper I, Kleinschmidt I, Jogessar VB. The effect of different anthelmintic treatment regimens combined with iron supplementation on the nutritional status of schoolchildren in KwaZulu‐Natal, South Africa: a randomized controlled trial. Transactions of the Royal Society of Tropical Medicine and Hygiene 2001;95(2):211‐6. [DOI] [PubMed] [Google Scholar]
- Thein‐Hlaing, Thane‐Toe, Than‐Saw, Myat‐Lay‐Kyin, Myint‐Lwin. A controlled chemotherapeutic intervention trial on the relationship between Ascaris lumbricoides infection and malnutrition in children. Transactions of the Royal Society of Tropical Medicine and Hygiene 1991;85(4):523‐8. [DOI] [PubMed] [Google Scholar]
- Uscátegui RM, Correa AM, Carmona‐Fonseca J. Changes in retinol, hemoglobin and ferritin concentrations in Colombian children with malaria [Spanish]. Biomédica: revista del Instituto Nacional de Salud 2009;29(2):270‐81. [PubMed] [Google Scholar]
- Wright VJ, Ame SM, Haji HS, Weir RE, Goodman D, Pritchard DI, et al. Early exposure of infants to GI nematodes induces Th2 dominant immune responses which are unaffected by periodic anthelminthic treatment. PLoS Neglected Tropical Diseases 2009;3(5):e433. [DOI] [PMC free article] [PubMed] [Google Scholar]
- Yang WP, Shao JO, Chen YJ. Effect of chemotherapeutic regimens on soil‐transmitted nematode infections in areas with low endemicity [Chinese]. Zhongguo Ji Sheng Chong Xue Yu Ji Sheng Chong Bing Za Zhi [Chinese Journal of Parasitology and Parasitic Diseases] 2003;21(2):128. [PubMed] [Google Scholar]
References to ongoing studies
- Alam MM, Principal Investigator, ICDDR, B: Centre for Health and Population Research. Relative efficacy of two regimens of ante‐helminthic treatment. ClinicalTrials.gov identifier: NCT00367627.
Additional references
- International Initiative for Impact Evaluation. 3ie replication paper 3: Part 1 and 2. http://www.3ieimpact.org/en/publications/3ie‐replication‐paper‐series/3ie‐replication‐paper‐3/ (accessed 5 June 2015).
- Aiken AM, Davey C, Hargreaves JR, Hayes RJ. Reanalysis of health and educational impacts of a school‐based deworming program in western Kenya: Part 1, pure replication, 3ie Replication Paper 3, Part 1. Washington, DC: International Initiative for Impact Evaluation (3ie). http://www.3ieimpact.org/media/filer_public/2015/01/07/3ie_rps3_worms_replication_1.pdf (accessed 10 July 2015).
- Aiken A, Davey C, Hargreaves J, Hayes R. Re‐analysis of health and educational impacts of a school‐based deworming program in western Kenya: a pure replication. International Journal of Epidemiology 2015; DOI 10.1093/ije/dyv127.. [DOI] [PMC free article] [PubMed]
- Albonico M, Allen H, Chitsulo L, Engels D, Gabrielli AF, Savioli L. Controlling soil‐transmitted helminthiasis in pre‐school‐age children through preventive chemotherapy. PLoS Neglected Tropical Diseases 2008;2(3):e126. [DOI] [PMC free article] [PubMed] [Google Scholar]
- Anderson RM, May RM. Infectious Diseases of Humans: Dynamics and Control. Oxford: Oxford University Press, 1991. [Google Scholar]
- Bethony J, Brooker S, Albonico M, Geiger SM, Loukas A, Diemert D, et al. Soil‐transmitted helminth infections: ascariasis, trichuriasis, and hookworm. Lancet 2006;367(9521):1521‐32. [DOI] [PubMed] [Google Scholar]
- Bleakley H. Disease and development: evidence from hookworm eradication in the American South. Quarterly Journal of Economics 2007;122(1):73‐117. [DOI] [PMC free article] [PubMed] [Google Scholar]
- Brown ER. Rockefeller Medicine Men: Medicine and Capitalism in America. Berkeley: University of California Press, 1979. [Google Scholar]
- Bundy D, Peto R. Treatment for intestinal helminth infection. Studies of short term treatment cannot assess long term benefits of regular treatment. BMJ (Clinical research ed.) 2000;321(7270):1225. [PubMed] [Google Scholar]
- Bundy DA, Kremer M, Bleakley H, Jukes MC, Miguel E. Deworming and development: asking the right questions, asking the questions right. PLoS Neglected Tropical Diseases 2009;3(1):e362. [DOI] [PMC free article] [PubMed] [Google Scholar]
- Callender JE, Walker SP, Grantham‐McGregor SM, Cooper ES. Growth and development four years after treatment for the Trichuris dysentery syndrome. Acta Paediatrica 1998;87(12):1247‐9. [DOI] [PubMed] [Google Scholar]
- Cappello M. Global health impact of soil‐transmitted nematodes. Pediatric Infectious Disease Journal 2004;23(7):663‐4. [DOI] [PubMed] [Google Scholar]
- Carrasco‐Labra A, Brignardello‐Peetersen R, Santesso N, Neumann I, Mustafa RA, Mbuagbaw L, et al. et al. Comparison between the standard and a new alternative format of the Summary‐of Findings tables in Cochrane review users: study protocol for a randomized controlled trial.. Trials 2015;16:164. [DOI 10.1186/s13063‐015‐0649‐6] [DOI] [PMC free article] [PubMed] [Google Scholar]
- Chan MS. The global burden of intestinal nematode infections ‐ fifty years on. Parasitology Today 1997;13(11):438‐43. [DOI] [PubMed] [Google Scholar]
- Alderson P, Green S (editors). Meta‐analysis of continuous data: Post intervention versus change from baseline (7.7.3.1). The Cochrane Handbook.2011; Vol. http://handbook.cochrane.org/.
- Cooper E. Treatment for intestinal helminth infection. Message does not follow from systematic review's findings. BMJ 2000;321(7270):1225‐6. [PubMed] [Google Scholar]
- Copenhagen Consensus Center. Copenhagen Consensus 2012. http://www.copenhagenconsensus.com/Default.aspx?ID=1626 (accessed 22 May 2012).
- Crompton DW. The public health importance of hookworm disease. Parasitology 2000;121 Suppl:S39‐50. [DOI] [PubMed] [Google Scholar]
- Crompton DWT, Torlesse H, Hodges ME. Hookworm infection and iron status. In: Crompton DWT, Montresor A, Nesheim MC, Savioli L editor(s). Controlling disease due to helminth infections. Geneva: World Health Organization, 2003:23‐32. [Google Scholar]
- Danso‐Appiah A, Utzinger J, Liu J, Olliaro P. Drugs for treating urinary schistosomiasis. Cochrane Database of Systematic Reviews 2008, Issue 3. [DOI: 10.1002/14651858.CD000053.pub2] [DOI] [PubMed] [Google Scholar]
- Davey C, Aiken A, Hayes R. Re‐analysis of health and educational impacts of a school based deworming program in Western Kenya: a statistical replication of a cluster quasi‐randomised stepped‐wedge trial. International Journal of Epidemiology 2015; DOI 10.1093/ije/dyv128. [DOI] [PMC free article] [PubMed]
- Silva NR. Impact of mass chemotherapy on the morbidity due to soil‐transmitted nematodes. Acta Tropica 2003;86(2‐3):197‐214. [DOI] [PubMed] [Google Scholar]
- Silva NR, Brooker S, Hotez PJ, Montresor A, Engels D, Savioli L. Soil‐transmitted helminth infections: updating the global picture. Trends in Parasitology 2003;19(12):547‐51. [DOI] [PubMed] [Google Scholar]
- Deworm the World. The evidence for school‐based deworming. http://www.dewormtheworld.org/?q=node/105 (accessed 22 May 2012).
- Engels D, Savioli L. Evidence‐based policy on deworming. PLoS Neglected Tropical Diseases 2009;3(1):e359. [DOI] [PMC free article] [PubMed] [Google Scholar]
- Evidence Action. World's Largest Deworming Program in India To Start With Support from Evidence Action. http://www.evidenceaction.org/blog‐full/largest‐deworming‐program‐in‐india‐to‐start‐with‐support‐from‐evidence‐action (accessed 16 April 2015).
- Garner P, Taylor‐Robinson D, Sachdev HS. DEVTA: results from the biggest clinical trial ever. Lancet 2013;381(9876):1439‐41. [DOI] [PubMed] [Google Scholar]
- GiveWell. Errors in DCP2 cost‐effectiveness estimate for deworming. http://blog.givewell.org/2011/09/29/errors‐in‐dcp2‐cost‐effectiveness‐estimate‐for‐deworming/ (accessed 22 May 2012).
- Givewell. Combination deworming (mass drug administration targeting both schistosomiasis and soil‐transmitted helminths). http://www.givewell.org/international/technical/programs/deworming (accessed 16 April 2015).
- McMaster University. GRADEpro. Version [used January 2015]. McMaster University, 2014.
- Gulani A, Nagpal J, Osmond C, Sachdev HP. Effect of administration of intestinal anthelmintic drugs on haemoglobin: systematic review of randomised controlled trials. BMJ 2007;334(7603):1095. [DOI] [PMC free article] [PubMed] [Google Scholar]
- Haider BA, Humayun Q, Bhutta ZA. Effect of administration of antihelminthics for soil transmitted helminths during pregnancy. Cochrane Database of Systematic Reviews 2009, Issue 2. [DOI: 10.1002/14651858.CD005547.pub2] [DOI] [PubMed] [Google Scholar]
- Hall A, Hewitt G, Tuffrey V, Silva N. A review and meta‐analysis of the impact of intestinal worms on child growth and nutrition. Maternal and Child Nutrition 2008;4(Suppl 1):118‐236. [DOI] [PMC free article] [PubMed] [Google Scholar]
- Hawkes N. Deworming debunked. BMJ 2013;346:e8558. [DOI] [PubMed] [Google Scholar]
- Higgins JPT, Green S (editors). Cochrane Handbook for Systematic Reviews of Interventions. Version 5.1.0 [updated March 2011]. The Cochrane Collaboration, 2011. Available from www.cochrane‐handbook.org.
- Higgins JP, Altman DG, Gotzsche PC, Jüni P, Moher D, Oxman AD, et al. The Cochrane Collaboration's tool for assessing risk of bias in randomised trials. BMJ2011; Vol. 343:d5928. [DOI] [PMC free article] [PubMed]
- Hilton J, Tovey D. Debating the evidence for deworming programmes[editorial]. Cochrane Database of Systematic Reviews2012; Vol. 8. [DOI: 10.1002/14651858.ED000045] [DOI] [PMC free article] [PubMed]
- Horton J. Global anthelmintic chemotherapy programs: learning from history. Trends in Parasitology 2003;19(9):405‐9. [DOI] [PubMed] [Google Scholar]
- Hotez P, Bundy D, Beegle K, Brooker S, Drake L, se Silva N, et al. Helminth infections: Soil‐transmitted helminth infections and schistosomiasis. Disease control priorities in developing countries. 2nd Edition. New York: Oxford University Press, 2006:467‐82. [Google Scholar]
- Hotez PJ, Fenwick A, Savioli L, Molyneux DH. Rescuing the bottom billion through control of neglected tropical diseases. Lancet 2009;373(9674):1570‐5. [DOI] [PubMed] [Google Scholar]
- Hotez PJ. New antipoverty drugs, vaccines, and diagnostics: a research agenda for the US President's Global Health Initiative (GHI). PLoS Neglected Tropical Diseases 2011;5(5):e1133. [DOI] [PMC free article] [PubMed] [Google Scholar]
- Hotez PJ. Unleashing "Civilian Power": a New American Diplomacy through Neglected Tropical Disease Control, Elimination, Research, and Development. PLoS Neglected Tropical Diseases 2011;5(6):e1134. [DOI] [PMC free article] [PubMed] [Google Scholar]
- Jamison DT, Breman JG, Measham AR, Alleyne G, Claeson M. Evans DB, et al (editors). Disease Control Priorities in Developing Countries. 2nd Edition. New York: Oxford University Press and the World Bank, 2006. [PubMed] [Google Scholar]
- Kvalsvig JD. Parasites, nutrition, child development and public policy. In: Crompton DWT, Montresor A, Nesheim MC, Savioli L editor(s). Controlling disease due to helminth infections. Geneva: World Health Organization, 2003:55‐65. [Google Scholar]
- Lefebvre C, Manheimer E, Glanville J. Chapter 6: Searching for studies. In: Higgins JPT, Green S (editors). Cochrane Handbook for Systematic Reviews of Interventions Version 5.0.1 [updated March 2011]. The Cochrane Collaboration, 2011. Available from www.cochrane‐handbook.org.
- Molyneux DH, Hotez PJ, Fenwick A. "Rapid‐impact interventions": how a policy of integrated control for Africa's neglected tropical diseases could benefit the poor. PLoS Medicine 2005;2(11):e336. [DOI] [PMC free article] [PubMed] [Google Scholar]
- Montresor A, Crompton DWT, Gyorkos TW, Savioli L. Helminth control in school‐age children: a guide for managers of control programmes. Geneva: World Health Organization, 2002. [Google Scholar]
- Mudur G. Deworming programme in India sparks controversy. BMJ 2015;350:h720. [DOI: 10.1136/bmj.h720] [DOI] [PubMed] [Google Scholar]
- The Nordic Cochrane Centre, The Cochrane Collaboration. Review Manager (RevMan). Version 5.3. Copenhagen: The Nordic Cochrane Centre, The Cochrane Collaboration, 2014.
- Sakti H, Nokes C, Hertanto WS, Hendratno S, Hall A, Bundy DA, et al. Evidence for an association between hookworm infection and cognitive function in Indonesian school children. Tropical Medicine & International Health 1999;4(5):322‐34. [DOI] [PubMed] [Google Scholar]
- Savioli L, Neira M, Albonico M, Beach MJ, Chwaya HM, Crompton DW, et al. Treatment for intestinal helminth infection. Review needed to take account of all relevant evidence, not only effects on growth and cognitive performance. BMJ 2000;321(7270):1226‐7. [PubMed] [Google Scholar]
- Savioli L, Montresor A, Albonico M. Control strategies. In: Holland CV, Kennedy MW editor(s). The Geohelminths: Ascaris, Trichuris and Hookworm. Netherlands: Kluwer Academic Publishers, 2002:25‐37. [Google Scholar]
- Stephenson LS, Latham MC, Ottesen EA. Malnutrition and parasitic helminth infections. Parasitology 2000;121(Suppl):S23‐38. [DOI] [PubMed] [Google Scholar]
- WHO Expert Committee on the Control of Schistosomiasis (2001: Geneva, Switzerland). Prevention and control of schistosomiasis and soil‐transmitted helminthiasis: report of a WHO expert committee. WHO technical report series no. 912. Geneva: World Health Organization, 2002. [PubMed] [Google Scholar]
- World Health Organization. Strategy Development and Monitoring for Parasitic Diseases and Vector Control Team. Deworming: The Millennium Development Goals. The evidence is in: deworming helps meet the Millennium Development Goals [WHO/CDS/CPE/PVC/2005.12]. Geneva: World Health Organization, 2005. [Google Scholar]
- World Health Organization. WHO Essential Medicines Library. 2006. mednet3.who.int/emlib/ (accessed 13 June 2007).
- World Health Organization. Preventive chemotherapy in human helminthiasis. Coordinated use of anthelminthic drugs in control interventions: a manual for health professionals and programme managers. http://whqlibdoc.who.int/publications/2006/9241547103_eng.pdf. WHO, (accessed 11 July 2015).
- World Health Organization. Monitoring drug coverage for preventive chemotherapy. 2010. http://whqlibdoc.who.int/publications/2010/9789241599993_eng.pdf (accessed 10 July 2015).
- World Health Organization. Helminth control in school‐age children. A guide for managers of control programmes. Second edition. http://whqlibdoc.who.int/publications/2011/9789241548267_eng.pdf (accessed 10 July 2015).
- World Health Organization. e‐Library of Evidence for Nutrition Actions (eLENA). Deworming to combat the health and nutritional impact of helminth infections. http://www.who.int/elena/titles/deworming/en/ (accessed 18 May 2015).
- World Bank. World Development Report 1993: Investing in health. Oxford: Oxford University Press, 1993. [Google Scholar]
- World Bank. School Deworming. http://www‐wds.worldbank.org/external/default/WDSContentServer/WDSP/IB/2010/03/23/000333038_20100323021643/Rendered/PDF/263630BRI0REVI10Box345620B01PUBLIC1.pdf (accessed 10 July 2015).
References to other published versions of this review
- Dickson R, Awasthi S, Demellweek C, Williamson P. Anthelmintic drugs for treating worms in children: effects on growth and cognitive performance. Cochrane Database of Systematic Reviews 2000, Issue 2. [DOI: 10.1002/14651858.CD000371] [DOI] [PubMed] [Google Scholar]
- Dickson R, Awasthi S, Williamson P, Demellweek C, Garner P. Effects of treatment for intestinal helminth infection on growth and cognitive performance in children: systematic review of randomised trials. BMJ 2000;320(7251):1697‐701. [DOI] [PMC free article] [PubMed] [Google Scholar]
- Taylor‐Robinson DC, Jones AP, Garner P. Deworming drugs for treating soil‐transmitted intestinal worms in children: effects on growth and school performance. Cochrane Database of Systematic Reviews 2007, Issue 4. [DOI: 10.1002/14651858.CD000371.pub3] [DOI] [PubMed] [Google Scholar]
- Taylor‐Robinson DC, Maayan N, Soares‐Weiser K, Donegan S, Garner P. Deworming drugs for soil‐transmitted intestinal worms in children: effects on nutritional indicators, haemoglobin and school performance. Cochrane Database of Systematic Reviews 2012, Issue 11. [DOI: 10.1002/14651858.CD000371.pub5] [DOI] [PubMed] [Google Scholar]