

Abstract
Background
Cultivated peanut (Arachis hypogaea. L) is one of the most important oil crops in the world. After flowering, the peanut plant forms aboveground pegs (gynophores) that penetrate the soil, giving rise to underground pods. This means of reproduction, referred to as geocarpy, distinguishes peanuts from most other plants. The molecular mechanism underlying geocarpic pod development in peanut is poorly understood.
Results
To gain insight into the mechanism of geocarpy, we extracted proteins from aerial gynophores, subterranean unswollen gynophores, and gynophores that had just started to swell into pods. We analyzed the protein profiles in each of these samples by combining 1 DE with nanoLC-MS/MS approaches. In total, 2766, 2518, and 2280 proteins were identified from the three samples, respectively. An integrated analysis of proteome and transcriptome data revealed specifically or differentially expressed genes in the different developmental stages at both the mRNA and protein levels. A total of 69 proteins involved in the gravity response, light and mechanical stimulus, hormone biosynthesis, and transport were identified as being involved in geocarpy. Furthermore, we identified 91 genes that were specifically or abundantly expressed in aerial gynophores, including pectin methylesterase and expansin, which were presumed to promote the elongation of aerial gynophores. In addition, we identified 35 proteins involved in metabolism, defense, hormone biosynthesis and signal transduction, nitrogen fixation, and transport that accumulated in subterranean unswellen gynophores. Furthermore, 26 specific or highly abundant proteins related to fatty acid metabolism, starch synthesis, and lignin synthesis were identified in the early swelling pods.
Conclusions
We identified thousands of proteins in the aerial gynophores, subterranean gynophores, and early swelling pods of peanut. This study provides the basis for examining the molecular mechanisms underlying peanut geocarpy pod development.
Electronic supplementary material
The online version of this article (doi:10.1186/s12870-015-0582-6) contains supplementary material, which is available to authorized users.
Background
Cultivated peanut (Arachis hypogaea. L) is one of the most important oil crops in the world. Peanut seeds are composed of approximately 50 % high quality edible oil and about 30 % vegetable protein. Geocarpic pod development, or the development of underground pods, distinguishes peanuts from Glycine max (soybean), Pisum sativa (pea), and many other legume species. Geocarpic development enables the underground pods to absorb soil nutrients and protects the fruit from damage by ground animals and extreme weather. However, seeds that developed underground are more vulnerable to be infected by soilborne pathogens, for example Aspergillus flavus, and subsequent contamination with aflatoxins [1].
After fertilization, the gynophore forms, and elongates in a positive geotropic manner towards the ground. The gynophore elongates continuously and the ovary, which is located at the tip of the gynophore, does not swell until the gynophore has penetrated the soil. Previous studies suggested that light, mechanical stimuli, and hormones are all key factors in initiating pod swelling [2]. Before and after gynophore soil penetration, the phytochrome protein content changes significantly [3, 4], and light is considered to be the major factor preventing peanut pod development [5]. After gynophore soil penetration, the endogenous ethylene and IAA content change. Compared with aerial green gynophores, the underground so-called white gynophores release twice the amount of ethylene. However, the IAA content is high in the aerial gynophores and low in the swelling pod stage [6]. It is assumed that these physiological changes restart the development of the proembryo, and subsequently initiate the process of pod development and inhibit elongation of the gynophores [7]. In addition to the above three factors, gravity, calcium, and pH might also be important for the growth of the pod [2, 8].
Recently, several efforts were made to investigate the mechanisms of pod formation and development at the molecular level. Chen et al. (2013) analyzed the gene expression profiles of the peanut gynophore and young pod using 454 sequencing. They identified two senescence-associated genes that were significantly up-regulated in the aerial gynophores and suggested that these genes may contribute to embryo abortion in aerial gynophores [9]. In our recent study, we constructed a transcriptome library and analyzed the overall gene expression profile in the aerial-grown green gynophore, dark-grown white gynophore, and dark-grown gynophore with small pods (2–3 mm in length) using a HiSeq2000 system. We identified a global change in gene expression before and after the initiation of pod growth [10]. Furthermore, Zhu et al. (2013) performed a comparative proteomic analysis between the peanut aerial gynophore and subterranean pods using two-dimensional electrophoresis (2-DE) combined with mass spectrometry, and identified several candidate proteins related to pod swelling [11]. Using 2-DE proteomic analysis, another study identified 27 proteins that are differentially expressed in aerial gynophores, subterranean gynophores, and gynophores subjected to various treatments [12]. These results provided valuable information about proteome alteration before and after peanut pod swelling. However, due to the limited number of proteins identified, these studies fail to provide a comprehensive interpretation of the molecular mechanism underlying peanut geocarpy. To gain insight into the molecular networks underlying this unique and complex developmental process, more comprehensive proteomic profiling studies are required.
Here, we report the identification of a reference proteome comprising 2766, 2518, and 2280 unique proteins from stage 1 (S1) gynophores (i.e., aerial gynophores that are green or purple and 3–5 cm long), stage 2 (S2) gynophores (i.e., gynophores that have been buried in the soil for about 3 days; the gynophores are white and ovary enlargement is not apparent), and stage 3 (S3) gynophores (dark-grown gynophores with 2–3 mm long pods) (Fig. 1). Among the identified proteins, those with ontologies related to gravity response, light and mechanical stimulus, hormone synthesis and transportation, and calcium-related proteins were prominent. This study lays the foundation for understanding the mechanisms of peanut gynophore and pod development at the protein level.
Fig. 1.
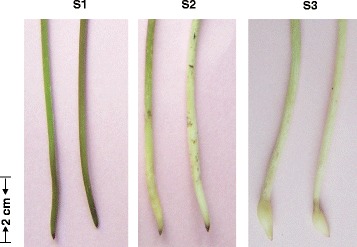
Gynophores of three different developmental stages used for protein extraction. Two representative examples each of S1, S2, and S3 gynophores are shown
Results
Protein identification and statistical analysis
To acquire a comprehensive proteome profile of pods in the early stages of development, we combined 1 DE with nanoLC-MS/MS (liquid chromatography-tandem mass spectrometry). In total, 14,337 peptides were analyzed, resulting in the identification of 2766, 2518, and 2280 unique proteins in S1, S2, and S3 gynophores, respectively. The relative molecular mass of these proteins ranged from 3.5-136.8 kDa, and the false discovery rates (FDRs) were 1.09, 1.19, and 1.6 % in S1, S2, and S3 gynophores, respectively (Table 1). The distribution of coverage of protein sequences mapped by peptides is shown in Fig. 2. We identified 574, 307, and 185 specific proteins in S1, S2, and S3 gynophores, respectively (Fig. 3, Additional file 1: Table S1, Additional file 2: Table S2 and Additional file 3: Table S3). Three samples shared 1696 common proteins (Fig. 3, Additional file 4: Table S4). The best hit ID, sequence coverage, molecular weight, corresponding protein description, and sequences of all the identified proteins are summarized in Additional file 1: Table S1, Additional file 2: Table S2, Additional file 3: Table S3 and Additional file 4: Table S4. The number of peptides and number of spectra for the identified protein groups are also indicated in Additional file 1: Table S1, Additional file 2: Table S2, Additional file 3: Table S3 and Additional file 4: Table S4. The identified protein was defined as a reproducible protein if it was matched with at least two peptides. In total, 1049 proteins were detected with at least two matching peptides per protein. Sixteen of these proteins, such as ATP synthase, heat shock proteins, and WD-40 repeat family proteins, were detected at least 10 times, suggesting that they are relatively abundant. These relatively high abundant proteins may be involved in essential functions during gynophore and pod development. Many proteins were detected by a single peptide, suggesting that their abundance is low in the three samples (Additional file 1: Table S1, Additional file 2: Table S2, Additional file 3: Table S3 and Additional file 4: Table S4).
Table 1.
Total proteins identified from gynophores of three developmental stages
| Sample(a) | Total spectra(b) | Identified spectra(c) | Identified peptides(d) | Identified proteins(e) | FDR (%)(f) |
|---|---|---|---|---|---|
| S1 | 112003 | 31173 | 5435 | 2766 | 1.09 |
| S2 | 105218 | 25668 | 4608 | 2518 | 1.19 |
| S3 | 114294 | 24405 | 4294 | 2280 | 1.16 |
| Total | 331515 | 81246 | 14337 | 7564 | - |
aThree samples used in this study. S1: Aerial downward-growing gynophores; S2: Subterranean gynophores that had been buried in the soil for about three days; S3: Gynophores with early swelling pods that are buried in the soil. bThe total number of spectra. cThe number of spectra with an ion score above the threshold. dThe number of peptides matching the spectrum after repetitions of peptides had been removed. eThe number of proteins that the identified peptide matched, these proteins have at least one unique peptide. fFalse discovery rate, which was set to less than 5 %
Fig. 2.
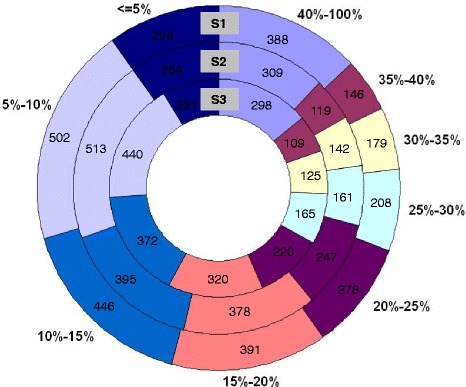
Distribution of the coverage of protein sequences mapped by peptides. According to the percentage of proteins covered by peptides, the identified proteins were divided into nine categories, 40-100 %, 35-40 %, 30-35 %, 25-30 %, 20-25 %, 15-20 %, 10-15 %, 5-10 %, and < =5 % of coverage. Numbers in the diagram indicate the quantity of proteins within the range of coverage. For example, there are 388, 309, and 298 proteins with a peptide coverage between 40 % and 100 % in S1, S2, and S3, respectively
Fig. 3.
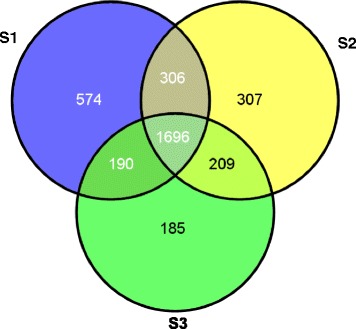
Venn diagram showing the number of proteins detected in S1, S2, and S3 samples. Numbers shared by two circles represent proteins shared by the two categories. The number shared by all three circles indicates the number of proteins found in all three samples
Protein classification and functional annotation
To investigate the diverse functions of proteins obtained from the three samples, we predicted the biological functions of the identified proteins using Gene Ontology (GO) analysis (http://www.geneontology.org). Based on sequence homology, 2584, 2335, and 2119 proteins of S1, S2, and S3 gynophore samples were categorized into 45 functional groups (Fig. 4). In some cases, a particular protein could be classified into more than one category, suggesting that the protein has roles in multiple biological processes. Proteins involved in cell, cell part, metabolic process, cellular process, organelle, binding, catalytic activity, and response to stimulus were highly represented in all three samples.
Fig. 4.
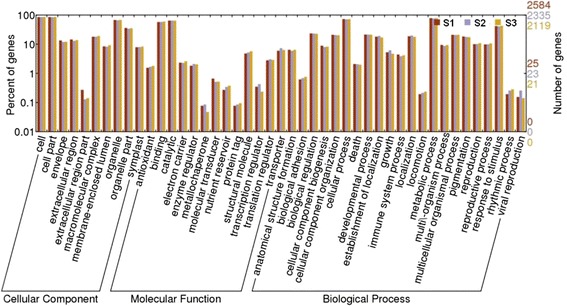
Histogram presentation of Gene Ontology classification. The identified proteins are grouped into three main categories: biological process, cellular component, and molecular function. The right y-axis indicates the number of genes in a category. The left y-axis indicates the percentage of a specific category of genes in that main category
To further evaluate the identified proteins, we performed Cluster of Orthologous Groups (COG) classification analysis. Among the 23 COG categories, the category of general function prediction only contained 271, 247, and 234 proteins in S1, S2, and S3, respectively, and represented the largest group, followed by the category of posttranslational modification, energy production and conversion, carbohydrate transport and metabolism, translation, ribosomal structure, and biogenesis. Nuclear structure, chromatin structure and dynamics, and RNA processing and modification represented the smallest groups, each containing only a few proteins (Fig. 5).
Fig. 5.
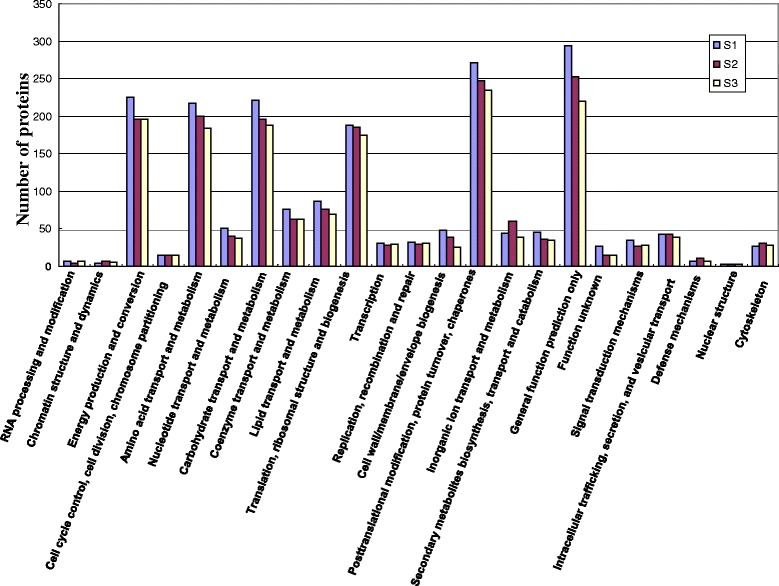
COG function classification of identified proteins. The identified proteins were classified into 23 categories, such as posttranslational modification, energy production and conversion, carbohydrate transport and metabolism, translation, and ribosomal structure. The y-axis indicates the number of genes in each category. The x-axis indicates the categories of proteins
To identify the biological pathways that are active in S1, S2, and S3 gynophores, we mapped the identified proteins to the reference canonical pathways in the Kyoto Encyclopedia of Genes and Genomes (KEGG) database [13]. In total, 290, 282, and 278 KEGG pathways were represented by proteins identified in S1, S2, and S3 gynophores, respectively, and these pathways included metabolic pathways, plant-pathogen interaction pathways, plant hormone signal transduction pathways, and fatty acid biosynthesis pathways (Additional file 5: Table S5). These annotations provide a valuable resource for investigating specific processes and pathways associated with peanut gynophore and pod development.
Proteins associated with peanut pod development
Previous studies suggested that the geocarpic development of peanut pods is regulated by several factors, such as light, mechanical stimuli, hormones, and gravity. To identify homologues of proteins involved in peanut pod development, we performed a BLASTP search against the NCBI Nr database (E-value < =10−5). In total, we identified 69 proteins with functions closely related to the above-mentioned key factors that regulate early pod development in peanut (Table 2). Thirteen of these proteins were associated with hormone metabolism and transport. Among these proteins, ten were involved in auxin biosynthesis, regulation, and transportation, such as auxin conjugate hydrolase, auxin-induced proteins, auxin-binding proteins, and auxin efflux carrier. One protein was involved in ethylene biosynthesis, one was related to brassinosteroid biosynthesis, and one was related to gibberellin regulation. Moreover, we identified 26 proteins related to gravity stimulation in the peanut proteome dataset, half of which were heat shock proteins (Table 2). Twenty-six proteins involved in light and mechanical stimuli were identified, and half of these (13) were annotated as peroxidases. In addition, five calcium-related proteins, namely calmodulin 5, calcium-binding protein, endoplasmic reticulum-type calcium-transporting ATPase 4, calcium-dependent protein serine/threonine kinase, and calcium-binding EF hand family protein, were identified (Table 2).
Table 2.
The identified proteins associated with early pod development in peanut
| Function category(a) | Protein annotation(b) | Accession no.(c) | Protein mass (Da)(d) | Number of unique spectra(e) | Expression level (RPKM)(f) | ||||
|---|---|---|---|---|---|---|---|---|---|
| S1 | S2 | S3 | S1 | S2 | S3 | ||||
| Hormone synthesis and transport | |||||||||
| ethylene-forming-enzyme-like dioxygenase | Unigene1601 | 7294.74 | 1 | 1 | 1 | 40.79 | 39.57 | 29.88 | |
| auxin-induced protein PCNT115 | Unigene35781 | 7591 | 10 | 2 | 4 | - | - | - | |
| auxin conjugate hydrolase | Unigene62418 | 15754.03 | 2 | 2 | 5 | 31.34 | 24.86 | 16.44 | |
| auxin conjugate hydrolase | Unigene66297 | 18462.26 | 3 | 4 | 3 | 14.39 | 57.75 | 14.66 | |
| auxin-induced protein | Unigene33790 | 7048.87 | 6 | 3 | 6 | - | - | - | |
| auxin-induced protein | Unigene29960 | 6562.45 | 2 | 1 | 1 | - | - | - | |
| auxin-induced-related/indole-3-acetic acid induced-related-like | Unigene70406 | 25322.62 | 2 | 0 | 0 | 9.56 | 15.51 | 13.71 | |
| auxin binding protein 1 | Unigene66527 | 21392.72 | 1 | 0 | 0 | - | - | - | |
| auxin conjugate hydrolase | Unigene28944 | 4178.08 | 1 | 0 | 0 | 37.82 | 34.91 | 19.87 | |
| auxin efflux carrier | Unigene68037 | 23205.64 | 1 | 0 | 0 | 42.66 | 13.21 | 5.53 | |
| auxin efflux carrier family protein | Unigene72169 | 49455.3 | 1 | 0 | 0 | - | - | - | |
| Gibberellin-regulated protein GA | Unigene10067 | 11170.06 | 38 | 29 | 43 | - | - | - | |
| brassinosteroid biosynthetic protein LKB | Unigene62672 | 17576.9 | 2 | 11 | 5 | 311.10 | 206.03 | 49.91 | |
| Gravity stimulation | |||||||||
| ABC transporter ABCE.2 | Unigene72502 | 69066.7 | 39 | 23 | 26 | 84.41 | 82.15 | 87.00 | |
| ABC transporter family protein | Unigene21711 | 5989.96 | 8 | 6 | 1 | - | - | - | |
| white-brown-complex ABC transporter family | Unigene18576 | 49021.47 | 2 | 4 | 3 | 25.91 | 37.09 | 16.94 | |
| ABC transporter family protein | Unigene70598 | 35095.19 | 2 | 2 | 1 | 75.21 | 68.28 | 80.76 | |
| multidrug/pheromone exporter MDR family ABC transporter family | Unigene62432 | 16133.34 | 1 | 0 | 0 | 62.54 | 31.35 | 10.29 | |
| PDR-type ABC transporter 2 | Unigene71859 | 44479.44 | 2 | 0 | 0 | 48.56 | 188.56 | 91.96 | |
| ABC transporter family protein | Unigene69124 | 18228.19 | 2 | 0 | 0 | 64.31 | 47.34 | 35.95 | |
| ATNAP6 (NON-INTRINSIC ABC PROTEIN 6); protein binding/transporter | Unigene71274 | 36264.21 | 1 | 0 | 0 | - | - | - | |
| ABC transporter family protein | Unigene65236 | 19643.19 | 1 | 0 | 0 | - | - | - | |
| DnaJ protein | Unigene63710 | 16714.22 | 5 | 5 | 9 | - | - | - | |
| DNAJ heat shock N-terminal domain-containing protein | Unigene69504 | 29786.75 | 2 | 0 | 0 | 22.64 | 11.06 | 12.10 | |
| DNAJ heat shock family protein | Unigene61156 | 13833.69 | 1 | 0 | 0 | - | - | - | |
| microtubule-associated protein MAP65-1a | Unigene71866 | 45884.12 | 0 | 0 | 1 | 94.44 | 122.33 | 209.65 | |
| microtubule-associated protein | Unigene71117 | 33626.74 | 0 | 0 | 1 | - | - | - | |
| heat shock protein 70-3 | Unigene69094 | 27928.34 | 8 | 8 | 5 | 256.72 | 227.57 | 51.51 | |
| heat shock protein 70 | Unigene65006 | 18141.33 | 13 | 19 | 13 | 149.25 | 184.87 | 64.85 | |
| heat shock 70 kDa protein mitochondrial | Unigene77 | 44585.2 | 73 | 35 | 49 | 97.49 | 75.41 | 38.98 | |
| heat shock protein 70 | Unigene64820 | 18289.48 | 20 | 18 | 29 | - | - | - | |
| Heat shock 70 kDa protein mitochondrial | Unigene22321 | 5492.85 | 22 | 20 | 24 | - | - | - | |
| heat shock protein 90 | Unigene71426 | 41188.91 | 20 | 15 | 14 | 396.06 | 249.15 | 117.10 | |
| heat shock protein 90 | Unigene70349 | 34936.08 | 41 | 34 | 17 | 270.06 | 242.44 | 89.72 | |
| heat shock protein 60 | Unigene19291 | 13460.84 | 20 | 28 | 20 | - | - | - | |
| heat shock 70 kDa protein mitochondrial | Unigene69299 | 18064.06 | 15 | 7 | 8 | 138.07 | 147.68 | 63.71 | |
| heat shock protein 83 | Unigene69604 | 31674.36 | 4 | 1 | 13 | 3.26 | 10.30 | 23.60 | |
| heat shock protein binding protein | Unigene72153 | 46912.47 | 3 | 6 | 4 | 100.77 | 96.78 | 101.63 | |
| peroxisomal small heat shock protein ACD31.2 | Unigene55006 | 7984.84 | 6 | 9 | 13 | - | - | - | |
| Light and mechanical stimulus | |||||||||
| vacuolar H + −ATPase B subunit | Unigene58237 | 12477.4 | 63 | 66 | 70 | - | - | - | |
| vacuolar H + −ATPase B subunit | Unigene70168 | 23795.16 | 32 | 21 | 22 | - | - | - | |
| V-H(+)-ATPase subunit A | Unigene57183 | 12256.11 | 63 | 54 | 51 | - | - | - | |
| vacuolar proton-ATPase subunit-like protein | Unigene72042 | 53725.55 | 23 | 5 | 3 | 114.45 | 79.93 | 63.00 | |
| vacuolar H + −ATPase A1 subunit isoform | Unigene22140 | 5891.07 | 26 | 10 | 23 | - | - | - | |
| vacuolar (H+)-ATPase G subunit | Unigene66176 | 12282.34 | 6 | 4 | 3 | - | - | - | |
| plasma membrane H + −ATPase | Unigene66682 | 10032.22 | 2 | 14 | 5 | 70.23 | 61.12 | 46.70 | |
| autoinhibited H+ ATPase | Unigene71289 | 31534.9 | 3 | 2 | 2 | 96.02 | 100.12 | 66.26 | |
| plasma membrane H+ ATPase | Unigene18749 | 33429.66 | 3 | 0 | 0 | 67.84 | 54.27 | 67.79 | |
| plasma membrane Ca2 + −ATPase | Unigene58047 | 12779.62 | 1 | 0 | 0 | 28.12 | 10.97 | 10.64 | |
| autoinhibited calcium ATPase | Unigene18942 | 20451.6 | 1 | 0 | 0 | 11.23 | 11.63 | 30.39 | |
| plasma membrane H + −ATPase | Unigene59696 | 13366.89 | 2 | 0 | 0 | 87.35 | 99.89 | 62.04 | |
| peroxidase | Unigene54700 | 11344.53 | 77 | 51 | 54 | 162.21 | 201.85 | 140.32 | |
| peroxidase | Unigene57343 | 11907.84 | 66 | 72 | 94 | - | - | - | |
| cytosolic ascorbate peroxidase | Unigene49105 | 9691.83 | 53 | 43 | 54 | - | - | - | |
| peroxidase | Unigene70700 | 29953.04 | 43 | 52 | 31 | 291.66 | 397.48 | 55.60 | |
| extensin peroxidase | Unigene46836 | 8747.6 | 31 | 31 | 34 | - | - | - | |
| peroxidase 17 | Unigene72081 | 36015.01 | 4 | 15 | 75 | 5.25 | 29.97 | 54.32 | |
| glutathione peroxidase | Unigene63014 | 13139.73 | 10 | 7 | 12 | - | - | - | |
| peroxidase | Unigene71860 | 35645.07 | 7 | 2 | 2 | 174.21 | 111.26 | 59.73 | |
| peroxidase 30 | Unigene28971 | 6729.43 | 3 | 1 | 5 | 348.59 | 269.03 | 79.47 | |
| peroxidase precursor | Unigene48043 | 9252.78 | 3 | 12 | 6 | 49.16 | 38.76 | 5.94 | |
| peroxidase 1 precursor | Unigene61708 | 14791.6 | 5 | 6 | 5 | - | - | - | |
| peroxidase 1 precursor | Unigene42563 | 8357.1 | 7 | 2 | 8 | - | - | - | |
| peroxidase | Unigene26422 | 6290.16 | 1 | 3 | 4 | - | - | - | |
| Calcium related | |||||||||
| CAM5 (calmodulin 5); calcium ion binding | Unigene60884 | 6420.92 | 20 | 20 | 22 | - | - | - | |
| calcium-binding protein | Unigene15783 | 6641.1 | 4 | 4 | 4 | - | - | - | |
| endoplasmic reticulum-type calcium-transporting ATPase 4 | Unigene71807 | 46699.82 | 4 | 7 | 5 | 80.84 | 75.27 | 72.45 | |
| OST1 (open stomata 1); calcium-dependent protein serine/threonine kinase | Unigene3574 | 19012.44 | 2 | 1 | 1 | - | - | - | |
| calcium-binding EF hand family protein | Unigene16448 | 44795.08 | 4 | 4 | 4 | 35.58 | 32.99 | 18.99 | |
aProteins associated with peanut pod development were classified into four categories: hormone synthesis and transport, gravity stimulation, light and mechanical stimulus, and calcium-related proteins. bThe function of these proteins was annotated using the Nr database. cThe corresponding accession numbers in the transcriptome database [10]. dThe molecular mass of proteins (Dalton). eThe number of unique spectra detected in each samples. fThe gene expression level corresponding to each protein
Comparative analysis of the proteome and transcriptome of peanut
In our previous study, we performed a transcriptome analysis of peanut gynophores and pods (including S1, S2, and S3 samples), and generated a global gene expression profile that provided valuable information about the changes in gene expression that occur in S1, S2, and S3 gynophores and during pod development [10]. The gene expression level was calculated by RPKM (reads per kb per million reads). To evaluate the post-transcriptional regulation of gene expression during these three stages of gynophore development, we compared the protein identification results with the gene expression data. The correlation between identified proteins and mRNA expression is shown in Table 2. A total of 38 of the 69 identified key proteins were detected in the digital gene expression profiling results, including key proteins in hormone synthesis, response to gravity, light, mechanical stimulus, and calcium. Interestingly, the corresponding gene transcription levels of some proteins that were found to be highly abundant at the protein level (i.e., proteins that were detected by multiple peptides) were very low or undetected. Examples of these include gibberellin-regulated protein (Unigene10067), heat shock protein 70 (Unigene71426), heat shock protein 60 (Unigene19291), vacuolar H+-ATPase B subunit (Unigene58237, Unigene70168), and peroxidase (Unigene57343). By contrast, some highly expressed transcripts were not detected in the peanut proteome dataset. For example, the PDR-type ABC transporter 2 transcript (Unigene71859) exhibited higher expression levels in S2 (RPKM 188.56) and S3 (RPKM 91.96) gynophores than in S1 gynophores (RPKM 48.56). However, PDR-type ABC transporter 2 protein was only detected in S1 gynophores, suggesting the occurrence of post-transcriptional regulation of the corresponding gene.
Discussion
Proteomic technology is a useful approach for identifying proteins in plants [14–18]. Recently, a number of proteins that are differentially expressed between peanut aerial gynophores, subterranean gynophores, and early swelling pods, were identified using two-dimensional electrophoresis combined with mass spectrometry [11, 12]. In the current study, we combined 1 DE with nanoLC MS/MS shotgun proteomic analysis to provide a comprehensive overview of the proteome profile during peanut gynophores and early pod development. Compared with traditional approaches, fractionation prior to LC − MS/MS analysis significantly increased the number of identified proteins and individual protein coverage [19]. We successfully identified 2766, 2518, and 2280 proteins in peanut S1, S2, and S3 gynophores, including 69 proteins related to the gravity response, light and mechanical stimuli, and hormone biosynthesis and transport, which are all considered to be important processes during peanut gynophore elongation and early pod development.
In contrast to other aboveground organs of peanut, the aerial gynophores grow downwards to the ground. Proteins that play positive roles in geotropic growth could thus be involved in gynophore development. It was reported that the ABC transporters, heat shock proteins, microtubules, and microtubule-associated proteins play important roles in the plant’s response to gravity stimulation [20, 21]. We identified 26 proteins related to gravity stimulation in the peanut proteome dataset, half of which were heat shock proteins (Table 2). Light and mechanical stimuli are the key factors affecting peanut pod development [2–5, 7]. In total, we identified 26 proteins involved in light and mechanical stimuli in this study, 13 of which were annotated as peroxidases. In addition, we identified five calcium-related proteins, i.e., calmodulin 5, calcium-binding protein, endoplasmic reticulum-type calcium-transporting ATPase 4, calcium-dependent protein serine/threonine kinase, and calcium-binding EF hand family protein (Table 2).
After soil penetration, the gynophores continue to elongate for a short period of time in the darkness. However, S2 gynophores exhibit morphological and physiological differences from S1 gynophores, indicating that the expression levels of some proteins were changed. Here, we detected 574 proteins that were specifically expressed in S1 gynophores. By comparing our proteomic data with our previously published RNA-seq dataset [10], we identified 91 proteins whose transcription levels were high or specifically expressed in S1 gynophores (Additional file 6: Table S6). For other proteins identified, the corresponding gene expression data were not in agreement with the protein accumulation patterns. We classified these 91 proteins into 11 groups according to their function. Among these specific proteins in S1 gynophores, 11 proteins were annotated as cell structure-related proteins, including four members of the pectin methylesterase family, two proteins involved in polygalacturonase, one expansin, one polygalacturonase-inhibiting protein, and two villins. Pectin methylesterase plays important roles in cell wall extension during pollen germination, pollen tube growth, and stem elongation [22]. Expansins are involved in cell enlargement and can cause irreversible extension of the cell wall [23], and have been linked to auxin action [24]. We suggest that the accumulation of pectin methylesterase and expansins promotes the elongation of S1 gynophores. By comparing our proteomic data with our previously published RNA-seq dataset, we also found some other interesting proteins in S1 gynophores (Additional file 6: Table S6). For example, GDSL-motif lipase, which is associated with ethylene signaling proteins in Arabidopsis [25], was identified only in S1 gynophores. At the transcription level, the GDSL-motif lipase unigene 69514 was strongly expressed in S1 gynophores (466.64 RPKM), while its expression levels were much lower in S2 (4.57 RPKM) and S3 (0.18 RPKM) gynophores.
We identified 307 proteins that were specifically or strongly expressed in S2 gynophores (Additional file 2: Table S2). The protein accumulation pattern of 35 of these proteins was in agreement with their transcription level in the S2 gynophore (Additional file 7: Table S7). However, the accumulation trend of other proteins was not in agreement with their transcripts. Function annotation and classification results showed that one-third of the proteins whose protein accumulation patterns agrees with their transcripts were enzymes involved in metabolism and secondary metabolism, such as anthocyanin-O-acyltransferase, caffeic acid O-methyltransferase, and phytase. In addition, three disease and defense-related proteins were identified, i.e., class III peroxidase, peroxidase 1 precursor, and peroxidase-like protein. Peroxidases are a family of isozymes found in plants, and their functions include removal of H2O2, biosynthesis and degradation of lignin in cell walls, auxin catabolism, defense responses to wounding, and defense against pathogen or insect attack [26]. We suggest that high levels of peroxidase accumulation play essential roles in underground gynophore development. Moreover, four transport-related proteins, namely amino acid/polyamine transporter II, MATE efflux family protein, PDR-type ABC transporter 2, and sugar transporter ERD6-like 6, were specifically identified in S2 gynophores.
Compared with the RNA-seq dataset [10], we found that 26 proteins of S3 were highly or specifically expressed both at the protein and mRNA level (Additional file 8: Table S8). Seven of these were enzymes involved in metabolism and secondary metabolism, including cinnamate 4-hydroxylase (C4H). C4H is a key catalytic enzyme in the synthesis of 4-hydroxycinnamate, a component in the lignin and anthocyanin biosynthesis pathways. In addition, fatty acids and starch synthesis-related proteins, such as lipoxygenase, FAD-binding domain-containing protein and starch branching enzyme I, were found in S3 gynophores and pods, suggesting that dry matter accumulation and seed development have started at this stage. Five cell growth or division and cell structure proteins were identified in early swelling pods. When the pod starts to swell, gynophore elongation ceases. The high levels of actin and microtubule-associated protein accumulation suggest that the cytoskeleton undergoes drastic change in S3 gynophores. The identification of specific and highly abundant proteins in S2 and S3 gynophores provided valuable information that can be used to advance our understanding of the molecular mechanism underlying geocarpic pod development.
Conclusions
Our integrated analysis of proteome and transcriptome data provided useful information about the mechanism controlling gynophore and pod development (Fig. 6). During aerial growth, the accumulation of pectin methylesterase and expansins promoted the growth and elongation of gynophores. The ABC transporter, heat shock protein, microtubule-associated protein, and auxin efflux carrier identified in S1 gynophores could play important roles in controlling the growth direction of gynophores. After soil penetration, the new environment and soil friction induced an increase in the levels of protective proteins, such as class III peroxidase, peroxidase 1 precursor, and peroxidase-like protein. Alpha-expansin 4, which might prompt gynophores to continue to elongate for a short period after gynophore soil penetration, was detected in the S2 sample. Once the young pods formed in S3 gynophores, the levels of enzymes related to fatty acid metabolism and starch biosynthesis increased, such as lipoxygenase, FAD-binding domain-containing protein, and starch branching enzyme I. Furthermore, actin-related proteins accumulated during early pod development. Interestingly, we observed that the nodulin gene and the corresponding protein were both strongly expressed during early pod initiation, suggesting that nodulation and early pod development might share similar mechanisms. Our proteome profiling results presented here provide useful insight into the mechanisms controlling peanut pod development.
Fig. 6.
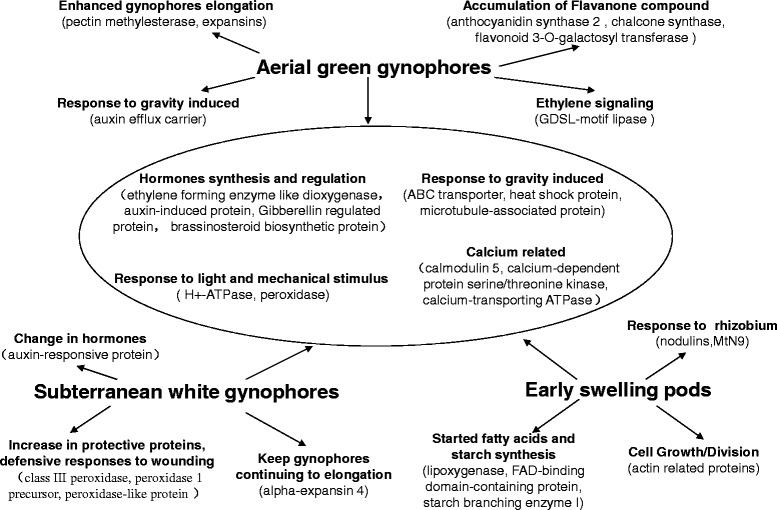
Identified proteins and their suggested function in peanut gynophores and during early pod development. Pectin methylesterases and expansins induced the aerial gynophores to grow and elongate. The ABC transporter, heat shock protein, microtubule-associated protein, and auxin efflux carrier controlled the direction of gynophore growth. After soil penetration, the new environment and soil friction induced an increase of protective proteins, such as class III peroxidase, peroxidase 1 precursor, and peroxidase-like protein. Furthermore, alpha-expansin 4 might prompt the gynophores to continue to elongate until the gynophores started to swell. After young pods formed, enzymes related to fatty acid metabolism and starch synthesis, such as lipoxygenase, FAD-binding domain-containing protein, and starch branching enzyme I, were activated. Meanwhile, the expression of actin-related proteins may reflect the pod development
Methods
Plant materials
Plants of “Luhua 14”, a widespread cultivar in Northern China, were sown in early May and harvested in early October in the experimental farm of Shandong Academy of Agricultural Sciences. The S1, S2, and S3 gynophores were collected from the farm-grown plants (Fig. 1). The tip-most 1 cm was excised from the S1, S2, and S3 gynophores and immediately frozen in liquid nitrogen for protein extraction.
Protein extraction
Protein extraction was carried out according to the following method. Briefly, samples were ground to powder in liquid nitrogen, and then suspended in extraction solution (7 M urea, 2 M thiourea, 4 % CHAPS, 40 mM Tris–HCl (pH 8.5), 1 mM PMSF, 2 mM EDTA, and 10 mM dithriothreitol (DTT)). After 5 min, the above suspension was sonicated at 200 W for 15 min and then centrifuged at 30, 000 g for 15 min at 4 °C. The supernatant was carefully collected and 5× volume of chilled acetone containing 10 % (v/v) TCA was added, and the samples were mixed well and incubated overnight at −20 °C. After centrifugation at 30, 000 g for 15 min at 4 °C, the supernatant was discarded, and the precipitate was washed three times with chilled acetone. After air-drying, the precipitate was dissolved in lysis buffer containing 7 M urea, 2 M thiourea, 4 % NP40, and 20 mM Tris–HCl (pH 8.0-8.5). The suspension was sonicated at 200 W for 15 min and centrifuged at 30, 000 g for 15 min at 4 °C. The supernatant was collected and transferred to a new tube for further analysis.
Polyacrylamide Gel electrophoresis and In-gel digestion
The proteins extracted from peanut samples were mixed with SDS loading buffer, and then denatured at 100 °C for 5 min. Proteins were separated on by 12 % polyacrylamide gel electrophoresis (SDS-PAGE) at 100 V. After electrophoresis, gels were stained with Coomassie Brilliant Blue R-250 (Pierce, USA) following the manufacturer’s instructions. Protein bands were sequentially and vertically cut into 10 slices, and each slice was placed in a separate Eppendorf tube. Each gel slice was cut into about 1-mm3 cubes, and was thoroughly destained using 50 mM ammonium bicarbonate containing 50 % acetonitrile (ACN) at 37 °C. Gel slices were incubated with 10 mM DTT containing 25 mM ammonium bicarbonate for 1 h at 60 °C to reduce disulfide bonds, and then alkylated with 55 mM iodoacetamide containing 25 mM ammonium bicarbonate for 45 min at room temperature in darkness. In-gel digestion was carried out by adding 0.01 μg/μL Trypsin Gold (Promega, USA) to the samples and incubating them at 37 °C overnight. After digestion, the peptides were further extracted twice using 0.1 % formic acid (FA) in 50 % ACN. The extracted peptides were dried and stored at −80 °C for LC-MS/MS analysis.
LC-MS/MS experiments
The tryptic-digested peptide samples were redissolved in Buffer A (5 % ACN and 0.1 % FA), and centrifuged at 4 °C and 20, 000 g for 10 min to remove the insoluble material. The final concentration of peptide was about 0.5 μg/μl. Then, 10 μl of supernatant was loaded onto the nanoHPLC system (Shimadzu, Japan) according to the manufacturer’s instructions. The separation procedure was as follows. First, the peptides were loaded onto a 10-cm C18 trapping column (inner diameter, 75 μm; Waters, USA). In the separation process, samples were loaded at 8 μL/min for 4 min, and a 44-min gradient was then run at 300 nL/min starting with 2 to 35 % Buffer B (98 % ACN and 0.1 % FA), followed by a 2-min linear gradient to 80 % Buffer B, and maintenance at 80 % Buffer B for 4 min, and finally a return to 5 % Buffer B over a 1 min period. The peptides were subjected to nanoelectrospray ionization followed by tandem mass analysis.
The separated peptides were subjected to tandem mass spectrometry (MS/MS) in a LTQ Orbitrap Velos (Thermo, USA) coupled online to the HPLC system. Intact peptides were scanned in the Orbitrap at a resolution of 60, 000, and further selected for collision-induced dissociation (CID) operating with a normalized collision energy setting of 35 % [27]. The ion fragments were detected in the LTQ. A data-dependent procedure that alternated between one MS scan followed by ten MS/MS scans was applied, and the ten most intense ions above a threshold ion count of 5, 000 were detected with the following Dynamic Exclusion settings: repeat counts, 2; repeat duration, 30 s; and exclusion duration, 120 s. The applied electrospray voltage was 1.5 kV. Automatic gain control (AGC) was used to prevent overfilling of the ion trap and 1 × 10⁴ ions were accumulated in the ion trap to generate CID spectra. For the MS scans, the m/z scan range was 350 to 2, 000 Da.
Data analysis and statistics
Raw data files obtained from the Orbitrap were converted into MGF files using Proteome Discoverer 1.2 (Thermo, USA). Protein annotation was performed using the Mascot search engine (Matrix Science, UK; version 2.3.02) against the peanut transcriptome database, which contained 72, 527 unigenes [10]. The parameters for protein identification are listed in Additional file 9: Table S9, and the false discovery rate (FDR) was set to 0.05 for both peptides and proteins.
Functional annotation of the proteins was performed using the Blast2 GO program against the non-redundant protein database at NCBI [28]. KEGG pathway analysis was performed by comparing the identified proteins with the KEGG database (http://www.genome.jp/kegg/). COG classification was carried out by comparing the identified proteins with the Cluster of Orthologous Groups database (http://www.ncbi.nlm.nih.gov/COG/).
Availability of supporting data
The mass spectrometry of proteomics data have been deposited to the ProteomeXchange Consortium (http://proteomecentral.proteomexchange.org) [29] via the PRIDE partner repository with the dataset identifier PXD002579-81 and DOI 10.6019/PXD002579-81. The RNA-Seq data discussed in this publication have been deposited in NCBI’s Gene Expression Omnibus [30] and are accessible through GEO Series accession number GSE70972 (http://www.ncbi.nlm.nih.gov/geo/query/acc.cgi?acc=GSE70972).”
Acknowledgments
This work is supported by the Ministry of Science and Technology of China (2013AA102602, 2011BAD35B04, 2012BAD33B07), the National Natural Science Foundation of China (31101427), promotive research fund for young and middle-aged scientisits of Shandong Province (BS2014SW017), Shandong Province Taishan Scholar Foundation (tshw20100416), Shandong Province Germplasm Innovation and Utilization Project, and the “Young Talents Training Program of Shandong Academy of Agricultural Sciences”.
Abbreviations
- S1
Aerial grown gynophores
- S2
Subterranean grown un-swelling gynophores
- S3
Subterranean grown gynophores with early swelling pod
- PRKM
Reads per kb per million reads
- LC-MS/MS
Liquid chromatography-tandem mass spectrometry
- GO
Gene Ontology
- COG
Cluster of Orthologous Groups
- KEGG
Kyoto Encyclopedia of Genes and Genomes
Additional files
Specific proteins identified in S1 gynophores. (XLS 247 kb)
Specific proteins identified in S2 gynophores. (XLS 147 kb)
Specific proteins identified in S3 gynophores. (XLS 91 kb)
Common proteins identified in S1, S2, and S3 gynophores. (XLSX 419 kb)
Pathway analysis of identified proteins from S1, S2, and S3 gynophores. (XLS 778 kb)
Transcriptome and functional analysis of specific proteins identified in S1 gynophores. (DOC 205 kb)
Transcriptome and functional analysis of specific proteins identified in S2 gynophores. (DOC 94 kb)
Transcriptome and functional analysis of specific proteins identified in S3 gynophores. (DOC 70 kb)
Parameters of Mascot. (DOC 28 kb)
Footnotes
Competing interests
The authors declare that they have no competing interests.
Authors’ contributions
XW and XZ designed the study. CZ, SZ, LH, HX, JW, CL, AL, and TL carried out most of the experiments and data analysis, and wrote the Materials and Methods part of the manuscript. XW and CZ wrote the manuscript, generated the figures, and finalized the tables. All authors read and approved the final manuscript.
Contributor Information
Chuanzhi Zhao, Email: chuanzhiz@126.com.
Shuzhen Zhao, Email: zhaoshuzhen51@126.com.
Lei Hou, Email: houlei9042@qq.com.
Han Xia, Email: coldxia@126.com.
Jiangshan Wang, Email: jerryjswang@hotmail.com.
Changsheng Li, Email: shzyyxgs@126.com.
Aiqin Li, Email: liaiqin1970@163.com.
Tingting Li, Email: 1273293917@qq.com.
Xinyou Zhang, Email: haasz@sohu.com.
Xingjun Wang, Phone: 86-531-83179470, Email: xingjunw@hotmail.com.
References
- 1.Vijayasamundeeswari A, Vijayanandraj S, Paranidharan V, Samiyappan R, Velazhahan R. Integrated management of aflatoxin B. J Plant Interact. 2010;5(1):59–68. doi: 10.1080/17429140903282912. [DOI] [Google Scholar]
- 2.Zharare GE, Blamey F, Asher CJ. Initiation and Morphogenesis of Groundnut (Arachis hypogaea L.) Pods in Solution Culture. Ann Bot-London. 1998;81(3):391–396. doi: 10.1006/anbo.1997.0569. [DOI] [Google Scholar]
- 3.Thompson LK, Ziv M, Deitzer GF. Photocontrol of peanut (Arachis hypogaea L.) embryo and ovule development in vitro. Plant Physiol. 1985;78(2):370–373. doi: 10.1104/pp.78.2.370. [DOI] [PMC free article] [PubMed] [Google Scholar]
- 4.Thompson LK, Burgess CL, Skinner EN. Localization of phytochrome during peanut (Arachis hypogaea) gynophore and ovule development. Am J Bot. 1992;79:828–832. doi: 10.2307/2444950. [DOI] [Google Scholar]
- 5.Ziv M, Kahana O. The role of the peanut (Araschis hypogaea) ovular tissue in the photo-morphogenetic response of the embryo. Plant Sci. 1988;57(2):159–164. doi: 10.1016/0168-9452(88)90082-9. [DOI] [Google Scholar]
- 6.Shlamovitz N, Ziv M, Zamski E. Light, dark and growth regulator involvement in groundnut (Arachis hypogaea L.) pod development. Plant Growth Regul. 1995;16(1):37–42. doi: 10.1007/BF00040505. [DOI] [Google Scholar]
- 7.Zamski E, ZIV M. Pod formation and its geotropic orientation in the peanut, Arachis hypogaea L., in relation to light and mechanical stimulus. Ann Bot-London. 1976;40(3):631–636. [Google Scholar]
- 8.Murata MR, Zharare GE, Hammes PS. pH of the pod-zone affects reproductive growth of groundnut. J Plant Nutr. 2007;31(1):69–79. doi: 10.1080/01904160701741859. [DOI] [Google Scholar]
- 9.Chen X, Zhu W, Azam S, Li H, Zhu F, Li H, et al. Deep sequencing analysis of the transcriptomes of peanut aerial and subterranean young pods identifies candidate genes related to early embryo abortion. Plant Biotechnol J. 2013;11(1):115–127. doi: 10.1111/pbi.12018. [DOI] [PubMed] [Google Scholar]
- 10.Xia H, Zhao C, Hou L, Li A, Zhao S, Bi Y, et al. Transcriptome profiling of peanut gynophores revealed global reprogramming of gene expression during early pod development in darkness. BMC Genomics. 2013;14(1):517. doi: 10.1186/1471-2164-14-517. [DOI] [PMC free article] [PubMed] [Google Scholar]
- 11.Zhu W, Zhang E, Li H, Chen X, Zhu F, Hong Y, et al. Comparative proteomics analysis of developing peanut aerial and subterranean pods identifies pod swelling related proteins. J Proteome. 2013;91:172–187. doi: 10.1016/j.jprot.2013.07.002. [DOI] [PubMed] [Google Scholar]
- 12.Sun Y, Wang Q, Li Z, Hou L, Dai S, Liu W. Comparative Proteomics of Peanut Gynophore Development under Dark and Mechanical Stimulation. J Proteome Res. 2013;12(12):5502–5511. doi: 10.1021/pr4003504. [DOI] [PubMed] [Google Scholar]
- 13.Kanehisa M, Goto S, Kawashima S, Okuno Y, Hattori M. The KEGG resource for deciphering the genome. Nucleic Acids Res. 2004;32(suppl 1):D277–D280. doi: 10.1093/nar/gkh063. [DOI] [PMC free article] [PubMed] [Google Scholar]
- 14.Yang M, Liu Y, Liu Y, Chen H, Chen F, Shen S. Proteomic analysis of oil mobilization in seed germination and postgermination development of Jatropha curcas. J Proteome Res. 2009;8(3):1441–1451. doi: 10.1021/pr800799s. [DOI] [PubMed] [Google Scholar]
- 15.Yang P, Li X, Wang X, Chen H, Chen F, Shen S. Proteomic analysis of rice (Oryza sativa) seeds during germination. Proteomics. 2007;7(18):3358–3368. doi: 10.1002/pmic.200700207. [DOI] [PubMed] [Google Scholar]
- 16.Hossain Z, Khatoon A, Komatsu S. Soybean proteomics for unraveling abiotic stress response mechanism. J Proteome Res. 2013;12(11):4670–4684. doi: 10.1021/pr400604b. [DOI] [PubMed] [Google Scholar]
- 17.Kosová K, Vítámvás P, Prášil IT, Renaut J. Plant proteome changes under abiotic stress—contribution of proteomics studies to understanding plant stress response. J Proteome. 2011;74(8):1301–1322. doi: 10.1016/j.jprot.2011.02.006. [DOI] [PubMed] [Google Scholar]
- 18.Li X, Bai T, Li Y, Ruan X, Li H. Proteomic analysis of Fusarium oxysporum f. sp. cubense tropical race 4-inoculated response to Fusarium wilts in the banana root cells. Proteome Sci. 2013;11(1):41. doi: 10.1186/1477-5956-11-41. [DOI] [PMC free article] [PubMed] [Google Scholar]
- 19.Das S, Bosley AD, Ye X, Chan KC, Chu I, Green JE, et al. Comparison of Strong Cation Exchange and SDS-PAGE Fractionation for Analysis of Multiprotein Complexes. J Proteome Res. 2010;9(12):6696–6704. doi: 10.1021/pr100843x. [DOI] [PMC free article] [PubMed] [Google Scholar]
- 20.Collings DA, Winter H, Wyatt SE, Allen NS. Growth dynamics and cytoskeleton organization during stem maturation and gravity-induced stem bending in Zea mays L. Planta. 1998;207(2):246–258. doi: 10.1007/s004250050480. [DOI] [PubMed] [Google Scholar]
- 21.Zupanska AK, Denison FC, Ferl RJ, Paul A. Spaceflight engages heat shock protein and other molecular chaperone genes in tissue culture cells of Arabidopsis thaliana. Am J Bot. 2013;100(1):235–248. doi: 10.3732/ajb.1200343. [DOI] [PubMed] [Google Scholar]
- 22.Jiang L, Yang S, Xie L, San Puah C, Zhang X, Yang W, et al. VANGUARD1 encodes a pectin methylesterase that enhances pollen tube growth in the Arabidopsis style and transmitting tract. The Plant Cell. 2005;17(2):584–596. doi: 10.1105/tpc.104.027631. [DOI] [PMC free article] [PubMed] [Google Scholar]
- 23.McQueen-Mason SJ, Cosgrove DJ. Expansin mode of action on cell walls (analysis of wall hydrolysis, stress relaxation, and binding) Plant Physiol. 1995;107(1):87–100. doi: 10.1104/pp.107.1.87. [DOI] [PMC free article] [PubMed] [Google Scholar]
- 24.Cho H, Cosgrove DJ. Regulation of root hair initiation and expansin gene expression in Arabidopsis. Plant Cell. 2002;14(12):3237–3253. doi: 10.1105/tpc.006437. [DOI] [PMC free article] [PubMed] [Google Scholar]
- 25.Kwon SJ, Jin HC, Lee S, Nam MH, Chung JH, Kwon SI, et al. GDSL lipase‐like 1 regulates systemic resistance associated with ethylene signaling in Arabidopsis. Plant J. 2009;58(2):235–245. doi: 10.1111/j.1365-313X.2008.03772.x. [DOI] [PubMed] [Google Scholar]
- 26.Yoshida K, Kaothien P, Matsui T, Kawaoka A, Shinmyo A. Molecular biology and application of plant peroxidase genes. Appl Microbiol Biot. 2003;60(6):665–670. doi: 10.1007/s00253-002-1157-7. [DOI] [PubMed] [Google Scholar]
- 27.Olsen JV, de Godoy LM, Li G, Macek B, Mortensen P, Pesch R, et al. Parts per million mass accuracy on an Orbitrap mass spectrometer via lock mass injection into a C-trap. Mol Cell Proteomics. 2005;4(12):2010–2021. doi: 10.1074/mcp.T500030-MCP200. [DOI] [PubMed] [Google Scholar]
- 28.Conesa A, Götz S, García-Gómez JM, Terol J, Talón M, Robles M. Blast2GO: a universal tool for annotation, visualization and analysis in functional genomics research. Bioinformatics. 2005;21(18):3674–3676. doi: 10.1093/bioinformatics/bti610. [DOI] [PubMed] [Google Scholar]
- 29.Vizcaíno JA, Deutsch EW, Wang R, Csordas A, Reisinger F, Ríos D, et al. ProteomeXchange provides globally co-ordinated proteomics data submission and dissemination. Nature Biotechnol. 2014;30(3):223–6. [DOI] [PMC free article] [PubMed]
- 30.Edgar R, Domrachev M, Lash AE. Gene Expression Omnibus: NCBI gene expression and hybridization array data repository. Nucleic Acids Res. 2002;30(1):207–10. doi: 10.1093/nar/30.1.207. [DOI] [PMC free article] [PubMed] [Google Scholar]