Abstract
We provide evidence that human SLFN5, an interferon (IFN)-inducible member of the Schlafen (SLFN) family of proteins, exhibits key roles in controlling motility and invasiveness of renal cell carcinoma (RCC) cells. Our studies define the mechanism by which this occurs, demonstrating that SLFN5 negatively controls expression of the matrix metalloproteinase 1 gene (MMP-1), MMP-13, and several other genes involved in the control of malignant cell motility. Importantly, our data establish that SLFN5 expression correlates with a better overall survival in a large cohort of patients with RCC. The inverse relationship between SLFN5 expression and RCC aggressiveness raises the possibility of developing unique therapeutic approaches in the treatment of RCC, by modulating SLFN5 expression.
INTRODUCTION
Interferons (IFNs) are cytokines with important antineoplastic activities and therefore are frequently utilized in the treatment of cancer (1–4). A malignancy that exhibits sensitivity to interferon treatment is renal cell carcinoma (RCC) (5). RCC is the most common type of kidney tumor in humans and is associated with high morbidity and mortality (6, 7). In general, patients with recurrent or advanced disease have limited treatment options and a very poor overall prognosis (7). The Schlafen (SLFN) family of genes includes several members that share structural homology and play regulatory roles in the control of cell cycle progression and cell growth arrest (8–12). There are several human and mouse genes that are members of the SLFN family (9, 11). Prior evidence has implicated members of the Schlafen family in the regulation of tumorigenesis (13–18). Notably, expression of various members of this family is upregulated following treatment with type I IFNs (17–19), cytokines known to promote induction of antineoplastic, antiviral, and immunoregulatory effects (1–4). Despite the induction of human and mouse SLFN genes by IFNs, the precise mechanisms by which SLFNs mediate antineoplastic responses in different types of malignant human cells remain to be determined.
In the present study, we provide evidence that the expression of human SLFN5 is inducible by type I IFN receptor. SLFN5, like other long SLFNs, is characterized by a large C-terminal extension, a DNA/RNA helicase domain, and a nuclear localization sequence (NLS) (9, 20). Although SLFN5 is induced in melanoma cells following IFN treatment (18), the role of SLFN5 in tumor progression is largely unknown.
In efforts to define the functional implications of SLFN5 expression in malignant RCC cells, we found that SLFN5 repressed the motility and invasiveness of malignant renal cell carcinoma cells, by negatively controlling the expression of matrix metalloproteinase (MMP) genes, such as MMP-1 and MMP-13. Importantly, analysis of SLFN5 mRNA expression in a large number of samples from a cohort of RCC patients demonstrated that SLFN5 expression correlates with better overall survival of RCC patients. Altogether, our studies for the first time establish a mechanism by which a member of the SLFN family mediates antineoplastic responses in a distinct malignancy and suggest that a unique future therapeutic approach may involve identification of pharmacological agents that selectively upregulate SLFN5.
MATERIALS AND METHODS
Cell lines and reagents.
The 786-0 human RCC cell line was purchased from the American Type Culture Collection (ATCC) and was grown in RPMI 1640 supplemented with 10% fetal bovine serum (FBS), sodium pyruvate, and antibiotics. The ACHN human RCC cell line was also purchased from ATCC and grown in minimum essential medium (MEM), supplemented with 10% FBS, antibiotics, sodium pyruvate, nonessential amino acids, l-glutamine, and sodium bicarbonate. Renal proximal tubule epithelial cells (RPTEC) were purchased from Lonza and maintained in the Clonetics REGM Bullet kit containing the following growth supplements: human epidermal growth factor (hEGF), hydrocortisone, epinephrine, insulin, triiodothyronine, transferrin, GA-1000, and FBS.
Generation of lentiviral SLFN5-Myc-Flag tag construct.
The third-generation lentivirus-based tetracycline-inducible transgene expression system was purchased from Clontech Laboratories. The Myc-Flag-tagged coding sequence of human SLFN5 was purchased from OriGene. Full-length coding sequences of SLFN5 and Myc-Flag tags were subcloned into the pLVx-Tet-One-Puro vector, downstream of the TRE3GS promoter, in between BamHI and BstZ17I restriction enzyme recognition sites. The resultant construct was confirmed by diagnostic restriction enzyme digestion and conventional PCR using primers that amplify SLFN5 coding sequence and then introduced into the Stbl3 chemically competent Escherichia coli strain (Life Technologies) by chemically based transformation. The resultant lentiviral vector is pLVX/tetONE-puro-SLFN5-Myc-Flag-tag. The pLVX/tetONE-puro-luciferase vector was used as a negative control.
Establishment of stable cell line expressing doxycycline-inducible SLFN5-Myc-Flag tag.
786-0 cells were transduced by lentiviruses pLVX/tetONE-puro-SLFN5-Myc-Flag-tag and pLVX/tetONE-puro-luciferase (negative control). Transduced 786-0 cells were then grown in 2 μg/ml puromycin and split 1:5 once cell density reached 80 to 90% confluence. Cells were grown over 2 successive passages with the selection medium. Clones that survived were selected and expanded. Overexpression of SLFN5 protein was confirmed after 72 h of doxycycline treatment (0.25 μg/ml) by immunoblotting using an SLFN5 antibody (Sigma-Aldrich).
Cell lysis and immunoblotting.
Cells were lysed in phosphorylation lysis buffer (PLB), as previously described (21, 22). An antibody against SLFN5 was purchased from Sigma-Aldrich. An antibody against glyceraldehyde-3-phosphate dehydrogenase (GAPDH) was obtained from Millipore, and anti-α-tubulin antibody was obtained from Santa Cruz Biotechnology. Immunoprecipitations and immunoblotting using an enhanced chemiluminescence method were performed as in previous studies (23, 24).
RNA interference (RNAi) knockdown of SLFN5.
Transient knockdown of SLFN5, MMP-1, and MMP-13 was performed using a pool of three target-specific small interfering RNAs (siRNAs) as well as nontargeting control pool siRNA, purchased from Santa Cruz Biotechnology, using Lipofectamine RNAiMAX (Invitrogen) per the manufacturer's instructions. After transfection, cells were kept in culture for 48 h and then either harvested for PCR or immunoblotting analysis or plated for further experiments. The generation of stable SLFN5 knockdown cells was performed using third-generation lentiviral particles that contained a pool of three target-specific constructs that encode short hairpin RNA (shRNA) and green fluorescent protein (GFP) (Santa Cruz Biotechnology). The lentiviral particles were delivered to the cells per the manufacturer's instructions. GFP-positive cell lines were sorted by flow cytometry.
Secreted MMP immunoblotting.
786-0 cells were transfected with control siRNA or siRNA specifically targeting SLFN5. After 24 h of serum starvation, the conditioned media were collected and concentrated 10 times using a Centriprep Ultracel YM-10 concentrator (Millipore). Equal amounts of proteins from the concentrated medium were subjected to SDS-PAGE electrophoresis. Immunoblotting using the enhanced chemiluminescence (ECL) method was performed as in our previous studies (23, 24). Anti-MMP-1 and anti-MMP-13 antibodies were obtained from Millipore. Anti-MMP-2 and anti-MMP-9 antibodies were purchased from Cell Signaling.
Quantitative reverse transcription-PCR (RT-PCR).
RNA was isolated using the RNeasy kit from Qiagen. Total cellular RNA was reverse transcribed into cDNA with oligo(dT) primers (Invitrogen) using the Omniscript reverse transcription kit from Qiagen. PCR was performed on an Applied Biosystems 7500 real-time PCR system using TaqMan Gene Expression master mix according to the manufacturer's instructions and the following TaqMan primers: SLFN5, SLFN11, SLFN12, and SLFN13 genes and MMP-1, MMP-2, MMP-3, MMP-9, MMP-13, MMP-14, and MMP-15 (Applied Biosystems). Data were analyzed for expression relative to GAPDH using the comparative threshold cycle (CT) method (25). Relative quantitation of mRNA levels was plotted as the fold change compared with untreated samples.
RNA-seq analysis.
Quality and quantity of total RNA were determined using the Agilent 2100 Bioanalyzer and a NanoDrop spectrophotometer. One microgram of total RNA was used to prepare the transcriptome sequencing (RNA-seq) library [poly(A) selection based] using Illumina TruSeq technology (Illumina, San Diego, CA). The generated libraries were sequenced on an Illumina Hi-Seq 2000 sequencer (100-bp-long single-end reads). The sequences were aligned with the human genome (hg19; UCSC genome browser). Alignment with the human reference genome 19 was performed using the Genomic Short-read Nucleotide Alignment Program (GSNAP) (26). GSNAP detects novel splice events and known splice junctions based on ENSEMBL GTF annotations for the reference genome. Assignment of reads to genes was performed by htseq-count (http://www-huber.embl.de/users/anders/HTSeq/doc/count.html), a component of the HTSeq Python library (http://www-huber.embl.de/users/anders/HTSeq/doc/overview.html). Assignments were made using known transcripts in the organism's ENSEMBL GTF annotation file using the union strategy, and alignments with a quality score lower than 20 were excluded. Differential expression analysis between tumor and normal samples was performed by edgeR, a bioconductor package specifically for the analysis of replicated count-based expression data (27). Gene counts were normalized by the trimmed mean of M component method. Gene expression was corrected using a moderated binomial dispersion correction, and then an exact test was used to assess differential expression. The resultant P values were adjusted for false discovery rate (FDR) by using Benjamini and Hochberg's approach, and only adjusted P values of <0.05 were considered statistically significant.
TCGA data analysis.
Data for RNA-seq for RCC samples were obtained from The Cancer Genome Atlas (TCGA) Data Portal. These included 470 RCC samples and 68 nontumor kidney controls. Kaplan-Meier curves were used for survival analysis as in previous studies (28).
3D collagen contraction assay.
Contraction in three-dimensional (3D) collagen was analyzed as described previously (18, 29). Briefly, 1 × 10⁵ stable transfected cells were suspended in 2.2% (wt/vol) collagen type 1, purchased from BD Biosciences, and allowed to form a cylinder-shaped plug. The plug was then inserted in an additional layer of collagen to allow formation of a core with a clean border between cells and the surrounding collagen. Wells were overlaid with medium and supplemented with the MMP inhibitor GM6001 (Millipore) in the indicated experiments, and collagen contraction was detected after 4 days. Gel contraction was recorded by scanning the plate, and the surface area of the inner gel plug was quantified using ImageJ. The relative changes in the surface area were recorded as the percentage of the original surface area.
Cell proliferation/viability assays.
For WST-1 assays, cells were plated in 96-well plates and viable cells were quantified using WST-1 reagent (Roche) according to the manufacturer's protocol. For cell-counting assays, cells were trypsinized, centrifuged, and resuspended in culture medium, and then cells were counted with a Scepter 2.0 cell counter equipped with a 60-μm sensor tip (Millipore). Cell counts and cell size distributions were analyzed with the Scepter 2.0 Software Pro computer software. To determine cell viability, cells were plated at a density of 2.5 × 10⁵ cells/plate in 150-mm culture plates and cultured for 3 to 4 days. After trypsinization, centrifugation, and resuspension in culture medium, viable cells were counted using the trypan blue dye exclusion test.
Immunofluorescence.
Cells grown on glass coverslips were quickly washed with phosphate-buffered saline (PBS) three times, fixed in 3.7% formaldehyde in PBS for 5 min at room temperature, and then permeabilized with 0.2% Triton X-100 in PBS for 5 min. After three washes with PBS, fixed cells were blocked with 1% normal goat serum in PBS containing 1% bovine serum albumin (BSA) and incubated at 37°C for 15 min. Primary and secondary antibody incubations were performed at 37°C for 30 min interspaced with three washes with PBS, the first of which contained 0.05% Tween 20. Coverslips were mounted with antifade mounting medium (p-phenylenediamine in 80% glycerol, 50 mM Trizma base, pH 8.5). Stained cells were imaged using a laser scanning confocal microscope, Nikon A1R, using 40× (numerical aperture [NA], 1.3) or 60× (NA, 1.4) Plan Apo VC oil objectives. The four lasers used to image are 405, 488, 561, and 640. The actin cytoskeleton/focal adhesion staining kit (FAK100) from Millipore was used for focal adhesion staining. For confocal fluorescence microscopy detecting only F-actin, Alexa Fluor 568-labeled phalloidin (Invitrogen) was used.
Live-cell imaging.
To perform live-cell imaging, 1.5 × 10⁴ cells were plated in glass-bottom microwell dishes (MatTek Corporation) and transfected with control (Ctrl) siRNA and SLFN5 siRNA. At 48 h after transfection, live-cell imaging to track migratory behavior was performed on a Nikon Biostation IM-Q Cell-S2 incubator wide-field microscope (Nikon Instruments). The cells were incubated at 37°C with 5% CO2 throughout the duration of image acquisition. Images were taken at 10-min intervals for 8 or 12 h using a 40× lens (NA, 0.8). Subsequently, cells were stained with CellTracer carboxyfluorescein succinimidyl ester (CFSE) green from Invitrogen, according to the manufacturer's protocol. Migratory events were analyzed by simple image segmentation using the intensity threshold in Nikon Elements software. A migratory event is defined by a cell track that can be continuously traced within the field of view. If a cell crawls out of the field of view, the track is terminated. If a cell moves into the field, a new track is established.
Migration and invasion assays.
Migratory activity was analyzed using a BD BioCoat control 8.0-μm polyethylene terephthalate (PET) membrane (30). After 48 h from transient transfection, 1 × 10⁵ cells were added in 500 μl of serum-free medium to 24-well cell culture upper chamber inserts. Cells were left to migrate for 3 h toward 750 μl of medium containing serum, present in the lower chamber. Invasive activity was analyzed using Corning BioCoat growth factor-reduced (GFR) Matrigel invasion chambers. At 48 h after transient transfection, 1 × 10⁵ cells were added in 500 μl of serum-free medium to 24-well cell culture upper chamber inserts. Cells were left to migrate for 6 h toward 750 μl of medium containing serum, present in the lower chamber. Cells that did not migrate or invade through the pores were removed from the upper chamber by a cotton swab. Migrating and invading cells adhering to the bottom of the membranes were fixed and stained using 0.5% crystal violet in 20% methanol solution. The membranes were then photographed, and the numbers of migrating and invading cells were manually counted using ImageJ software.
Microarray data accession number.
The RNA-seq data sets are available for download on the GEO database under accession number GSE64399.
RESULTS
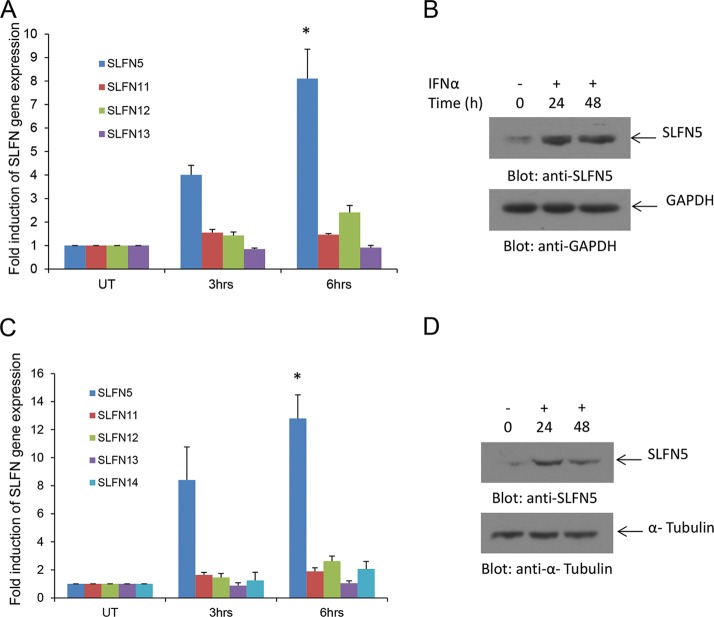
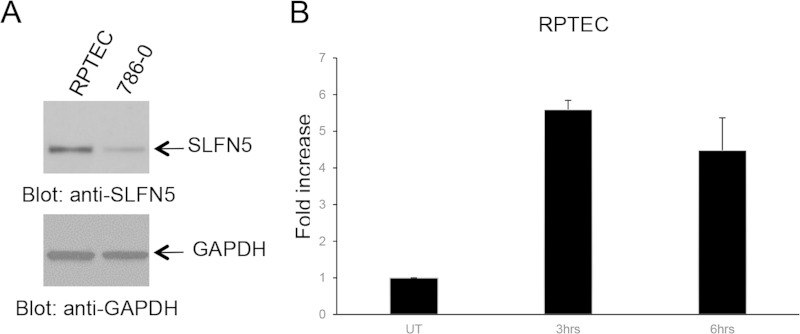
In initial studies, we examined the induction of mRNA expression of different human SLFN genes in human RCC cells in response to treatment with type I IFNs. Alpha IFN (IFN-α) treatment resulted in strong expression of SLFN5 mRNA and protein in 786-0 cells (Fig. 1A and B). The expression of other human SLFN genes was minimally inducible or not inducible at all (Fig. 1A). Similar results were obtained when the ACHN RCC line was used (Fig. 1C and D), raising the possibility that the antitumor effects of type I IFNs in renal cell carcinoma are mediated by SLFN5 protein expression. SLFN5 was also expressed in normal renal proximal tubule epithelial cells (RPTEC) (Fig. 2A), and IFN treatment also upregulated SLFN5 mRNA expression in these normal cells (Fig. 2B).
FIG 1.
IFN-α-induced expression of SLFN genes in human renal cell carcinoma cells. (A) 786-0 cells were treated with IFN-α for the indicated time. Total mRNA was isolated, and expression of SLFN5, SLFN11, SLFN12, and SLFN13 was measured by real-time RT-PCR, using GAPDH as a housekeeping gene. Data are expressed as the fold increase over control untreated samples and represent means ± standard errors of results from four independent experiments. Paired two-tailed t test analysis showed a two-tailed P value of 0.0108 for SLFN5 at 6 h compared to control. (B) 786-0 cells were treated with IFN-α as indicated, and after cell lysis, total proteins were resolved by SDS-PAGE and immunoblotted with an anti-SLFN5 antibody or an anti-GAPDH antibody. (C) ACHN cells were treated with IFN-α for the indicated times. Total RNA was isolated, and expression of SLFN5, SLFN11, SLFN12, SLFN13, and SLFN14 was measured by real-time RT-PCR using GAPDH as a housekeeping gene. Data are expressed as the fold increase over control of untreated samples and represent means ± standard errors of results from three independent experiments. Paired two-tailed t test analysis showed a two-tailed P value of 0.0188 for SLFN5 at 6 h compared to control. (D) ACHN cells were treated with IFN-α as indicated, and after cell lysis, proteins were resolved by SDS-PAGE and immunoblotted with an anti-SLFN5 antibody or an anti-α tubulin antibody.
FIG 2.
Expression of SLFN5 in normal human renal proximal tubule epithelial cells (RPTEC). (A) RPTEC and 786-0 cells were lysed, and proteins were resolved by SDS-PAGE and immunoblotted with antibodies against SLFN5 or GAPDH, as indicated. (B) RPTEC were treated with IFN-β for the indicated time. Total mRNA was isolated, and expression of SLFN5 was measured by real-time RT-PCR, using GAPDH as a housekeeping gene. Data are expressed as the fold increase over control untreated (UT) samples and represent means ± standard errors of results from two independent experiments.
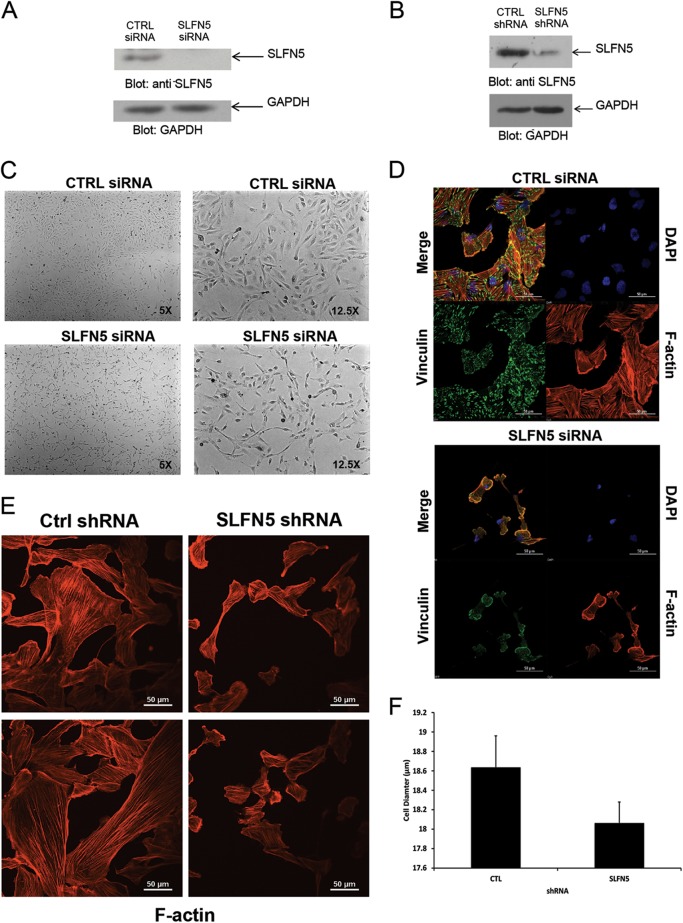
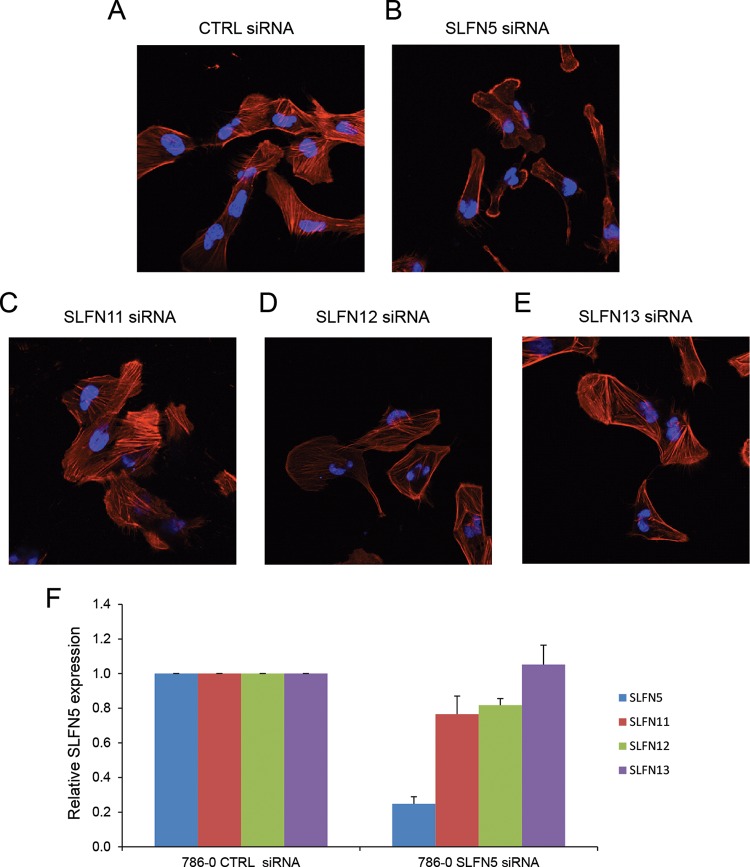
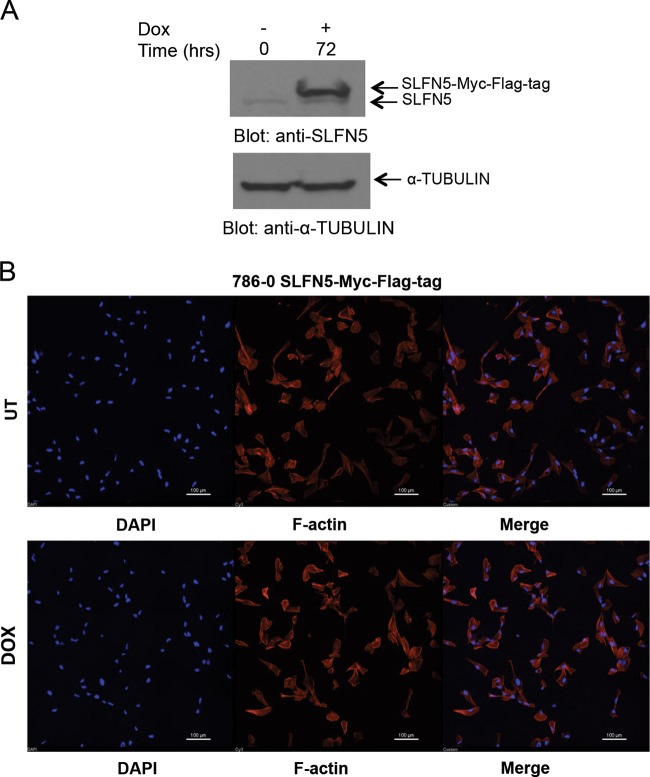
To examine the functional relevance of SLFN5 expression in RCC cells, SLFN5 protein levels were transiently knocked down by SLFN5-specific siRNA or stably downregulated by shRNA-mediated targeting (Fig. 3A and B). Transfection with SLFN5 siRNA resulted in a dramatic morphological change in 786-0 cells (Fig. 3C). As expected, control cells exhibited an epithelial cell-like phenotype (Fig. 3C, top panels), but cells in which SLFN5 was knocked down exhibited a more spindle-shaped morphology (Fig. 3C, bottom panels). To better define the morphological changes, cells were stained with antibodies against F-actin or against vinculin, a key component of the focal adhesion complex. There was a robust decrease in the focal adhesion assembly, with loss of stress fibers, and a reduction in cell size following transient knockdown of SLFN5 (Fig. 3D). Similarly, stable knockdown of SLFN5 resulted in loss of stress fibers and reduction in cell size (Fig. 3E and F). In contrast, knockdown of SLFN11, SLFN12, or SLFN13 did not result in any significant change (Fig. 4). Importantly, there was no significant change in cell viability or proliferation observed when SLFN5 was knocked down (Fig. 5). In other studies, when SLFN5 was exogenously overexpressed, there were no significant effects on cell morphology (Fig. 6), suggesting that endogenous baseline levels are important for regulation of cell morphology.
FIG 3.
Effects of SLFN5 knockdown on RCC morphology. (A) 786-0 cells were transiently transfected with control siRNA or SLFN5 siRNA, and after cell lysis, total lysates were resolved by SDS-PAGE and immunoblotted with an anti-SLFN5 antibody or an anti-GAPDH antibody, as indicated. (B) 786-0 cells stably expressing control shRNA-GFP+ or SLFN5 shRNA-GFP+ were lysed, and total cell lysates were resolved by SDS-PAGE and immunoblotted with anti-SLFN5 or anti-GAPDH antibodies, as indicated. (C) 786-0 cells were transiently transfected with control (CTRL) siRNA or SLFN5 siRNA. Forty-eight hours later, cells were imaged by phase-contrast microscopy at low (left panels) and high (right panels) magnifications. (D) 786-0 cells seeded onto glass coverslips were transiently transfected with control siRNA or SLFN5 siRNA with Lipofectamine RNAiMAX; at 48 h after transfection, the cells were fixed, permeabilized, and stained. Confocal fluorescence microscopy of focal adhesion and actin cytoskeleton was performed with triple labeling, using tetramethyl rhodamine-isothiocyanate (TRITC)-conjugated phalloidin (lower right panels), antivinculin monoclonal antibody (lower left panels), and 4′,6-diamidino-2-phenylindole (DAPI) (upper right panels). Overlay of fluorescent signals is shown in upper left panels. Images are representative areas of the entire coverslip analyzed. Bars, 50 μm. (E) 786-0 cells stably expressing control shRNA-GFP or SLFN5 shRNA-GFP were seeded for 24 h onto glass coverslips. Cells were then fixed, permeabilized, and stained with Alexa Fluor 568-labeled phalloidin to detect cytoskeletal F-actin by confocal fluorescence microscopy. Representative areas showing the F-actin structure are shown. (F) Diameter distributions of 786-0 control shRNA-GFP+ and SLFN5 shRNA-GFP+ cells were measured using the Scepter 2.0 cell counter. Differences in cell diameter are plotted on a bar graph and represent means ± standard errors from three independent counts.
FIG 4.
Knockdown of SLFN11, SLFN12, or SLFN13 does not result in loss of stress fibers and reduction in cell size. (A to E) 786-0 cells seeded for 24 h onto glass coverslips were transiently transfected with control siRNA (A), SLFN5 siRNA (B), SLFN11 siRNA (C), SLFN12 siRNA (D), or SLFN13 siRNA (E) using Lipofectamine RNAiMAX; at 48 h after transfection, the cells were fixed, permeabilized and incubated with 4′,6-diamidino-2-phenylindole and Alexa Fluor 568-labeled phalloidin. Overlays of representative fluorescence signals are shown. (F) 786-0 cells were transiently transfected, respectively, with SLFN5, SLFN11, SLFN12, or SLFN13 siRNA or control siRNA, and mRNA expression for different SLFNs was measured by real-time RT-PCR, using a GAPDH primer as a control. Data are expressed as the fold change over controls and represent means ± standard errors of results from three independent experiments.
FIG 5.
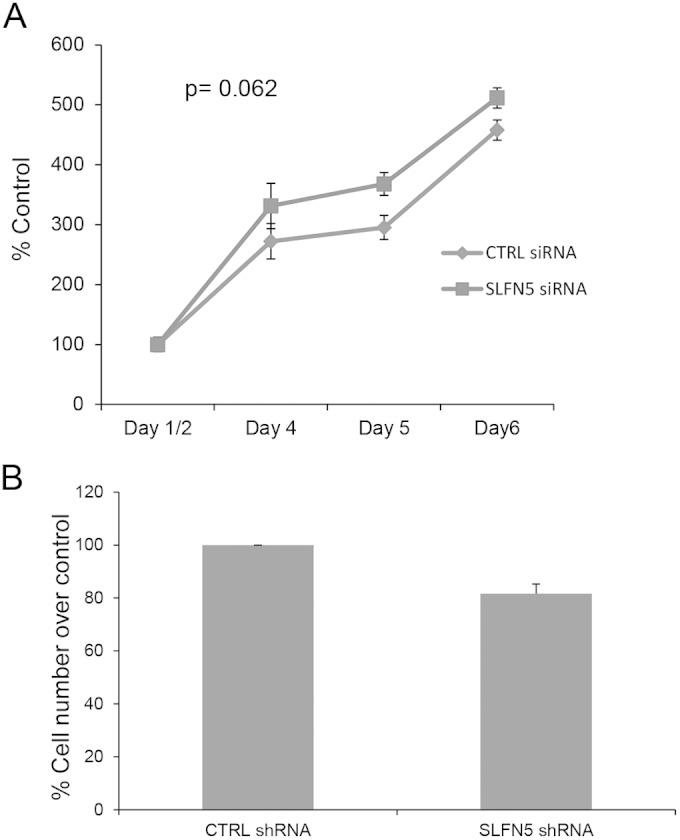
SLFN5 knockdown does not affect cell proliferation. (A) Equal numbers of 786-0 control siRNA- and SLFN5 siRNA-transfected cells were cultured for the indicated times. After 1, 2, 4, 5, and 6 days of incubation, cell proliferation was assessed by WST assays. Data are expressed as means ± standard errors of results from three independent experiments. (B) Control shRNA-GFP+ and SLFN5 shRNA-GFP+ 786-0 cells were seeded in culture dishes and harvested after 3 or 4 days. Cell counts were obtained using the trypan blue dye exclusion test. Data are expressed as means ± standard errors of results from three independent experiments.
FIG 6.
Effect of SLFN5 overexpression on cell morphology. (A) 786-0 pLVX/tetONE-puro-SLFN5-Myc-Flag tag-transduced cells were treated with doxycycline (Dox) as indicated, and after cell lysis, proteins were resolved by SDS-PAGE and immunoblotted with an anti-SLFN5 antibody and an antitubulin antibody. (B) The same cells as used in panel A were treated with doxycycline for 72 h and then seeded onto 0.2% gelatin-coated glass coverslips. Cells were then fixed, permeabilized, and stained with Alexa Fluor 568-labeled phalloidin and 4′,6-diamidino-2-phenylindole (DAPI) to detect cytoskeletal F-actin and nuclei by confocal fluorescence microscopy. Representative areas showing the F-actin structure and nuclei are shown. Bars, 100 μm. UT, untreated.
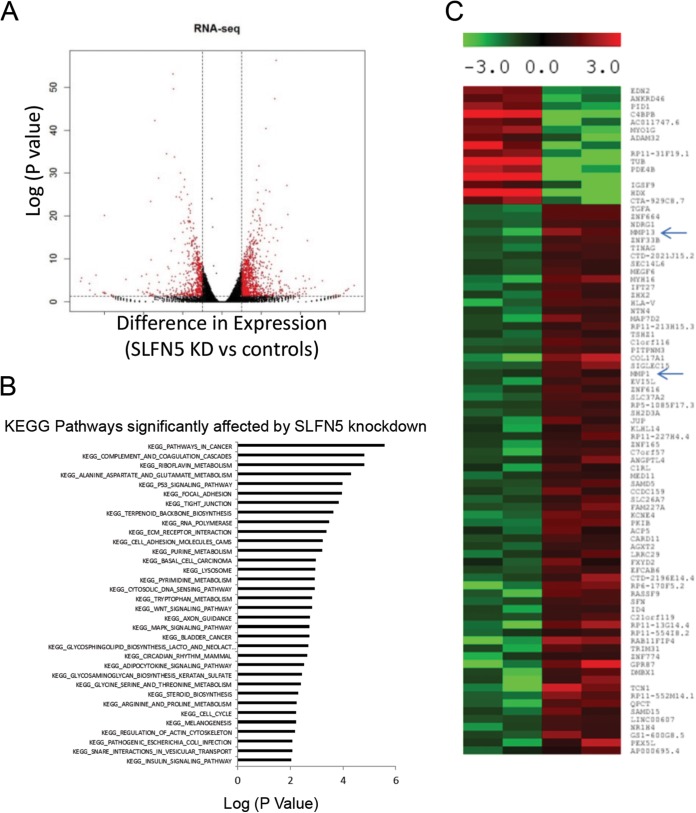
Since these findings suggest that SLFN5 controls pathways involved in cytoskeletal rearrangement, we performed RNA-seq analysis to examine the global effects of SLFN5 knockdown on cellular pathways and to identify putative effector elements. RNA-seq analysis showed that 956 genes were upregulated and 570 genes were downregulated following SLFN5 knockdown (Fig. 7A). We determined that cancer-related pathways were the highest-ranked pathways affected by SLFN5 knockdown (Fig. 7B). Additionally, pathways involved in focal adhesion and cell junctions were also regulated by SLFN5 (Fig. 7B). Overall, elements of pathways involved in the regulation of cell morphology were found to be the most affected in another independent pathway analysis (Table 1). Significantly, the matrix metalloproteinase 1 gene (MMP-1) and MMP-13 were among the top dysregulated genes by SLFN5 knockdown in the RNA-seq data (Fig. 7C).
FIG 7.
RNA-seq analysis of SLFN5 knockdown (KD). (A) Differential gene expression in 786-0 cells in which SLFN5 was knocked down compared to controls, based on RNA-seq analysis. Genes labeled in red are significantly differentially expressed (>log2 difference with a P value of <0.05). (B) KEGG pathway analysis of differentially expressed genes is shown. (C) Heat map of top differentially expressed genes is shown. MMP-1 and MMP-13 are indicated by arrows.
TABLE 1.
Top functional pathways altered by SLFN5 knockdown
| Pathway no. | Top diseases and functions | Molecules in network |
|---|---|---|
| 1 | Cell morphology, cellular assembly and organization, cellular function and maintenance | ACTBL2, ALKBH8, ATG16L2, ATR, BBS10, CCDC9, CCT2, CCT8, CEP164, CNN3, DAW1, DNAJC12, DNAJC27, DR1, DYRK2, FBXO25, HSPA9, ING3, KRT2, LRRFIP2, MAGOH, MPP3, MYO18A, NCL, NDRG1, NOLC1, PAN2, RPS2, SERBP1, SMN1/SMN2, TPM4, TTC8 |
| 2 | Cell morphology, infectious disease, hereditary disorder | ALOX5AP, ANKRD1, ANO3, ARHGAP28, ARRDC3, AZI1, BMPER, CBR3, CLEC11A, DMD, EPCAM, FBXO32, IL12A, KDM2A, MIB1, MYPN, NEBL, PAK1IP1, PNMA1, SENP2, SERPINB7, SNTB1, SNTB2, TNFRSF19, TNIP3, TNNT1, UHMK1, UNC5CL, VOPP1, WWP2, ZNF385A |
| 3 | Dermatological diseases and conditions, tissue morphology, cancer | ARHGAP21, C1orf106, CALB2, CCNA1, CDC42BPG, CREB3L1, CREB3L4, CTNNBIP1, ECM1, GANAB, GOLGA2, GORASP2, HABP2, HOXD3, JUP, KLHDC9, LTBP1, P24, PACS2, PCDHB14, PERP, QPCT, SCEL, SERPINA1, SERPINE1, SFN, SMARCE1, TGFA, TMEFF1, WDYHV1 |
| 4 | Developmental disorder, hematological disease, hereditary disorder | ACAP1, ADAMTSL4, C17orf103, CARD11, CATSPER1, CFI, CNTN1, CUBN, DDIT4, FKHR, GDF15, GNE, NTN4, PBXIP1, PID1, PPP2R1B, PRODH, PSAT1, PTPRB, RRP1B, SEMA6A, SH2B1, SIKE1, SORBS2, SPRR3, SULF2, SYNM, TINAG, TRIB3, UCN2 |
| 5 | Carbohydrate metabolism, cardiovascular disease, cellular development | ADAMTS1, ATP9A, BRIX1, CDK14, CDK16, Cg, CGB7, CREBL2, DDX21, DHRS3, ECE1, FRAT1, FRAT2, FSH, GATA6, GPIIB-IIIA, GRN, GSTZ1, HEXIM1, LYAR, MAF, MARCH3, NES, PHLDA1, POLR3G, RGS5, SACS, SLC16A6, STEAP1, TNPO1, UAP1 |
| 6 | Cellular assembly and organization, behavior, nervous system development and function | ANP32E, BCAS3, BRINP1, CLOCK, ING4, KIAA0020, MTUS1, NIP7, NPIPA1 (includes others), NR1D1, OPHN1, ORAI3, PAGR1, PATZ1, PER1, PNO1, PPARA, PPARGC1B, RFX3, SLFN5, SOX2, STK33, ZDHHC11, ZKSCAN1, ZNF76, ZNF33A |
| 7 | Connective tissue disorders, dermatological diseases and conditions, hereditary disorder | ANK2, COL12A1, COL17A1, COL4A1, COL6A1, COL6A2, COL6A3, COL6A5, CTGF, DOCK4, F11R, FBN1, FUT4, IL17RD, MMP13, PCOLCE2, RAB26, RABL6, RRBP1, RYR3, SEC23A, TGFB2, THBS1, TRPM2 |
| 8 | Cellular assembly and organization, nervous system development and function, cellular function and maintenance | AMPH, ATP8A2, DENR, DNM3, DUSP7, FXYD2, GBA, HTRA1, NGEF, PODXL, PP1/PP2A, PPP1CB, PPP1R14B, PPP1R16A, PPP1R9B, RABGEF1, SH2D4A, SIK1, SNAP25, SPTBN2, STX3, STX11, STX12, TNC, UNC13B |
| 9 | Lipid metabolism, molecular transport, small-molecule biochemistry | ABCC3, ACTR1B, AFP, CD163L1, CENPF, CORO2B, CP, CXADR, GLS, HPGD, interleukin-6 (IL-6), LONP1, MBL2, MIA2, MOK, MYO1D, PPL, RRP15, SPINT1, TBC1D9, TSC22D1, VEPH1, ZW10 |
| 10 | Hematological disease, metabolic disease, lipid metabolism | AKR1C3, ANGPTL4, B4GALT1, CCNG2, CYP27B1, ERLIN1, ERLIN2, ESRRG, FASN, FOXO4, GADD45A, GADD45B, GBP2, NFE2L1, NFKBIB, NR1H4, PNRC1, POLR3F, PPARGC1A, RNF139, RXRB, T3-TR-RXR, TK2, TSPAN1, ZNRD1 |
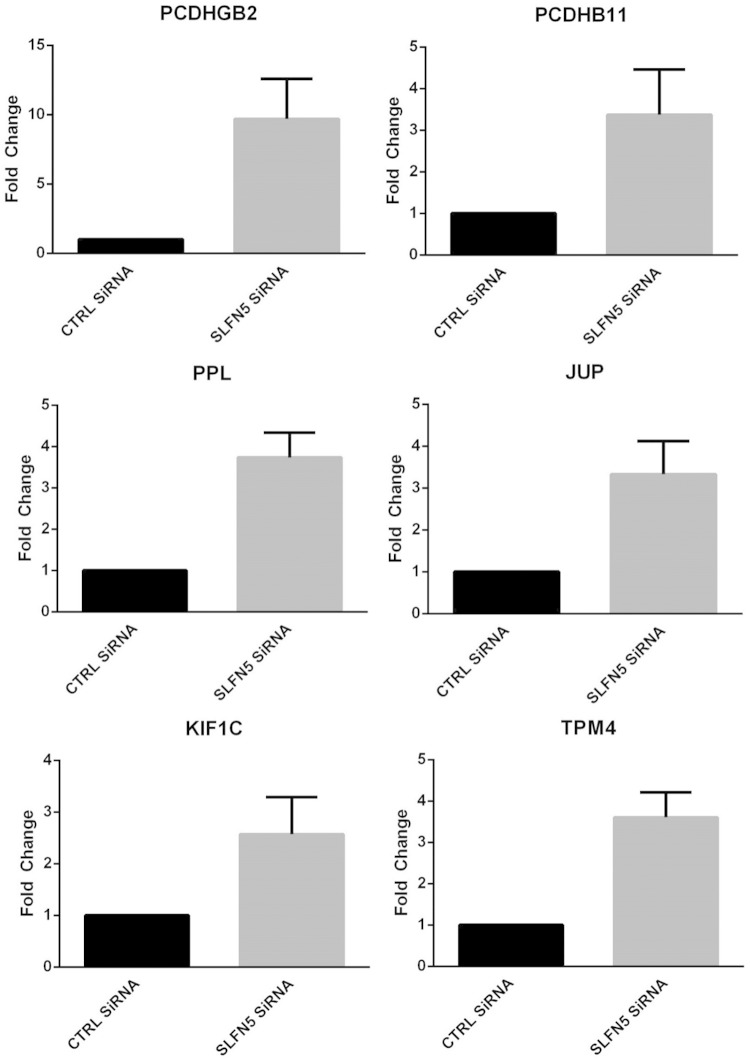
To validate the RNA-seq data demonstrating that MMP-1 and MMP-13 are increased by SLFN5 knockdown, 786-0 cells were transiently transfected with Ctrl siRNA or SLFN5 siRNA and mRNA expression for MMP-1, MMP-2, MMP-3, MMP-9, MMP-13, MMP-14, and MMP-15 was assessed by reverse transcription-PCR (RT-PCR) (Fig. 8A). MMP-1 and MMP-13 were robustly upregulated by SLFN5 transient knockdown (Fig. 8A), while there were no significant changes in the other MMPs examined (Fig. 8A). In addition, SLFN5 knockdown increased the protein levels of both MMP-1 and MMP-13 in the conditioned medium without affecting the expression of MMP-2 and MMP-9 (Fig. 8B). We also confirmed the effects of SLFN5 on several other genes involved in cell adhesion, cytoskeletal organization, and motility, including PCDHGB2, PCDHB11, PPL, JUP, KIF1C, and TPM4 (Fig. 9).
FIG 8.
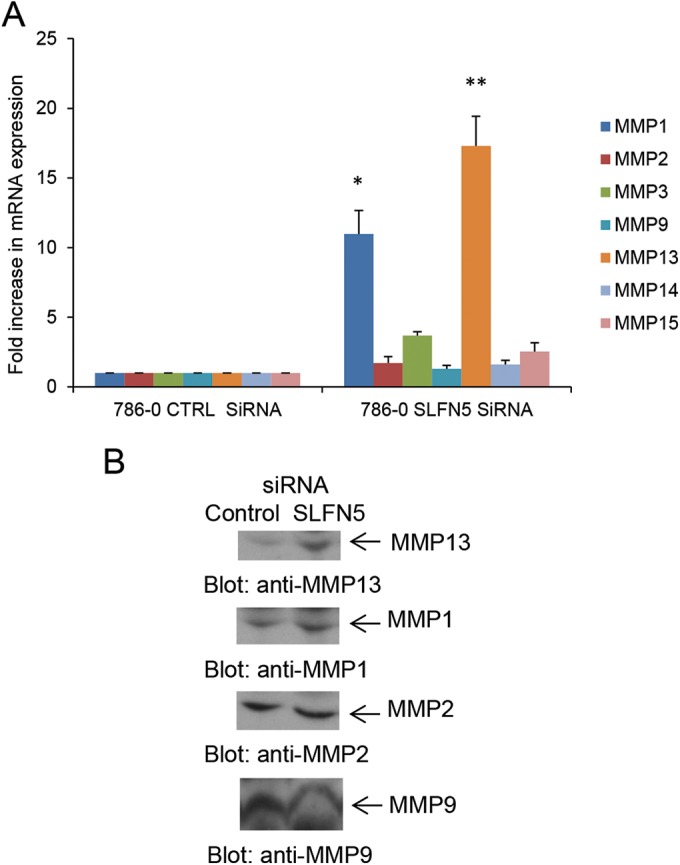
SLFN5 knockdown increases expression and secretion of MMP-1 and MMP-13. (A) 786-0 cells were transiently transfected with control siRNA or SLFN5 siRNA, and gene expression for MMP-1, MMP-2, MMP-3, MMP-9, MMP-13, MMP-14, and MMP-15 was analyzed 48 h after transfection by real-time RT-PCR using specific primers and GAPDH as an internal control. Data are expressed as the fold increase over the respective control and represent means ± standard errors of results from three experiments. Paired two-tailed t test analysis showed a two-tailed P value of 0.0363 for MMP-1 versus the respective control (*) and a P value of 0.0219 for MMP-13 versus the respective control (**). (B) 786-0 cells were transiently transfected with control siRNA or SLFN5 siRNA, and at 48 h after transfection, cells were resuspended in serum-free medium and cultured for an additional 24 h. The conditioned media were collected and concentrated, and equal amounts of proteins were resolved in parallel by SDS-PAGE and immunoblotted with antibodies against MMP-1 and MMP-13. The MMP-1 blot was also probed with anti-MMP-9 and anti-MMP-2 antibodies.
FIG 9.
Expression of genes associated with cell adhesion, cytoskeleton organization, and cell motility. 786-0 cells were transiently transfected with SLFN5 siRNA or control siRNA, and expression of PCDHGB2, PCDHB11, PPL, JUP, KIF1C, and TPM4 was measured by real-time RT-PCR, using a GAPDH primer as a control. Data are expressed as the fold change over control cells and represent means ± standard errors of results from two independent experiments for TPM4 and three independent experiments for all other genes.
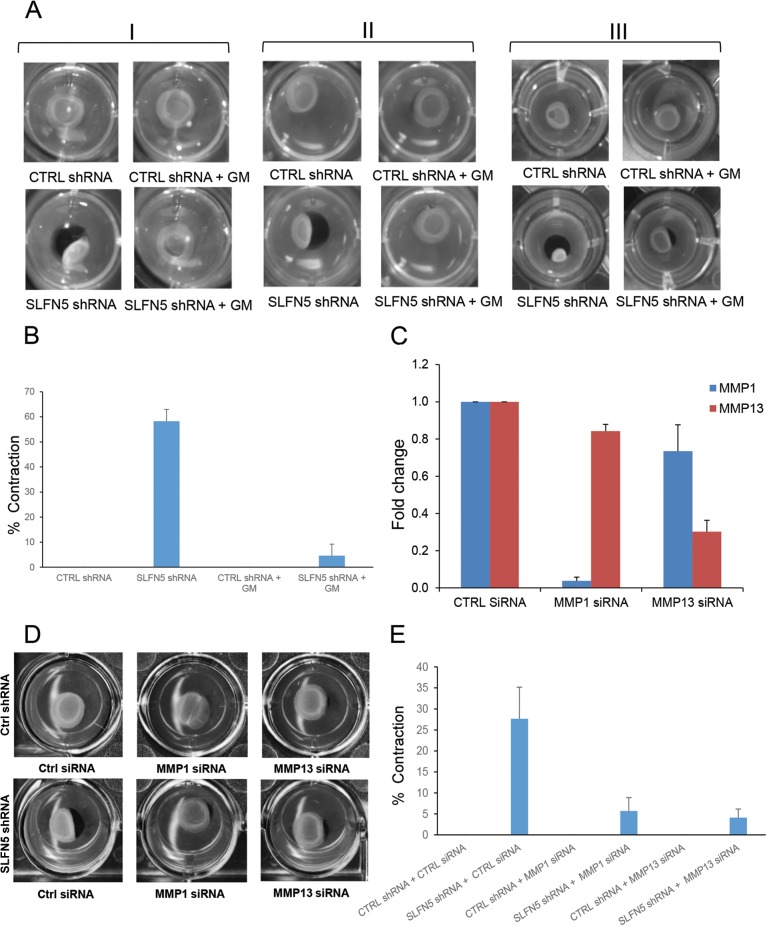
Since SLFN5 knockdown causes pronounced cytoskeletal changes, we examined the extent to which SLFN5 knockdown modifies the extracellular matrix (ECM) using the collagen contraction assay. SLFN5 knockdown resulted in a dramatic increase of collagen contraction that was blocked by adding the MMP inhibitor GM6001 (Fig. 10A and B). As GM6001 is a broad-spectrum MMP inhibitor, we used specific siRNAs to selectively target MMP-1 or MMP-13 and determine whether this modulates the effects of SLFN5 knockdown. Knockdown of either MMP-1 or MMP-13 reversed the effects of SLFN5 knockdown (Fig. 10C to E), indicating that the functions of both of these MMPs are required for the increased contractility seen when SLFN5 is targeted.
FIG 10.
Effects of SLFN5 knockdown on collagen contraction. (A) Control shRNA-GFP+ (upper panels) and SLFN5 shRNA-GFP+ (lower panels) cells (1 × 10⁵) were plated in a 3D collagen contraction assay. The GM6001 (GM) inhibitor was added to the medium at a 10 μM final concentration, as indicated (right panels). Collagen contraction was assessed after 4 days of culture. The figure shows three independent experiments (I, II, and III). (B) The surface area of the inner gel plugs from panel A was quantified using ImageJ. The relative changes in the surface area were recorded as the percentage of the original surface area. Shown here is the percentage of collagen contraction ± standard errors of results from three independent experiments. (C) 786-0 control shRNA-GFP+ cells were transiently transfected with control siRNA, MMP-1 siRNA, or MMP-13 siRNA. At 48 h after transfection, gene expression of MMP-1 and MMP-13 was analyzed by real-time RT-PCR using specific primers and GAPDH as an internal control. Data are expressed as fold changes over the control and represent the mean ± standard error of results from three experiments. (D) Control shRNA-GFP+ (upper panels) and SLFN5 shRNA-GFP+ (lower panels) cells were transiently transfected with control siRNA, MMP-1 siRNA, or MMP-13 siRNA. At 48 h after transfection, the cells were plated in a 3D collagen contraction assay. Collagen contraction was assessed after 4 days of culture. The figure is representative of three independent experiments. (E) The surface area of the inner gel plugs from panel D was quantified using ImageJ. The relative changes in the surface area were recorded as the percentage of the original surface area. Shown here is the percentage of collagen contraction ± the standard error of results from three independent experiments.
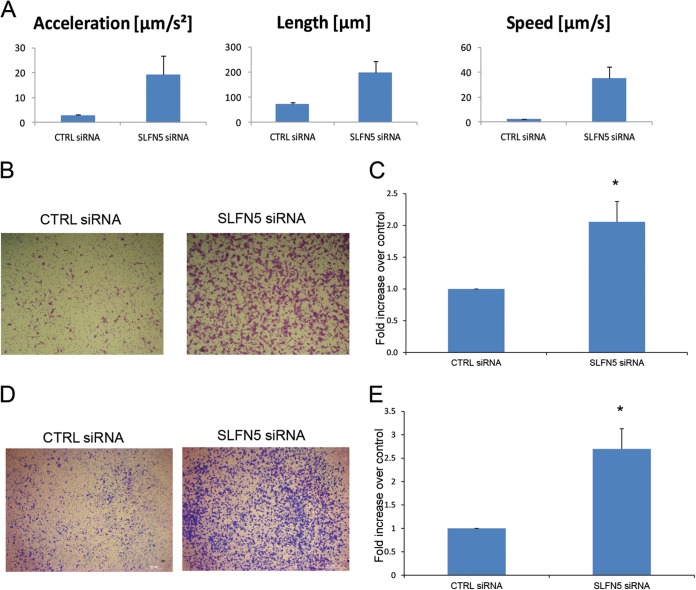
Since MMPs also mediate cell migration and invasion, we next examined the effects of SLFN5 knockdown on cell motility by live-cell imaging. Cells transfected with SLFN5 siRNA demonstrated increased cell motility (Fig. 11A; see also Movies S1 and S2 in the supplemental material). SLFN5 knockdown also increased migration in a transwell migration assay (Fig. 11B and C). In addition, SLFN5 knockdown increased invasion of 786-0 cells through Matrigel-coated transwell membranes (Fig. 11D and E). Taken together, these results provide strong evidence for a key negative regulatory role for SLFN5 in RCC tumor progression.
FIG 11.
SLFN5 inhibits malignant cell migration. (A) 786-0 cells were transiently transfected with control siRNA or SLFN5 siRNA, as indicated; at 48 h after transfection, cells were transferred to a Nikon Biostation incubator wide-field microscope and time-lapse images were acquired at 10-min intervals for 12 h. Data were analyzed using the Nikon Elements software. Data represent the means ± standard errors of results from 27 migratory events detected by the Nikon Elements software. (B) 786-0 cells were transiently transfected with control siRNA or SLFN5 siRNA, as indicated. At 48 h after transfection cells, were plated in BD BioCoat cell culture inserts for 3 h and then cells were stained. Representative images of migrating cells (×5) after 3 h of incubation are shown. (C) The migrated cells were counted, and relative migration is expressed as the fold increase over control ± standard error of results from three independent experiments. Paired two-tailed t test analysis showed a P value of 0.0198 (*). (D) 786-0 cells were transiently transfected with control siRNA or SLFN5 siRNA. At 48 h after transfection, the cells were plated in a Corning BioCoat Matrigel invasion chamber, and invasion of the cells was assessed in 6 h. Representative images of invading cells (×5) after 6 h of incubation are shown. (E) The invading cells were counted, and relative invasion is expressed as the fold increase over controls ± standard errors of results from four independent experiments. Paired two-tailed t test analysis showed a P value of 0.02933 (*).
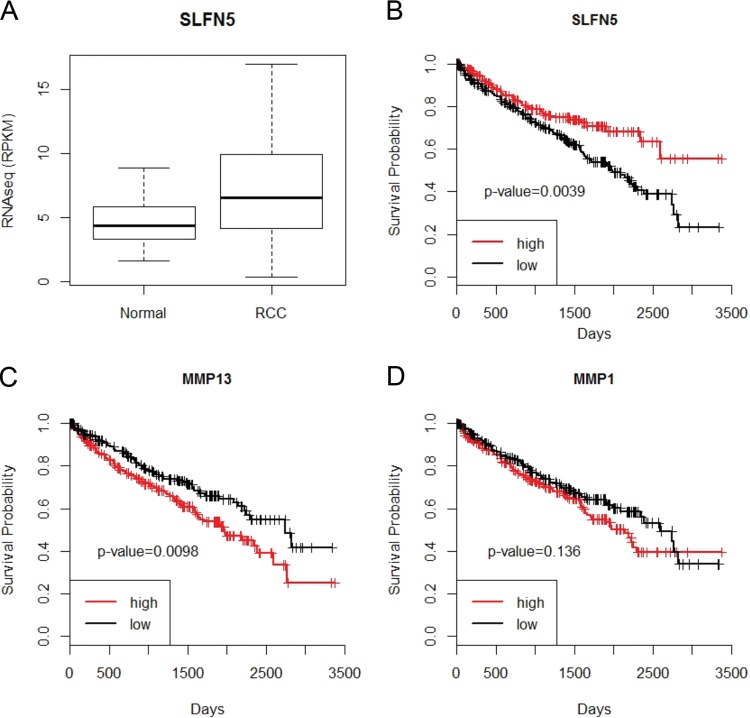
Since our results using renal cell carcinoma cell lines provided evidence for a potential important functional role for SLFN5 in RCC progression, we next sought to determine the expression of SLFN5 in RCC samples and whether its expression was linked to overall survival. We analyzed a recently obtained RNA-seq data set of 470 RCC samples and compared the data to 68 nontumor control kidney samples (28, 31). Although SLFN5 was significantly overexpressed in RCC samples (t test, P value = 2 × 10⁻⁶) (Fig. 12A), higher expression of SLFN5 was significantly associated with a better overall survival in RCC samples (log rank, P value = 0.003) (Fig. 12B). In addition, when the prognostic effects of MMP-1 or MMP-13 in RCC were evaluated, we found that high MMP-13 expression correlated significantly with adverse overall survival (Fig. 12C), while MMP-1 independently did not show any significant correlation with survival (Fig. 12D).
FIG 12.
SLFN5 expression is reduced in a large independent cohort of RCC patient samples and correlates with prognosis. (A) The RNA-seq data set from 470 RCC samples and 68 controls was downloaded from the TCGA Data Portal. Differential expression analysis was performed using Student's t test. The resultant P values were adjusted for false discovery rate (FDR) by using Benjamini and Hochberg's approach, and only adjusted P values of <0.05 were considered statistically significant. The FDR value of the SLFN5 gene is 4.09E−06. (B to D) The Kaplan-Meier curves of high- and low-expression groups of candidate genes using RNA-seq data from 470 RCC samples. For each gene, the RCC samples were classified into high- or low-expression groups according to whether the expression of the candidate gene was greater than the median expression of the candidate gene. The P values from log rank tests comparing the two Kaplan-Meier curves are shown in each figure. (B) Higher expression of SLFN5 leads to a better overall survival (P value = 0.0039). (C) Significant correlation between high MMP-13 expression and adverse overall survival (P value = 0.0098). (D) No significant correlation observed between MMP-1 and survival (P value = 0.136).
DISCUSSION
Although the precise biochemical functions and mechanisms of action of members of the Schlafen family of proteins remain to be established, there has been emerging evidence implicating human SLFNs in the control of various cellular functions and in the pathophysiology of some diseases. Human SLFN11 has been shown to inhibit viral protein synthesis in HIV-infected cells (32) and to sensitize malignant cells to DNA-damaging agents and other chemotherapeutic cells (15). Human SLFN5 has been implicated in the control of anchorage-independent growth of malignant melanoma cells (18), while human SLFN12 has been implicated in the control of differentiation of prostate epithelial cells (13).
In the present study, we provide evidence implicating SLFN5 in RCC progression and invasiveness and, for the first time, identify a specific mechanism by which this occurs. Our studies establish that SLFN5 knockdown in renal cell carcinoma cells results in a distinct cellular phenotype characterized by a dramatic loss of stress fibers, a decrease in cell size, and enhanced cell motility. Using RNA-seq analysis, we identified groups of genes involved in cell morphology, as well as cellular assembly and organization, whose expression is increased upon SLFN5 knockdown in kidney cancer cells. Among these genes were MMP genes, whose protein products are involved in remodeling of the extracellular matrix (ECM) and play a role in RCC invasion (33, 34). Significantly, RNA interference (RNAi)-mediated targeting of MMP-1 and MMP-13 reverses the SLFN5 knockdown-induced invasion of RCC cells.
Although the precise cellular mechanism by which SLFN5 suppresses expression of MMP-1 and MMP-13 remains to be identified, given the nuclear localization of SLFN5 and its putative DNA/RNA helicase activity (9, 19, 20), it is tempting to speculate that SLFN5 may function as a transcriptional repressor, but this remains to be established in future studies. Another possibility is that SLFN5 can regulate the stability of adenylate/uridylate-rich elements (AREs) containing mRNAs. Previous studies have shown that MMP-1 mRNA that contains AREs in the 3′ untranslated region (UTR) is destabilized by the RNA binding protein tristetraprolin (TTP) (35). Other studies have shown a similar regulatory effect of HuR on cyclooxygenase 2 (COX-2) mRNA in RCC (36). It is possible that SLFN5 could modulate the translation of MMP-1 and MMP-13 proteins via similar posttranscriptional mechanisms, but this remains to be directly examined in future studies.
A recent study using mass spectroscopy to determine novel binding partners for NOTCH identified SLFN5 and SLFN11 as binding NOTCH in the nucleus (37). In addition, other studies have shown a role for Notch signaling in the metastatic potential of RCC (38, 39). Notably, one of the studies showed a cooperation of Notch and transforming growth factor β (TGF-β) signaling pathways in the process (39). As both MMP-1 and MMP-13 expression levels are known to be regulated by TGF-β-induced signals (40) and Notch signaling has been shown to affect MMP-13 expression (41, 42), it is possible that SLFN5 controls MMP-1 and MMP-13 expression, as well as cell motility and invasion through its effects on NOTCH/TGF-β signaling. Expression of MMPs can also be modulated by additional pathways (43). For example, MMP-1 and MMP-13 expression is dependent on p38 mitogen-activated protein kinase (MAPK) activity in oral squamous cell carcinoma (OSCC) (44), while in chondrocytes MMP-13 expression requires p38 and c-Jun N-terminal kinase (45). Thus, another potential regulatory mechanism may involve SLFN5-dependent control of MAPK pathways, and this should be examined in future studies.
A key finding of our work is that higher levels of SLFN5 expression correlated with an overall better survival in RCC patients. This indicates that SLFN5 has tumor suppressor activity. Recent evidence has shown that higher SLFN11 expression also correlated with an increase in overall survival in ovarian cancer patients treated with cisplatin (16), indicating an overall role for the SLFN proteins as potential tumor suppressors. However, SLFN11 appears to be involved in a DNA damage response pathway (16), compared to SLFN5, which seems to play more of a role in motility and invasion. SLFN proteins, thus, likely function as transcriptional regulators that affect different pathways depending on the specific SLFN isoform. Altogether, our studies raise the possibility that development of pharmacological agents that upregulate SLFN5 expression in malignant cells would provide a unique therapeutic approach for the treatment of malignancies, and further efforts in that direction are warranted.
Supplementary Material
ACKNOWLEDGMENTS
The work was supported in part by NIH grants CA161196, CA77816, and CA155566 and by grant 5I01CX000916 from the Department of Veterans Affairs. E. M. Beauchamp was supported in part by NIH training grants T32CA070085 and F32CA183536, and A. D. Arslan was supported in part by NIH training grant T32CA070085.
None of us have conflicts of interest to disclose.
Footnotes
Supplemental material for this article may be found at http://dx.doi.org/10.1128/MCB.00019-15.
REFERENCES
- 1.Stark GR, Kerr IM, Williams BR, Silverman RH, Schreiber RD. 1998. How cells respond to interferons. Annu Rev Biochem 67:227–264. doi: 10.1146/annurev.biochem.67.1.227. [DOI] [PubMed] [Google Scholar]
- 2.Borden EC, Sen GC, Uze G, Silverman RH, Ransohoff RM, Foster GR, Stark GR. 2007. Interferons at age 50: past, current and future impact on biomedicine. Nat Rev Drug Discov 6:975–990. doi: 10.1038/nrd2422. [DOI] [PMC free article] [PubMed] [Google Scholar]
- 3.Platanias LC. 2005. Mechanisms of type-I- and type-II-interferon-mediated signalling. Nat Rev Immunol 5:375–386. doi: 10.1038/nri1604. [DOI] [PubMed] [Google Scholar]
- 4.Fish EN, Platanias LC. 2014. Interferon receptor signaling in malignancy: a network of cellular pathways defining biological outcomes. Mol Cancer Res 12:1691–1703. doi: 10.1158/1541-7786.MCR-14-0450. [DOI] [PMC free article] [PubMed] [Google Scholar]
- 5.Escudier B, Bellmunt J, Négrier S, Bajetta E, Melichar B, Bracarda S, Ravaud A, Golding S, Jethwa S, Sneller V. 2010. Phase III trial of bevacizumab plus interferon alfa-2a in patients with metastatic renal cell carcinoma (AVOREN): final analysis of overall survival. J Clin Oncol 28:2144–2150. doi: 10.1200/JCO.2009.26.7849. [DOI] [PubMed] [Google Scholar]
- 6.Chow WH, Dong LM, Devesa SS. 2010. Epidemiology and risk factors for kidney cancer. Nat Rev Urol 7:245–257. doi: 10.1038/nrurol.2010.46. [DOI] [PMC free article] [PubMed] [Google Scholar]
- 7.Cohen HT, McGovern FJ. 2005. Renal-cell carcinoma. N Engl J Med 353:2477–2490. doi: 10.1056/NEJMra043172. [DOI] [PubMed] [Google Scholar]
- 8.Bell TA, de la Casa-Esperón E, Doherty HE, Ideraabdullah F, Kim K, Wang Y, Lange LA, Wilhemsen K, Lange EM, Sapienza C, de Villena FP. 2006. The paternal gene of the DDK syndrome maps to the Schlafen gene cluster on mouse chromosome 11. Genetics 172:411–423. doi: 10.1534/genetics.105.047118. [DOI] [PMC free article] [PubMed] [Google Scholar]
- 9.Mavrommatis E, Fish EN, Platanias LC. 2013. The Schlafen family of proteins and their regulation by interferons. J Interferon Cytokine Res 33:206–210. doi: 10.1089/jir.2012.0133. [DOI] [PMC free article] [PubMed] [Google Scholar]
- 10.Schwarz DA, Katayama CD, Hedrick SM. 1998. Schlafen, a new family of growth regulatory genes that affect thymocyte development. Immunity 9:657–668. [DOI] [PubMed] [Google Scholar]
- 11.Neumann B, Zhao L, Murphy K, Gonda TJ. 2008. Subcellular localization of the Schlafen protein family. Biochem Biophys Res Commun 370:62–66. doi: 10.1016/j.bbrc.2008.03.032. [DOI] [PubMed] [Google Scholar]
- 12.Bustos O, Naik S, Ayers G, Casola C, Perez-Lamigueiro MA, Chippindale PT, Pritham EJ, de la Casa-Esperón E. 2009. Evolution of the Schlafen genes, a gene family associated with embryonic lethality, meiotic drive, immune processes and orthopoxvirus virulence. Gene 447:1–11. doi: 10.1016/j.gene.2009.07.006. [DOI] [PMC free article] [PubMed] [Google Scholar]
- 13.Kovalenko PL, Basson MD. 2014. Schlafen 12 expression modulates prostate cancer cell differentiation. J Surg Res 190:177–184. doi: 10.1016/j.jss.2014.03.069. [DOI] [PMC free article] [PubMed] [Google Scholar]
- 14.Oh PS, Patel VB, Sanders MA, Kanwar SS, Yu Y, Nautiyal J, Patel BB, Majumdar AP. 2011. Schlafen-3 decreases cancer stem cell marker expression and autocrine/juxtacrine signaling in FOLFOX-resistant colon cancer cells. Am J Physiol Gastrointest Liver Physiol 301:G347–G355. doi: 10.1152/ajpgi.00403.2010. [DOI] [PMC free article] [PubMed] [Google Scholar]
- 15.Tian L, Song S, Liu X, Wang Y, Xu X, Hu Y, Xu J. 2014. Schlafen-11 sensitizes colorectal carcinoma cells to irinotecan. Anticancer Drugs 25:1175–1181. doi: 10.1097/CAD.0000000000000151. [DOI] [PubMed] [Google Scholar]
- 16.Zoppoli G, Regairaz M, Leo E, Reinhold WC, Varma S, Ballestrero A, Doroshow JH, Pommier Y. 2012. Putative DNA/RNA helicase Schlafen-11 (SLFN11) sensitizes cancer cells to DNA-damaging agents. Proc Natl Acad Sci U S A 109:15030–15035. doi: 10.1073/pnas.1205943109. [DOI] [PMC free article] [PubMed] [Google Scholar]
- 17.Mavrommatis E, Arslan AD, Sassano A, Hua Y, Kroczynska B, Platanias LC. 2013. Expression and regulatory effects of murine Schlafen (Slfn) genes in malignant melanoma and renal cell carcinoma. J Biol Chem 288:33006–33015. doi: 10.1074/jbc.M113.460741. [DOI] [PMC free article] [PubMed] [Google Scholar]
- 18.Katsoulidis E, Mavrommatis E, Woodard J, Shields MA, Sassano A, Carayol N, Sawicki KT, Munshi HG, Platanias LC. 2010. Role of interferon α (IFNα)-inducible Schlafen-5 in regulation of anchorage-independent growth and invasion of malignant melanoma cells. J Biol Chem 285:40333–40341. doi: 10.1074/jbc.M110.151076. [DOI] [PMC free article] [PubMed] [Google Scholar]
- 19.Katsoulidis E, Carayol N, Woodard J, Konieczna I, Majchrzak-Kita B, Jordan A, Sassano A, Eklund EA, Fish EN, Platanias LC. 2009. Role of Schlafen 2 (SLFN2) in the generation of interferon alpha-induced growth inhibitory responses. J Biol Chem 284:25051–25064. doi: 10.1074/jbc.M109.030445. [DOI] [PMC free article] [PubMed] [Google Scholar]
- 20.Geserick P, Kaiser F, Klemm U, Kaufmann SH, Zerrahn J. 2004. Modulation of T cell development and activation by novel members of the Schlafen (slfn) gene family harbouring an RNA helicase-like motif. Int Immunol 16:1535–1548. doi: 10.1093/intimm/dxh155. [DOI] [PubMed] [Google Scholar]
- 21.Uddin S, Sassano A, Deb DK, Verma A, Majchrzak B, Rahman A, Malik AB, Fish EN, Platanias LC. 2002. Protein kinase C-delta (PKC-delta) is activated by type I interferons and mediates phosphorylation of Stat1 on serine 727. J Biol Chem 277:14408–14416. doi: 10.1074/jbc.M109671200. [DOI] [PubMed] [Google Scholar]
- 22.Yetter A, Uddin S, Krolewski JJ, Jiao H, Yi T, Platanias LC. 1995. Association of the interferon-dependent tyrosine kinase Tyk-2 with the hematopoietic cell phosphatase. J Biol Chem 270:18179–18182. doi: 10.1074/jbc.270.31.18179. [DOI] [PubMed] [Google Scholar]
- 23.Uddin S, Yenush L, Sun XJ, Sweet ME, White MF, Platanias LC. 1995. Interferon-alpha engages the insulin receptor substrate-1 to associate with the phosphatidylinositol 3′-kinase. J Biol Chem 270:15938–15941. [DOI] [PubMed] [Google Scholar]
- 24.Verma A, Deb DK, Sassano A, Uddin S, Varga J, Wickrema A, Platanias LC. 2002. Activation of the p38 mitogen-activated protein kinase mediates the suppressive effects of type I interferons and transforming growth factor-beta on normal hematopoiesis. J Biol Chem 277:7726–7735. doi: 10.1074/jbc.M106640200. [DOI] [PubMed] [Google Scholar]
- 25.Livak KJ, Schmittgen TD. 2001. Analysis of relative gene expression data using real-time quantitative PCR and the 2(-Delta Delta C(T)) method. Methods 25:402–408. doi: 10.1006/meth.2001.1262. [DOI] [PubMed] [Google Scholar]
- 26.Bhattacharyya S, Yu Y, Suzuki M, Campbell N, Mazdo J, Vasanthakumar A, Bhagat TD, Nischal S, Christopeit M, Parekh S, Steidl U, Godley L, Maitra A, Greally JM, Verma A. 2013. Genome-wide hydroxymethylation tested using the HELP-GT assay shows redistribution in cancer. Nucleic Acids Res 41:e157. doi: 10.1093/nar/gkt601. [DOI] [PMC free article] [PubMed] [Google Scholar]
- 27.Wu W, Bhagat TD, Yang X, Song JH, Cheng Y, Agarwal R, Abraham JM, Ibrahim S, Bartenstein M, Hussain Z, Suzuki M, Yu Y, Chen W, Eng C, Greally J, Verma A, Meltzer SJ. 2013. Hypomethylation of noncoding DNA regions and overexpression of the long noncoding RNA, AFAP1-AS1, in Barrett's esophagus and esophageal adenocarcinoma. Gastroenterology 144:956–966. doi: 10.1053/j.gastro.2013.01.019. [DOI] [PMC free article] [PubMed] [Google Scholar]
- 28.Hu CY, Mohtat D, Yu Y, Ko YA, Shenoy N, Bhattacharya S, Izquierdo MC, Park AS, Giricz O, Vallumsetla N, Gundabolu K, Ware K, Bhagat TD, Suzuki M, Pullman J, Liu XS, Greally JM, Susztak K, Verma A. 2014. Kidney cancer is characterized by aberrant methylation of tissue-specific enhancers that are prognostic for overall survival. Clin Cancer Res 20:4349–4360. doi: 10.1158/1078-0432.CCR-14-0494. [DOI] [PMC free article] [PubMed] [Google Scholar]
- 29.Rowe RG, Li XY, Hu Y, Saunders TL, Virtanen I, Garcia de Herreros A, Becker KF, Ingvarsen S, Engelholm LH, Bommer GT, Fearon ER, Weiss SJ. 2009. Mesenchymal cells reactivate Snail1 expression to drive three-dimensional invasion programs. J Cell Biol 184:399–408. doi: 10.1083/jcb.200810113. [DOI] [PMC free article] [PubMed] [Google Scholar]
- 30.Albini A, Benelli R. 2007. The chemoinvasion assay: a method to assess tumor and endothelial cell invasion and its modulation. Nat Protoc 2:505–511. doi: 10.1038/nprot.2006.466. [DOI] [PubMed] [Google Scholar]
- 31.Cancer Genome Atlas Research Network. 2013. Comprehensive molecular characterization of clear cell renal cell carcinoma. Nature 499:43–49. doi: 10.1038/nature12222. [DOI] [PMC free article] [PubMed] [Google Scholar]
- 32.Li M, Kao E, Gao X, Sandig H, Limmer K, Pavon-Eternod M, Jones TE, Landry S, Pan T, Weitzman MD, David M. 2012. Codon-usage-based inhibition of HIV protein synthesis by human schlafen 11. Nature 491:125–128. doi: 10.1038/nature11433. [DOI] [PMC free article] [PubMed] [Google Scholar]
- 33.Cho NH, Shim HS, Rha SY, Kang SH, Hong SH, Choi YD, Hong SJ, Cho SH. 2003. Increased expression of matrix metalloproteinase 9 correlates with poor prognostic variables in renal cell carcinoma. Eur Urol 44:560–566. doi: 10.1016/S0302-2838(03)00362-2. [DOI] [PubMed] [Google Scholar]
- 34.Roomi MW, Ivanov V, Kalinovsky T, Niedzwiecki A, Rath M. 2006. Modulation of human renal cell carcinoma 786-0 MMP-2 and MMP-9 activity by inhibitors and inducers in vitro. Med Oncol 23:245–250. doi: 10.1385/MO:23:2:245. [DOI] [PubMed] [Google Scholar]
- 35.Al-Souhibani N, Al-Ahmadi W, Hesketh JE, Blackshear PJ, Khabar KS. 2010. The RNA binding zinc finger protein tristetraprolin regulates AU-rich mRNAs involved in breast cancer-related processes. Oncogene 29:4205–4215. doi: 10.1038/onc.2010.168. [DOI] [PMC free article] [PubMed] [Google Scholar]
- 36.Ronkainen H, Vaarala MH, Hirvikoski P, Ristimäki A. 2011. HuR expression is a marker of poor prognosis in renal cell carcinoma. Tumour Biol 32:481–487. doi: 10.1007/s13277-010-0141-6. [DOI] [PubMed] [Google Scholar]
- 37.Yatim A, Benne C, Sobhian B, Laurent-Chabalier S, Deas O, Judde JG, Lelievre JD, Levy Y, Benkirane M. 2012. NOTCH1 nuclear interactome reveals key regulators of its transcriptional activity and oncogenic function. Mol Cell 48:445–458. doi: 10.1016/j.molcel.2012.08.022. [DOI] [PMC free article] [PubMed] [Google Scholar]
- 38.Huang QB, Ma X, Li HZ, Ai Q, Liu SW, Zhang Y, Gao Y, Fan Y, Ni D, Wang BJ, Zhang X. 2014. Endothelial Delta-like 4 (DLL4) promotes renal cell carcinoma hematogenous metastasis. Oncotarget 5:3066–3075. [DOI] [PMC free article] [PubMed] [Google Scholar]
- 39.Sjölund J, Boström AK, Lindgren D, Manna S, Moustakas A, Ljungberg B, Johansson M, Fredlund E, Axelson H. 2011. The notch and TGF-beta signaling pathways contribute to the aggressiveness of clear cell renal cell carcinoma. PLoS One 6:e23057. doi: 10.1371/journal.pone.0023057. [DOI] [PMC free article] [PubMed] [Google Scholar]
- 40.Johansson N, Ala-aho R, Uitto V, Grénman R, Fusenig NE, López-Otín C, Kähäri VM. 2000. Expression of collagenase-3 (MMP-13) and collagenase-1 (MMP-1) by transformed keratinocytes is dependent on the activity of p38 mitogen-activated protein kinase. J Cell Sci 113:227–235. [DOI] [PubMed] [Google Scholar]
- 41.Blaise R, Mahjoub M, Salvat C, Barbe U, Brou C, Corvol MT, Savouret JF, Rannou F, Berenbaum F, Bausero P. 2009. Involvement of the Notch pathway in the regulation of matrix metalloproteinase 13 and the dedifferentiation of articular chondrocytes in murine cartilage. Arthritis Rheum 60:428–439. doi: 10.1002/art.24250. [DOI] [PubMed] [Google Scholar]
- 42.Hosaka Y, Saito T, Sugita S, Hikata T, Kobayashi H, Fukai A, Taniguchi Y, Hirata M, Akiyama H, Chung UI, Kawaguchi H. 2013. Notch signaling in chondrocytes modulates endochondral ossification and osteoarthritis development. Proc Natl Acad Sci U S A 110:1875–1880. doi: 10.1073/pnas.1207458110. [DOI] [PMC free article] [PubMed] [Google Scholar]
- 43.Munshi HG, Wu YI, Mukhopadhyay S, Ottaviano AJ, Sassano A, Koblinski JE, Platanias LC, Stack MS. 2004. Differential regulation of membrane type 1-matrix metalloproteinase activity by ERK 1/2- and p38 MAPK-modulated tissue inhibitor of metalloproteinases 2 expression controls transforming growth factor-beta1-induced pericellular collagenolysis. J Biol Chem 279:39042–39050. doi: 10.1074/jbc.M404958200. [DOI] [PubMed] [Google Scholar]
- 44.Yu T, Wu Y, Helman JI, Wen Y, Wang C, Li L. 2011. CXCR4 promotes oral squamous cell carcinoma migration and invasion through inducing expression of MMP-9 and MMP-13 via the ERK signaling pathway. Mol Cancer Res 9:161–172. doi: 10.1158/1541-7786.MCR-10-0386. [DOI] [PubMed] [Google Scholar]
- 45.Mengshol JA, Vincenti MP, Coon CI, Barchowsky A, Brinckerhoff CE. 2000. Interleukin-1 induction of collagenase 3 (matrix metalloproteinase 13) gene expression in chondrocytes requires p38, c-Jun N-terminal kinase, and nuclear factor kappaB: differential regulation of collagenase 1 and collagenase 3. Arthritis Rheum 43:801–811. doi:. [DOI] [PubMed] [Google Scholar]
Associated Data
This section collects any data citations, data availability statements, or supplementary materials included in this article.


