

ABSTRACT
While a clear understanding of the events leading to successful establishment of host-specific viral populations and productive infection in the central nervous system (CNS) has not yet been reached, the simian immunodeficiency virus (SIV)-infected rhesus macaque provides a powerful model for the study of human immunodeficiency virus (HIV) intrahost evolution and neuropathogenesis. The evolution of the gp120 and nef genes, which encode two key proteins required for the establishment and maintenance of infection, was assessed in macaques that were intravenously inoculated with the same viral swarm and allowed to naturally progress to simian AIDS and potential SIV-associated encephalitis (SIVE). Longitudinal plasma samples and immune markers were monitored until terminal illness. Single-genome sequencing was employed to amplify full-length env through nef transcripts from plasma over time and from brain tissues at necropsy. nef sequences diverged from the founder virus faster than gp120 diverged. Host-specific sequence populations were detected in nef (∼92 days) before they were detected in gp120 (∼182 days). At necropsy, similar brain nef sequences were found in different macaques, indicating convergent evolution, while gp120 brain sequences remained largely host specific. Molecular clock and selection analyses showed weaker clock-like behavior and stronger selection pressure in nef than in gp120, with the strongest nef selection in the macaque with SIVE. Rapid nef diversification, occurring prior to gp120 diversification, indicates that early adaptation of nef in the new host is essential for successful infection. Moreover, the convergent evolution of nef sequences in the CNS suggests a significant role for nef in establishing neurotropic strains.
IMPORTANCE The SIV-infected rhesus macaque model closely resembles HIV-1 immunopathogenesis, neuropathogenesis, and disease progression in humans. Macaques were intravenously infected with identical viral swarms to investigate evolutionary patterns in the gp120 and nef genes leading to the emergence of host-specific viral populations and potentially linked to disease progression. Although each macaque exhibited unique immune profiles, macaque-specific nef sequences evolving under selection were consistently detected in plasma samples at 3 months postinfection, significantly earlier than in gp120 macaque-specific sequences. On the other hand, nef sequences in brain tissues, collected at necropsy of two animals with detectable infection in the central nervous system (CNS), revealed convergent evolution. The results not only indicate that early adaptation of nef in the new host may be essential for successful infection, but also suggest that specific nef variants may be required for SIV to efficiently invade CNS macrophages and/or enhance macrophage migration, resulting in HIV neuropathology.
INTRODUCTION
A clear understanding of the events leading to the establishment of human immunodeficiency virus type 1 (HIV-1) infection in a new host, including the central nervous system (CNS), is key to the development of a vaccine and a therapeutic intervention that will eradicate the virus. Research on HIV/simian immunodeficiency virus (SIV) evolution and adaptation is frequently based on genetic information derived from the envelope (env) gp120 glycoprotein because its high sequence heterogeneity (1, 2) produces a strong phylogenetic signal (3). env gp120 is exposed on the virus surface and is necessary for viral entry into lymphocytes (4). Neutralizing antibodies bind to env variable regions, exerting significant selection pressure on the protein (5, 6). HIV-1 Nef, an accessory protein, is also required for the establishment and maintenance of infection in both humans and macaques (7–9). SIV with Nef and the long terminal region (LTR) deleted is unable to initiate CNS infection, resulting in diminished neurotropism or insufficient systemic viral replication for entry into the brain (10). In vitro assays have shown that Nef enhances both membrane expression and virion incorporation of env products (11). One study observed that the requirement for Nef increased as amounts of env decreased in virus-producing cells (12). In addition, recent work has demonstrated that nef can enhance macrophage tissue infiltration by altering its migratory mode (13), which may play a central role in the accumulation of macrophages residing in the CNS, the establishment of viral reservoirs, and neuropathogenesis (14). However, very few studies have focused on Nef evolution and disease progression in vivo (9, 15, 16).
The study of HIV-1 initial adaptation in humans is problematic, because recently infected patients are usually unaware of their HIV-1 status and the founder virus may be difficult to identify. The SIV-infected rhesus macaque is an animal model that closely resembles HIV-1 immunopathogenesis, neuropathogenesis, and disease progression in humans (17–21). Moreover, intravenously infected macaques can mimic the injection drug user (IDU) transmission route, which characterizes 8% of new HIV-1 infections and 16% of people currently living with HIV-1 (http://www.cdc.gov/hiv/library/reports). SIV macaque studies focusing on HIV-associated neurological disorders (HAND) often use a CD8+ T cell-depleted model because these animals progress quickly (2 to 5 months) to simian AIDS (SAIDS) and display an elevated incidence (>80%) of SIV-associated encephalitis (SIVE) (22, 23). However, CD8+ T cell depletion, which includes a reduction in NK cells, could distort natural viral evolution, especially during early infection, due to impaired innate immunity and unimpeded viral expansion. Therefore, a non-CD8-depleted/naturally progressing macaque model could shed additional light on the intricacies of SIV/HIV evolution at the onset of infection.
Several virus-specific properties contribute to the establishment of HIV-1 infection. For example, viral genetic diversity is reduced during mucosal transmission, indicating that a subset of circulating viruses are more suited than others for transmission (24). Viruses that bind the CCR5 coreceptor are transmitted preferentially (25). Selection of host-specific viral populations occurs in newborn babies infected by their HIV-1+ mothers (26, 27). The infection route also plays a role in the diversity of the transmitted virus: cases of HIV-1 infection with multiple variants gradually increase from about 20% during heterosexual transmission (28) to about 40% in men who have sex with men (MSM) (29) and to 60% in IDU (30), suggesting that immune cells stationed at anatomical barriers during sexual transmission contribute to founder virus population establishment. Two to 6 weeks postinfection, the viral load (VL) and genetic diversity increase exponentially, and virus subpopulations begin to emerge (3, 31). However, debate exists about the time required for the emergence of a host-specific viral population or whether specific regions of the HIV-1 genome adapt at similar rates within the host milieu.
We contrasted env gp120 and nef sequence evolution in multiple macaques infected with the same viral swarm and allowed to naturally progress to SAIDS and potentially SIVE. We also compared isolates of SIV in the brain among different macaques with initial plasma isolates in order to address hypotheses concerning early versus late viral brain entry. A single-genome-sequencing approach that amplified full-length env-nef transcripts was used in order to reduce PCR resampling, analyze coevolving genomes, and elucidate the intricate details of SIV evolution and adaptation in the two genes.
MATERIALS AND METHODS
Ethics statement.
Animals were housed at the New England Primate Research Center (NEPRC) according to the standards of the American Association for Accreditation of Laboratory Animal Care and IACUC protocol 04802. Treatment of animals was in accordance with the Guide for the Care and Use of Laboratory Animals of the Institute of Laboratory Animal Resources (32). All possible measures were taken to minimize discomfort of the animals. NEPRC veterinarians, in collaboration with animal behavioral staff, supervised the animal enrichment program. The guidelines for humane euthanasia of the macaques that were followed included (i) weight loss of >15% in 2 weeks or 25% overall, (ii) documented opportunistic infection, (iii) persistent anorexia of >3 to 5 days without explicable cause, (iv) severe intractable diarrhea that was nonresponsive to standard treatment and resulted in dehydration or debilitation of the animal, (v) progressive neurologic signs, (vi) significant cardiac and/or pulmonary signs, (vii) persistent leucopenia (as a general guideline, defined as ≤1,000 cells/μl) or thrombocytopenia (as a general guideline, defined as ≤30,000 platelets [plt]/μl), (viii) progressive or persistent anemia (≤20% hematocrit [HCT]), (ix) a body condition score (a standard semiquantitative method for assessing body fat and muscle using visual inspection of the animal) of <1.5/5 with weight loss, or (x) any other serious illness.
Study populations and biological indicators of disease.
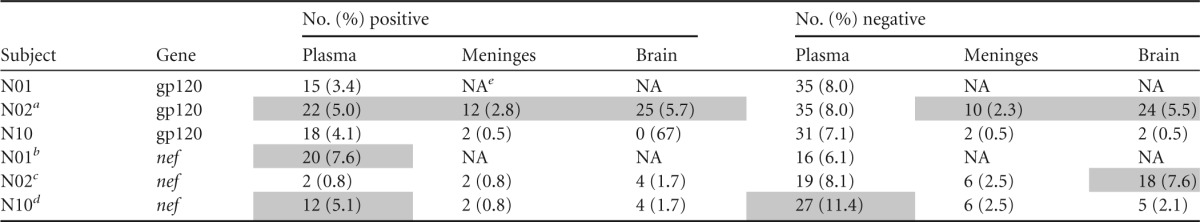
Three macaques, designated N01, N02, and N10, were infected with the SIVmac251 viral swarm (33, 34) and allowed to progress to SAIDS before euthanization. Plasma samples were collected at 21, 90, and 180 days postinfection (p.i.) and just prior to necropsy (see Table 2). An additional plasma sample was collected at 365 days p.i. from animals that lived more than 1 year. Meninges and deeper brain tissues (frontal, temporal, and parietal lobes) were retrieved from all macaques at necropsy as previously described (19). Disease progression was monitored via the mean VL and CD4+ T cell counts, which were measured every 14 days throughout the duration of the infection. CD8+ T cell and NK cell counts were also measured every 2 weeks over the course of infection. SIV env and nef sequences were successfully amplified from brain tissues of only three macaques, designated N01, N02, and N10 (see below). Therefore, these animals were chosen for all further analyses described in this paper.
TABLE 2.
Numbers of sequences amplified for each tissue
| Macaque | No. of sequences amplified at: |
||||||||
|---|---|---|---|---|---|---|---|---|---|
| Plasma collection time point (days p.i.) |
Necropsy |
||||||||
| 21 | 90 | 180 | 365 | 463 | Meninges | Frontal lobe | Parietal cortex | Temporal lobe | |
| N01 | 39 | 42 | 32 | 34 | 38 | 5 | 0 | 0 | 1 |
| N02 | 38 | 33 | 15 | 34a | 23 | 22 | 29 | 30 | |
| N10 | 34 | 23 | 21 | 23b | 19 | 24 | 20 | 15 | |
The last sampling time was just before necropsy at 204 days p.i.
The last sampling time was just before necropsy at 223 days p.i.
Sequence generation and quality control.
All tissues were processed and first-round PCRs were set up in a restricted-access amplicon-free room with separate air-handling and laboratory equipment, where no amplified PCR products or recombinant cloned plasmids were allowed, and where work surfaces and equipment were thoroughly cleaned before and after use with Eliminase (Decon Labs, Inc.). The tissues were sectioned for shipping on dry ice at Boston College and subsequently received at the University of Florida on different dates. Positive and negative controls were included during all PCRs to ensure consistency in amplifications and a contamination-free environment.
SIV gp120 sequences (SIVmm239 reference sequence coordinates 6706 to 8049, numbered with the sequence locator tool [http://www.hiv.lanl.gov/content/sequence/LOCATE/locate.html]) and nef sequences (SIVmm239 coordinates 9077 to 9865) were generated from SIV RNA transcripts as follows. Viral RNA was isolated from the infecting SIVmac251 inoculum and cell-free plasma samples (140 to 280 μl) using the QIAamp Viral RNA minikit (Qiagen; catalog no. 52904). Total RNA and genomic DNA were isolated from each meninges or brain tissue section (50 to 80 ng) using the AllPrep DNA/RNA minikit (Qiagen; catalog no. 80204). The 100-μl final volume of RNA generated by each method was concentrated using an RNeasy MinElute Cleanup kit (Qiagen; catalog no. 74204). cDNA was created from the RNA using the SuperScript III first-strand synthesis system (Invitrogen Life Technologies; catalog no. 18080-051). Viral RNAs isolated from both the inoculating swarm and plasma samples were reverse transcribed using the provided oligo(dT)20 primer, while brain tissue RNA was reverse transcribed using cULTR (5′-ATGGCAGCTTTATTGAAGAGG-3′) (SIVmm239 10125 to 10145), a primer that binds in the SIV 3′ LTR region. A modified cDNA synthesis protocol was followed to maximize the length of the cDNA as follows. RNA was denatured via incubation with deoxynucleoside triphosphates (0.5 mM each) and 5 μM oligo(dT)20 or 0.2 μM cULTR (plasma or brain, respectively) at 65°C for 5 min and then cooled to 4°C. First-strand cDNA synthesis was performed in a 40-μl reaction volume containing 1× reverse transcription buffer (10 mM Tris-HCl [pH 8.4], 25 mM KCl), 5 mM MgCl2, 10 mM dithiothreitol, 2 U/μl of RNase-Out (RNase inhibitor; Invitrogen Life Technologies), and 10 U/μl SuperScript III reverse transcriptase (RT) (Invitrogen Life Technologies). The reaction mixture was heated to 45°C for 90 min, and then an additional 10 U/μl SuperScript III RT was added. The reaction mixture continued to incubate at 45°C for an additional 90 min and then at 70°C for 15 min. The reaction mixture was cooled to 37°C, and 0.1 U/μl of Escherichia coli RNase H was added, followed by a 20-min incubation. The cDNA was stored at −20°C.
A modified single-genome-sequencing protocol, based on previously published methods (35), was performed by serially diluting cDNA until an average of 30% or less of the nested PCRs were positive. During the first-round PCR, diluted cDNA was amplified in 25-μl reaction mixtures containing 1× Platinum Blue PCR SuperMix (Invitrogen Life Technologies) and 0.2 μM each primer: SOUTF, 5′-GGCTAAGGCTAATACATCTTCTGCATC-3′, and NOUTR, 5′-TTTAAGCAAGCAAGCGTGGAG-3′ (SIVmm239 6565 to 6591 and 10102 to 10122, respectively) (cycling parameters, 95°C for 5 min and 35 cycles of 94°C for 1 min, 58°C for 1 min, and 72°C for 4 min, followed by 72°C for 10 min). A 3.5-kb amplicon containing the complete env-nef genes was generated in every positive reaction. Second-round gp120 PCR consisted of 2 μl of the first-round PCR mixture added to a 23-μl second-round reaction mixture consisting of 1× Platinum Blue PCR SuperMix (Invitrogen Life Technologies) and 0.2 μM each primer: SINF, 5′-GTAAGTATGGGATGTCTTGGGAATCAG-3′, and SINR, 5′-GACCCCTCTTTTATTTCTTGAGGTGCC-3′ (SIVmm239 bp 6598 to 6624 and bp 8158 to 8184, respectively) The cycling parameters were as follows: initial denaturation at 95°C for 5 min, and then 35 cycles of 94°C for 1 min, 58°C for 1 min, and 72°C for 2 min, followed by 72°C for 10 min. The second-round mixtures containing single 1.5-kb products were considered positive for gp120. Subsequently, the first-round reaction mixtures that corresponded to positive second-round gp120 PCRs were then used to amplify the nef gene sequence; the second-round nef PCR mixture consisted of 2 μl of the first-round PCR mixture added to a 23-μl second-round reaction mixture consisting of 1× Platinum Blue PCR SuperMix (ThermoFisher) and 0.2 μM each primer—NINF, 5′-AGATCCTCCAACCAATACTCCA-3′, and NINR, 5′-AGTGCTGGTGAGAGTCTAGCAG-3′ (SIVmm239 8990 to 9011 and 10058 to 10079, respectively)—with the following cycling parameters: initial denaturation, 95°C for 5 min, and then 35 cycles of 94°C for 1 min, 58°C for 1 min, and 72°C for 2 min, followed by 72°C for 10 min. Second-round nef PCR mixtures containing single 1.1-kb products were considered positive and selected for sequencing. The SOUTF, SINF, and SINR primers were based on published oligonucleotide sequences (36), while the other primers were designed using Primer3 and observing regions of conservation in alignments of published SIVmac251 sequences downloaded from the Los Alamos HIV Sequence Database (http://www.hiv.lanl.gov). Sequencing was performed on an Applied Biosystems 3730xl DNA Analyzer (ThermoFisher) at the University of Florida Interdisciplinary Center for Biotechnology Research. All the sequences were assembled with the Geneious R7 software package (Biomatters), and all the sequences were deposited in GenBank.
Sequence alignments and analysis.
gp120 and nef alignments were optimized using the Clustal algorithm (37) implemented in MEGA5 (38) with subsequent manual optimization (39). Due to the large number of insertions and deletions that are typically problematic to align, a portion of the highly variable gp120 V1 domain (SIVmm239 positions 6987 to 7035) was removed. All nef and gp120 sequences were tested for recombination using the PHI test implemented in Splitstree4 (40), as previously described (41, 42), and suspected recombinants were removed prior to distance and phylogenetic analyses. All alignments are available upon request.
Pairwise p distances (genetic diversity) between sequences in the viral swarm and each plasma, meninges, and brain tissue sequence population, as well as nucleotide divergence between viral swarm sequences and sequences sampled at specific time points or from specific tissues, were calculated using MEGA5, with standard errors estimated by bootstrapping (1,000 replicates). Standard t tests (paired and unpaired as appropriate) were used to determine whether significant differences in diversity existed in and between sequence populations.
The best-fitting nucleotide substitution model was identified in MEGA5 with a hierarchical test based on the Bayesian information criterion (43, 44), and maximum-likelihood (ML) genealogies for gp120 and nef alignments for collective macaque sequences sampled over time were inferred using PhyML (45). Support for internal branches of each tree was assessed by bootstrapping (500 bootstrap replicates). VESPA (http://www.hiv.lanl.gov) was used to identify signature amino acid positions associated with major branches in the last-time-point phylogeny. The Simmonds association index (SAI) test was used to investigate compartmentalization of viral subpopulations between plasma, meninges, and brain tissues (46).
The presence of a molecular clock signal in each macaque data set was investigated by regression between root-to-tip divergence and sampling date on the ML trees with Path-O-Gen v1.4 (http://tree.bio.ed.ac.uk/software/pathogen/). Evolutionary rates in gp120 and nef were simultaneously estimated using a concatenated alignment, including a common subset of nonrecombinant sequences (available upon request). Two partitions (gp120 and nef) were generated with the program BEAUTI of the BEAST v1.82 software package (47). The substitution and clock models were unlinked, but the same underlying phylogeny was assumed for both genes. A Markov chain Monte Carlo (MCMC), run for 100 million generations with sampling every 100,000 generations, was used to obtain a posterior distribution of trees under a relaxed molecular clock model with the Bayesian skyline plot coalescent prior. An analysis run using the Skygrid population prior gave essentially the same result. Proper mixing of the MCMC was assessed by evaluating the effective sampling size (ESS) in the program Tracer v1.5 (http://beast.bio.ed.ac.uk/Tracer); parameter estimates with an ESS of >200 were considered reliable.
The program FUBAR was used to investigate positively and negatively selected codons at a 95% cutoff in sequence populations collected at each plasma time point, meninges, and individual brain tissues (48). SIV Nef and gp120 protein models were generated using the I-Tasser Web server (49, 50). Positively selected codons were mapped to these models in MacPymol (The PyMOL Molecular Graphics System, version 1.5.0.4; Schrödinger, LLC).
Nucleotide sequence accession numbers.
The GenBank nucleotide sequence accession numbers for the SIV data derived from macaques and the SIVmac251 viral swarm are KR998525 to KR999137 for nef and KR999138 to KR999900 for env.
RESULTS
SIV progression was related to immune response.
SIV infection outcomes varied for each macaque, with a notably longer life span of N01 and the development of SIVE in N10 (Table 1). Tissues were collected at specific time intervals. Approximately 20 to 40 linked SIV gp120 and nef sequences were generated from RNA extracted from plasma-derived virions. SIV was always amplified from plasma; however, viral sequences were amplified postmortem only from the meninges of N01 and from the meninges and parietal, temporal, and frontal lobes of N02 and N10 (Table 2). The VL, CD4+ T cell counts, percent CD8+ T cells, and percent NK cells were measured in the macaques every 2 weeks over the course of infection (Fig. 1). The VL remained high (>10,000 copy equivalents/ml) after about 14 days p.i. in all macaques, although after 98 days p.i., the VL was significantly lower in N01 than in N02 and N10 (P < 0.001). CD4+ T cell counts exhibited an increase and subsequent decrease in the first 28 days p.i. for all macaques. However, CD4+ T cell levels were significantly lower in N01 than in N02 and N10 throughout infection (P < 0.001) and gradually decreased after 42 days p.i. (Fig. 1). Even when the initial burst and later reduction in the CD4+ T cell counts, which can vary greatly between infected macaques, were omitted from the analysis (using only data from 9 to 198 days p.i. and 21 to 168 days p.i.), CD4+ T cell counts were still significantly lower for N01 than for N02 or N10 (P < 0.01). There was no statistically significant difference in the CD4+ counts or VL between N02 and N10. NK cells and CD8+ T cell levels also demonstrated a trend that distinguished N01 from N02 and N10; NK cell levels were significantly higher (P < 0.01) and CD8+ T cell levels were significantly lower (P < 0.01) over the course of infection for N01. N02 maintained a highly significantly (P < 0.0001) reduced level of NK cells compared to either N01 or N10. The longer life span of N01 may have been due to a lower sustained VL. Overall, N01 and N02 exhibited immune responses similar to that of N10, which suggests that the development of SIVE in N10 was independent of the immune parameters measured in this study. In general, this is to be expected, since monocyte/macrophage markers would be most likely to correlate with SIVE (23, 51).
TABLE 1.
Macaque outcomes
| Macaque | No. of days to SAIDS | Clinical note | Pathology report | SIVE |
|---|---|---|---|---|
| N01 | 463 | Overall bad health, including wt loss | Abdominal edema; severe Mycobacterium avium infection; enlarged lymph nodes; thymus with macrophage infiltration; lung inflammation | None |
| N02 | 204 | Decreased appetite; wt loss; lymphopenia | Lymphoid proliferation in heart; Pneumocystis carinii infection; alveolar macrophages; inflammation in multiple organs | None |
| N10 | 223 | Neurological symptoms | Inflammation in multiple organs; cytomegalovirus and P. carinii infection | Meningoencephalitis; astrocytosis; gliosis; neuronal degeneration |
FIG 1.

Viral load, CD4+ T cell counts, percent CD8+ T cells, and percent NK cells over the course of infection. Viral loads are shown as numbers of copy equivalents per milliliter. The dashed vertical lines indicate sampling time points for SIV sequence populations in plasma. The horizontal bars with asterisks indicate the periods when N02 and N10 had significantly higher values (P < 0.01) than N01 for viral loads and CD4 counts. Comparisons of NK and CD8 cells demonstrated significant differences among all the macaques (P < 0.01).
SIV nef and gp120 demonstrated marked differences in diversity and adaptation.
Since the main goal of the present work was to evaluate the diversification and progressive emergence of host-specific viral populations, we focused on viral diversity in plasma at each sampled time point, which largely represents the diversity of currently replicating/circulating viral strains in the peripheral blood (3). Two hundred gp120/nef sequences from the infecting SIVmac251 viral swarm were also generated for comparison.
The sequence diversity at 21 days p.i. was comparable to or higher than the diversity in the infecting viral swarm, which was not unexpected, considering that the VL peaked in all animals as early as 14 days p.i. and that intravenous infection does not usually result in significant transmission bottlenecks (30). However, gp120 and nef sequence populations from plasma demonstrated marked differences in diversity (Fig. 2A). nef sequences were significantly more diverse than gp120 sequences for the first two sampled time points in all macaques (P < 0.001), and there was a significant increase in nef diversity between the initial viral swarm and 21 days p.i. (P < 0.001). N01 and N02 meningeal and brain diversities for both genes were similar to the diversity in the last collected plasma sample. On the other hand, N10—the animal that developed SIVE—showed an interesting pattern: a statistically significant increase (P < 0.001) in nef diversity in meninges but a significant decrease (P < 0.001) in gp120 meningeal sequences, as well as in both gp120 and nef sequences, from brain tissues (Fig. 2A, bottom). In fact, N10 gp120 sequences from brain tissue showed some of the lowest diversity over all time points in all macaques (Fig. 2A), which could be due to loss of immune control in the brain, resulting in less evolutionary pressure on gp120 or the establishment of a well-adapted brain subpopulation. In each infected macaque, SIV divergence from the infecting viral swarm in plasma revealed that both gp120 and nef sequences rapidly diverged from the founder population, as expected (52), with nef sequences diverging twice as fast as gp120 sequences (P < 0.005) (Fig. 2B).
FIG 2.

Pairwise genetic diversity within linked env gp120 and nef sequence populations and their divergence from the inoculating viral swarm (VS). (A) Pairwise genetic diversity (p distance) within tissue SIV sequence populations over time. The distance between plasma sequences at each time point and brain tissue is graphed as a box-and-whisker plot showing the median (horizontal line), interquartile range (blue or green box), range (vertical black line), and outliers (black dots) in env and nef for each macaque. Plasma samples, collected over time, are indicated by the day of collection. MN, meninges; PL, parietal lobe; FL, frontal lobe; TL, temporal lobe. The asterisks indicate significant differences in diversity between env and nef sequence populations (P < 0.01). (B) Pairwise genetic divergence (p distance) of SIV sequence populations in plasma (indicated by day of collection or brain tissue of origin), meninges, and brain tissues from the viral swarm.
Phylogenetic analysis demonstrates emergence of host-specific nef prior to gp120.
The comparison of gp120 and nef genealogies inferred from longitudinal plasma samples showed noteworthy differences in their evolutionary patterns (Fig. 3) and in their progressive host-specific compartmentalization over time (Table 2). Sequences from different animals were significantly intermixed at 21 days p.i. (Fig. 3, top) in both gp120 (SAI, 0.54) and nef (SAI, 0.21) genealogies, as expected for animals recently infected with the same viral swarm, although diversity among collective nef sequences was more than twice that among gp120 sequences. At 90 days p.i. (Fig. 3, middle), macaque-specific lineages appeared already to be substantially segregated in nef (SAI, 0.06), but not in gp120 (SAI, 0.39), with only two clades in the nef tree showing mixing of two N02 and two N10 sequences. Again, nef diversity in the genealogy was more than twice that of gp120. By 180 days p.i. (Fig. 3, bottom), all sequences of both genes appeared to be completely segregated in host-specific lineages, with only two exceptions in gp120. Compared to 90 days p.i., the diversity within the gp120 tree increased by 0.5%, whereas the genetic variation in nef increased only by 0.1%.
FIG 3.

Maximum-likelihood unrooted genealogies of plasma SIV sequences over time. The top, middle, and bottom panels show genealogies inferred from samples collected at 21 days p.i. (P1), 90 days p.i. (P2), and 180 days p.i. (P3), respectively. Branch lengths are drawn to scale according to the bar at the bottom, corresponding to 0.02 nucleotide substitution per site. Sequences from different macaques are indicated by different colors and shapes at branch tips. The red branches indicate significant bootstrap values at >90%. The genetic variation (D) with standard error for the population of sequences used in each tree is shown. The boxes highlight sequences from one macaque intermixing with sequences from another macaque.
The genealogies inferred from plasma collected at the last sampled time points (N01, 365 and 463 days p.i.; N02, 204 days p.i.; and N10, 223 days p.i.), as well as meninges and brain tissues, showed overall segregation of both gp120 and nef sequences among different macaques (Fig. 4), which was also confirmed by the SAI test (Table 3). In particular, gp120 sequence populations, including brain and meningeal sequences, were segregated, with only one exception (Fig. 4, top). In nef, however, a few exceptions were also noted. The nef genealogy showed 5 meningeal and 1 frontal lobe sequences from N10 that clustered significantly within the N01 clades, while the rest of the N10 meningeal sequences branched appropriately within the N10 sequence clade (Fig. 4, bottom). Four N02 nef brain sequences (2 temporal lobe, 1 parietal lobe, and 1 meningeal) also branched within N10 clades. The intermixing of N02 and N10 nef brain sequences suggests SIV convergent evolution leading to the independent emergence of phylogenetically congruent sequences in the CNS. It is possible that the observed pattern is the result of early establishment of nef variants in meninges/brain tissues, although it seems unlikely, given that nef brain sequences in N02 and N10 were more closely related to late (180 days p.i.) plasma sequences (Fig. S3A and B) than early ones.
FIG 4.

Maximum-likelihood unrooted genealogies for the final plasma collection time point with meninges and brain sequences collected at necropsy. Plasma samples were obtained before the animals were sacrificed at 365 and 463 days p.i. for N01, 204 days p.i. for N02, and 223 days p.i. for N10. The env gp120 and nef genealogies are shown. Branch lengths are drawn to scale according to the bar at the bottom, corresponding to 0.02 nucleotide substitution per site. Macaque sequences and significant branches are colored as shown in the key. The genetic variation (D) with standard error for the population of sequences used in each tree is shown. The boxes highlight sequences from one macaque intermixing with sequences from another macaque. The circled regions of the tree were subjected to signature pattern analysis (Tables 5 and 6). The signature associated with each group (A to D in env and A to C in nef) is shown with its position relative to SIVmm239 in subscript.
TABLE 3.
SAI compartmentalization test for the emergence of macaque-specific viral populations
| Gene | Time point (days p.i.)a | SAIb |
|---|---|---|
| gp120 | 21 | 0.54 |
| 90 | 0.39 | |
| 180 | 0.05 | |
| LTP | 0.01 | |
| nef | 21 | 0.21 |
| 90 | 0.06 | |
| 180 | 0.05 | |
| LTPc | 0.02 |
LTP, last time point.
The SAI test was performed with 1,000 bootstrap replicates on the genealogies given in Fig. 3 and 4. Values of <0.1 were considered significant evidence of compartmentalization (i.e., macaque-specific populations).
N01 LTP, 463 days p.i.; N02, LTP, 204 days p.i.; N10 LTP, 223 days p.i.
Contamination errors cannot account for convergent evolution.
The intermixing of closely related sequences with common ancestry during early infection was expected, while the few sequences that failed to segregate by animal later in infection (>180 days p.i.) may result from convergent evolution. However, we carefully assessed if laboratory errors or contamination could account for any of the observed intermixing between sequences from different macaques in the genealogies. Tissues from each animal were harvested and analyzed months apart (see Materials and Methods for details). Genomic RNA was also extracted and reverse transcribed at different times for each tissue/animal and kept separate from amplified products in the laboratory. Contamination could still have occurred at the level of reamplification of PCR products using nested primers, but these events would likely have resulted in multiple identical clones, which were never observed in our study. Moreover, the progressive compartmentalization and decrease in the SAI observed consistently in both genes show a trend that is hard to explain by random contamination errors. Positive and negative controls in our experiments behaved appropriately. In particular, it is highly unlikely that N10 could be contaminated with N01 or N02 cDNA (or vice versa) due to a 3-month difference in tissue processing, during which the laboratory was routinely checked for traces of contamination. Finally, the gp120 and nef phylogenetic trees, including all sequences, offer no unusual branching that might be the result of cross contamination. Instead, sequences that branched discordantly formed small temporal lineages within each macaque's sequence population.
The evolutionary rate of nef was higher than that of gp120.
We investigated a clock-like signal in each macaque's longitudinal ML genealogy by linear regression of root-to-tip distances against sampling times. Correlation coefficients showed moderate to strong clock-like signals in both gp120 (R2, 0.23 to 0.79), and nef (R2, 0.21 to 0.44). Evolutionary rates were then simultaneously estimated for both genes, using a concatenated gp120-nef alignment, with the Bayesian coalescent framework by enforcing a relaxed molecular clock (Table 4). In each animal, the median estimate of the evolutionary rate in nef was higher than in env. The rates in the nef gene also displayed a larger coefficient of variation, indicating weaker clock-like behavior than in gp120, possibly due to stronger selection pressure.
TABLE 4.
Molecular clock analysis of SIV gp120 and nef sequences from longitudinal plasma samples collected throughout infection
| Subject | Gene | Date range (days p.i.) | Evolutionary ratea | CoVb |
|---|---|---|---|---|
| N01 | gp120 | 463 | 6.9 (4.8–9.4) × 10−5 | 0.7 (0.4–1.0) |
| nef | 463 | 12.5 (8.2–18.8) × 10−5 | 1.4 (1.0–1.9) | |
| N02 | gp120 | 204 | 12.9 (8.1–18.8) × 10−5 | 0.6 (0.3–0.9) |
| nef | 204 | 19.5 (12.2–30.3) × 10−5 | 0.9 (0.5–1.4) | |
| N10 | gp120 | 223 | 5.2 (3.8–6.8) × 10−5 | 0.6 (0.3–0.8) |
| nef | 223 | 11.3 (7.1–16.4) × 10−5 | 0.9 (0.7–1.3) |
Bayesian estimate of the median evolutionary rate in nucleotide substitutions per site per day, with 95% high posterior density intervals given in parentheses.
CoV, coefficient of variation, with 95% high posterior density intervals given in parentheses.
Positively and negatively selected codons were sometimes shared among macaques.
The proportion of codons under selection varied significantly among macaques and tissues of origin of the sampled sequences (plasma over time, meninges, or brain), as well as between the two genes (Table 5). In gp120, codons under positive selection ranged between 0% (N10 brain) and 5.7% (N02 brain), while codons under negative selection ranged between 0.5% (N10 meninges and brain tissues) and 8% (N01 plasma and N02 plasma). Interestingly, the number of gp120 codons under either positive or negative selection was significantly larger in N02, the animal with the fastest disease progression (Table 5). Compared to gp120, positive selection pressure appeared stronger on nef, where the proportion of codons under selection ranged between 0.8% (N02 plasma and meninges and N10 meninges) and 7.6% (N01 plasma). Negative selection pressure on nef appeared even stronger, with the proportion of codons under selection ranging between 2.5% (N02 and N10 meninges) and 11.4% (N10 plasma). In addition, the two animals with substantial brain infection, N02 and N10, showed the largest proportion of nef codons under negative selection in plasma (Table 5), with the animal that developed SIVE (N10) exhibiting a significantly greater number (P < 0.01) of codons under selection (11.4%) than N02 (8.1%), which did not develop neuropathogenesis (Table 1).
TABLE 5.
Numbers and percentages of codons under positive or negative selection in plasma over time and postmortem meningeal and brain sequence populations
Shading indicates that the number of codons under selection in N02 was significantly greater (P < 0.01; one-tailed t test) than in N01 and N10.
Shading indicates that the number of codons under selection in N01 was significantly greater (P < 0.01) than in N02 and N10.
Shading indicates that the number of codons under selection in N02 was significantly greater (P < 0.01) than in N10.
Shading indicates that the number of codons under selection in N10 was significantly greater (P < 0.01) than in N02 (positive selection in plasma) or in both N01 and N02 (negative selection in plasma).
NA, not applicable.
Specific codon positions under selection in gp120 and nef plasma, meningeal, and brain sequences appeared, in general, to be host specific. However, a few instances of potential convergent evolution were also evident. Six positively selected codons in gp120 were identified in all macaques (SIVmm239 reference positions 65, 86, 93, 286, 289, and 375), four of which were located in hypervariable domains (Fig. 5A), while 12 negatively selected codons were shared among macaques (SIVmm239 reference positions 69, 85, 123, 147, 156, 158, 174, 200, 272, 292, 351, and 431) and were found within both variable domains (85, 123, 272, and 292) and conserved regions (69, 147, 156, 158, 174, 200, 351, and 431). In nef, five codons under positive selection were shared among different macaques (SIVmm239 reference positions 39, 191, 201, 240, and 245), none of which were completely buried in the structure (Fig. 5B) but mapped in a region important for N-myristoylation (codon position 39) and around the C-terminal loop and the polyproline motif (positions 191, 201, 240, and 245). Nine negatively selected codons in nef were also shared among macaques (SIVmm239 reference positions 16, 32, 58, 77, 84, 102, 140, 148, and 171).
FIG 5.
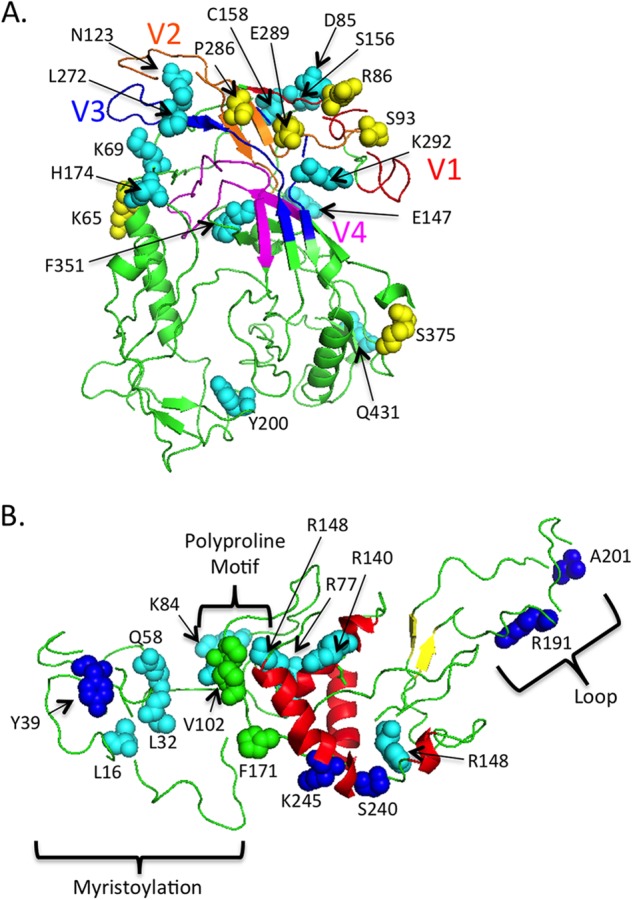
Codons under selection in all macaques mapped on env gp120 and nef structures. (A) env. Variable-loop regions are colored as follows: V1, red; V2, orange; V3, dark blue; V4, magenta. Positively selected codons are shown as yellow spheres, and negatively selected codons are shown as light-blue spheres on a green ribbon structure. Codons under selection are labeled with the single-letter amino acid code followed by the location in the structure. (B) nef. Alpha helices are red, and the beta-sheet formation is yellow on a green ribbon structure. The dark-blue spheres indicate positively selected codons, the light-blue spheres indicate negatively selected codons, and the green spheres represent the polyproline motif. Codons under selection are labeled with the single-letter amino acid code followed by the location in the structure.
Amino acid signatures associated with the major branches of the env and nef phylogenies.
The amino acid signatures associated with four major branches in the env phylogeny were identified (Fig. 4, top, groups A to D). Group A consisted of all N01 sequences and one N02 brain sequence, groups B and C consisted of N02 sequences, and group D consisted of only N10 sequences. Amino acid signature positions frequently demonstrated alterations in charged residues (Table 6). Also, signature positions frequently correlated with recombination hot spots identified in a previous study of early infection in CD8-depleted macaques (21). The amino acid signatures associated with major branches in the nef phylogeny and convergent evolution were also identified (Fig. 4, bottom, groups A to C). Group A consisted of N01 sequences and a subset of five converging N10 sequences derived from meninges, group B consisted of only N02 sequences, and group C consisted of N10 sequences and four converging N02 brain sequences. Signatures associated with group A, whether they were from the N01 or N10, were primarily linked to the myristoylation domain of nef (Table 7). Signatures associated with group C, whether they were from macaque N10 or macaque N02, contained amino acid signatures in a domain associated with major histocompatibility complex class I (MHC-I) downregulation (53–55).
TABLE 6.
Env signature amino acid positions corresponding to major branches in the phylogenetic tree
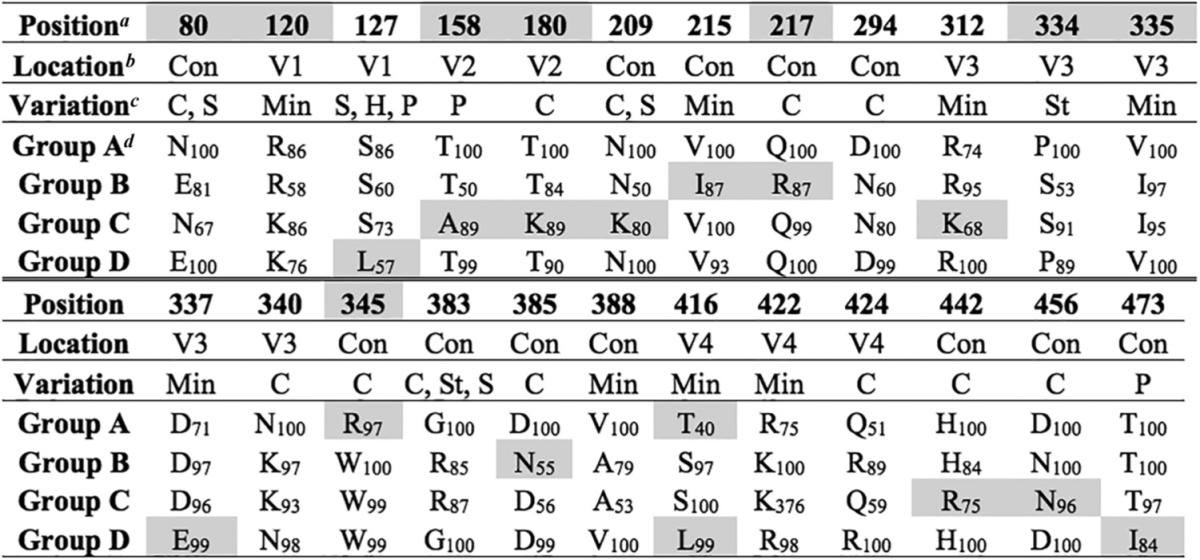
Position, position in the aligned sequences according to SIVmm239 numbering. The shaded cells indicate positions previously associated with recombination in a CD8-depleted macaque model for neuroAIDS (21).
Location, location in the envelope protein. Con, conserved domain; V1 to V4, variable loops 1 to 4.
Variation, variation in amino acid properties at signature positions. C, charge; H, hydrophobicity; P, polarity; S, size; St, structural; Min, minimal.
The group designations correspond to those in Fig. 4. The amino acid residue at the position in the alignment is shown for each group, with its percent appearance. Shading indicates signatures unique to a single group.
TABLE 7.
Nef signature amino acid positions corresponding to major branches in the phylogenetic tree
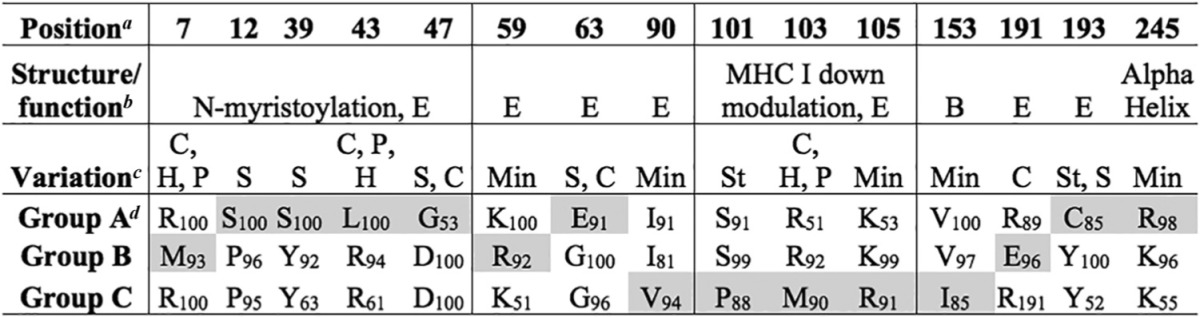
Position, position in the aligned sequences according to SIVmm239 numbering.
Structure/function, regions with known function and their positions in the protein. E, exposed amino acid; B, buried amino acid.
Variation, variation in amino acid properties at signature positions. C, charge; H, hydrophobicity; P, polarity; S, size; St, structural; Min, minimal.
The group designations correspond to those in Fig. 4. The amino acid residue at the position in the alignment is shown for each group, with its percent appearance. Shading indicates signatures unique to a single group.
DISCUSSION
Successful establishment of host-specific viral populations and productive infection in the CNS are key factors in understanding HIV-1 immunopathogenesis and neuropathology. Among the yet unanswered questions are (i) how soon a host-specific population begins to emerge after infection and (ii) how evolutionary changes in different genes affect viral adaptation to the new host. In this study, we used the SIV/macaque model to compare nef and gp120 evolution in three animals intravenously infected with identical viral swarms until progression to SAIDS. gp120 mediates viral entry through receptor-coreceptor binding, while Nef increases infectivity by enhancing the amount of Env incorporated into virus particles (11), which may be due to Nef counteracting an inhibitory effect between gp120 on the virion and CD4 expression on the target cells (12). We identified amino acid signatures in Env that closely correlated with recombination hot spots in a previous study using the model for neuroAIDS with CD8-depleted macaques infected with the same viral swarm (21). This suggests nonrandom evolution and a selective advantage for alterations in these positions in Env during the establishment of infection. A central finding is that, in all animals, nef sequences from plasma diverged from the founder swarm at almost twice the rate of gp120. nef genetic diversity was also greater than the genetic diversity of gp120 during early infection (21 days p.i.), and host-specific nef populations were already evident at 3 months postinfection, while segregation of gp120 sequences occurred within the subsequent 3 months. The data suggest that early adaptation of nef in the new host is essential for successful infection, a suggestion also implied by molecular clock and selection analyses. In longitudinal plasma sequences, several codons conserved among all animals were found to be under positive selection in gp120 hypervariable domains, while negative selection mostly targeted codons in the constant domains; however, an even larger proportion of nef codons were found to be under both positive and negative selection. Moreover, compared to gp120, nef sequences showed higher evolutionary rates, consistent with rapid fixation of mutations under selection, as well as a higher coefficient of variation (weaker clock-like behavior), indicative of nonneutral evolution. Amino acid signatures linked to MHC-I downregulation were associated with converging nef in N02 brain and N10 sequences. Considering studies that have demonstrated a role for MHC-I downmodulation in modifying rates of cytotoxic T lymphocyte (CTL) lysis of infected T cells (56), the current study suggests that the ability of nef to infect brain tissues may be associated with amino acid substitutions that allow it to evade immune detection. Overall, the findings match the notion that adaptive selection of HIV-1 nef in brain may reflect altered requirements for efficient replication in macrophages and brain-specific immune selection pressures (57).
Most positively and negatively selected nef codons were localized to the N-myristoylation domain, which binds myristic acid (a saturated fatty acid) using host-derived N-myristoyl-transferase. Cytotoxic T cells are capable of sensing N-myristoylation of the Nef protein (58–60), which perhaps accounts for the selection observed in the region. Other positively selected codons, consistent among all infected animals, clustered around the C-terminal loop and the polyproline motif required for SH3 binding (61, 62). Recent studies have demonstrated that Nef binding of Hck through its SH3 domain modulates podosome formation, promoting a mesenchymal over an ameboid macrophage migratory mode that can significantly enhance macrophage tissue infiltration and drive the creation of a hidden cellular reservoir of the virus (13, 63). In our animal model, host-specific gp120 and nef sequences were successfully amplified from brain tissues of two of the three infected macaques, yet a few nef sequences from both animals still intermixed, indicating a certain degree of convergent evolution. This observation, coupled with the finding that the proportion of nef codons under negative selection was highest in plasma samples from the same macaques suggests the hypothesis that the emergence of viral strains capable of efficiently invading the CNS may require the fixation of functional Nef capable of altering the macrophage migratory mode. The fixation of nef could also be due to a biological mechanism, such as an early HLA-restricted CTL response, rather than early adaptive viral evolution (64). Further examination of the signatures identified in this study could yield information important for vaccine or therapeutic programs targeting nef.
The results from the present study should be considered with caution, given the small number of infected animals analyzed, yet it is interesting that in the brains of both animals with substantial SIV infection, viral diversity remained approximately equal to that of their last plasma samples, but lower diversity was observed in N10 brain tissues, suggesting a significant bottleneck in N10, possibly related to the establishment of neurotropic strains and the onset of SIVE. The macaque with SIVE was also the one with the strongest selective pressure and highest evolutionary rate in nef, encoding a viral protein known to induce proinflammatory gene expression in astrocytes (65) and to downmodulate CD4 and MHC class I activities (66).
In conclusion, this is the first study to analyze and compare in depth SIV gp120 and nef evolution leading to the progressive emergence of host-specific viral populations and productive infection in the CNS. We showed that viral interaction with the host milieu appears to generate different evolutionary patterns for the two genes and that nef plays a pivotal role in driving the production of neurotropic SIV strains.
ACKNOWLEDGMENTS
This work was supported by National Institutes of Health funding grants R01 NS063897, R01 MH100984, and R01 AI065265.
REFERENCES
- 1.Herbeck JT, Nickle DC, Learn GH, Gottlieb GS, Curlin ME, Heath L, Mullins JI. 2006. Human immunodeficiency virus type 1 env evolves toward ancestral states upon transmission to a new host. J Virol 80:1637–1644. doi: 10.1128/JVI.80.4.1637-1644.2006. [DOI] [PMC free article] [PubMed] [Google Scholar]
- 2.Hamoudi M, Simon-Loriere E, Gasser R, Negroni M. 2013. Genetic diversity of the highly variable V1 region interferes with Human Immunodeficiency Virus type 1 envelope functionality. Retrovirology 10:114. doi: 10.1186/1742-4690-10-114. [DOI] [PMC free article] [PubMed] [Google Scholar]
- 3.Salemi M. 2013. The intra-host evolutionary and population dynamics of human immunodeficiency virus type 1: a phylogenetic perspective. Infect Dis Rep 5:e3. doi: 10.4081/idr.2013.s1.e3. [DOI] [PMC free article] [PubMed] [Google Scholar]
- 4.Hoffman NG, Seillier-Moiseiwitsch F, Ahn J, Walker JM, Swanstrom R. 2002. Variability in the human immunodeficiency virus type 1 gp120 Env protein linked to phenotype-associated changes in the V3 loop. J Virol 76:3852–3864. doi: 10.1128/JVI.76.8.3852-3864.2002. [DOI] [PMC free article] [PubMed] [Google Scholar]
- 5.Simmonds P, Balfe P, Ludlam CA, Bishop JO, Brown AJ. 1990. Analysis of sequence diversity in hypervariable regions of the external glycoprotein of human immunodeficiency virus type 1. J Virol 64:5840–5850. [DOI] [PMC free article] [PubMed] [Google Scholar]
- 6.Salemi M, Burkhardt BR, Gray RR, Ghaffari G, Sleasman JW, Goodenow MM. 2007. Phylodynamics of HIV-1 in lymphoid and non-lymphoid tissues reveals a central role for the thymus in emergence of CXCR4-using quasispecies. PLoS One 2:e950. doi: 10.1371/journal.pone.0000950. [DOI] [PMC free article] [PubMed] [Google Scholar]
- 7.Sinclair E, Barbosa P, Feinberg MB. 1997. The nef gene products of both simian and human immunodeficiency viruses enhance virus infectivity and are functionally interchangeable. J Virol 71:3641–3651. [DOI] [PMC free article] [PubMed] [Google Scholar]
- 8.Mariani R, Kirchhoff F, Greenough TC, Sullivan JL, Desrosiers RC, Skowronski J. 1996. High frequency of defective nef alleles in a long-term survivor with nonprogressive human immunodeficiency virus type 1 infection. J Virol 70:7752–7764. [DOI] [PMC free article] [PubMed] [Google Scholar]
- 9.Kirchhoff F, Greenough TC, Brettler DB, Sullivan JL, Desrosiers RC. 1995. Brief report: absence of intact nef sequences in a long-term survivor with nonprogressive HIV-1 infection. N Engl J Med 332:228–232. doi: 10.1056/NEJM199501263320405. [DOI] [PubMed] [Google Scholar]
- 10.Thompson KA, Kent SJ, Gahan ME, Purcell DF, McLean CA, Preiss S, Dale CJ, Wesselingh SL. 2003. Decreased neurotropism of nef long terminal repeat (nef/LTR)-deleted simian immunodeficiency virus. J Neurovirol 9:442–451. doi: 10.1080/13550280390218715. [DOI] [PubMed] [Google Scholar]
- 11.Schiavoni I, Trapp S, Santarcangelo AC, Piacentini V, Pugliese K, Baur A, Federico M. 2004. HIV-1 Nef enhances both membrane expression and virion incorporation of Env products. A model for the Nef-dependent increase of HIV-1 infectivity. J Biol Chem 279:22996–23006. [DOI] [PubMed] [Google Scholar]
- 12.Tobiume M, Tokunaga K, Kiyokawa E, Takahoko M, Mochizuki N, Tatsumi M, Matsuda M. 2001. Requirement of nef for HIV-1 infectivity is biased by the expression levels of Env in the virus-producing cells and CD4 in the target cells. Arch Virol 146:1739–1751. doi: 10.1007/s007050170060. [DOI] [PubMed] [Google Scholar]
- 13.Verollet C, Souriant S, Bonnaud E, Jolicoeur P, Raynaud-Messina B, Kinnaer C, Fourquaux I, Imle A, Benichou S, Fackler OT, Poincloux R, Maridonneau-Parini I. 2015. HIV-1 reprograms the migration of macrophages. Blood 125:1611–1622. doi: 10.1182/blood-2014-08-596775. [DOI] [PubMed] [Google Scholar]
- 14.Morley SC. 2015. HIV-1 Nef drives macrophages into hiding. Blood 125:1512–1513. doi: 10.1182/blood-2015-01-618983. [DOI] [PubMed] [Google Scholar]
- 15.Lamers SL, Fogel GB, Singer EJ, Salemi M, Nolan DJ, Huysentruyt LC, McGrath MS. 2012. HIV-1 Nef in macrophage-mediated disease pathogenesis. Int Rev Immunol 31:432–450. doi: 10.3109/08830185.2012.737073. [DOI] [PMC free article] [PubMed] [Google Scholar]
- 16.Reeve AB, Pearce NC, Patel K, Augustus KV, Novembre FJ. 2010. Neuropathogenic SIVsmmFGb genetic diversity and selection-induced tissue-specific compartmentalization during chronic infection and temporal evolution of viral genes in lymphoid tissues and regions of the central nervous system. AIDS Res Hum Retroviruses 26:663–679. doi: 10.1089/aid.2009.0168. [DOI] [PMC free article] [PubMed] [Google Scholar]
- 17.Desrosiers RC. 1990. The simian immunodeficiency viruses. Annu Rev Immunol 8:557–578. doi: 10.1146/annurev.iy.08.040190.003013. [DOI] [PubMed] [Google Scholar]
- 18.Burudi EM, Fox HS. 2001. Simian immunodeficiency virus model of HIV-induced central nervous system dysfunction. Adv Virus Res 56:435–468. [DOI] [PubMed] [Google Scholar]
- 19.Strickland SL, Rife BD, Lamers SL, Nolan DJ, Veras NM, Prosperi MC, Burdo TH, Autissier P, Nowlin B, Goodenow MM, Suchard MA, Williams KC, Salemi M. 2014. Spatiotemporal dynamics of SIV brain infection in CD8+ lymphocyte-depleted rhesus macaques with neuroAIDS. J Gen Virol 95:2784–2795. doi: 10.1099/vir.0.070318-0. [DOI] [PMC free article] [PubMed] [Google Scholar]
- 20.Strickland SL, Gray RR, Lamers SL, Burdo TH, Huenink E, Nolan DJ, Nowlin B, Alvarez X, Midkiff CC, Goodenow MM, Williams K, Salemi M. 2012. Efficient transmission and persistence of low-frequency SIVmac251 variants in CD8-depleted rhesus macaques with different neuropathology. J Gen Virol 93:925–938. doi: 10.1099/vir.0.039586-0. [DOI] [PMC free article] [PubMed] [Google Scholar]
- 21.Lamers SL, Nolan DJ, Strickland SL, Prosperi M, Fogel GB, Goodenow MM, Salemi M. 2013. Longitudinal analysis of intra-host simian immunodeficiency virus recombination in varied tissues of the rhesus macaque model for neuroAIDS. J Gen Virol 94:2469–2479. doi: 10.1099/vir.0.055335-0. [DOI] [PMC free article] [PubMed] [Google Scholar]
- 22.Gendelman HE. 2007. Biomarkers, laboratory, and animal models for the design and development of adjunctive therapies for HIV-1 dementia and other neuroinflammatory disorders. J Neuroimmune Pharmacol 2:8–13. doi: 10.1007/s11481-006-9050-2. [DOI] [PubMed] [Google Scholar]
- 23.Williams K, Burdo TH. 2012. Monocyte mobilization, activation markers, and unique macrophage populations in the brain: observations from SIV infected monkeys are informative with regard to pathogenic mechanisms of HIV infection in humans. J Neuroimmune Pharmacol 7:363–371. doi: 10.1007/s11481-011-9330-3. [DOI] [PubMed] [Google Scholar]
- 24.Grivel JC, Shattock RJ, Margolis LB. 2011. Selective transmission of R5 HIV-1 variants: where is the gatekeeper? J Transl Med 9(Suppl 1):S6. doi: 10.1186/1479-5876-9-S1-S6. [DOI] [PMC free article] [PubMed] [Google Scholar]
- 25.Parrish NF, Gao F, Li H, Giorgi EE, Barbian HJ, Parrish EH, Zajic L, Iyer SS, Decker JM, Kumar A, Hora B, Berg A, Cai F, Hopper J, Denny TN, Ding H, Ochsenbauer C, Kappes JC, Galimidi RP, West AP Jr, Bjorkman PJ, Wilen CB, Doms RW, O'Brien M, Bhardwaj N, Borrow P, Haynes BF, Muldoon M, Theiler JP, Korber B, Shaw GM, Hahn BH. 2013. Phenotypic properties of transmitted founder HIV-1. Proc Natl Acad Sci U S A 110:6626–6633. doi: 10.1073/pnas.1304288110. [DOI] [PMC free article] [PubMed] [Google Scholar]
- 26.Lamers SL, Sleasman JW, She JX, Barrie KA, Pomeroy SM, Barrett DJ, Goodenow MM. 1993. Independent variation and positive selection in env V1 and V2 domains within maternal-infant strains of human immunodeficiency virus type 1 in vivo. J Virol 67:3951–3960. [DOI] [PMC free article] [PubMed] [Google Scholar]
- 27.Lamers SL, Sleasman JW, She JX, Barrie KA, Pomeroy SM, Barrett DJ, Goodenow MM. 1994. Persistence of multiple maternal genotypes of human immunodeficiency virus type I in infants infected by vertical transmission. J Clin Invest 93:380–390. doi: 10.1172/JCI116970. [DOI] [PMC free article] [PubMed] [Google Scholar]
- 28.Keele BF, Giorgi EE, Salazar-Gonzalez JF, Decker JM, Pham KT, Salazar MG, Sun C, Grayson T, Wang S, Li H, Wei X, Jiang C, Kirchherr JL, Gao F, Anderson JA, Ping LH, Swanstrom R, Tomaras GD, Blattner WA, Goepfert PA, Kilby JM, Saag MS, Delwart EL, Busch MP, Cohen MS, Montefiori DC, Haynes BF, Gaschen B, Athreya GS, Lee HY, Wood N, Seoighe C, Perelson AS, Bhattacharya T, Korber BT, Hahn BH, Shaw GM. 2008. Identification and characterization of transmitted and early founder virus envelopes in primary HIV-1 infection. Proc Natl Acad Sci U S A 105:7552–7557. doi: 10.1073/pnas.0802203105. [DOI] [PMC free article] [PubMed] [Google Scholar]
- 29.Li H, Bar KJ, Wang S, Decker JM, Chen Y, Sun C, Salazar-Gonzalez JF, Salazar MG, Learn GH, Morgan CJ, Schumacher JE, Hraber P, Giorgi EE, Bhattacharya T, Korber BT, Perelson AS, Eron JJ, Cohen MS, Hicks CB, Haynes BF, Markowitz M, Keele BF, Hahn BH, Shaw GM. 2010. High multiplicity infection by HIV-1 in men who have sex with men. PLoS Pathog 6:e1000890. doi: 10.1371/journal.ppat.1000890. [DOI] [PMC free article] [PubMed] [Google Scholar]
- 30.Bar KJ, Li H, Chamberland A, Tremblay C, Routy JP, Grayson T, Sun C, Wang S, Learn GH, Morgan CJ, Schumacher JE, Haynes BF, Keele BF, Hahn BH, Shaw GM. 2010. Wide variation in the multiplicity of HIV-1 infection among injection drug users. J Virol 84:6241–6247. doi: 10.1128/JVI.00077-10. [DOI] [PMC free article] [PubMed] [Google Scholar]
- 31.Boutwell CL, Rolland MM, Herbeck JT, Mullins JI, Allen TM. 2010. Viral evolution and escape during acute HIV-1 infection. J Infect Dis 202(Suppl 2):S309–S314. doi: 10.1086/655653. [DOI] [PMC free article] [PubMed] [Google Scholar]
- 32.National Research Council Committee for the Update of the Guide for the Care and Use of Laboratory Animals. 2011. Guide for the care and use of laboratory animals, 8th ed. National Academies Press, Washington, DC. [Google Scholar]
- 33.Hunt RD, Blake BJ, Chalifoux LV, Sehgal PK, King NW, Letvin NL. 1983. Transmission of naturally occurring lymphoma in macaque monkeys. Proc Natl Acad Sci U S A 80:5085–5089. doi: 10.1073/pnas.80.16.5085. [DOI] [PMC free article] [PubMed] [Google Scholar]
- 34.Strickland SL, Gray RR, Lamers SL, Burdo TH, Huenink E, Nolan DJ, Nowlin B, Alvarez X, Midkiff CC, Goodenow MM, Williams K, Salemi M. 2011. Significant genetic heterogeneity of the SIVmac251 viral swarm derived from different sources. AIDS Res Hum Retroviruses 27:1327–1332. doi: 10.1089/aid.2011.0100. [DOI] [PMC free article] [PubMed] [Google Scholar]
- 35.Palmer S, Kearney M, Maldarelli F, Halvas EK, Bixby CJ, Bazmi H, Rock D, Falloon J, Davey RT Jr, Dewar RL, Metcalf JA, Hammer S, Mellors JW, Coffin JM. 2005. Multiple, linked human immunodeficiency virus type 1 drug resistance mutations in treatment-experienced patients are missed by standard genotype analysis. J Clin Microbiol 43:406–413. doi: 10.1128/JCM.43.1.406-413.2005. [DOI] [PMC free article] [PubMed] [Google Scholar]
- 36.Stephens EB, Liu ZQ, Zhu GW, Adany I, Joag SV, Foresman L, Berman NE, Narayan O. 1995. Lymphocyte-tropic simian immunodeficiency virus causes persistent infection in the brains of rhesus monkeys. Virology 213:600–614. doi: 10.1006/viro.1995.0032. [DOI] [PubMed] [Google Scholar]
- 37.Thompson JD, Higgins DG, Gibson TJ. 1994. CLUSTAL W: improving the sensitivity of progressive multiple sequence alignment through sequence weighting, position-specific gap penalties and weight matrix choice. Nucleic Acids Res 22:4673–4680. doi: 10.1093/nar/22.22.4673. [DOI] [PMC free article] [PubMed] [Google Scholar]
- 38.Tamura K, Peterson D, Peterson N, Stecher G, Nei M, Kumar S. 2011. MEGA5: molecular evolutionary genetics analysis using maximum likelihood, evolutionary distance, and maximum parsimony methods. Mol Biol Evol 28:2731–2739. doi: 10.1093/molbev/msr121. [DOI] [PMC free article] [PubMed] [Google Scholar]
- 39.Lamers SL, Sleasman JW, Goodenow MM. 1996. A model for alignment of Env V1 and V2 hypervariable domains from human and simian immunodeficiency viruses. AIDS Res Hum Retroviruses 12:1169–1178. doi: 10.1089/aid.1996.12.1169. [DOI] [PubMed] [Google Scholar]
- 40.Huson DH, Bryant D. 2006. Application of phylogenetic networks in evolutionary studies. Mol Biol Evol 23:254–267. [DOI] [PubMed] [Google Scholar]
- 41.Salemi M, Gray RR, Goodenow MM. 2008. An exploratory algorithm to identify intra-host recombinant viral sequences. Mol Phylogenet Evol 49:618–628. doi: 10.1016/j.ympev.2008.08.017. [DOI] [PMC free article] [PubMed] [Google Scholar]
- 42.Lamers SL, Salemi M, Galligan DC, de Oliveira T, Fogel GB, Granier SC, Zhao L, Brown JN, Morris A, Masliah E, McGrath MS. 2009. Extensive HIV-1 intra-host recombination is common in tissues with abnormal histopathology. PLoS One 4:e5065. doi: 10.1371/journal.pone.0005065. [DOI] [PMC free article] [PubMed] [Google Scholar]
- 43.Martin D, Rybicki E. 2000. RDP: detection of recombination amongst aligned sequences. Bioinformatics 16:562–563. doi: 10.1093/bioinformatics/16.6.562. [DOI] [PubMed] [Google Scholar]
- 44.Schwartz G. 1978. Estimating the dimension of a model. Ann Stat 6:461–464. doi: 10.1214/aos/1176344136. [DOI] [Google Scholar]
- 45.Guindon S, Dufayard JF, Lefort V, Anisimova M, Hordijk W, Gascuel O. 2010. New algorithms and methods to estimate maximum-likelihood phylogenies: assessing the performance of PhyML 3.0. Syst Biol 59:307–321. doi: 10.1093/sysbio/syq010. [DOI] [PubMed] [Google Scholar]
- 46.Wang TH, Donaldson YK, Brettle RP, Bell JE, Simmonds P. 2001. Identification of shared populations of human immunodeficiency virus type 1 infecting microglia and tissue macrophages outside the central nervous system. J Virol 75:11686–11699. doi: 10.1128/JVI.75.23.11686-11699.2001. [DOI] [PMC free article] [PubMed] [Google Scholar]
- 47.Drummond AJ, Suchard MA, Xie D, Rambaut A. 2012. Bayesian phylogenetics with BEAUti and the BEAST 1.7. Mol Biol Evol 29:1969–1973. doi: 10.1093/molbev/mss075. [DOI] [PMC free article] [PubMed] [Google Scholar]
- 48.Murrell B, Moola S, Mabona A, Weighill T, Sheward D, Kosakovsky Pond SL, Scheffler K. 2013. FUBAR: a fast, unconstrained Bayesian approximation for inferring selection. Mol Biol Evol 30:1196–1205. doi: 10.1093/molbev/mst030. [DOI] [PMC free article] [PubMed] [Google Scholar]
- 49.Roy A, Kucukural A, Zhang Y. 2010. I-TASSER: a unified platform for automated protein structure and function prediction. Nat Protoc 5:725–738. doi: 10.1038/nprot.2010.5. [DOI] [PMC free article] [PubMed] [Google Scholar]
- 50.Zhang Y. 2008. I-TASSER server for protein 3D structure prediction. BMC Bioinformatics 9:40. doi: 10.1186/1471-2105-9-40. [DOI] [PMC free article] [PubMed] [Google Scholar]
- 51.Burdo TH, Weiffenbach A, Woods SP, Letendre S, Ellis RJ, Williams KC. 2013. Elevated sCD163 in plasma but not cerebrospinal fluid is a marker of neurocognitive impairment in HIV infection. AIDS 27:1387–1395. doi: 10.1097/QAD.0b013e32836010bd. [DOI] [PMC free article] [PubMed] [Google Scholar]
- 52.Shankarappa R, Margolick JB, Gange SJ, Rodrigo AG, Upchurch D, Farzadegan H, Gupta P, Rinaldo CR, Learn GH, He X, Huang XL, Mullins JI. 1999. Consistent viral evolutionary changes associated with the progression of human immunodeficiency virus type 1 infection. J Virol 73:10489–10502. [DOI] [PMC free article] [PubMed] [Google Scholar]
- 53.DeGottardi MQ, Specht A, Metcalf B, Kaur A, Kirchhoff F, Evans DT. 2008. Selective downregulation of rhesus macaque and sooty mangabey major histocompatibility complex class I molecules by Nef alleles of simian immunodeficiency virus and human immunodeficiency virus type 2. J Virol 82:3139–3146. doi: 10.1128/JVI.02102-07. [DOI] [PMC free article] [PubMed] [Google Scholar]
- 54.Munch J, Schindler M, Wildum S, Rucker E, Bailer N, Knoop V, Novembre FJ, Kirchhoff F. 2005. Primary sooty mangabey simian immunodeficiency virus and human immunodeficiency virus type 2 nef alleles modulate cell surface expression of various human receptors and enhance viral infectivity and replication. J Virol 79:10547–10560. doi: 10.1128/JVI.79.16.10547-10560.2005. [DOI] [PMC free article] [PubMed] [Google Scholar]
- 55.Piguet V, Trono D. 1999. A structure-function analysis of the Nef protein of primate lentiviruses. Theoretical Biology and Biophysics Group, Los Alamos National Laboratory, Los Alamos, NM. [Google Scholar]
- 56.Schindler M, Schmokel J, Specht A, Li H, Munch J, Khalid M, Sodora DL, Hahn BH, Silvestri G, Kirchhoff F. 2008. Inefficient Nef-mediated downmodulation of CD3 and MHC-I correlates with loss of CD4+ T cells in natural SIV infection. PLoS Pathog 4:e1000107. doi: 10.1371/journal.ppat.1000107. [DOI] [PMC free article] [PubMed] [Google Scholar]
- 57.Olivieri KC, Agopian KA, Mukerji J, Gabuzda D. 2010. Evidence for adaptive evolution at the divergence between lymphoid and brain HIV-1 nef genes. AIDS Res Hum Retroviruses 26:495–500. doi: 10.1089/aid.2009.0257. [DOI] [PMC free article] [PubMed] [Google Scholar]
- 58.Morita D, Igarashi T, Horiike M, Mori N, Sugita M. 2011. Cutting edge: T cells monitor N-myristoylation of the Nef protein in simian immunodeficiency virus-infected monkeys. J Immunol 187:608–612. doi: 10.4049/jimmunol.1101216. [DOI] [PubMed] [Google Scholar]
- 59.Mortara L, Letourneur F, Villefroy P, Beyer C, Gras-Masse H, Guillet JG, Bourgault-Villada I. 2000. Temporal loss of Nef-epitope CTL recognition following macaque lipopeptide immunization and SIV challenge. Virology 278:551–561. doi: 10.1006/viro.2000.0671. [DOI] [PubMed] [Google Scholar]
- 60.Morita D, Yamamoto Y, Suzuki J, Mori N, Igarashi T, Sugita M. 2013. Molecular requirements for T cell recognition of N-myristoylated peptides derived from the simian immunodeficiency virus Nef protein. J Virol 87:482–488. doi: 10.1128/JVI.02142-12. [DOI] [PMC free article] [PubMed] [Google Scholar]
- 61.Arold S, Franken P, Strub MP, Hoh F, Benichou S, Benarous R, Dumas C. 1997. The crystal structure of HIV-1 Nef protein bound to the Fyn kinase SH3 domain suggests a role for this complex in altered T cell receptor signaling. Structure 5:1361–1372. doi: 10.1016/S0969-2126(97)00286-4. [DOI] [PubMed] [Google Scholar]
- 62.Lee CH, Saksela K, Mirza UA, Chait BT, Kuriyan J. 1996. Crystal structure of the conserved core of HIV-1 Nef complexed with a Src family SH3 domain. Cell 85:931–942. doi: 10.1016/S0092-8674(00)81276-3. [DOI] [PubMed] [Google Scholar]
- 63.Alvarado JJ, Tarafdar S, Yeh JI, Smithgall TE. 2014. Interaction with the Src homology (SH3-SH2) region of the Src-family kinase Hck structures the HIV-1 Nef dimer for kinase activation and effector recruitment. J Biol Chem 289:28539–28553. doi: 10.1074/jbc.M114.600031. [DOI] [PMC free article] [PubMed] [Google Scholar]
- 64.Herbeck JT, Rolland M, Liu Y, McLaughlin S, McNevin J, Zhao H, Wong K, Stoddard JN, Raugi D, Sorensen S, Genowati I, Birditt B, McKay A, Diem K, Maust BS, Deng W, Collier AC, Stekler JD, McElrath MJ, Mullins JI. 2011. Demographic processes affect HIV-1 evolution in primary infection before the onset of selective processes. J Virol 85:7523–7534. doi: 10.1128/JVI.02697-10. [DOI] [PMC free article] [PubMed] [Google Scholar]
- 65.van Marle G, Henry S, Todoruk T, Sullivan A, Silva C, Rourke SB, Holden J, McArthur JC, Gill MJ, Power C. 2004. Human immunodeficiency virus type 1 Nef protein mediates neural cell death: a neurotoxic role for IP-10. Virology 329:302–318. doi: 10.1016/j.virol.2004.08.024. [DOI] [PubMed] [Google Scholar]
- 66.Gray LR, Gabuzda D, Cowley D, Ellett A, Chiavaroli L, Wesselingh SL, Churchill MJ, Gorry PR. 2011. CD4 and MHC class 1 down-modulation activities of nef alleles from brain- and lymphoid tissue-derived primary HIV-1 isolates. J Neurovirol 17:82–91. doi: 10.1007/s13365-010-0001-6. [DOI] [PMC free article] [PubMed] [Google Scholar]