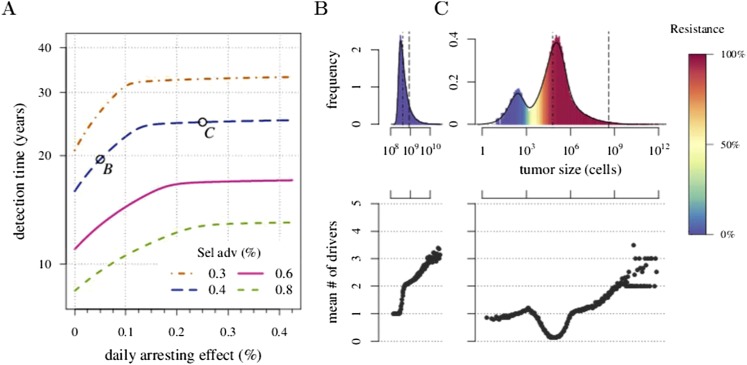
Appendix 1—figure 2. Trade-off between growth and resistance under different treatment regimes.
(A) Analytically derived times for a tumour to reach 109 cells (see Equation 12). (B) and (C) Sample distributions in relative frequencies, adjusted for bins over periods of 0.5 in logarithmic scale for corresponding points B and C, shown in plot A. Dashed black line is the mean and the dashed-and-dotted line is the median. The bottom panel shows the mean number of additionally accumulated drivers for all detected tumours over the same intervals of 3 months. The colour-code indicates the level of resistance in detected tumours over these intervals. Maximal number of additionally accumulated drivers is 5. Parameters otherwise as in Table 1.

