

Abstract
Sex determination evolves rapidly, often because of turnover of the genes at the top of the pathway. The house fly, Musca domestica, has a multifactorial sex determination system, allowing us to identify the selective forces responsible for the evolutionary turnover of sex determination in action. There is a male determining factor, M, on the Y chromosome (YM), which is probably the ancestral state. An M factor on the third chromosome (IIIM) has reached high frequencies in multiple populations across the world, but the evolutionary forces responsible for the invasion of IIIM are not resolved. To test whether the IIIM chromosome invaded because of sex-specific selection pressures, we used mRNA sequencing to determine whether isogenic males that differ only in the presence of the YM or IIIM chromosome have different gene expression profiles. We find that more genes are differentially expressed between YM and IIIM males in testis than head, and that genes with male-biased expression are most likely to be differentially expressed between YM and IIIM males. We additionally find that IIIM males have a “masculinized” gene expression profile, suggesting that the IIIM chromosome has accumulated an excess of male-beneficial alleles because of its male-limited transmission. These results are consistent with the hypothesis that sex-specific selection acts on alleles linked to the male-determining locus driving evolutionary turnover in the sex determination pathway.
Keywords: sex determination, gene expression, RNA-Seq, sex-specific selection, sex chromosomes
Introduction
Sex determination (SD) is an essential developmental process responsible for sexually dimorphic phenotypes. It is therefore paradoxical that SD pathways are poorly conserved, with master SD (MSD) genes at the top of the pathway differing between closely related species and even variable within species (Bull 1983; Wilkins 1995; Pomiankowski et al. 2004; Beukeboom and Perrin 2014). The hypotheses to explain the rapid evolution of SD pathways fall into three categories. First, SD evolution may be selectively neutral if MSD turnover is the result of mutational input without phenotypic or fitness consequences (van Doorn 2014). Second, frequency dependent (sex-ratio) selection could favor a new MSD variant if one sex is below its equilibrium frequency (Eshel 1975; Bull and Charnov 1977; Bulmer and Bull 1982; Werren and Beukeboom 1998). Third, a new MSD locus can invade a population if the new MSD variant itself or genetically linked alleles confer a fitness benefit (Charlesworth D and Charlesworth B 1980; Rice 1986; Charlesworth 1991; van Doorn and Kirkpatrick 2007, 2010). Those fitness effects could be beneficial to both sexes (natural selection), increase the reproductive success of the sex determined by the new MSD variant (sexual selection), or be beneficial to the sex determined by the MSD variant and deleterious to the other sex (sexually antagonistic selection). Sexually antagonistic selection is predicted to be an especially important driver of MSD turnover because linkage to an MSD locus allows the sexually antagonistic allele to be inherited in a sex-limited manner, thereby resolving the intersexual conflict (Charlesworth D and Charlesworth B 1980; van Doorn and Kirkpatrick 2007, 2010; Roberts et al. 2009).
The house fly, Musca domestica, is an ideal model for testing hypotheses about the evolution of SD because it has a multifactorial SD system, with male- and female-determining loci segregating in natural populations (Dübendorfer et al. 2002; Hamm et al. 2015). Most relevant to the work presented here is the fact that the male-determining factor, M, can be located on the Y chromosome (YM), any of the five autosomes (AM), and even the X chromosome (Hamm et al. 2015). It is unknown whether these M-factors are the same gene in different locations or different genes that have independently assumed the role of an MSD locus (Bopp 2010). YM is a common arrangement (Hamm et al. 2015), and it is thought to be the ancestral state because it is the genotype found in close relatives of the house fly (Boyes et al. 1964; Boyes and Van Brink 1965; Dübendorfer et al. 2002). M on the third chromosome (IIIM) is also common, but it is not clear what was responsible for the invasion of the IIIM chromosome (Hamm et al. 2015). Note that when the M factor arrived on chromosome III, this entire chromosome essentially assumed Y-like properties, including male-biased transmission and reduced recombination (Hamm et al. 2015). However, the IIIM chromosome is not a degenerated Y chromosome because IIIM homozygotes are viable, fertile, and found in natural populations (Hamm et al. 2015). Identifying the selective forces responsible for the invasion of IIIM will be a powerful test of the hypotheses to explain SD evolution.
Strong linkage to AM is expected for alleles on the same autosome because recombination is low or nonexistent in house fly males (Hiroyoshi 1961; Hamm et al. 2015), but see Feldmeyer et al. (2010). It is possible that AM chromosomes invaded house fly populations because of selection on phenotypic effects of either the autosomal M loci themselves or alleles linked to M-factors (Franco et al. 1982; Tomita and Wada 1989a; Kozielska et al. 2006; Feldmeyer et al. 2008). M variants are known to have subtle phenotypic effects, which include differential splicing and expression of SD pathway genes between YM and AM males (Schmidt et al. 1997; Hediger et al. 2004; Siegenthaler et al. 2009). In addition, AM chromosomes form stable latitudinal clines on multiple continents (Franco et al. 1982; Tomita and Wada 1989b; Hamm et al. 2005; Kozielska et al. 2008), and seasonality in temperature is somewhat predictive of their distribution (Feldmeyer et al. 2008). Furthermore, in laboratory experiments, IIIM males outcompeted YM males for female mates; the IIIM chromosome increased in frequency over generations in population cages; and IIIM males had higher rates of emergence from pupae than YM males (Hamm et al. 2009). The most specific phenotype that has been linked to AM is insecticide resistance (Kerr 1960, 1961, 1970; Denholm et al. 1983; Kence M and Kence A 1992), but insecticide resistance alone cannot entirely explain the invasion of AM chromosomes (Shono and Scott 1990; Hamm et al. 2005). These results all support the hypothesis that natural, sexual, or sexually antagonistic selection on M variants or linked alleles drove the invasion of AM chromosomes.
To test whether sex-specific selection pressures could be responsible for the invasion of the IIIM chromosome, we used high-throughput mRNA sequencing (mRNA-Seq) to compare gene expression profiles between nearly isogenic YM and IIIM males that only differ in their M-bearing chromosome. These contrasts are essentially a comparison between flies with the ancestral Y chromosome (YM) and individuals with a recently evolved “neo-Y” (IIIM). The gene expression differences we detected were the result of both differentiation of cis regulatory regions between the IIIM and “standard” third chromosome and trans effects of the IIIM and/or YM chromosome(s) on expression throughout the genome. We found that genes responsible for male phenotypes are more likely to be differentially expressed between YM and IIIM males, suggesting that YM and IIIM males have phenotypic differences that would be differentially affected by male-specific selection pressures. We also found that IIIM males have a “masculinized” gene expression profile. These results support the hypothesis that sexual or sexually antagonistic selection drives evolutionary turnover at the top of SD pathways.
Materials and Methods
Strains
We compared gene expression between two nearly isogenic house fly strains that differ only in the chromosome carrying M. The first, Cornell susceptible (CS), is an inbred, lab adapted strain with XX males that are heterozygous for a IIIM chromosome and a standard third chromosome that lacks an M factor (X/X; ) (Scott et al. 1996; Hamm et al. 2005) (fig. 1A). CS females are XX and homozygous for the standard third chromosome (X/X; ). We created a strain with YM males that has the X chromosome and all standard autosomes from the CS strain. To do so, we used a backcrossing approach to move the Y chromosome from the genome strain (aabys) onto the CS background (fig. 1B), creating the strain CS-aabys-Y (CSaY). CSaY males are XY and homozygous for the standard CS third chromosome (X/Y; ). The aabys strain has a recessive phenotypic marker on each of the five autosomes (Wagoner 1967; Tomita and Wada 1989b). To confirm that the aabys autosomes had been purged from the CSaY genome, we crossed CSaY flies to aabys and observed only wild-type progeny. CS and CSaY males are nearly isogenic, differing only in that CS males are XX and heterozygous for the IIIM and standard IIICS chromosomes, and CSaY males are XY and homozygous for the standard IIICS chromosome (fig. 1). Females are genetically identical between strains.
Fig. 1.—
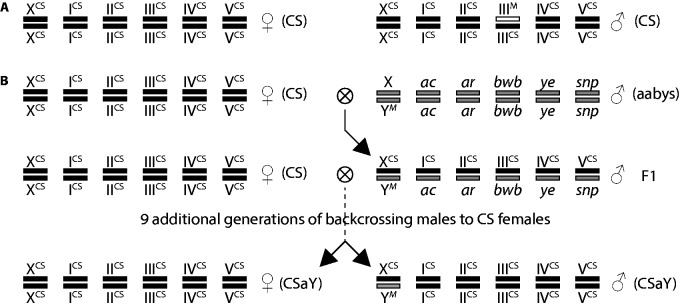
Genotypes of flies. (A) Genotypes of CS males and females. (B) Crossing scheme used to generate the CSaY (YM) strain. Each pair of parallel rectangles represents homologous chromosomes; there is one pair of sex chromosomes (X and Y) and five autosomes. Chromosomes of CS origin are black and indicated by “CS,” except for the IIIM chromosome which is white. Chromosomes of aabys origin are gray, and the aabys strain has a recessive phenotypic marker on each autosome. Females from the CS strain were crossed to aabys males, and the male progeny were backcrossed to CS females for ten generations to create the CSaY strain. Because there is no recombination in XY males, CS and CSaY are isogenic except that the CSaY males have a Y chromosome and CS males have a IIIM chromosome.
We are confident that the strains are isogenic except for the M-bearing chromosome because there is very little evidence for recombination in male house flies with an XY genotype (Hiroyoshi 1961; Hamm et al. 2015). However, if there were minimal recombination between the CS and aabys chromosomes in our crossing scheme, the majority of autosomal alleles in the CSaY strain would still have originated from the CS genotype, with very little contribution from aabys autosomes.
Samples and mRNA-Seq
CS and CSaY flies were kept at 25 °C with a 12:12 h light:dark cycle. Larvae were reared in media made with 1.8 l water, 500 g calf manna (Manna Pro, St. Louis, MO), 120 g bird and reptile litter wood chips (Northeastern Products, Warrensburg, NY), 60 g dry active baker’s yeast (MP Biomedical Solon, OH), and 1.21 kg wheat bran (Cargill Animal Nutrition, Minneapolis, MN), as described previously (Hamm et al. 2009).
We sampled two types of tissue from CS and CSaY males and females: Head and gonad. All dissections were performed on living, nonanesthetized 4- to 6-day-old unmated adult flies. Heads were separated from males and females, homogenized in TRIzol reagent (Life Technologies) using a motorized grinder, and RNA was extracted on QIAGEN RNeasy columns following the manufacturer’s instructions including a genomic DNA (gDNA) elimination step. Testes were dissected from males, and ovaries were dissected from females in Ringer’s solution (182 mM KCl, 46 mM NaCl, 3 mM CaCl2, 10 mM Tris–Cl in ddH2O). Ovary and testis samples were dissolved in TRIzol and RNA was extracted on QIAGEN RNeasy columns with gDNA elimination. Three biological replicates of CS (IIIM) male heads, CSaY (YM) male heads, CS testes, and CSaY testes were collected; one sample was collected for each of the four female dissections (CS head, CSaY head, CS ovary, and CSaY ovary).
Barcoded mRNA-Seq libraries were prepared using the Illumina TruSeq kit following the manufacturer’s instructions. Briefly, mRNA was purified using oligo-dT magnetic beads, cDNA was synthesized using random hexamer primers, and sequencing libraries were constructed using the cDNA. The samples were run on two lanes of an Illumina HiSeq2500 at the Cornell Medical School Genomics Resources Core Facility. One lane had the eight head samples, and the other lane had the eight gonad (testis and ovary) samples. We generated 101-bp single-end reads, and the sequencing reads were processed using Casava 1.8.2.
mRNA-Seq Data Analysis
Illumina mRNA-Seq reads were aligned to house fly genome assembly v2.0.2 and annotation release 100 (Scott et al. 2014) using TopHat2 v2.0.8b (Kim et al. 2013) and Bowtie v2.1.0.0 (Langmead et al. 2009) with the default parameters. We tested for differential expression between males and females and between YM and IIIM males using the Cuffdiff program in the Cufflinks v2.2.1 package (Trapnell et al. 2013) with the default parameters, including geometric normalization. We used a false discovery rate (FDR) corrected P value of 0.05 to identify genes that are differentially expressed (Benjamini and Hochberg 1995). Genes were considered not differentially expressed if Cuffdiff returned an “OK” value for the test status (at least ten reads aligned to the transcript, and data were sufficient for testing for differential expression) but the expression levels were not significantly different. Genes without an “OK” value were not included in downstream analyses. We repeated this analysis by also requiring a 2-fold difference in expression to call genes as differentially expressed. In comparisons between male and female expression levels, we treated all six male samples as biological replicates and did the same for both female samples. We also repeated the analysis using only two replicates of each sample to control for sample-size effects.
We used expression level estimates from Cuffdiff2 (Fragments Per Kilobase of transcript per Million mapped reads) to calculate correlations of expression levels between our experimental samples (supplementary fig. S1, Supplementary Material online). Only genes with an “OK” value for test status in Cuffdiff were included. The correlations between testis and ovary expressions are lowest, which is expected because they are dramatically different tissues. The correlations between male and female head samples are substantially higher than between testis and ovary, but still lower than the correlations within sexes. The two ovary samples are more highly correlated than any of the pairwise comparisons between CS and CSaY testis samples (supplementary fig. S1, Supplementary Material online), most likely because CS and CSaY females are genetically identical (fig. 1). All data analysis was performed in the R statistical programming environment (R Core Team 2015).
Chromosomal Assignments of House Fly Genes
The house fly genomic scaffolds have not formally been assigned to chromosomes, but homologies have been inferred between house fly chromosomes and the five major chromosome arms of Drosophila, also known as Muller elements A–E (Foster et al. 1981; Weller and Foster 1993). Additionally, the house fly X chromosome is most likely homologous to the Drosophila dot chromosome (Muller element F, or Drosophila melanogaster chromosome 4) (Vicoso and Bachtrog 2013, 2015). We therefore assigned house fly genes that are conserved as one-to-one orthologs with D. melanogaster (Scott et al. 2014) to house fly chromosomes based on the Muller element mapping of the D. melanogaster orthologs. For our analysis of gene families that are differentially expressed between YM and IIIM males, we assigned house fly scaffolds to chromosomes based on the Muller element mapping of the majority of D. melanogaster orthologs on each scaffold.
Gene Ontology Analysis
We used the predicted D. melanogaster orthologs (Scott et al. 2014) to infer the functions of house fly genes. Gene ontology (GO) annotations of house fly genes were determined using BLAST2GO (Conesa et al. 2005; Götz et al. 2008) as described previously (Scott et al. 2014). We then used BLAST2GO to identify GO classes that are enriched among differentially expressed genes relative to nondifferentially expressed genes using an FDR-corrected Fisher’s exact test (FET) (Benjamini and Hochberg 1995).
Quantitative Polymerase Chain Reaction Validation of Differentially Expressed Genes
We used quantitative polymerase chain reaction (qPCR) on cDNA to validate the differential expression of four genes between YM and IIIM testes. Dissections of testes were performed as described above on three batches of YM and IIIM males each (i.e., three biological replicates of each strain). RNA was extracted from testes using TRIzol homogenization followed by purification using Direct-zol RNA MiniPrep columns (Zymo Research). We synthesized cDNA using M-MLV reverse transcriptase (Promega) with oligo-dT primers following the manufacturer’s instructions. We designed PCR primers to amplify a 71–110 bp product at the 3′-end of each transcript, with one primer on either side of the 3′-most annotated intron when possible (supplementary table S1, Supplementary Material online). We also designed primers to amplify one transcript that was not differentially expressed between YM and IIIM males or between males and females in either gonad or head in our mRNA-Seq analysis (XM_005187313). We tested our primer pairs with PCR using testis cDNA as a template to validate that they amplify a single product.
We then performed qPCR on three technical replicates of five serial dilutions of 1/5 each using a 60 °C annealing temperature on an Applied Biosystems StepOnePlus Real-Time PCR System with Power SYBR Green PCR Master Mix (Life Technologies) following the manufacturer’s instructions. We assigned a threshold cycle (CT) to the qPCR curves, and we validated that the primer pairs gave a linear relationship between CT and concentration. We next used the same reagents and equipment to perform qPCR using each primer pair on three technical replicates of the three biological replicates from both strains (18 samples total), with the samples interspersed on a 96-well plate to avoid batch effects. In addition to the 18 samples, each qPCR plate contained three technical replicates of a five-step 1/5 serial dilution (15 samples). Those 33 samples were amplified by qPCR using primers for a gene that was detected as differentially expressed using mRNA-Seq and the 33 samples were also amplified with primers in our control gene (XM_005187313), for a total of 66 reactions on a single plate. From each plate, we constructed a standard curve for each primer pair using the relationship between CT and concentration from our serial dilutions, and we used the slope of these lines to estimate the initial concentration of our template cDNA in each sample. We divided the initial concentration for our experimental gene by the estimated concentration for the control gene to determine a relative concentration for the experimental gene for each of the technical replicates.
To test for differential expression between YM and IIIM samples, we first constructed a linear model with replicates nested within strains predicting the relative concentration of the gene in the R statistical programming environment (R Core Team 2015). We then used Tukey’s Honest Significant Differences method to perform an analysis of variance to determine whether there is a significant effect of strain on expression level.
Results
Genes on the House Fly Third Chromosome Are More Likely to Be Differentially Expressed between YM and IIIM Males than Genes on Other Autosomes
We used mRNA-Seq to compare gene expression in heads and gonads of house fly males and females of a YM strain (CSaY) and a IIIM strain (CS). Males of the IIIM strain are XX and heterozygous for the IIIM chromosome and a standard third chromosome without M (fig. 1A). Males of the YM strain are XY (with the same X as the IIIM strain) and homozygous for the standard third chromosome found in the IIIM strain (fig. 1B). The rest of the genome is isogenic, and females of the two strains are genetically identical (fig. 1).
We detected 873 and 1,338 genes that are differentially expressed between YM and IIIM males in heads or testes, respectively, at an FDR-corrected P value of 0.05 (table 1 and supplementary fig. S2 and supplementary data, Supplementary Material online). Genes on the house fly third chromosome are more likely than genes on other autosomes to be differentially expressed between YM and IIIM males (fig. 2A). Approximately 30% of the differentially expressed genes are predicted to be on the third chromosome, which is greater than the fraction assigned to any of the other four autosomes (14.8–20.6%). There is a slight, but significant, signal of higher expression from the third chromosome in YM males when compared with IIIM males (fig. 2B), and a significant excess of third chromosome genes is upregulated in YM males (supplementary fig. S3, Supplementary Material online). However, a significant excess of third chromosome genes is also upregulated in IIIM males (supplementary fig. S3, Supplementary Material online), suggesting that the differential expression of third chromosome genes between YM and IIIM males is not the result of degeneration of the IIIM chromosome.
Table 1.
Differential Expression between Strains and Sexes
| Tissue | Comparison | # Diff | # Nondiff | # Genes | Freq Diff | |
|---|---|---|---|---|---|---|
| YM | IIIM | |||||
| Male head | YM versus IIIM | 320 | 553 | 8,568 | 9,441 | 0.092 |
| Testis | YM versus IIIM | 782 | 556 | 8,937 | 10,275 | 0.130 |
| male | female | |||||
| Head | Male versus female | 205 | 1,087 | 8,387 | 9,679 | 0.133 |
| Gonad | Testis versus ovary | 3,426 | 4,369 | 2,791 | 10,586 | 0.736 |
Note.—Counts of the number of genes that are differentially expressed (# Diff), tested and nondifferentially expressed (# Nondiff), and total genes tested (# Genes), as well as the frequency of genes that are differentially expressed (Freq Diff) are listed in the table. For the # Diff columns, the number of genes upregulated in each of the two samples being compared is presented.
Fig. 2.—

Chromosomal mapping and differential expression between YM and IIIM males. (A) Bar graphs indicate the percent of genes on each chromosome (Drosophila Muller element in parentheses) that are differentially expressed between YM and IIIM male heads (top) or testes (bottom). The dashed line indicates the percentage of genes that are differentially expressed across all chromosomes. Asterisks indicate P values from FET comparing the number of differentially expressed genes with the number not differentially expressed on a chromosome and summed across all other chromosomes (*P < 0.05, **P < 0.005, ****P < 0.00005, *****P < 0.000005). (B) Box plots show the relative expression levels of genes in YM and IIIM males on each chromosome. Expression level was measured in head (top) and testis (bottom). The dashed line indicates the average log2 expression ratio across all genes. Asterisks indicate P values from a Mann–Whitney test comparing the expression ratio between genes on one chromosome versus the rest of the genome (*P < 0.05, **P < 0.005, ***P < 0.0005, ****P < 0.00005, *****P < 0.000005).
X-linked genes also trend toward an excess that are differentially expressed between YM and IIIM males (fig. 2A), but we do not have the power to detect statistically significant deviations from the expectation because only 56 X-linked genes are expressed in head and 52 X-linked genes are expressed in testis. Surprisingly, expression from the X chromosome is higher in YM (XY) than IIIM (XX) male heads (fig. 2B), and a significant excess of X-linked genes is upregulated in YM heads relative to IIIM heads (supplementary fig. S3, Supplementary Material online). These results demonstrate that differential expression of X-linked genes between YM and IIIM males is not the result of a dosage deficiency in hemizygous males. In addition, these patterns suggest that either a dosage compensation mechanism provides greater than 2-fold upregulation of the X chromosome in XY males or trans effects of the Y chromosome lead to upregulation of X-linked expression.
Our chromosomal assignments of house fly genes are almost certainly less than perfect because of gene movement between chromosomes since the divergence between D. melanogaster the M. domestica lineages. However, errors in chromosomal assignments should obstruct the signal of elevated expression divergence on the third and X chromosomes, making our results conservative.
More Differential Expression between YM and IIIM Males in Testis than in Head, but a Common Set of Genes Coregulated in Both Tissues
A higher fraction of genes is differentially expressed in testes between YM and IIIM males than in heads (table 1; in FET), suggesting that genes involved in male fertility phenotypes are more affected by the M-bearing chromosome. When we restricted the analysis to only genes expressed in both heads and gonads, we still observe more genes differentially expressed in testes than heads between YM and IIIM males (supplementary table S2, Supplementary Material online). When we used a 2-fold cutoff in addition to an FDR-corrected P < 0.05 cutoff, the number of genes differentially expressed in head and testis between YM and IIIM males goes down to 373 and 558, respectively. However, there is still a higher fraction of genes differentially expressed in testis than head ().
Genes that are differentially expressed between males and females are said to have “sex-biased” expression (Ellegren and Parsch 2007). The fraction of genes differentially expressed between the testes of YM and IIIM males is nearly as large as the fraction with sex-biased expression in head (table 1). We have a different number of replicates for male samples (three YM and three IIIM, for a total of six male replicates) than female samples (two), and so our power to detect differential expression may differ between the interstrain (YM vs. IIIM) and intersex comparisons. To control for sample size effects, we repeated our analysis using only two replicates of each male strain in the interstrain comparison and two male replicates (one from each strain) in the intersex comparison. With only two replicates of each sample we confirmed that more genes are differentially expressed between YM and IIIM testes than heads, and we found that more genes are differentially expressed between YM and IIIM males in either tissue than have sex-biased expression in head (supplementary table S3, Supplementary Material online). This result confirms that the interstrain expression differences are of a similar or greater magnitude than the amount of sex-biased expression in head.
If the probability that a gene is differentially expressed between YM and IIIM male heads is independent of the probability that the gene is differentially expressed in testes, we expect less than 1% of genes to be differentially expressed in both head and testis. We find that 176 genes (2.12%) are differentially expressed between YM and IIIM males in both head and testis when using an FDR-corrected P value to test for differential expression, which is significantly greater than the expectation (). In contrast, there is not a significant excess of genes with sex-biased expression in both head and gonad—we expect 9.41% of genes to have sex-biased expression in both head and gonad (supplementary table S2, Supplementary Material online), and we observe that 809 genes (9.27%) are sex-biased in both tissue samples (PFET = 0.655). We obtain qualitatively similar results when using a 2-fold cutoff in addition to an FDR-corrected P-value threshold of 0.05 to test for differential expression: There is a 4-fold excess of genes that are differentially expressed in both head and testis between YM and IIIM males (), and a less than 10% excess of genes that are differentially expressed in both head and gonad between males and females (PFET = 0.036). We also get the same result when analyzing only two replicates of each sample: A significant excess of genes is differentially expressed in both head and testis between YM and IIIM males (), but not between males and females in both head and gonad (). These results suggest that there are many genes under common regulatory control by the M-bearing chromosome in both male head and testis, but there is not the same degree of sex-specific regulation in common between head and gonad.
Genes That Are Differentially Expressed between YM and IIIM Males Are More Likely to Have Male-Biased Expression
Genes whose expression is significantly higher in males than females are said to have “male-biased” expression, and genes that are upregulated in females have “female-biased” expression (Ellegren and Parsch 2007). We found that genes with male-biased expression in head are more likely to be differentially expressed between YM and IIIM male heads than genes with either female-biased or unbiased expression (fig. 3A). Similarly, genes that are upregulated in testis relative to ovary (testis-biased) are more likely to be differentially expressed between YM and IIIM testes than genes with “ovary-biased” or unbiased expression in gonad (fig. 3B). We repeated this analysis using two replicates of each sample, and we consistently observe that genes with male-biased expression in head or gonad are more likely to be differentially expressed between YM and IIIM males (supplementary figs. S4 and S5, Supplementary Material online).
Fig. 3.—

Sex-biased expression of genes differentially expressed between YM and IIIM males. Bar graphs indicate the percentage of genes with male-biased (blue), female-biased (pink), or unbiased (gray) expression in either (A) head or (B) gonad that are differentially expressed between YM and IIIM males in either (A) head or (B) testis. P values are for FET between groups.
We also found that 14.8% of genes that are upregulated in IIIM male heads have male-biased expression, whereas less than 2% of genes that are upregulated in YM male heads have male-biased expression (). We observe the same excess of male-biased genes upregulated in IIIM male heads when we only use two replicates of each strain and sex to test for differential expression (PFET < 0.05 using most combinations of two replicates). This suggests that IIIM male heads have a “masculinized” expression profile relative to YM heads.
Functional Annotations of Genes That Are Differentially Expressed between YM and IIIM Males
We tested for GO categories that are overrepresented among genes with sex-biased expression that are differentially expressed between YM and IIIM males (supplementary data, Supplementary Material online). We found that nearly half (49.7%) of genes that are differentially expressed between YM and IIIM male heads are annotated with the functional category “catalytic activity,” whereas only 43% of genes not differentially expressed have that GO annotation (PFET < 0.05 corrected for multiple tests). Over 10% of the genes with the catalytic activity annotation that are upregulated in IIIM male head are predicted to encode proteins involved in a metabolic process, including metabolism of organic acids, amino acids, and lipids. Among those genes, 15 are annotated as cytochrome P450 (CYP450) genes, and 4 of those also have male-biased expression in head (supplementary table S6, Supplementary Material online). CYP450s collectively carry out a wide range of chemical reactions including metabolism of endogenous (e.g., steroid hormones) and exogenous (e.g., xenobiotics) compounds (Scott 2008). All 15 differentially expressed CYP450s are upregulated in IIIM males, and no CYP450 genes are upregulated in YM males. Five of the CYP450s are on scaffolds that we assign to the third chromosome (supplementary table S6, Supplementary Material online), suggesting that cis regulatory sequences controlling the expression of CYP450s have diverged between IIIM and the standard third chromosome. However, five of the CYP450s can be assigned to other autosomes (the remaining five cannot be assigned to a chromosome), demonstrating that divergence of trans-factors between IIIM and the standard third chromosome is also responsible for differential expression of CYP450s between YM and IIIM males. The 15 CYP450s represent a range of different clans (2–4) and families (4, 28, 304, 313, 438, and 3073) (Scott et al. 2014). However, an excess of CYP450s from clan 4 are upregulated in IIIM male head (, P = 0.041), and thus overexpression of CYP450s is not random.
Genes that are annotated as encoding proteins located in extracellular regions are overrepresented among genes with testis-biased expression (15.0% of genes with testis-biased expression; 9.9% of genes not differentially expressed between testis and ovary; corrected for multiple tests) and among genes that are differentially expressed between YM and IIIM testes (13.9% of differentially expressed genes; 8.1% of non-differentially expressed genes; corrected for multiple tests). In addition, 3.1% of the genes differentially expressed between YM and IIIM testes are predicted to encode carbohydrate-binding proteins (compared with 1.4% of nondifferentially expressed genes; PFET < 0.05 corrected for multiple tests), and 7.2% of differentially expressed genes are predicted to encode structural molecules (compared with 3.7% of nondifferentially expressed genes; corrected for multiple tests). Three of those structural molecules are predicted to be β-tubulin proteins encoded by genes that are upregulated in YM testes relative to IIIM, and two of those genes also have testis-biased expression. We tested for differential expression of the two of the β-tubulin genes with testis-biased expression using qPCR (supplementary fig. S6 and supplementary data, Supplementary Material online). Only one of the two (XM_005187368) was upregulated in YM testis when assayed with qPCR (), whereas the other gene (XM_005175742) was not (P = 0.653) possibly because of high variance in the YM measurement (supplementary fig. S6, Supplementary Material online). The D. melanogaster genome encodes a testis-specific β-tubulin paralog that is essential for spermatogenesis (Kemphues et al. 1982; Hoyle and Raff 1990), suggesting that the β-tubulin gene that is upregulated in YM testis may be important for sperm development.
Four genes that are differentially expressed between YM and IIIM testes are homologs of the D. melanogaster Y-linked fertility factors kl-2, kl-3, and kl-5 (Goldstein et al. 1982; Gepner and Hays 1993; Carvalho et al. 2000, 2001). These proteins encode components of the dynein heavy chain, which is necessary for flagellar activity of sperm. All four of the predicted dynein heavy chain genes that are differentially expressed between YM and IIIM testes are autosomal in house fly. Three of these genes have testis-biased expression—two of those are upregulated in IIIM testis (XM_005175130 and XM_005176585), whereas the third is upregulated in YM testis (XM_005184828). The fourth gene (XM_005184771) is upregulated in IIIM testis, but it is not differentially expressed between testis and ovary. Using qPCR, we validated that XM_005184828 is upregulated in YM testis () and XM_005176585 is upregulated in IIIM testis (P < 0.01) (supplementary fig. S6 and supplementary data, Supplementary Material online). Two additional genes encoding components of other dynein chains have testis-biased expression and are upregulated in IIIM testis relative to YM testis.
Finally, there are numerous predicted RNAs in the house fly genome annotation that have no identifiable homology to any known RNAs or proteins (Scott et al. 2014). We identified six of these uncharacterized RNAs that both have testis-biased expression and are differentially expressed between YM and IIIM testes. XR_225504, XR_225520, and XR_225639 are upregulated in YM testes, and XR_225442, XR_225497, and XR_225737 are upregulated in IIIM testes. These genes are annotated as encoding noncoding RNAs (ncRNAs), and we were unable to detect long open-reading frames in the transcripts. It is possible that these ncRNAs are responsible for the regulation of gene expression in testis, and differential expression of these ncRNAs between YM and IIIM testis could be responsible for the differential expression of other genes between YM and IIIM males.
Discussion
Differential Expression between YM and IIIM Males Is Driven by Both Cis and Trans Effects
We compared gene expression in head and testis between YM and IIIM males. YM males are homozygous for a standard third chromosome that does not have M, whereas IIIM males are heterozygous for a IIIM chromosome and a standard third chromosome (fig. 1). Differences in the expression levels of autosomal genes between YM and IIIM males could be the result of 1) divergence of cis-regulatory sequences between the IIIM and standard third chromosomes that affect the expression of genes on the third chromosome, 2) divergence of trans-factors between IIIM and the standard third chromosome that differentially regulate gene expression throughout the genome, 3) downstream effects of the first two processes that lead to further differential expression.
The two strains also differ in the genotype of their sex chromosomes; YM males are XY, whereas IIIM males are XX (fig. 1). The house fly Y chromosome is highly heterochromatic and does not harbor any known genes other than M (Boyes et al. 1964; Hediger et al. 1998; Dübendorfer et al. 2002). It is clear that the Y chromosome does not contain any genes necessary for male fertility or viability because XX males are fertile and viable. The X chromosome is also highly heterochromatic and probably homologous to the Drosophila dot chromosome (Hediger et al. 1998; Vicoso and Bachtrog 2013, 2015). The heterochromatic Drosophila Y chromosome can affect the expression of autosomal genes (Lemos et al. 2008, 2010; Sackton et al. 2011; Zhou et al. 2012), suggesting that the house fly X and Y chromosomes could have trans regulatory effects on autosomal gene expression.
A higher fraction of third chromosome genes are differentially expressed between YM and IIIM house fly males than genes on any other autosome (fig. 2A). Therefore, divergence of cis-regulatory sequences between IIIM and the standard third chromosome is at least partially responsible for the expression differences between YM and IIIM males. However, approximately 70% of the genes differentially expressed between YM and IIIM males map to one of the other four autosomes, suggesting that the majority of expression differences is the result of trans effects of the X, Y, and third chromosomes along with further downstream effects.
Reproductive and Male Phenotypes Are More Likely to Be Affected by M Variation
Reproductive traits are more sexually dimorphic than nonreproductive traits, and reproductive traits also tend to evolve faster, possibly as a result of sexual selection (Eberhard 1985). A similar faster evolution of gene expression in reproductive tissues has been observed across many taxa (Khaitovich et al. 2005; Zhang et al. 2007; Brawand et al. 2011), and increased variation within species for sex-biased gene expression often accompanies elevated expression divergence (Meiklejohn et al. 2003; Ayroles et al. 2009). Consistent with these patterns, more genes are differentially expressed between YM and IIIM males in testis than head (table 1 and supplementary fig. S2, Supplementary Material online). Somatic and germline SDs in house fly are under the same genetic control (Hilfiker-Kleiner et al. 1994), so the exaggerated differences in expression between YM and IIIM testes relative to heads cannot be attributed to differences in the SD pathway between gonad and head. We also find that genes with male-biased expression are more likely to be differentially expressed between YM and IIIM males (fig. 3). Genes with male-biased expression are more likely to perform sex-specific functions (Connallon and Clark 2011), suggesting that genes that are differentially expressed between YM and IIIM males disproportionately affect male phenotypes.
Evaluating the Role of Sex-Specific Selection in MSD Turnover
Many models of SD evolution predict that a new MSD locus will invade a population if it is genetically linked to an allele with a beneficial, sexually selected, or sexually antagonistic fitness effect (Charlesworth D and Charlesworth B 1980; Rice 1987; Charlesworth 1991, 1996; Rice, 1996; van Doorn and Kirkpatrick 2007, 2010). Alternatively, evolutionary turnover of MSD loci could be the result of neutral drift in a highly labile system (van Doorn 2014).
Our results are consistent with a model in which the IIIM chromosome invaded because it harbors alleles with male-specific beneficial effects. First, the expression of genes that are likely to perform male-specific functions—especially in male fertility—is more likely to be affected by the IIIM chromosome (table 1; fig. 3), and those male-specific phenotypic differences could have been targets of sex-specific selection pressures. However, as mentioned above, the expression of male-biased genes is more variable than other genes even in species without multifactorial SD systems (Meiklejohn et al. 2003; Ayroles et al. 2009). Additional experiments in which a non-M-bearing chromosome is placed on a common genetic background are therefore necessary to further test the hypothesis that the M-bearing chromosome disproportionately affects male-biased gene expression.
We also found that IIIM heads have a masculinized expression profile relative to YM heads, suggesting that the male-limited transmission of the IIIM chromosome favored the accumulation of alleles with male-beneficial fitness effects (Rice 1984). Previous work found that IIIM males outperformed YM males in multiple laboratory fitness assays (Hamm et al. 2009), providing additional support for the accumulation of male-beneficial alleles on the IIIM chromosome. However, despite the apparent selective advantage of the IIIM chromosome, it surprisingly does not appear to be expanding rapidly (Hamm et al. 2015), suggesting that the fitness benefits of IIIM may be environment-specific (Feldmeyer et al. 2008).
Our data do not allow us to distinguish between two possible orders of events in the invasion of the IIIM chromosome. In the first scenario, male-beneficial alleles on the third chromosome could have driven the initial invasion of IIIM (van Doorn and Kirkpatrick 2007). In the second scenario, beneficial alleles could have accumulated on the IIIM chromosome after it acquired an M-locus because male-limited inheritance promotes the fixation of male-beneficial alleles (Rice 1984, 1987). These scenarios are not mutually exclusive. Regardless of the sequence of events, we have provided evidence that the house fly multifactorial male-determining system is associated with phenotypic differences that likely have male-specific fitness effects, which could explain the invasion of the IIIM chromosome under sexual or sexually antagonistic selection.
Supplementary Material
Supplementary data, figures S1–S6, and tables S1–S6 are available at Genome Biology and Evolution online (http://www.gbe.oxfordjournals.org/).
Acknowledgments
Cheryl Leichter, Naveen Galla, and Daniel Chazen assisted with the creation of the CSaY strain, Amanda Manfredo prepared the mRNA-Seq libraries, and Christopher Gonzales performed the qPCR validation. This work benefited from discussions with members of the Clark lab. This study was supported by multistate project S-1030 to J.G.S., NIH grant R01-GM64590 to A.G.C. and A. Bernardo Carvalho, and start-up funds from the University of Houston to R.P.M. The funders had no role in study design, data collection and analysis, or preparation of the manuscript.
Literature Cited
- Ayroles JF, et al. 2009. Systems genetics of complex traits in Drosophila melanogaster. Nat Genet. 41:299–307. [DOI] [PMC free article] [PubMed] [Google Scholar]
- Benjamini Y, Hochberg Y. 1995. Controlling the false discovery rate: a practical and powerful approach to multiple testing. J R Stat Soc Ser B. 57:289–300. [Google Scholar]
- Beukeboom L, Perrin N. 2014. The evolution of sex determination. New York: Oxford University Press. [Google Scholar]
- Bopp D. 2010. About females and males: continuity and discontinuity in flies. J Genet. 89:315–323. [DOI] [PubMed] [Google Scholar]
- Boyes JW, Corey MJ, Paterson HE. 1964. Somatic chromosomes of higher diptera IX. Karyotypes of some muscid species. Can J Cytol. 42:1025–1036. [Google Scholar]
- Boyes JW, Van Brink JM. 1965. Chromosomes of calyptrate diptera. Can J Genet Cytol. 7:537–550. [Google Scholar]
- Brawand D, et al. 2011. The evolution of gene expression levels in mammalian organs. Nature 478:343–348. [DOI] [PubMed] [Google Scholar]
- Bull JJ. 1983. Evolution of sex determining mechanisms. Menlo Park (CA): Benjamin/Cummings. [Google Scholar]
- Bull JJ, Charnov EL. 1977. Changes in the heterogametic mechanism of sex determination. Heredity 39:1–14. [DOI] [PubMed] [Google Scholar]
- Bulmer MG, Bull JJ. 1982. Models of polygenic sex determination and sex ratio control. Evolution 36:13–26. [DOI] [PubMed] [Google Scholar]
- Carvalho AB, Dobo BA, Vibranovski MD, Clark AG. 2001. Identification of five new genes on the Y chromosome of Drosophila melanogaster. Proc Natl Acad Sci U S A. 98:13225–13230. [DOI] [PMC free article] [PubMed] [Google Scholar]
- Carvalho AB, Lazzaro BP, Clark AG. 2000. Y chromosomal fertility factors kl-2 and kl-3 of Drosophila melanogaster encode dynein heavy chain polypeptides. Proc Natl Acad Sci U S A. 97:13239–13244. [DOI] [PMC free article] [PubMed] [Google Scholar]
- Charlesworth B. 1991. The evolution of sex chromosomes. Science 251:1030–1033. [DOI] [PubMed] [Google Scholar]
- Charlesworth B. 1996. The evolution of chromosomal sex determination and dosage compensation. Curr Biol. 6:149–162. [DOI] [PubMed] [Google Scholar]
- Charlesworth D, Charlesworth B. 1980. Sex differences in fitness and selection for centric fusions between sex-chromosomes and autosomes. Genet Res. 35:205–214. [DOI] [PubMed] [Google Scholar]
- Conesa A, et al. 2005. Blast2GO: a universal tool for annotation, visualization and analysis in functional genomics research. Bioinformatics 21:3674–3676. [DOI] [PubMed] [Google Scholar]
- Connallon T, Clark AG. 2011. Association between sex-biased gene expression and mutations with sex-specific phenotypic consequences in Drosophila. Genome Biol Evol. 3:151–155. [DOI] [PMC free article] [PubMed] [Google Scholar]
- Denholm I, Franco MG, Rubini PG, Vecchi M. 1983. Identification of a male determinant on the X chromosome of housefly (Musca domestica L.) populations in South-East England. Genet Res. 42:311–322. [Google Scholar]
- Dübendorfer A, Hediger M, Burghardt G, Bopp D. 2002. Musca domestica, a window on the evolution of sex-determining mechanisms in insects. Int J Dev Biol. 46:75–79. [PubMed] [Google Scholar]
- Eberhard WG. 1985. Sexual selection and animal genitalia. Cambridge: Harvard University Press. [Google Scholar]
- Ellegren H, Parsch J. 2007. The evolution of sex-biased genes and sex-biased gene expression. Nat Rev Genet. 8:689–698. [DOI] [PubMed] [Google Scholar]
- Eshel I. 1975. Selection on sex-ratio and the evolution of sex-determination. Heredity 34:351–361. [DOI] [PubMed] [Google Scholar]
- Feldmeyer B, et al. 2008. Climatic variation and the geographical distribution of sex-determining mechanisms in the housefly. Evol Ecol Res. 10:797–809. [Google Scholar]
- Feldmeyer B, Pen I, Beukeboom LW. 2010. A microsatellite marker linkage map of the housefly, Musca domestica: evidence for male recombination. Insect Mol Biol. 19:575–581. [DOI] [PubMed] [Google Scholar]
- Foster GG, Whitten MJ, Konovalov C, Arnold JTA, Maffi G. 1981. Autosomal genetic maps of the Australian sheep blowfly, Lucilia cuprina dorsalis R.-D. (Diptera: Calliphoridae), and possible correlations with the linkage maps of Musca domestica L. and Drosophila melanogaster (Mg.). Genet Res. 37:55–69. [Google Scholar]
- Franco MG, Rubini PG, Vecchi M. 1982. Sex-determinants and their distribution in various populations of Musca domestica L. of Western Europe. Genet Res. 40:279–293. [DOI] [PubMed] [Google Scholar]
- Gepner J, Hays TS. 1993. A fertility region on the Y chromosome of Drosophila melanogaster encodes a dynein microtubule motor. Proc Natl Acad Sci U S A. 90:11132–11136. [DOI] [PMC free article] [PubMed] [Google Scholar]
- Goldstein LS, Hardy RW, Lindsley DL. 1982. Structural genes on the Y chromosome of Drosophila melanogaster. Proc Natl Acad Sci U S A. 79:7405–7409. [DOI] [PMC free article] [PubMed] [Google Scholar]
- Götz S, et al. 2008. High-throughput functional annotation and data mining with the Blast2GO suite. Nucleic Acids Res. 36:3420–3435. [DOI] [PMC free article] [PubMed] [Google Scholar]
- Hamm RL, Gao JR, Lin GGH, Scott JG. 2009. Selective advantage for IIIM males over YM males in cage competition, mating competition, and pupal emergence in Musca domestica L. (Diptera: Muscidae). Environ Entomol. 38:499–504. [DOI] [PubMed] [Google Scholar]
- Hamm RL, Meisel RP, Scott JG. 2015. The evolving puzzle of autosomal versus Y-linked male determination in Musca domestica. G3 5:371–384. [DOI] [PMC free article] [PubMed] [Google Scholar]
- Hamm RL, Shono T, Scott JG. 2005. A cline in frequency of autosomal males is not associated with insecticide resistance in house fly (Diptera: Muscidae). J Econ Entomol. 98:171–176. [DOI] [PubMed] [Google Scholar]
- Hediger M, et al. 2004. Sex determination in Drosophila melanogaster and Musca domestica converges at the level of the terminal regulator doublesex. Dev Genes Evol. 214:29–42. [DOI] [PubMed] [Google Scholar]
- Hediger M, Niessen M, Müller-Navia J, Nöthiger R, Dübendorfer A. 1998. Distribution of heterochromatin on the mitotic chromosomes of Musca domestica L. in relation to the activity of male-determining factors. Chromosoma 107:267–271. [DOI] [PubMed] [Google Scholar]
- Hilfiker-Kleiner D, Dubendorfer A, Hilfiker A, Nothiger R. 1994. Genetic control of sex determination in the germ line and soma of the housefly, Musca domestica. Development 120:2531–2538. [DOI] [PubMed] [Google Scholar]
- Hiroyoshi T. 1961. The linkage map of the house fly, Musca domestica L. Genetics 46:1373–1380. [DOI] [PMC free article] [PubMed] [Google Scholar]
- Hoyle HD, Raff EC. 1990. Two Drosophila beta tubulin isoforms are not functionally equivalent. J Cell Biol. 111:1009–1026. [DOI] [PMC free article] [PubMed] [Google Scholar]
- Kemphues KJ, Kaufman TC, Raff RA, Raff EC. 1982. The testis-specific β-tubulin subunit in Drosophila melanogaster has multiple functions in spermatogenesis. Cell 31:655–670. [DOI] [PubMed] [Google Scholar]
- Kence M, Kence A. 1992. Genetic consequences of linkage between malathion resistance and an autosomal male-determining factor in house fly (Diptera: Muscidae). J Econ Entomol. 85:1566–1570. [DOI] [PubMed] [Google Scholar]
- Kerr RW. 1960. Sex-limited DDT-resistance in house-flies. Nature 185:868–868. [Google Scholar]
- Kerr RW. 1961. Inheritance of DDT-resistance involving the Y-chromosome in the housefly (Musca domestioa L.). Aust J Biol Sci. 14:605–619. [Google Scholar]
- Kerr RW. 1970. Inheritance of DDT resistance in a laboratory colony of the housefly, Musca domestica. Aust J Biol Sci. 23:377–400. [Google Scholar]
- Khaitovich P, et al. 2005. Parallel patterns of evolution in the genomes and transcriptomes of humans and chimpanzees. Science 309:1850–1854. [DOI] [PubMed] [Google Scholar]
- Kim D, et al. 2013. TopHat2: accurate alignment of transcriptomes in the presence of insertions, deletions and gene fusions. Genome Biol. 14:R36. [DOI] [PMC free article] [PubMed] [Google Scholar]
- Kozielska M, Feldmeyer B, Pen I, Weissing FJ, Beukeboom LW. 2008. Are autosomal sex-determining factors of the housefly (Musca domestica) spreading north? Genet Res.. 90:157–165. [DOI] [PubMed] [Google Scholar]
- Kozielska M, Pen I, Beukeboom LW, Weissing FJ. 2006. Sex ratio selection and multi-factorial sex determination in the housefly: a dynamic model. J Evol Biol. 19:879–888. [DOI] [PubMed] [Google Scholar]
- Langmead B, Trapnell C, Pop M, Salzberg SL. 2009. Ultrafast and memory-efficient alignment of short DNA sequences to the human genome. Genome Biol. 10:R25. [DOI] [PMC free article] [PubMed] [Google Scholar]
- Lemos B, Araripe LO, Hartl DL. 2008. Polymorphic Y chromosomes harbor cryptic variation with manifold functional consequences. Science 319:91–93. [DOI] [PubMed] [Google Scholar]
- Lemos B, Branco AT, Hartl DL. 2010. Epigenetic effects of polymorphic Y chromosomes modulate chromatin components, immune response, and sexual conflict. Proc Natl Acad Sci U S A. 107:15826–15831. [DOI] [PMC free article] [PubMed] [Google Scholar]
- Meiklejohn CD, Parsch J, Ranz JM, Hartl DL. 2003. Rapid evolution of male-biased gene expression in Drosophila. Proc Natl Acad Sci U S A. 100:9894–9899. [DOI] [PMC free article] [PubMed] [Google Scholar]
- Pomiankowski A, Nöthiger R, Wilkins A. 2004. The evolution of the Drosophila sex-determination pathway. Genetics 166:1761–1773. [DOI] [PMC free article] [PubMed] [Google Scholar]
- R Core Team. 2015. R: a language and environment for statistical computing. Vienna (Austria): R Foundation for Statistical Computing. [Google Scholar]
- Rice WR. 1984. Sex chromosomes and the evolution of sexual dimorphism. Evolution 38:735–742. [DOI] [PubMed] [Google Scholar]
- Rice WR. 1986. On the instability of polygenic sex determination: the effect of sex-specific selection. Evolution 40:633–639. [DOI] [PubMed] [Google Scholar]
- Rice WR. 1987. The accumulation of sexually antagonistic genes as a selective agent promoting the evolution of reduced recombination between primitive sex chromosomes. Evolution 41:911–914. [DOI] [PubMed] [Google Scholar]
- Rice WR. 1996. Evolution of the Y sex chromosome in animals. Bioscience 46:331–343. [Google Scholar]
- Roberts RB, Ser JR, Kocher TD. 2009. Sexual conflict resolved by invasion of a novel sex determiner in Lake Malawi cichlid fishes. Science 326:998–1001. [DOI] [PMC free article] [PubMed] [Google Scholar]
- Sackton TB, Montenegro H, Hartl DL, Lemos B. 2011. Interspecific Y chromosome introgressions disrupt testis-specific gene expression and male reproductive phenotypes in Drosophila. Proc Natl Acad Sci U S A. 108:17046–17051. [DOI] [PMC free article] [PubMed] [Google Scholar]
- Schmidt R, Hediger M, Roth S, Nothiger R, Dubendorfer A. 1997. The Y-chromosomal and autosomal male-determining M factors of Musca domestica are equivalent. Genetics 147:271–280. [DOI] [PMC free article] [PubMed] [Google Scholar]
- Scott J, et al. 2014. Genome of the house fly, Musca domestica L., a global vector of diseases with adaptations to a septic environment. Genome Biol. 15:466. [DOI] [PMC free article] [PubMed] [Google Scholar]
- Scott JG. 2008. Insect cytochrome P450s: thinking beyond detoxification. In: Liu N, editor. Recent advances in insect physiology, toxicology and molecular biology. Kerala (India): Research Signpost; p. 117–124. [Google Scholar]
- Scott JG, Sridhar P, Liu N. 1996. Adult specific expression and induction of cytochrome P450tpr in house flies. Arch Insect Biochem Physiol. 31:313–323. [DOI] [PubMed] [Google Scholar]
- Shono T, Scott JG. 1990. Autosomal sex-associated pyrethroid resistance in a strain of house fly (Diptera: Muscidae) with a male-determining factor on chromosome three. J Econ Entomol. 83:686–689. [DOI] [PubMed] [Google Scholar]
- Siegenthaler C, Maroy P, Hediger M, Dubendorfer A, Bopp D. 2009. Hormones and sex-specific transcription factors jointly control yolk protein synthesis in Musca domestica. Int J Evol Biol. 2009:291236. [DOI] [PMC free article] [PubMed] [Google Scholar]
- Tomita T, Wada Y. 1989a. Migration and linkage disequilibrium in local populations of the housefly (Musca domestica) in Japan. Jpn J Genet. 64:383–389. [Google Scholar]
- Tomita T, Wada Y. 1989b. Multifactorial sex determination in natural populations of the housefly (Musca domestica) in Japan. Jpn J Genet. 64:373–382. [Google Scholar]
- Trapnell C, et al. 2013. Differential analysis of gene regulation at transcript resolution with RNA-seq. Nat Biotechnol. 31:46–53. [DOI] [PMC free article] [PubMed] [Google Scholar]
- van Doorn GS. 2014. Evolutionary transitions between sex-determining mechanisms: a review of theory. Sex Dev. 8:7–19. [DOI] [PubMed] [Google Scholar]
- van Doorn GS, Kirkpatrick M. 2007. Turnover of sex chromosomes induced by sexual conflict. Nature 449:909–912. [DOI] [PubMed] [Google Scholar]
- van Doorn GS, Kirkpatrick M. 2010. Transitions between male and female heterogamety caused by sex-antagonistic selection. Genetics 186:629–645. [DOI] [PMC free article] [PubMed] [Google Scholar]
- Vicoso B, Bachtrog D. 2013. Reversal of an ancient sex chromosome to an autosome in Drosophila. Nature 499:332–335. [DOI] [PMC free article] [PubMed] [Google Scholar]
- Vicoso B, Bachtrog D. 2015. Numerous transitions of sex chromosomes in Diptera. PLoS Biol. 13:e1002078. [DOI] [PMC free article] [PubMed] [Google Scholar]
- Wagoner DE. 1967. Linkage group-karyotype correlation in the house fly determined by cytological analysis of X-ray induced translocations. Genetics 57:729–739. [DOI] [PMC free article] [PubMed] [Google Scholar]
- Weller GL, Foster GG. 1993. Genetic maps of the sheep blowfly Lucilia cuprina: linkage-group correlations with other dipteran genera. Genome 36:495–506. [DOI] [PubMed] [Google Scholar]
- Werren JH, Beukeboom LW. 1998. Sex determination, sex ratios, and genetic conflict. Annu Rev Ecol Syst. 29:233–261. [Google Scholar]
- Wilkins AS. 1995. Moving up the hierarchy: a hypothesis on the evolution of a genetic sex determination pathway. Bioessays 17:71–77. [DOI] [PubMed] [Google Scholar]
- Zhang Y, Sturgill D, Parisi M, Kumar S, Oliver B. 2007. Constraint and turnover in sex-biased gene expression in the genus Drosophila. Nature 450:233–237. [DOI] [PMC free article] [PubMed] [Google Scholar]
- Zhou J, et al. 2012. Y chromosome mediates ribosomal DNA silencing and modulates the chromatin state in Drosophila. Proc Natl Acad Sci U S A. 109:9941–9946 [DOI] [PMC free article] [PubMed] [Google Scholar]
Associated Data
This section collects any data citations, data availability statements, or supplementary materials included in this article.