

Abstract
Ghrelin is a hormone that stimulates growth hormone secretion and signals energy insufficiency via interaction with its receptor, the growth hormone secretagogue receptor (GHSR). The GHSR is located in both the central nervous system and the periphery. Its distribution in the CNS, as assessed by in situ hybridization histochemistry (ISHH), has been described previously in a few mammalian species, although these studies were limited by either the detail provided or the extent of the regions examined. In the present study, we systematically examined the distribution of GHSR mRNA in the adult rat and mouse brains and cervical spinal cords by using ISHH with novel cRNA probes specific for the mRNA encoding functional GHSR (the type 1a variant). We confirmed GHSR mRNA expression in several hypothalamic nuclei, many of which have long been recognized as playing roles in body weight and food intake. GHSR also was found in several other regions previously unknown to express GHSR mRNA, including many parasympathetic preganglionic neurons. Additionally, we found GHSR mRNA within all three components of the dorsal vagal complex, including the area postrema, the nucleus of the solitary tract, and the dorsal motor nucleus of the vagus. Finally, we examined the co-expression of GHSR with tyrosine hydroxylase and cholecystokinin, and demonstrate a high degree of GHSR mRNA expression within dopaminergic, cholecystokinin-containing neurons of the substantia nigra and ventral tegmental area.
Keywords: ghrelin, GHSR, in situ hybridization histochemistry, CNS distribution
INTRODUCTION
Ghrelin was identified in 1999 as the endogenous ligand of the growth hormone secretagogue receptor (GHSR; ghrelin receptor) and was named for its potent growth hormone (GH)-secreting properties (Kojima et al., 1999). It is synthesized primarily by gastric endocrine cells, and also is produced by endocrine cells located in other peripheral tissues, such as the intestines and pancreas (Ariyasu et al., 2001; Date et al., 2000; Date et al., 2002; Dezaki et al., 2004; Horvath et al., 2001; Hosoda et al., 2000; Kojima et al., 1999; Lee et al., 2002; Prado et al., 2004; Tschop et al., 2000; Volante et al., 2002; Wierup et al., 2004). In addition to its role as a GH secretagogue, ghrelin stimulates gastrointestinal motility and gastric acid secretion, affects blood pressure and heart rate, stimulates neurogenesis, and affects the release of many hormones, including insulin (Arosio et al., 2003; Asakawa et al., 2001; Date et al., 2002; Dezaki et al., 2004; Egido et al., 2002; Ishizaki et al., 2002; Lee et al., 2002; Lin et al., 2004; Masuda et al., 2000; Matsumura et al., 2002; Trudel et al., 2002; Zhang et al., 2004). Several studies also have examined ghrelin’s role in body weight homeostasis and have established ghrelin as an important indicator of energy insufficiency (Asakawa et al., 2003; Asakawa et al., 2001; Cummings et al., 2001; Cummings et al., 2002; Kamegai et al., 2000; Nakazato et al., 2001; Tschop et al., 2000; Wang et al., 2002; Wisse et al., 2001; Yasuda et al., 2003). The central role of ghrelin in body weight homeostasis and the critical importance of GHSR in transmitting ghrelin’s energy balance and growth hormone secretory messages are highlighted by recent studies on a GHSR knockout mouse model (Sun et al., 2004). In these mice, global deletion of GHSR results in a lean phenotype and altered orexigenic and GH-secretory responses to administration of ghrelin (Sun et al., 2004).
GHSR expression in the brain has been examined previously using a variety of techniques including ribonuclease protection assay, RT-PCR, binding studies, immunohistochemistry (IHC), Western blot analysis and ISHH (Bennett et al., 1997; Gnanapavan et al., 2002; Guan et al., 1997; Howard et al., 1996; Kamegai et al., 1999; Katayama et al., 2000; Mitchell et al., 2001; Shuto et al., 2001; Tannenbaum et al., 1998; Willesen et al., 1999). The ISHH studies have included analyses of rhesus monkey and rat, both of which were found to express particularly high levels of GHSR in the arcuate nucleus (Arc) and ventromedial nucleus (VMH) of the hypothalamus (Bennett et al., 1997; Guan et al., 1997; Howard et al., 1996; Mitchell et al., 2001). The study by Guan et al. also described GHSR expression in other hypothalamic and extra-hypothalamic structures within the rat brain, although it included an insufficient number of photomicrographs to thoroughly assess the distribution of GHSR in great detail (Guan et al., 1997). The study by Mitchell et al., in which the distribution of GHSR within rat and lemur brains was examined, provided significantly more detail, and for instance localized GHSR to several structures not previously reported (Mitchell et al., 2001). However, their analysis was limited in that it focused on GHSR expression in the pituitary and in a region spanning the rostral hypothalamus to the mamillary bodies; the brainstem, for instance, was not examined (Mitchell et al., 2001). A few studies also have explored the chemical phenotypes of arcuate and VMH GHSR neurons within the rat, including the degrees of co-expression with growth hormone releasing hormone, neuropeptide Y (NPY), pro-opiomelanocortin (POMC), somatostatin, and tyrosine hydroxylase (TH) (Shuto et al., 2002; Tannenbaum et al., 1998; Willesen et al., 1999). A detailed distribution study on GHSR expression within the mouse CNS has not yet been reported. Such information specifically for the mouse will be important in future studies with transgenic mouse models that target GHSR expression or target deletion of such expression to specific neuronal sites or to neurons of a specific chemical phenotype.
In the present study, we systematically examined the distribution of GHSR mRNA throughout the adult rat brain and cervical spinal cord by using ISHH with a novel cRNA probe specific for the mRNA encoding the functional GHSR (type 1a) variant in the rat. We also assessed the distribution of GHSR throughout the adult mouse brain and cervical spinal cord using a mouse GHSR type 1a variant-specific riboprobe. In addition, we have examined the TH and cholecystokinin (CCK) contents of neurons expressing GHSR mRNA within the rat brain in order to better determine the chemical phenotypes of ghrelin-responsive neurons and to provide clues as to possible downstream mediators of ghrelin action.
MATERIALS AND METHODS
Animals and histology
Adult male pathogen-free Sprague-Dawley rats (250 – 350 g; Taconic, Germantown, NY) and adult male pathogen-free C57BL/6 mice (25 – 30 g; Jackson Laboratory, Bar Harbor, ME) were housed with food and water available ad libitum in light- and temperature-controlled environments. For procurement of tissue for histological examination, animals were deeply anesthetized with intraperitoneal injection of chloral hydrate (350 mg/kg for rats and 500 mg/kg for mice) and subsequently were perfused transcardially with diethylpyrocarbonate (DEPC)-treated 0.9% phosphate buffered saline (PBS) followed by 10% neutral buffered formalin. Animals used to examine GHSR-CCK co-expression were first injected intracerebroventricularly with colchicine 24 hours prior to transcardial perfusion. Brains and spinal cords were removed, stored in the same fixative for 4 – 6 hours at 4°C, immersed in 20% sucrose in DEPC-treated PBS, pH 7.0 at 4°C overnight, and cut on a freezing microtome coronally into five equal series at either 30 μm (rat) or 25 μm (mouse). The sections were placed at −20°C in an antifreeze solution (Simmons et al., 1989) until further histological processing.
For each animal, sections extending from the anterior olfactory nucleus to the cervical region of the spinal cord were examined histologically. For some of the animals, adjacent series of sections were stained with thionin to identify regional boundaries (Marcus et al., 2001). The animals and procedures used were in accordance with the guidelines and approval of the Harvard Medical School and Beth Israel Deaconess Medical Center Institutional Animal Care and Use Committees.
Generation of GHSR cRNA probes
We generated three novel cRNA probes for use in this study. The first probe contained 372 ribonucleotides, and was complementary to the first 255 nt of the 3′ untranslated region (3′-UTR) and a small part of the contiguous upstream coding region (encoding the C-terminal 38 amino acids and stop codon) of rat GHSR type 1a mRNA. A similar probe specific for the corresponding region in mouse GHSR type 1a mRNA was also generated. A third, smaller probe was complementary to the first 255 nt of the 3′-UTR of rat type 1a mRNA but did not contain any sequence complementary to the coding region. These probes were generated by PCR amplification of either rat brain cDNA or mouse brain cDNA (Clontech, Palo Alto, CA) with the following oligonucleotide primer pairs: M34, 5′-TGAGCTGCAAAGCTGCCAGTAG–3′ and M35, 5′–AAGTACCGGGTGGCAGTGTTCA–3′ (for the larger rat probe used for most of the studies on rat tissue), M36, 5′-AAGTAACCACTGACAGGACTGGT-3′ and M37, 5′-CAGGAGAGTGCTGGGAGTTGCA-3′ (for the mouse probe), and M38, 5′-GGAATCCAAGAAGCCACCAGCTA-3′ and M39, 5′-TTTATTTGTAAGTCAGCAGGAGAGT-3′ (for the shorter rat probe used to confirm the observations made with the M34/M35-amplified rat probe). These probes were designed using the published sequence of rat GHSR (McKee et al., 1997) and mouse GHSR mRNA sequence data from the Celera Genomics database (South San Francisco, CA). The amplified PCR products were gel-purified and then subcloned into PCR4-TOPO vector (Invitrogen, Carlsbad, CA), according to the manufacturer’s protocol. The sequences and directionalities of the inserts were confirmed by DNA sequencing at the core DNA sequencing facility at Beth Israel Deaconess Medical Center. To generate antisense 35S-labeled cRNA to use as probes, the plasmids were linearized by restriction digestion and then subjected to in vitro transcription with either T3 or T7 RNA polymerases according to the manufacturer’s protocol (Ambion, Inc., Austin, TX). Control sense riboprobes were similarly generated.
Single-label ISHH
Single-label ISHH was performed as reported previously by our laboratory (Kishi et al., 2003; Marcus et al., 2001). One - three series from seven different rat brains and six different mouse brains were examined. Tissue sections were mounted onto SuperFrost slides (Fisher Scientific, Pittsburgh, PA), air-dried, and stored in desiccated boxes at −20°C. Prior to hybridization, sections were fixed in 4% formaldehyde in DEPC-treated PBS, pH 7.0 for 20 min at 4°C, dehydrated in increasing concentrations of ethanol, cleared in xylenes for 15 min, re-hydrated in decreasing concentrations of ethanol, and placed in pre-warmed sodium citrate buffer (95 – 100°C, pH 6.0). While in the sodium citrate buffer, slides were placed in a commercial microwave oven for 10 min at 20 – 70% power. Afterwards, they were dehydrated, as before, in graded ethanols and air-dried.
The 35S-labeled cRNA probes were diluted to 106 cpm/mL in a hybridization solution containing 50% formamide, 10 mM Tris-HCl, pH 8.0, 5.0 mg tRNA (Invitrogen), 10 mM dithiothreitol (DTT), 10% dextran sulfate, 0.3 M NaCl, 1 mM EDTA, pH 8.0, and 1X Denhardt’s solution. The slides with brain sections had hybridization solution and coverslips applied and then were placed at 57°C for 12 – 16 hours. Next, coverslips were removed, and the sections were then washed with 2X SSC buffer and incubated in 0.002% RNase A (Roche Molecular Biochemicals, Indianapolis, IN) with 0.5 M NaCl, 10 mM Tris-HCl, pH 8.0, and 1 mM EDTA for 30 min, followed by a 30 min incubation in the same buffer minus the RNase. The sections were then submitted to stringency washes, as follows: 2X SSC, 0.25% DTT at 50°C for 1 hour; 0.2X SSC, 0.25% DTT at 55°C for 1 hour; 0.2X SSC, 0.25% DTT at 60°C for 1 hour. Afterwards, the sections were dehydrated in increasing concentrations of ethanol containing 0.3 M NH4OAC followed by a final submersion in 100% ethanol.
Slides were air-dried and placed in X-ray film cassettes with BMR-2 film (Kodak, Rochester, NY) for 1 – 3 days. Slides were then dipped in NTB2 photographic emulsion (Kodak), dried, and stored in desiccated, foil-wrapped boxes at 4°C for 2 – 3 weeks. Finally, slides were developed with D-19 developer (Kodak), counterstained with thionin, dehydrated in graded ethanols, cleared in xylenes and coverslipped with Permaslip (Alban Scientific, St. Louis, MO). Control experiments to confirm the specificity of this protocol involved hybridization with sense probes and alternatively, with antisense probes after treatment of sections with RNase A. These latter control experiments showed no evidence of non-specific labeling.
Dual-label ISHH/Immunohistochemistry (IHC)
Free-floating sections of rat brains were processed sequentially by ISHH and IHC using a protocol reported previously by our laboratory (Elias et al., 1998; Liu et al., 2003). Series of three different rat brains were processed for GHSR-TH co-expression and series of five different colchicine-treated rat brains were processed for GHSR-CCK co-expression. Brain sections were first rinsed in DEPC-treated PBS, pH 7.0, and were pre-treated with 1% sodium borohydride (Sigma, St. Louis, MO) in DEPC-treated PBS for 15 min at room temperature. After thorough washing in DEPC-treated PBS, the sections were rinsed in 0.1 M triethanolamine (TEA, pH 8.0), incubated in 0.25% acetic anhydride in 0.1 M TEA for 10 min, and then washed again in 2X SSC. Next, the sections were incubated at 57°C for 12 – 16 hours in the above-described hybridization solution containing the rat GHSR riboprobe diluted to 106 cpm/mL. Subsequently, sections were rinsed in 4X SSC and incubated in 0.002% RNase solution (see previous section) for 30 min at 37°C. Sections were rinsed with 2X SSC and then with 50% formamide in 0.2X SSC at 50°C. The sections were then submitted to stringency washes, as described in the previous section but minus the 0.25% DTT.
IHC was begun after first washing the ISHH-processed sections in PBS, pH 7.4. Sections were pre-treated with 0.3% hydrogen peroxide in PBS, pH 7.4 for 30 min at room temperature and then were incubated in 3% normal donkey serum (Jackson ImmunoResearch Laboratories, Inc., West Grove, PA) with 0.25% Triton X-100 in PBS (PBT-azide) for 1 hour. Next, the slides were incubated overnight at room temperature in either a TH mouse primary antiserum (Chemicon International, Inc., Temecula, CA, catalog # MAB318, lot # 21082054; 1:20,000 in PBT-azide) or a CCK-8 rabbit primary antiserum (ImmunoStar, Inc., Hudson, WI, catalog # 20078, lot # 112030; 1:10,000 in PBT). After washing in PBS, sections were incubated in either biotinylated donkey anti-mouse IgG or biotinylated donkey anti-rabbit IgG (Jackson ImmunoResearch Laboratories; 1:1,000) for 1 hour at room temperature, followed by incubation for 1 hour in a solution of avidin-biotin complex (Vectastain Elite ABC Kit, Vector Laboratories, Burlingame, CA; 1:500) diluted in PBS. The sections next were washed in PBS and incubated in a solution of 0.04% diaminobenzidine tetrahydrochloride (DAB; Sigma) and 0.01% hydrogen peroxide in PBS. Sections were mounted onto SuperFrost slides, and then were processed with X-ray film followed by photographic emulsion, as described in the previous section. Control experiments to test the specificity of the IHC reactions included preadsorption of the CCK-8 rabbit primary antiserum with 50 μg/mL sulfated CCK octapeptide (26–33) (Phoenix Pharmaceuticals, Inc., Belmont, CA, catalog # 069-03, lot # 422767), and also omission of each primary antiserum. Staining was not observed in any of the adsorption or primary antibody omission controls.
Data analysis and production of photomicrographs
ISHH patterns were visualized first on autoradiographic film and then by observing slides dipped in photographic emulsion for direct, cellular visualization. Histological detail was noted by examining adjacent brain sections stained for thionin. Brain sections were viewed with both a Zeiss Axioskop and a Zeiss Stemi 2000-C dissecting microscope using both brightfield and darkfield optics. Photomicrographs were produced with a Zeiss digital camera attached to the microscopes and a Dell desktop computer. Qualitative estimates of GHSR mRNA expression in specific brain sites were made by considering both signal strength and the number of labeled cells. Criteria used to determine whether a TH-IR or CCK-IR cell co-expressed GHSR mRNA included both 1) brightfield visualization of silver granules overlying the DAB-stained cell at 5X the background density of silver granule deposition and 2) conformation of the overlying silver granules to the shape of the DAB-stained cell. An image editing software program, Adobe Photoshop 7.0, was used to combine the photomicrographs into plates, to adjust contrast and brightness, and to remove any obvious dust from the darkfield images. In order to better visualize the silver grains in the low-power photomicrographs represented in panels A and D of Figure 4 and panels A and C of Figure 8, two different images of the processed brain sections were taken and merged using Adobe Photoshop 7.0, as follows: the first was a brightfield image; the second was a darkfield image that was subsequently inverted such that the bright areas representing silver grains now appeared black; this second image was layered onto the first image and then the two images were merged using the “darken” blend mode.
Figure 4.
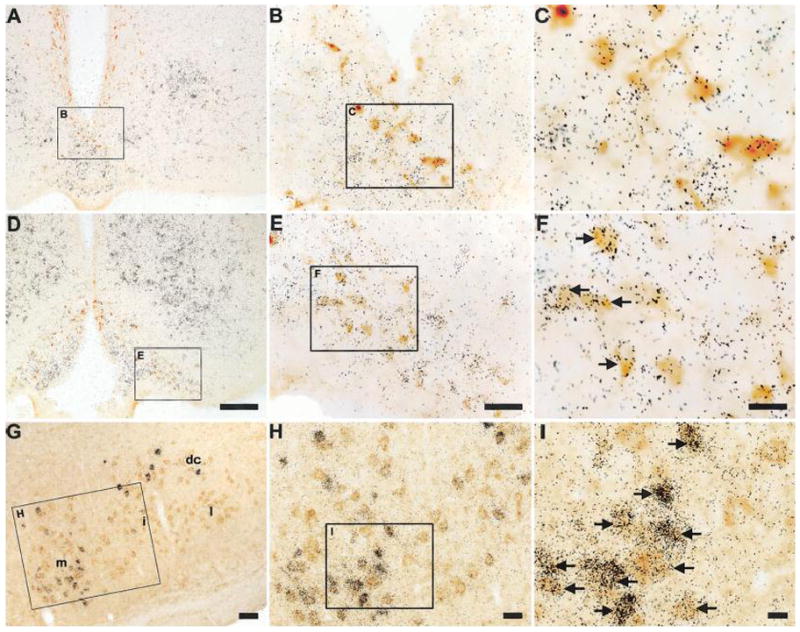
A series of photomicrographs demonstrating co-expression of GHSR and tyrosine hydroxylase in the rat arcuate nucleus and GHSR type 1a mRNA expression in the rat facial motor nucleus. A and D: rostrocaudally-arranged brain sections through the tuberal hypothalamus. TH-IR cell bodies are stained orange-brown. Cells expressing GHSR type 1a mRNA have overlying black silver granules. The boxed areas in A and D are magnified in B and E, and the boxed areas in B and E are magnified in C and F. G: facial motor nucleus. Cells expressing GHSR type 1a mRNA have overlying black silver granules. The orange-brown coloration indicates CCK-IR. The boxed area in G is magnified in H, and the boxed area in H is magnified in I. Black arrows indicate examples of neurons doubly-labeled with GHSR riboprobe and either anti-TH or anti-CCK antisera. Abbreviations: dc, dorsal cap subdivision of facial motor nucleus (7); i, intermediate subdivision of 7; l, lateral subdivision of 7; m, medial subdivision of 7. The scale bar located in panel D represents 200 μm (and applies to panels A and D); the scale bar located in panel E represents 50 μm (and applies to panels B and E); the scale bar located in panel F represents 20 μm (and applies to panels C and F); the scale bar located in panel G represents 50 μm; the scale bar located in panel H represents 25 μm; the scale bar located in panel I represents 10 μm.
Figure 8.
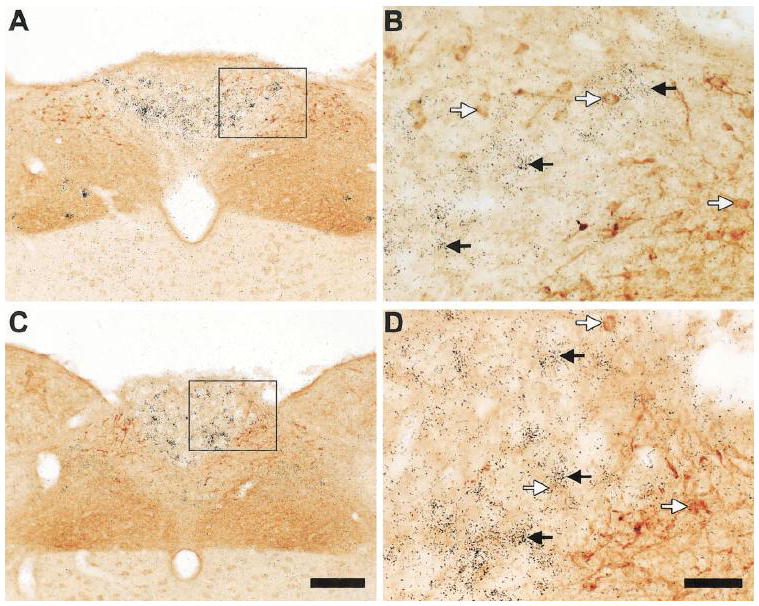
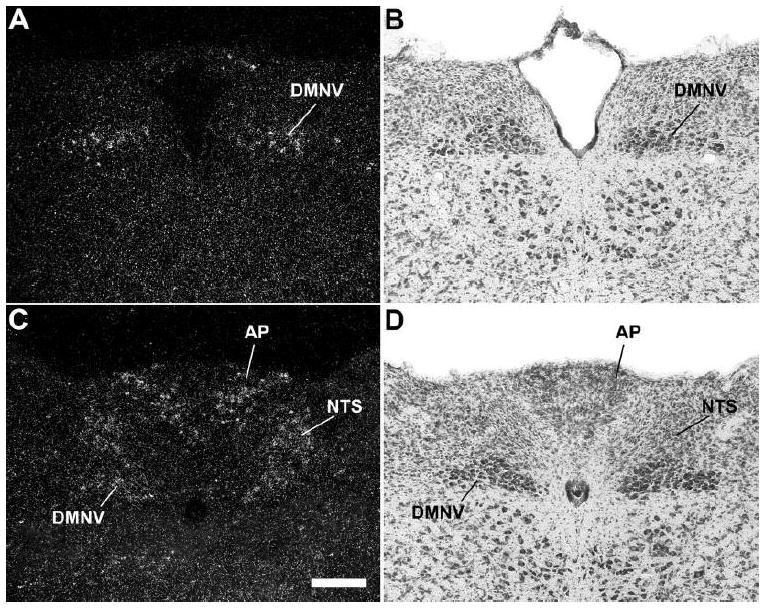
A series of photomicrographs demonstrating distinct expression patterns for GHSR and cholecystokinin in the dorsal vagal complex of the rat. A and C: rostrocaudally-arranged brain sections through the dorsal vagal complex. CCK-IR cell bodies are stained orange-brown. Cells expressing GHSR type 1a mRNA have overlying black silver granules. The boxed areas in A and C are magnified in B and D. Black arrows indicate examples of neurons singly-labeled with GHSR riboprobe. White arrows indicate examples of neurons singly-labeled with anti-CCK antiserum. The scale bar located in panel C represents 200 μm (and applies to panels A and C); the scale bar located in panel D represents 50 μm (and applies to panels B and D).
RESULTS
Hybridization for the type 1a variant of GHSR was examined from the level of the olfactory bulbs to the cervical spinal cord in both rats and mice, and was found to be widespread in both rodent species. The nomenclature used to describe the individual brain nuclei corresponds, for the most part, to the descriptions in the rat brain and mouse brain atlases of Paxinos, Watson and Franklin (Franklin and Paxinos, 1997; Paxinos and Watson, 1998). The abbreviations used in the figures and throughout the text are denoted within Table 1 and the figure legends. The observed expression patterns are outlined in Table 1, and are visually summarized in representative photomicrographs contained in Figures 1 through 8.
TABLE 1.
Relative Densities of GHSR mRNA Expression in the Central Nervous Systems of Rat and Mouse1
| Rat | Mouse | |
|---|---|---|
| Cerebral cortex | ||
| Piriform cortex | +/− | +/− |
| Hippocampus and septum | ||
| Ammon’s horn, CA1 | ++ | +/− |
| Ammon’s horn, CA2 | +++ | +/− |
| Ammon’s horn, CA3 | +++ | +/− |
| Dentate gyrus–DG | +++ | +/− |
| Medial septal nucleus | + | − |
| Nucleus of the diagonal band, horizontal limb–HDB | + | − |
| Nucleus of the diagonal band, vertical limb–VDB | + | − |
| Hypothalamus | ||
| Anterior hypothalamic area–AHA | − | + |
| Anterodorsal preoptic nucleus | − | + |
| Anteromedian nucleus–Ant | ++ | ++ |
| Anteroventral periventricular nucleus–AVPe | + | ++ |
| Arcuate nucleus–Arc | ++++ | ++++ |
| Dorsomedial nucleus–DMH | + | ++ |
| Lateral mamillary nucleus–LM | +++ | − |
| Medial preoptic nucleus | + | − |
| Parastrial nucleus | − | + |
| Paraventricular nucleus–PVH | + | ++ |
| Periventricular hypothalamic nucleus–Pe | − | + |
| Premamillary nucleus, ventral–PMV | − | ++ |
| Retrochiasmatic area–RCA | + | + |
| Suprachiasmatic nucleus, dorsomedial–SCh | ++ | +++ |
| Ventral subparaventricular nucleus | − | + |
| Ventrolateral preoptic nucleus | + | − |
| Ventromedial nucleus, central–cVMH | +++ | − |
| Ventromedial nucleus, dorsomedial–dmVMH | ++++ | − |
| Ventromedial nucleus, ventrolateral–vlVMH | + | ++ |
| Ventromedial nucleus, capsule–capVMH | − | ++ |
| Ventromedial preoptic nucleus | − | + |
| Midbrain, pons, and medulla oblongata | ||
| Area postrema–AP | +++ | ++ |
| Central gray, alpha–CGa | − | ++ |
| Dorsal motor nucleus of the vagus–DMNV | + | ++ |
| Dorsal raphe nucleus–DR | ++ | + |
| Dorsal tegmental nucleus–DTg | − | + |
| Edinger Westphal nucleus–EW | ++ | ++++ |
| Facial Motor Nucleus, dorsal cap–7 | +++ | ++ |
| Facial Motor Nucleus, intermediate–7 | ++ | ++ |
| Facial Motor Nucleus, lateral–7 | + | − |
| Facial Motor nucleus, medial–7 | +++ | ++ |
| Interpeduncular nucleus–IP | + | − |
| Lateral parabrachial nucleus, external–exLPB | ++ | ++ |
| Laterodorsal tegmental nucleus–LDTg | +++ | − |
| Magnocellular nucleus of the posterior commissure–MCPC | ++ | ++ |
| Nucleus ambiguus–Amb | +++ | +++ |
| Nucleus of the solitary tract–NTS | ++ | ++ |
| Parabigeminal nucleus–PBG | +++ | − |
| Pedunculopontine tegmental nucleus–PPT | ++ | + |
| Raphe magnus nucleus–RMg | ++ | − |
| Retrorubral field–RRF | +++ | +++ |
| Substantia nigra, pars compacta–SNC | +++ | +++ |
| Substantia nigra, pars lateralis–SNL | +++ | +++ |
| Substantia nigra, pars reticulata–SNR | + | − |
| Superior salivatory nucleus–SuS | +++ | +++ |
| Ventral tegmental area–VTA | +++ | ++ |
Qualitative estimates of GHSR mRNA expression were made by considering both signal strength and the number of labeled cells, as described in the Results section. The following density scale was used: ++++, highest density; +++, high density; ++, moderate density; +, low density; −, background density; +/−, inconsistent visualization
Figure 1.


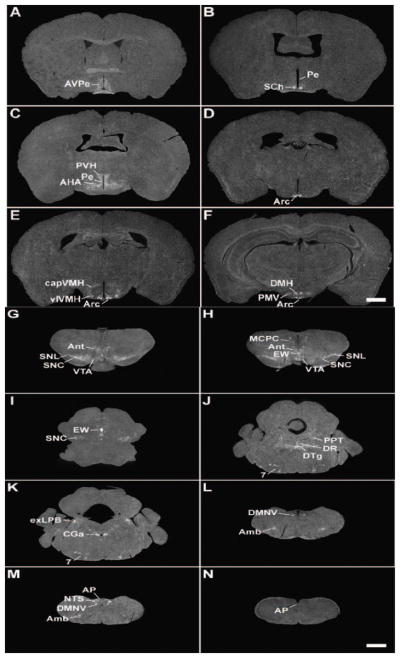
A series of low-power photomicrographs summarizing GHSR type 1a mRNA expression sites in the rat brain and cervical spinal cord. See Table 1 for an explanation of abbreviations. The scale bars represent 2 mm (and apply to all the panels in this figure).
GHSR mRNA was assessed as highest density, high density, moderate density, low density, and background density (undetectable) by considering both signal strength and the number of labeled cells. In addition, some areas in which visualization of cRNA signal inconsistently appeared among different runs/series are also noted. In the case of the rat, the expression patterns were confirmed with a second, smaller riboprobe whose sequence was complementary to a portion of the 3′-untranslated region of rat GHSR mRNA only, and did not also include sequence complementary to the adjacent terminal coding region as did the main rat GHSR riboprobe used in this paper (data not shown). In the case of the mouse, the expression patterns were confirmed by hybridization with the rat GHSR-specific riboprobe (data not shown).
Sites of GHSR mRNA expression
Hippocampus and septum
Weak hybridization was observed within the horizontal and vertical limbs of the nucleus of the diagonal band in the rat, but not the mouse (Figs. 1B, 1C). Also in the rat, high density signal was visualized in the CA2 and CA3 fields of Ammon’s horn and the dentate gyrus, while moderately dense signal was present in the CA1 field (Figs. 1E – 1L). The differential signal intensities observed in the various fields of Ammon’s horn suggests specific binding of riboprobe to GHSR mRNA in these regions, as opposed to non-specific binding which is oftentimes observed in the hippocampus with other riboprobes. Signal within the hippocampus of the mouse was observed on an inconsistent basis (compare the signal in Figs. 2E and 2F). In addition, low density signal was observed within the medial septal nucleus of the rat, but not the mouse.
Figure 2.
A series of low-power photomicrographs summarizing GHSR type 1a mRNA expression sites in the mouse brain and cervical spinal cord. See Table 1 for an explanation of abbreviations. The scale bars represent 1 mm (and apply to all the panels in this figure).
Hypothalamus
Within the hypothalamus of the rat (Figs. 1E – 1I), the most abundant and strongest GHSR signal was observed in the Arc, the VMH and the lateral mamillary nuclei. GHSR signal spanned the entire retrocaudal expanse of the Arc, from the retrochiasmatic area to the level of the lateral mamillary nucleus. A gradient of signal strength and density was appreciated within the VMH, with the dorsomedial part being highest, the center part being high and the ventrolateral part being low (Figs. 1F – 1H). A moderate amount of signal was concentrated within the dorsomedial subdivision of the suprachiasmatic nucleus (Fig. 1D). The same was true within a collection of anteromedian cells (Ant) located at the border of the posterior hypothalamus and the rostral periaqueductal gray (Fig. 1I – 1J). The paraventricular nucleus and the dorsomedial nucleus both contained low density GHSR signal, as did the anteroventral periventricular nucleus, medial preoptic nucleus, and ventrolateral preoptic nucleus (Figs. 1F, 1H, and not pictured).
Although GHSR distribution within the mouse hypothalamus (Figs. 2A – 2F, Fig. 3) mostly mirrored that in the rat, there were some differences. The most striking dissimilarity was the expression pattern within the VMH. Whereas the rat VMH contained one of the highest densities of GHSR signal, GHSR expression within the mouse VMH was minimal and was limited to the ventrolateral subdivision and the capsule of the VMH (Fig. 2E and Fig. 3C). A similar disparity was observed in the lateral mamillary nucleus; specifically, in the rat, GHSR signal was high, but in the mouse, GHSR signal was absent (Figs. 1I – 1J). More subtle differences were observed elsewhere. For example, GHSR expression in the mouse anteroventral periventricular, dorsomedial, paraventricular and suprachiasmatic nuclei was more apparent than in the rat (Figs. 2A – 2C, 2F, 1D, 1F, 1H, and not pictured). Also, moderate density GHSR signal was observed in the ventral premamillary nucleus and low density GHSR signal was observed in the anterior hypothalamic area, anterodorsal preoptic nucleus, parastrial nucleus, periventricular hypothalamic nucleus, ventral subparaventricular nucleus and ventromedial preoptic nucleus of the mouse only; no signal was observed in these same regions within the rat brain (Figs. 2B – 2C, and not pictured). The reverse was observed for the medial preoptic nucleus and ventrolateral preoptic nucleus, where low density signal was observed only for the rat but not the mouse (not pictured).
Figure 3.

A series of high-power photomicrographs demonstrating GHSR type 1a mRNA expression in the tuberal hypothalamus of the mouse. A, C, and E: rostrocaudally-arranged brain sections processed for GHSR mRNA by ISHH. B, D, and F: Nissl-stained brain sections adjacent to those appearing in A, C, and E. See Table 1 for an explanation of abbreviations. The scale bar located in panel E represents 200 μm (and applies to all the panels in this figure).
Midbrain, pons and medulla oblongata
Many nuclei within the rat midbrain and brainstem contained a high density of GHSR signal (Fig. 1J – 1S, Figs. 4 –5). These include the compact and lateral regions of the substantia nigra, the ventral tegmental area (VTA), the retrorubral field, the nucleus ambiguus, and the laterodorsal tegmental, facial motor, parabigeminal and superior salivatory nuclei.
Figure 5.
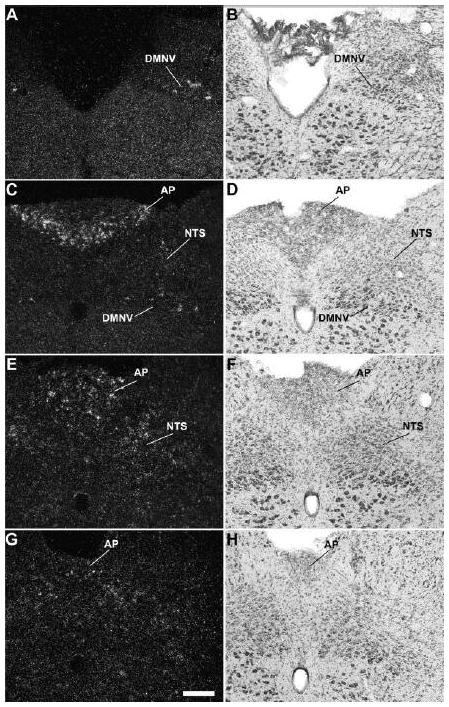
A series of high-power photomicrographs demonstrating GHSR type 1a mRNA expression in the dorsal vagal complex of the rat. A, C, E, and G: rostrocaudally-arranged brain sections processed for GHSR mRNA by ISHH. B, D, F, and H: Nissl-stained brain sections adjacent to those appearing in A, C, E, and G. See Table 1 for an explanation of abbreviations. The scale bar located in panel G represents 200 μm (and applies to all the panels in this figure).
Within the rat facial motor nucleus (Figs. 1R, 4G – 4I), GHSR cRNA riboprobe bound most intensely and in the most neurons of the medial subdivision (particularly in the ventral aspect). Intense expression was also found in the dorsal aspect of the intermediate subdivision and in scattered neurons of the dorsal cap. Less intense expression was observed in the majority of neurons of the ventral aspect of the intermediate subdivision and in scattered neurons of the lateral subdivision. As detailed below, all of these neurons contained CCK-immunoreactivity.
All three components of the dorsal vagal complex of the rat also contained GHSR mRNA (Fig. 1S, Fig. 5). Highest expression was within the area postrema, with moderately dense signal in the nucleus of the solitary tract and low density signal in the dorsal motor nucleus of the vagus. In the rostral part of the area postrema, the GHSR pattern was mostly centered along the ventral rim, resembling that of a necklace or the letter “V” (Figs. 1S, 5C). GHSR signal within the more caudal regions of the area postrema was more diffuse (Figs. 1S, 5E, and 5G). Within the dorsal motor nucleus of the vagus, GHSR signal was strongest in the more rostral sections, including the inferior salivatory nucleus (Fig. 5A).
Other regions of the rat midbrain and brainstem containing GHSR signal included the dorsal raphe nucleus, Edinger Westphal nucleus, external lateral parabrachial nucleus, interpeduncular nucleus, magnocellular nucleus of the posterior commissure, pedunculopontine tegmental nucleus, raphe magnus nucleus and substantia nigra pars reticulata.
Only slight differences in GHSR distribution within the midbrain, pons and medulla oblongata were noted for the mouse (Figs. 2G – 2N, Fig. 6) as compared to the rat. Most notably, expression in the more caudal aspects of the dorsal motor nucleus of the vagus was more apparent, expression in the Edinger Westphal nucleus was more intense and expression within the laterodorsal tegmental nucleus was absent. In addition, within the midbrain and hindbrain of the mouse only and not the rat, GHSR signal was observed in the dorsal tegmental nucleus and central gray, alpha (Figs. 2J – 2K). Conversely, GHSR signal was not observed within the mouse interpeduncular nucleus as it was for the rat. Interestingly, the same “necklace”-type pattern of GHSR expression observed along the ventral rim of the rostral area postrema of the rat was observed for the mouse (Fig. 6C).
Figure 6.
A series of high-power photomicrographs demonstrating GHSR type 1a mRNA expression in the dorsal vagal complex of the mouse. A and C: rostrocaudally-arranged brain sections processed for GHSR mRNA by ISHH. B and D: Nissl-stained brain sections adjacent to those appearing in A and B. See Table 1 for an explanation of abbreviations. The scale bar located in panel C represents 200 μm (and applies to all the panels in this figure).
Cervical Spinal Cord
No GHSR signal was visualized in the cervical spinal cord in either rat (Fig. 1P) or mouse (not pictured).
Chemical phenotypes of GHSR-containing cells
We combined ISHH for GHSR with immunohistochemistry for tyrosine hydroxylase in order to demonstrate and quantify the expression of GHSR within catecholaminergic neurons (Figs. 4A – 4F, 7A – 7F; Table 2). These included Dahlström-Fuxe’s A12 dopamine cell bodies (Dahlstrom and Fuxe, 1964) that populate the Arc (Figs. 4A – 4F). Within the A12 group, GHSR expression appeared stronger in the ventral subgroup (the boxed areas of Fig. 4D, which corresponds to Fig. 4E) than in the dorsal subgroup [the non-boxed TH-immunoreactive (TH-IR) cells observed in Fig. 4D (see also Table 2). Periventricular A14 cells (Figs. 4A – 4C) did not express GHSR. The only other region with observed catecholaminergic neuronal GHSR expression was within the midbrain. Within the midbrain, GHSR signal was observed within A9 dopamine cell bodies populating the substantia nigra pars compacta (Figs. 7A – 7D), the substantia nigra pars lateralis (Figs. 7B, 7C and 7E), the substantia nigra pars reticulata (Figs. 7B and 7C), and retrorubral field (Fig. 7C) and within A10 dopaminergic neurons of the VTA (Figs. 7A – 7C, 7F). Within these midbrain structures, the highest amount of co-expression of GHSR and TH was within the substantia nigra pars lateralis (a little more than half of all TH-IR neurons in the SNL expressed GHSR; Table 2). TH-IR cells populating the substantia nigra pars compacta and VTA included slightly lower percentages of TH-GHSR co-expressers (Table 2) and also occasional GHSR-only neurons. GHSR expression within TH-IR neurons of the substantia nigra pars reticulata was visualized at a lower percentage than in the other segments of the substantia nigra (Table 2). There also was GHSR expression within occasional A10 dopamine cells located in the dorsal mesencephalic raphe nuclei near the aqueduct of Sylvius (not pictured). In general, GHSR and TH co-expression involved many more neurons within the midbrain than within the hypothalamus. Also, we specifically did not visualize GHSR expression in any non-dopaminergic, TH-IR cell bodies, including noradrenaline cells located within the dorsal vagal complex and ventrolateral medulla.
Figure 7.
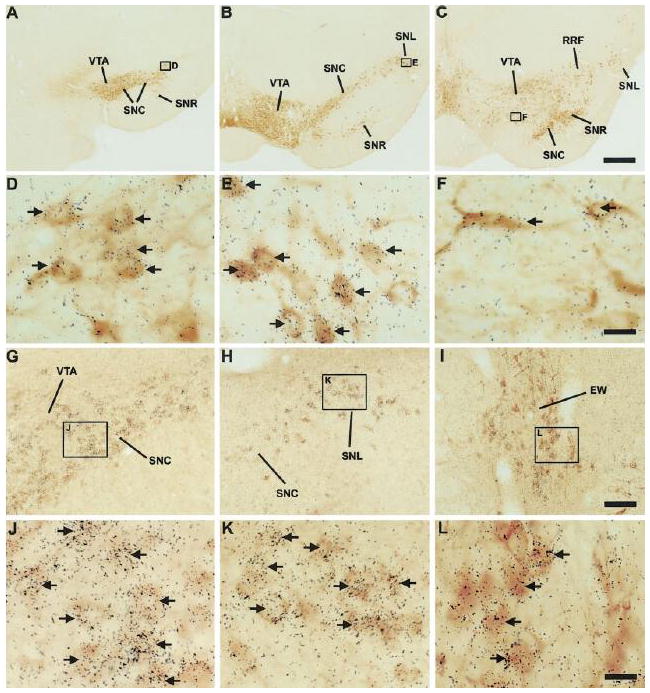
A series of photomicrographs demonstrating co-expression of GHSR with tyrosine hydroxylase and with cholecystokinin in the rat midbrain. A – F: co-expression of GHSR and TH. A, B, and C: rostrocaudally-arranged brain sections through the midbrain. The boxed areas in A, B, and C are magnified in D, E, and F. D: SNC. E: SNL. F: VTA. TH-IR neurons are stained orange brown. Cells expressing GHSR type 1a mRNA have overlying black silver granules. G – L: co-expression of GHSR and CCK. The boxed areas in G, H, and I are magnified in J, K, and L. G: VTA and SNC. H: SNC and SNL. I: EW. J: VTA (upper left corner) and SNC (lower right corner). K: SNL. L: EW. CCK-IR neurons are stained orange-brown. Cells expressing GHSR type 1a mRNA have overlying black silver granules. See Table 1 for an explanation of abbreviations. Black arrows indicate examples of neurons doubly-labeled with GHSR riboprobe and either anti-TH or anti-CCK antisera. The scale bar located in panel C represents 500 μm (and applies to panels A – C); the scale bar located in panel F represents 20 μm (and applies to panels D – F); the scale bar located in panel I represents 100 μm (and applies to panels G – I); the scale bar located in panel L represents 20 μm (and applies to panels J – L).
TABLE 2.
Estimates of Coexpression of GHSR mRNA in TH-Immunoreactive and CCK-Immunoreative Neurons1
| Nucleus | Approximate distance of section to interaural line2 | % TH-IR neurons coexpressing GHSR | % CCK-IR neurons coexpressing GHSR |
|---|---|---|---|
| Arc (dorsal)3 | |||
| 7.3 mm4 | 0.0 ± 0.0 | — | |
| 6.5 mm4 | 4.1 ± 1.8 | — | |
| 5.5 mm | 15.2 ± 3.3 | — | |
| Arc (ventral)3 | |||
| 7.3 mm | 0.0 ± 0.0 | — | |
| 6.5 mm | 65.3 ± 4.4 | — | |
| 5.5 mm | 70.7 ± 2.8 | — | |
| EW | |||
| 4.3 mm | — | 46.6 ± 4.6 | |
| 3.4 mm | — | 39.8 ± 12.0 | |
| 2.8 mm | — | 38.8 ± 21.5 | |
| VTA | |||
| 4.3 mm4 | 46.6 ± 4.6 | 35.5 ± 4.2 | |
| 3.4 mm4 | 23.2 ± 3.4 | 35.5 ± 11.7 | |
| 2.8 mm4 | 25.6 ± 3.9 | 42.7 ± 9.8 | |
| SNC | |||
| 4.3 mm | 40.4 ± 4.3 | 53.2 ± 3.8 | |
| 3.4 mm | 46.2 ± 6.9 | 43.8 ± 6.5 | |
| 2.8 mm | 31.3 ± 9.4 | 38.3 ± 9.3 | |
| SNR | |||
| 4.3 mm | 0.0 ± 0.0 | — | |
| 3.4 mm | 17.3 ± 2.2 | — | |
| 2.8 mm | 26.3 ± 3.4 | 21.9 ± 10.6 | |
| SNL | |||
| 4.3 mm | — | — | |
| 3.4 mm | 56.0 ± 9.0 | 53.9 ± 8.0 | |
| 2.8 mm5 | 36.1 ± 11.2 | 54.6 ± 15.5 | |
The percentage of TH-IR and CCK-IR neurons coexpressing GHSR mRNA was determined, at three different levels through the tuberal hypothalamus and at three different levels through the midbrain. Strict criteria (described in Materals and Methods) were used to make these estimates. The data are reported as the mean percentage ± SEM for 3–5 different brains.
Dashes indicate regions without TH-IR or CCK-IR neurons.
These approximate distances were determined by comparison to figures within the rat brain atlas of Paxinos and Watson (1998) and/or the study by Gonzalez-Hernandez and Rodriguez (2000).
“Dorsal” and “ventral” refer to the dorsal and ventral subgroups of Dahlström-Fuxe’s A12 dopamine cell bodies located within the Arc; although these subgroups are difficult to distinguish at the 7.3 mm level, there nonetheless are no doubly labeled TH/GHSR neurons at this level.
Representative low-power photomicrographs of these levels can be found in Figures 4 and 7, as follows: 7.3 mm, Fig. 4A; 6.5 mm, Fig. 4D; 4.3 mm, Fig. 7A; 3.4 mm, Fig. 7B; and 2.8 mm, Fig. 7C.
Percentages listed at the 2.8 mm level of the SNL include TH-IR or CCK-IR neurons populating both the SNL and the retrorubral field.
We also observed GHSR-expression in a subset of cholecystokinin-IR cell bodies (Figs. 4G – 4I, 7G – 7L). Just as was observed for TH neurons populating the substantia nigra pars lateralis, GHSR was localized to a little more than half of the CCK neurons within the substantia nigra pars lateralis (Figs. 7H and 7K, Table 2). There was also a high degree of GHSR and CCK co-expression within the substantia nigra pars compacta and VTA, which was comparable to that observed in these regions for GHSR and TH (Figs. 7G, 7H and 7J, Table 2). GHSR and CCK co-expression was much lower in the substantia nigra pars reticulata, and was restricted to the more caudal regions of the nucleus (Table 2). Approximately 40% of all CCK-IR neurons populating the Edinger Westphal nucleus were bound by GHSR riboprobe (Figs. 7I and 7L, Table 2). The Edinger Westphal nucleus also contained several obvious GHSR-only neurons. The GHSR riboprobe also bound to CCK-IR neurons within the facial motor nucleus (Figs. 4G – 4I) and within the superior lateral parabrachial subnucleus (not pictured). Interestingly, there was no localization of GHSR to CCK-IR neurons within the area postrema or nucleus of the solitary tract (Fig. 8).
DISCUSSION
In this study, we have systematically examined the distribution of GHSR mRNA in the adult rat and mouse brains and cervical spinal cords by using ISHH with novel cRNA probes specific for the mRNA encoding functional GHSR (the type 1a variant). Our findings are consistent with the proposed roles of ghrelin in regulating body weight homeostasis. We also found expression of GHSR mRNA in several sites known to regulate autonomic function, including several parasympathetic preganglionic neurons. Finally, we found ghrelin receptor expression in several sites, such as midbrain dopamine neurons, that suggest roles for ghrelin in regulating complex behaviors.
Comparison with previous ISHH findings
Our data in the rat hypothalamus is in general agreement with the study by Mitchell and colleagues, in which a human GHSR cRNA probe was used for hybridization (Mitchell et al., 2001). Our study did, however, demonstrate a more extensive distribution pattern within the hypothalamus. Also, we did not observe GHSR signal within the lateral hypothalamic area. Our data also, in general, matched the GHSR distribution map described by Guan and colleagues, in which 33P-labeled oligonucleotide probes were used for hybridization (Guan et al., 1997). However, as was the case for the Mitchell study, we demonstrated a much broader distribution of GHSR both within the hypothalamus and within extra-hypothalamic sites. Our study also differed from that of Guan and colleagues in that we did not find GHSR signal within the supraoptic nucleus or the anterior hypothalamic area of the rat (although we did detect low density signal within the mouse anterior hypothalamic area). Furthermore, we identified strong GHSR expression within the lateral mamillary nucleus, not the tuberomammilary nucleus (Guan et al., 1997). In addition, we suggest that the GHSR signal labeled by Guan and colleagues as occurring in the parafascicular thalamic nucleus, at the border of the posterior hypothalamus and the rostral periaqueductal gray, is actually a rostral continuation of the Edinger Westphal nucleus, which we have denoted as the anteromedian nucleus. The sites in which we found GHSR expression that had not previously been recognized by ISHH in any species as containing GHSR mRNA were numerous and included several nuclei in the preoptic region (anterodorsal preoptic nucleus, medial preoptic nucleus, parastrial nucleus, ventrolateral preoptic nucleus, and ventromedial preoptic nucleus) and several nuclei along the midbrain raphe (including the raphe magnus nucleus). ISHH visualization of GHSR mRNA expression also had not previously been reported in the central gray, alpha, the magnocellular nucleus of the posterior commissure, the nucleus ambiguus, the retrochiasmatic area, the retrorubral field, the substantia nigra pars lateralis, the substantia nigra pars reticulata, the three components of the dorsal vagal complex, including the area postrema, nucleus of the solitary tract and the dorsal motor nucleus of the vagus, or the dorsal tegmental, external lateral parabrachial, parabigeminal, pedunculopontine tegmental, superior salivatory, ventral premamillary and ventral subparaventricular nuclei.
The reason for the aforementioned discrepancies among the various ISHH studies is unclear, but likely includes differences in sensitivity and/or specificity of the respective probes used. For instance, the oligonucleotide probes, full length cRNA riboprobes and non-species-specific probes used in the previous GHSR ISHH distribution studies could all potentially bind to either non-GHSR mRNA species or to the alternatively-spliced GHSR mRNA species that encodes the biologically inactive GHSR variant (type 1b) (McKee et al., 1997). Regardless, our novel cRNA probes provided an excellent hybridization signal-to-noise ratio. Therefore, our probes may have allowed us to detect even low levels of hybridization above background that had not been described in the other studies.
In addition, our study is the first report detailing the distribution of GHSR within the mouse CNS. Such information specifically for the mouse will be important in future studies with transgenic mouse models that target GHSR expression or target deletion of such expression to specific neuronal sites or to neurons of a specific chemical phenotype.
Differential GHSR Expression in the Mouse and Rat
We found GHSR expression within rat and mouse to be highly similar. When differences were observed between these two rodent species, they mostly involved differences in signal density. Some notable differences, though, did exist, for instance in the lateral mamillary and laterodorsal tegmental nuclei. Similarly, the VMH of the rat contained one of the highest densities of GHSR signal within the brain, while the VMH of the mouse contained signal limited to the capsule of the VMH and scattered cells within the ventrolateral subdivision. GHSR signal within the rat VMH had previously been demonstrated in multiple studies, although within the lemur VMH, GHSR signal specifically was not demonstrated (Bennett et al., 1997; Guan et al., 1997; Howard et al., 1996; Mitchell et al., 2001; Nogueiras et al., 2004; Tannenbaum et al., 1998; Willesen et al., 1999). Certainly, the demonstration of ghrelin-responsive neurons within the VMH, as might be suggested by the finding of GHSR expression within that nucleus, might help to clarify the mechanisms by which the VMH contributes to body weight homeostasis (Elmquist et al., 1999; Majdic et al., 2002). However, the marked differences in GHSR expression within the VMH of the rat as compared to the mouse and lemur might suggest that the VMH is not a key site of ghrelin action, especially regarding ghrelin’s effects on body weight. Supporting such a view, previous studies have failed to demonstrate c-fos induction within the VMH following intracerebroventricular infusion of ghrelin (although c-fos was induced with a synthetic GHSR agonist) (Lawrence et al., 2002). In addition, direct microinjection into the VMH results in a significant increase in food intake, but only in the second hour postinjection (and only at doses that are likely higher than physiologic) (Wren et al., 2001). Furthermore, although fasting or central infusion of leptin both increase GHSR expression within the Arc, which is a site implicated by many studies as being a main target of ghrelin orexigenic action, no such difference in GHSR expression was observed for the VMH (Nogueiras et al., 2004). Of course, this last finding does not address the possibility that the GHSRs within rat VMH are important for ghrelin’s other, non-body weight homeostasis-related functions.
Functional Implications
Feeding Behavior
Ghrelin plays an important role in signaling energy insufficiency. Human studies have found a preprandial rise and a postprandial decline in plasma ghrelin levels, suggesting that ghrelin plays a physiological role in hunger and meal initiation (Cummings et al., 2004; Cummings et al., 2001; Cummings et al., 2002). Fasting-associated elevations in ghrelin also occur in animals, both acutely and with chronic food deprivation (Tschop et al., 2000; Wisse et al., 2001). Importantly, these elevations in ghrelin have a functional consequence aimed at reversing the state of energy deficit in which they arise. For example, anti-ghrelin IgG and GHSR antagonists suppress feeding in rodents while ghrelin administration strongly stimulates feeding (Asakawa et al., 2003; Asakawa et al., 2001; Kamegai et al., 2000; Nakazato et al., 2001; Tschop et al., 2000; Wang et al., 2002; Yasuda et al., 2003). This strong orexigenic property, along with effects on energy expenditure and metabolic fuel preference, is believed to contribute to ghrelin’s ability to increase adiposity and body weight (Tschop et al., 2002; Wortley et al., 2004).
Our description of hypothalamic GHSR expression supports many previous studies indicating the importance of the hypothalamus -- particularly arcuate NPY/agouti-related protein neurons and arcuate POMC/cocaine- and amphetamine-regulated transcript neurons -- in mediating of ghrelin’s orexigenic actions [see (Zigman and Elmquist, 2003) for review]. GHSR expression in other hypothalamic and extra-hypothalamic sites also are likely involved in ghrelin’s effects on food intake. For instance, a recent study by Shuto and colleagues directly implicates the involvement of GHSR-containing TH-neurons in GH secretion and body weight homeostasis (Shuto et al., 2002). In this latter study, transgenic rats expressing an antisense GHSR mRNA under the control of the TH promoter were shown to have attenuated GHSR expression in TH-IR, Arc neurons (Shuto et al., 2002). These rats ate less, both at baseline and in response to administration of a GHSR agonist, and they also were leaner than controls (Shuto et al., 2002). Furthermore, these rats had reduced GHSR agonist-stimulated GH secretion. These effects were attributed to alterations in the ghrelin-responsiveness of arcuate TH neurons, although the possible contribution of TH neurons expressing GHSRs outside of the Arc was not considered (Shuto et al., 2002). Interestingly, the report by Shuto and colleagues suggests that the arcuate TH/GHSR neurons are distinct from arcuate NPY/GHSR neurons (Shuto et al., 2002). Our current study confirms the finding by Shuto and colleagues of GHSR-TH co-expression within the Arc. We also found even higher numbers of TH and GHSR co-expressing neurons within the substantia nigra pars compacta, substantia nigra pars lateralis, retrorubral field and VTA, as well as occasional co-existence in the substantia nigra pars reticulata and the dorsal most aspect of the dorsal raphe nucleus. Thus, it is plausible for these extra-arcuate GHSR-TH co-expressing neurons to be involved in the normal orexigenic and adipogenic pathways lacking in the previously-described transgenic rats.
One of our most significant findings was the demonstration of GHSR mRNA within all three components of the dorsal vagal complex, including the area postrema, nucleus of the solitary tract and dorsal motor nucleus of the vagus, of both the rat and the mouse. Consistent with these observations, a growing body of evidence suggests that direct interactions by both ghrelin and leptin with neural circuits originating in these caudal brainstem nuclei are important for control of feeding behaviors. For example, Ob-Rb (leptin receptor) mRNA is found in many brainstem nuclei involved in food intake, including the dorsal vagal complex (Elmquist et al., 1998; Grill et al., 2002). The findings in our current study complement some recent IHC studies that demonstrated GHSR-IR within the dorsal vagal complex, although these studies were not in complete agreement. In one study, GHSR-IR was demonstrated in the nucleus of the solitary tract and the dorsal motor nucleus of the vagus but not the area postrema (Lin et al., 2004). In another study, GHSR-IR was noted in only in the dorsal motor nucleus of the vagus (Zhang et al., 2004). This latter study also found GHSR within the dorsal motor nucleus of the vagus by RT-PCR. The presence of ghrelin and leptin receptors in the brainstem likely contributes to the c-fos induction in the brainstem following ghrelin or leptin administration (Elias et al., 2000; Lawrence et al., 2002; Lee et al., 2002; Nakazato et al., 2001; Van Dijk et al., 1996). In the case of ghrelin, one study reported c-fos induction in the nucleus of the solitary tract and area postrema (Lawrence et al., 2002) while another demonstrated c-fos induction in the nucleus of the solitary tract and the dorsal motor nucleus of the vagus (Date et al., 2001). Additionally, delivery of ghrelin to the caudal brainstem, via injection into the 4th ventricle, increases cumulative food intake, number of meals and size of meals during the first few hours after treatment and decreases the time till first meal onset, while similar treatment with leptin decreases food intake (Faulconbridge et al., 2003; Grill et al., 2002). Intriguingly, the changes induced by ghrelin infusion into the 4th ventricle were comparable to those elicited by identical injections into the 3rd ventricle, in which ghrelin would be exposed to the arcuate nucleus (Faulconbridge et al., 2003). Similarly, the hyperphagia achieved by microinjection of ghrelin into the dorsal vagal complex was elicited using a dose (10 pmol) lower than the lowest effective dose (30 pmol) previously shown to induce hyperphagia upon microinjection into the Arc (Faulconbridge et al., 2003; Wren et al., 2001).
Autonomic Function
When GHSR expression within the dorsal motor nucleus of the vagus is viewed in conjunction with the finding of strong GHSR expression within areas including the Edinger Westphal nucleus, superior salivatory nucleus, and nucleus ambiguus, it becomes apparent that GHSR is expressed in a continuum of central sites, from the level of the midbrain down to the caudal brainstem, that regulate autonomic function. Notably, GHSR expression within parasympathetic preganglionic neurons based in the dorsal motor nucleus of the vagus may be directly involved with ghrelin’s ability to strongly stimulate motility in the stomach and small intestine (Edholm et al., 2004; Masuda et al., 2000). Ghrelin has the ability to reverse postoperative gastric ileus, and is considered to be the most potent known agent tested to accelerate gastric emptying in rodents (Inui et al., 2004). Ghrelin action via GHSR expression in the nucleus ambiguus might potentially be involved in esophageal motility, although this has not yet been investigated. GHSR expression in the dorsal vagal complex also is likely involved in ghrelin’s actions on stimulating gastric acid secretion (Date et al., 2001; Masuda et al., 2000). Ghrelin’s stimulatory effects on gastrointestinal motility and gastric acid secretion are consistent with ghrelin’s actions on food intake and body weight homeostasis. Similarly consistent, GHSR expression in the superior and inferior salivatory nuclei would seem to predict that ghrelin also may help regulate the production of saliva.
GHSR expression in the dorsal vagal complex also is likely involved in ghrelin’s autonomic effects on the cardiovascular system. A number of studies have demonstrated that ghrelin can lower systemic vascular resistance and improve left ventricular function (Enomoto et al., 2003; Nagaya and Kangawa, 2003; Nagaya et al., 2001; Van Der Lely et al., 2004). Importantly, unilateral microinjection of low doses of ghrelin into the nucleus of the solitary tract has recently been shown to decrease mean arterial pressure, heart rate and renal sympathetic nerve activity (Lin et al., 2004).
Interestingly, the cholinergic system seems to be a key player in controlling ghrelin secretion. For instance, subdiaphragmatic vagotomy prevents fasting-induced increases in ghrelin, although it has no effects on baseline ghrelin levels (Williams et al., 2003). Atropine also has the same suppressive effect on fasting-induced ghrelin release, in both rodents and humans (Maier et al., 2004; Williams et al., 2003). It is as yet unclear how GHSR expression in the dorsal vagal complex might contribute to vagal control of ghrelin release.
Also of note, the “necklace”-type pattern of GHSR expression within the rostral area postrema is reminiscent of the pattern of CCK expression previously described by Horst and Saper for this same region (Horst et al., 1990; Horst and Saper, 1990). These CCK-IR area postrema neurons, along with CCK-IR neurons in the adjacent dorsomedial NTS subnucleus, were shown by Horst and Saper to innervate the outer portion of the external lateral parabrachial subnucleus (Horst et al., 1990; Horst and Saper, 1990). However, despite the apparent similarities in the distributions of GHSR neurons and CCK neurons within the area postrema, our dual-label studies demonstrate that these patterns do not overlap. Rather, within the dorsal vagal complex, the GHSR riboprobe labels a cell population that is distinct from neurons containing CCK-immunoreactivity. Thus, it is probable that the neurons within this region that are responsive to ghrelin regulate a subset of autonomic functions distinct from those regulated by CCK-containing neurons projecting to the parabrachial nucleus.
Reward Behaviors and Locomotor Activity
As discussed already, we found high levels of GHSR expression within TH-IR neurons in the VTA. Interestingly, these dopaminergic VTA neurons have been highly studied due to their involvement in brain reward circuits, such as those associated with addictive substances (Nestler, 1996). Ghrelin-responsivity by these TH-neurons may explain the motivational properties recently demonstrated for ghrelin, in which ghrelin produced a significant increase in break point compared to saline in rats trained to lever press under a progressive ratio 1 reinforcement schedule (Jewett et al., 2003). Such elicitation of goal-directed behaviors by ghrelin would be aimed at increasing intake of nutrients.
Given our finding of high levels of GHSR-TH co-expression within the VTA, as well as within the substantia nigra pars compacta and substantia nigra pars lateralis, it is not surprising that we also found equally high levels of GHSR-CCK co-expression within these midbrain structures. In fact, multiple studies, including those by Hökfelt and colleagues, have demonstrated co-expression of CCK and TH within the VTA and substantia nigra (Gonzalez-Hernandez and Rodriguez, 2000; Hokfelt et al., 1980; Kiyama et al., 1991; Seroogy et al., 1989a; Seroogy et al., 1989b). Within the substantia nigra pars lateralis, virtually 100% of neurons express both TH and CCK (Gonzalez-Hernandez and Rodriguez, 2000; Kiyama et al., 1991; Seroogy et al., 1989b). Our data indicates that a little more than half of these substantia nigra pars lateralis TH/CCK neurons express GHSR. Within the substantia nigra pars compacta, about 60 – 70% of dopaminergic neurons also contain CCK, and within the substantia nigra pars reticulata and retrorubral field, occasional TH/CCK neurons exist (Gonzalez-Hernandez and Rodriguez, 2000; Seroogy et al., 1989b). In general, about 50% of all TH-expressing cells within the VTA co-express CCK; both TH-only and CCK-only cells also exist in the VTA (Seroogy et al., 1989b). Retrograde tracer and lesion experiments confirm that the majority of these dopaminergic, CCK midbrain neurons give rise to the ascending mesotelencephalic system projecting to various forebrain structures such as the caudate-putamen and nucleus accumbens (Seroogy et al., 1989b). Our pattern of observed GHSR mRNA co-existence with TH and with CCK suggests that a large number of these mesotelencephalic neurons are potentially ghrelin-responsive. The specific role of CCK in these dopaminergic neurons is not well understood, and therefore it is difficult to speculate how engagement of these neurons by ghrelin may differentially affect dopamine or CCK release, and how that, in turn, might affect more global behavioral changes.
Expression of GHSR within the substantia nigra may be related to possible effects of ghrelin on locomotion. Dopaminergic neurons of the substantia nigra have been implicated in effecting meal-induced changes in motor activity (Levin, 2000). Importantly, a recent study also has demonstrated a direct effect of ghrelin on locomotor activity (Tang-Christensen et al., 2004). In this study, central administration of ghrelin led to a sustained decrease in spontaneous locomotor activity, although this change was delayed and independent from increased food intake and also was similar to the effects induced by AgRP (Tang-Christensen et al., 2004).
Expression in the Facial Motor Nucleus
GHSR expression has been noted in the facial motor nucleus of the rat previously (Guan et al., 1997), although its distribution within the various facial motor nucleus subdivisions has not been previously discussed. These subdivisions include three main ones (medial, intermediate and lateral), each of which contains about 30% of the facial motoneurons, as well as a fourth (dorsal cap) that contains about 10% of the neurons and a fifth, much smaller group of neurons (suprafacial nucleus) that lies dorsally (Ashwell, 1982; Friauf and Herbert, 1985; Hinrichsen and Watson, 1984; Komiyama et al., 1984; Martin and Lodge, 1977; Watson et al., 1982). Importantly, a well-established musculotopic organization within the facial motor nucleus subdivisions exists for many species, including the rat and mouse, in which the anteroposterior axis of the face is projected lateromedially on the facial motor nucleus (Ashwell, 1982; Friauf and Herbert, 1985; Hinrichsen and Watson, 1984; Komiyama et al., 1984; Martin and Lodge, 1977; Watson et al., 1982). As such, the soma of motoneurons controlling nasolabial muscles are located in the lateral subdivision, while those innervating perioral, orbital and neck muscles are in the intermediate subdivision and those innervating the external ear are in the medial subdivision. Additionally, the dorsoventral relationship of facial muscles is maintained within the facial motor nucleus, albeit not with the same precision for all facial muscle groups. According to this myotopic organization, it would appear that for both the rat and mouse, GHSR expression is most intense and abundant in the facial motor nucleus subdivisions that control the movements of the external ear and eyelids. There is less intense and less abundant expression within the soma of motoneurons that project to the perioral and neck musculature, and even less intense and less abundant expression in the subdivision containing the motoneurons that innervate the muscles controlling the movement of whiskers. It is unclear how the distribution of GHSR among these facial motor nucleus subdivisions relates to its known functions.
Expression in Areas without Immediate Access Circulating Ghrelin
Some of the sites of GHSR expression, such as the Arc and the dorsal vagal complex, likely have direct access to ghrelin circulating in the bloodstream. For the Arc, this notion is supported by studies in which peripheral ghrelin and ghrelin mimetic administration induce c-fos in the Arc (Hewson and Dickson, 2000; Hewson et al., 2002; Traebert et al., 2002; Wang et al., 2002). However, it is as yet unclear how circulating ghrelin (especially with its unique acetyl modification) would gain access to and influence the activity of neurons in other areas of GHSR expression that are more distantly situated from circumventricular organs, calling into question the physiologic relevance of GHSR in many of these other sites. One possible explanation for GHSR expression in those sites without immediate access to the blood-brain barrier comes from the observations of ghrelin-producing central neurons (Cowley et al., 2003; Horvath et al., 2001; Hosoda et al., 2000; Kojima et al., 1999; Lu et al., 2002; Tomasetto et al., 2000; Van Der Lely et al., 2004; Volante et al., 2002). In such a scenario, centrally-produced ghrelin and not circulating ghrelin would be readily available to engage the GHSRs. However, the source(s) and physiological significance of CNS ghrelin remains to be determined. Another possible answer to the question of physiologic relevance of GHSR expression in these other central sites comes from the work of Holst and colleagues in which GHSR transfected into COS-7 cells and HEK 293 cells was shown to be highly constitutively active (approximately 50% of its maximal activity, which occurs in the presence of ghrelin). Such high ligand-independent signaling activity by GHSR in situ would have a profound effect on the functioning of the neurons in which it is expressed and also might indicate the presence of an as-of-yet unidentified, potentially centrally-produced inverse agonist counterpart to ghrelin (Holst et al., 2003; Holst et al., 2004).
Conclusion
In conclusion, our study confirms and extends the previous descriptions of central GHSR expression and suggests that there are several potential target sites within the brain for ghrelin. These sites likely contribute differentially to ghrelin’s many actions, including its many important roles in inducing varied behavioral, neuroendocrine, and autonomic responses to changes in nutritional availability.
Acknowledgments
Support:
This work was supported by NIH Grants 5T32DK07516-18, 1F32DK064564-01, DK56116 and DK53301, and Takeda Chemical Industries, Ltd.
OTHER ACKNOWLEDGMENTS
Brian J. Choi for excellent technical assistance.
LITERATURE CITED
- Ariyasu H, Takaya K, Tagami T, Ogawa Y, Hosoda K, Akamizu T, Suda M, Koh T, Natsui K, Toyooka S, Shirakami G, Usui T, Shimatsu A, Doi K, Hosoda H, Kojima M, Kangawa K, Nakao K. Stomach is a major source of circulating ghrelin, and feeding state determines plasma ghrelin-like immunoreactivity levels in humans. J Clin Endocrinol Metab. 2001;86(10):4753–4758. doi: 10.1210/jcem.86.10.7885. [DOI] [PubMed] [Google Scholar]
- Arosio M, Ronchi CL, Gebbia C, Cappiello V, Beck-Peccoz P, Peracchi M. Stimulatory effects of ghrelin on circulating somatostatin and pancreatic polypeptide levels. J Clin Endocrinol Metab. 2003;88(2):701–704. doi: 10.1210/jc.2002-021161. [DOI] [PubMed] [Google Scholar]
- Asakawa A, Inui A, Kaga T, Katsuura G, Fujimiya M, Fujino MA, Kasuga M. Antagonism of ghrelin receptor reduces food intake and body weight gain in mice. Gut. 2003;52(7):947–952. doi: 10.1136/gut.52.7.947. [DOI] [PMC free article] [PubMed] [Google Scholar]
- Asakawa A, Inui A, Kaga T, Yuzuriha H, Nagata T, Ueno N, Makino S, Fujimiya M, Niijima A, Fujino MA, Kasuga M. Ghrelin is an appetite-stimulatory signal from stomach with structural resemblance to motilin. Gastroenterology. 2001;120(2):337–345. doi: 10.1053/gast.2001.22158. [DOI] [PubMed] [Google Scholar]
- Ashwell KW. The adult mouse facial nerve nucleus: morphology and musculotopic organization. J Anat. 1982;135 (3):531–538. [PMC free article] [PubMed] [Google Scholar]
- Bennett PA, Thomas GB, Howard AD, Feighner SD, van der Ploeg LH, Smith RG, Robinson IC. Hypothalamic growth hormone secretagogue-receptor (GHS-R) expression is regulated by growth hormone in the rat. Endocrinology. 1997;138(11):4552–4557. doi: 10.1210/endo.138.11.5476. [DOI] [PubMed] [Google Scholar]
- Cowley MA, Smith RG, Diano S, Tschop M, Pronchuk N, Grove KL, Strasburger CJ, Bidlingmaier M, Esterman M, Heiman ML, Garcia-Segura LM, Nillni EA, Mendez P, Low MJ, Sotonyi P, Friedman JM, Liu H, Pinto S, Colmers WF, Cone RD, Horvath TL. The distribution and mechanism of action of ghrelin in the CNS demonstrates a novel hypothalamic circuit regulating energy homeostasis. Neuron. 2003;37(4):649–661. doi: 10.1016/s0896-6273(03)00063-1. [DOI] [PubMed] [Google Scholar]
- Cummings DE, Frayo RS, Marmonier C, Aubert R, Chapelot D. Plasma Ghrelin Levels and Hunger Scores Among Humans Initiating Meals Voluntarily in the Absence of Time- and Food-Related Cues. Am J Physiol Endocrinol Metab. 2004 doi: 10.1152/ajpendo.00582.2003. [DOI] [PubMed] [Google Scholar]
- Cummings DE, Purnell JQ, Frayo RS, Schmidova K, Wisse BE, Weigle DS. A preprandial rise in plasma ghrelin levels suggests a role in meal initiation in humans. Diabetes. 2001;50(8):1714–1719. doi: 10.2337/diabetes.50.8.1714. [DOI] [PubMed] [Google Scholar]
- Cummings DE, Weigle DS, Frayo RS, Breen PA, Ma MK, Dellinger EP, Purnell JQ. Plasma ghrelin levels after diet-induced weight loss or gastric bypass surgery. N Engl J Med. 2002;346(21):1623–1630. doi: 10.1056/NEJMoa012908. [DOI] [PubMed] [Google Scholar]
- Dahlstrom A, Fuxe K. Localization of monoamines in the lower brain stem. Experientia. 1964;20(7):398–399. doi: 10.1007/BF02147990. [DOI] [PubMed] [Google Scholar]
- Date Y, Kojima M, Hosoda H, Sawaguchi A, Mondal MS, Suganuma T, Matsukura S, Kangawa K, Nakazato M. Ghrelin, a novel growth hormone-releasing acylated peptide, is synthesized in a distinct endocrine cell type in the gastrointestinal tracts of rats and humans. Endocrinology. 2000;141(11):4255–4261. doi: 10.1210/endo.141.11.7757. [DOI] [PubMed] [Google Scholar]
- Date Y, Nakazato M, Hashiguchi S, Dezaki K, Mondal MS, Hosoda H, Kojima M, Kangawa K, Arima T, Matsuo H, Yada T, Matsukura S. Ghrelin is present in pancreatic alpha-cells of humans and rats and stimulates insulin secretion. Diabetes. 2002;51(1):124–129. doi: 10.2337/diabetes.51.1.124. [DOI] [PubMed] [Google Scholar]
- Date Y, Nakazato M, Murakami N, Kojima M, Kangawa K, Matsukura S. Ghrelin acts in the central nervous system to stimulate gastric acid secretion. Biochem Biophys Res Commun. 2001;280(3):904–907. doi: 10.1006/bbrc.2000.4212. [DOI] [PubMed] [Google Scholar]
- Dezaki K, Hosoda H, Kakei M, Hashiguchi S, Watanabe M, Kangawa K, Yada T. Endogenous ghrelin in pancreatic islets restricts insulin release by attenuating Ca2+ signaling in beta-cells: implication in the glycemic control in rodents. Diabetes. 2004;53(12):3142–3151. doi: 10.2337/diabetes.53.12.3142. [DOI] [PubMed] [Google Scholar]
- Edholm T, Levin F, Hellstrom PM, Schmidt PT. Ghrelin stimulates motility in the small intestine of rats through intrinsic cholinergic neurons. Regul Pept. 2004;121(1–3):25–30. doi: 10.1016/j.regpep.2004.04.001. [DOI] [PubMed] [Google Scholar]
- Egido EM, Rodriguez-Gallardo J, Silvestre RA, Marco J. Inhibitory effect of ghrelin on insulin and pancreatic somatostatin secretion. Eur J Endocrinol. 2002;146(2):241–244. doi: 10.1530/eje.0.1460241. [DOI] [PubMed] [Google Scholar]
- Elias CF, Kelly JF, Lee CE, Ahima RS, Drucker DJ, Saper CB, Elmquist JK. Chemical characterization of leptin-activated neurons in the rat brain. J Comp Neurol. 2000;423(2):261–281. [PubMed] [Google Scholar]
- Elias CF, Saper CB, Maratos-Flier E, Tritos NA, Lee C, Kelly J, Tatro JB, Hoffman GE, Ollmann MM, Barsh GS, Sakurai T, Yanagisawa M, Elmquist JK. Chemically defined projections linking the mediobasal hypothalamus and the lateral hypothalamic area. J Comp Neurol. 1998;402(4):442–459. [PubMed] [Google Scholar]
- Elmquist JK, Bjorbaek C, Ahima RS, Flier JS, Saper CB. Distributions of leptin receptor mRNA isoforms in the rat brain. J Comp Neurol. 1998;395(4):535–547. [PubMed] [Google Scholar]
- Elmquist JK, Elias CF, Saper CB. From lesions to leptin: hypothalamic control of food intake and body weight. Neuron. 1999;22(2):221–232. doi: 10.1016/s0896-6273(00)81084-3. [DOI] [PubMed] [Google Scholar]
- Enomoto M, Nagaya N, Uematsu M, Okumura H, Nakagawa E, Ono F, Hosoda H, Oya H, Kojima M, Kanmatsuse K, Kangawa K. Cardiovascular and hormonal effects of subcutaneous administration of ghrelin, a novel growth hormone-releasing peptide, in healthy humans. Clin Sci (Lond) 2003;105(4):431–435. doi: 10.1042/CS20030184. [DOI] [PubMed] [Google Scholar]
- Faulconbridge LF, Cummings DE, Kaplan JM, Grill HJ. Hyperphagic effects of brainstem ghrelin administration. Diabetes. 2003;52(9):2260–2265. doi: 10.2337/diabetes.52.9.2260. [DOI] [PubMed] [Google Scholar]
- Franklin KBJ, Paxinos G. The mouse brain in stereotaxic coordinates. San Diego: Academic Press; 1997. [Google Scholar]
- Friauf E, Herbert H. Topographic organization of facial motoneurons to individual pinna muscles in rat (Rattus rattus) and bat (Rousettus aegyptiacus) J Comp Neurol. 1985;240(2):161–170. doi: 10.1002/cne.902400206. [DOI] [PubMed] [Google Scholar]
- Gnanapavan S, Kola B, Bustin SA, Morris DG, McGee P, Fairclough P, Bhattacharya S, Carpenter R, Grossman AB, Korbonits M. The tissue distribution of the mRNA of ghrelin and subtypes of its receptor, GHS-R, in humans. J Clin Endocrinol Metab. 2002;87(6):2988. doi: 10.1210/jcem.87.6.8739. [DOI] [PubMed] [Google Scholar]
- Gonzalez-Hernandez T, Rodriguez M. Compartmental organization and chemical profile of dopaminergic and GABAergic neurons in the substantia nigra of the rat. J Comp Neurol. 2000;421(1):107–135. doi: 10.1002/(sici)1096-9861(20000522)421:1<107::aid-cne7>3.3.co;2-6. [DOI] [PubMed] [Google Scholar]
- Grill HJ, Schwartz MW, Kaplan JM, Foxhall JS, Breininger J, Baskin DG. Evidence that the caudal brainstem is a target for the inhibitory effect of leptin on food intake. Endocrinology. 2002;143(1):239–246. doi: 10.1210/endo.143.1.8589. [DOI] [PubMed] [Google Scholar]
- Guan XM, Yu H, Palyha OC, McKee KK, Feighner SD, Sirinathsinghji DJ, Smith RG, Van der Ploeg LH, Howard AD. Distribution of mRNA encoding the growth hormone secretagogue receptor in brain and peripheral tissues. Brain Res Mol Brain Res. 1997;48(1):23–29. doi: 10.1016/s0169-328x(97)00071-5. [DOI] [PubMed] [Google Scholar]
- Hewson AK, Dickson SL. Systemic administration of ghrelin induces Fos and Egr-1 proteins in the hypothalamic arcuate nucleus of fasted and fed rats. J Neuroendocrinol. 2000;12(11):1047–1049. doi: 10.1046/j.1365-2826.2000.00584.x. [DOI] [PubMed] [Google Scholar]
- Hewson AK, Tung LY, Connell DW, Tookman L, Dickson SL. The rat arcuate nucleus integrates peripheral signals provided by leptin, insulin, and a ghrelin mimetic. Diabetes. 2002;51(12):3412–3419. doi: 10.2337/diabetes.51.12.3412. [DOI] [PubMed] [Google Scholar]
- Hinrichsen CF, Watson CD. The facial nucleus of the rat: representation of facial muscles revealed by retrograde transport of horseradish peroxidase. Anat Rec. 1984;209(3):407–415. doi: 10.1002/ar.1092090321. [DOI] [PubMed] [Google Scholar]
- Hokfelt T, Rehfeld JF, Skirboll L, Ivemark B, Goldstein M, Markey K. Evidence for coexistence of dopamine and CCK in meso-limbic neurones. Nature. 1980;285(5765):476–478. doi: 10.1038/285476a0. [DOI] [PubMed] [Google Scholar]
- Holst B, Cygankiewicz A, Jensen TH, Ankersen M, Schwartz TW. High constitutive signaling of the ghrelin receptor--identification of a potent inverse agonist. Mol Endocrinol. 2003;17(11):2201–2210. doi: 10.1210/me.2003-0069. [DOI] [PubMed] [Google Scholar]
- Holst B, Holliday ND, Bach A, Elling CE, Cox HM, Schwartz TW. Common Structural Basis for Constitutive Activity of the Ghrelin Receptor Family. J Biol Chem. 2004;279(51):53806–53817. doi: 10.1074/jbc.M407676200. [DOI] [PubMed] [Google Scholar]
- Horvath TL, Diano S, Sotonyi P, Heiman M, Tschop M. Minireview: ghrelin and the regulation of energy balance--a hypothalamic perspective. Endocrinology. 2001;142(10):4163–4169. doi: 10.1210/endo.142.10.8490. [DOI] [PubMed] [Google Scholar]
- Hosoda H, Kojima M, Matsuo H, Kangawa K. Ghrelin and des-acyl ghrelin: two major forms of rat ghrelin peptide in gastrointestinal tissue. Biochem Biophys Res Commun. 2000;279(3):909–913. doi: 10.1006/bbrc.2000.4039. [DOI] [PubMed] [Google Scholar]
- Howard AD, Feighner SD, Cully DF, Arena JP, Liberator PA, Rosenblum CI, Hamelin M, Hreniuk DL, Palyha OC, Anderson J, Paress PS, Diaz C, Chou M, Liu KK, McKee KK, Pong SS, Chaung LY, Elbrecht A, Dashkevicz M, Heavens R, Rigby M, Sirinathsinghji DJ, Dean DC, Melillo DG, Van der Ploeg LH, et al. A receptor in pituitary and hypothalamus that functions in growth hormone release. Science. 1996;273(5277):974–977. doi: 10.1126/science.273.5277.974. [DOI] [PubMed] [Google Scholar]
- Inui A, Asakawa A, Bowers CY, Mantovani G, Laviano A, Meguid MM, Fujimiya M. Ghrelin, appetite, and gastric motility: the emerging role of the stomach as an endocrine organ. Faseb J. 2004;18(3):439–456. doi: 10.1096/fj.03-0641rev. [DOI] [PubMed] [Google Scholar]
- Ishizaki S, Murase T, Sugimura Y, Kakiya S, Yokoi H, Tachikawa K, Arima H, Miura Y, Oiso Y. Role of ghrelin in the regulation of vasopressin release in conscious rats. Endocrinology. 2002;143(5):1589–1593. doi: 10.1210/endo.143.5.8804. [DOI] [PubMed] [Google Scholar]
- Jewett DC, Lefever TW, Cameron CR, Flashinski DP, Koffarnus MN, Beaudry AR, Masters KM, Grace MK, Levine AS. Ghrelin increases break point under a progressive ratio 1 reinforcement schedule in rats. New Orleans, LA: 2003. [Google Scholar]
- Kamegai J, Tamura H, Shimizu T, Ishii S, Sugihara H, Wakabayashi I. Central effect of ghrelin, an endogenous growth hormone secretagogue, on hypothalamic peptide gene expression. Endocrinology. 2000;141(12):4797–4800. doi: 10.1210/endo.141.12.7920. [DOI] [PubMed] [Google Scholar]
- Kamegai J, Wakabayashi I, Kineman RD, Frohman LA. Growth hormone-releasing hormone receptor (GHRH-R) and growth hormone secretagogue receptor (GHS-R) mRNA levels during postnatal development in male and female rats. J Neuroendocrinol. 1999;11(4):299–306. doi: 10.1046/j.1365-2826.1999.00330.x. [DOI] [PubMed] [Google Scholar]
- Katayama M, Nogami H, Nishiyama J, Kawase T, Kawamura K. Developmentally and regionally regulated expression of growth hormone secretagogue receptor mRNA in rat brain and pituitary gland. Neuroendocrinology. 2000;72(6):333–340. doi: 10.1159/000054602. [DOI] [PubMed] [Google Scholar]
- Kishi T, Aschkenasi CJ, Lee CE, Mountjoy KG, Saper CB, Elmquist JK. Expression of melanocortin 4 receptor mRNA in the central nervous system of the rat. J Comp Neurol. 2003;457(3):213–235. doi: 10.1002/cne.10454. [DOI] [PubMed] [Google Scholar]
- Kiyama H, McGowan EM, Emson PC. Co-expression of cholecystokinin mRNA and tyrosine hydroxylase mRNA in populations of rat substantia nigra cells; a study using a combined radioactive and non-radioactive in situ hybridization procedure. Brain Res Mol Brain Res. 1991;9(1–2):87–93. doi: 10.1016/0169-328x(91)90133-i. [DOI] [PubMed] [Google Scholar]
- Kojima M, Hosoda H, Date Y, Nakazato M, Matsuo H, Kangawa K. Ghrelin is a growth-hormone-releasing acylated peptide from stomach. Nature. 1999;402(6762):656–660. doi: 10.1038/45230. [DOI] [PubMed] [Google Scholar]
- Komiyama M, Shibata H, Suzuki T. Somatotopic representation of facial muscles within the facial nucleus of the mouse. A study using the retrograde horseradish peroxidase and cell degeneration techniques. Brain Behav Evol. 1984;24(2–3):144–151. doi: 10.1159/000121312. [DOI] [PubMed] [Google Scholar]
- Lawrence CB, Snape AC, Baudoin FM, Luckman SM. Acute central ghrelin and GH secretagogues induce feeding and activate brain appetite centers. Endocrinology. 2002;143(1):155–162. doi: 10.1210/endo.143.1.8561. [DOI] [PubMed] [Google Scholar]
- Lee HM, Wang G, Englander EW, Kojima M, Greeley GH., Jr Ghrelin, a new gastrointestinal endocrine peptide that stimulates insulin secretion: enteric distribution, ontogeny, influence of endocrine, and dietary manipulations. Endocrinology. 2002;143(1):185–190. doi: 10.1210/endo.143.1.8602. [DOI] [PubMed] [Google Scholar]
- Levin BE. Glucose-regulated dopamine release from substantia nigra neurons. Brain Res. 2000;874(2):158–164. doi: 10.1016/s0006-8993(00)02573-7. [DOI] [PubMed] [Google Scholar]
- Lin Y, Matsumura K, Fukuhara M, Kagiyama S, Fujii K, Iida M. Ghrelin acts at the nucleus of the solitary tract to decrease arterial pressure in rats. Hypertension. 2004;43(5):977–982. doi: 10.1161/01.HYP.0000122803.91559.55. [DOI] [PubMed] [Google Scholar]
- Liu H, Kishi T, Roseberry AG, Cai X, Lee CE, Montez JM, Friedman JM, Elmquist JK. Transgenic mice expressing green fluorescent protein under the control of the melanocortin-4 receptor promoter. J Neurosci. 2003;23(18):7143–7154. doi: 10.1523/JNEUROSCI.23-18-07143.2003. [DOI] [PMC free article] [PubMed] [Google Scholar]
- Lu S, Guan JL, Wang QP, Uehara K, Yamada S, Goto N, Date Y, Nakazato M, Kojima M, Kangawa K, Shioda S. Immunocytochemical observation of ghrelin-containing neurons in the rat arcuate nucleus. Neurosci Lett. 2002;321(3):157–160. doi: 10.1016/s0304-3940(01)02544-7. [DOI] [PubMed] [Google Scholar]
- Maier C, Schaller G, Buranyi B, Nowotny P, Geyer G, Wolzt M, Luger A. The cholinergic system controls ghrelin release and ghrelin-induced growth hormone release in humans. J Clin Endocrinol Metab. 2004;89(9):4729–4733. doi: 10.1210/jc.2004-0656. [DOI] [PubMed] [Google Scholar]
- Majdic G, Young M, Gomez-Sanchez E, Anderson P, Szczepaniak LS, Dobbins RL, McGarry JD, Parker KL. Knockout mice lacking steroidogenic factor 1 are a novel genetic model of hypothalamic obesity. Endocrinology. 2002;143(2):607–614. doi: 10.1210/endo.143.2.8652. [DOI] [PubMed] [Google Scholar]
- Marcus JN, Aschkenasi CJ, Lee CE, Chemelli RM, Saper CB, Yanagisawa M, Elmquist JK. Differential expression of orexin receptors 1 and 2 in the rat brain. J Comp Neurol. 2001;435(1):6–25. doi: 10.1002/cne.1190. [DOI] [PubMed] [Google Scholar]
- Martin MR, Lodge D. Morphology of the facial nucleus of the rat. Brain Res. 1977;123(1):1–12. doi: 10.1016/0006-8993(77)90639-4. [DOI] [PubMed] [Google Scholar]
- Masuda Y, Tanaka T, Inomata N, Ohnuma N, Tanaka S, Itoh Z, Hosoda H, Kojima M, Kangawa K. Ghrelin stimulates gastric acid secretion and motility in rats. Biochem Biophys Res Commun. 2000;276(3):905–908. doi: 10.1006/bbrc.2000.3568. [DOI] [PubMed] [Google Scholar]
- Matsumura K, Tsuchihashi T, Fujii K, Abe I, Iida M. Central ghrelin modulates sympathetic activity in conscious rabbits. Hypertension. 2002;40(5):694–699. doi: 10.1161/01.hyp.0000035395.51441.10. [DOI] [PubMed] [Google Scholar]
- McKee KK, Palyha OC, Feighner SD, Hreniuk DL, Tan CP, Phillips MS, Smith RG, Van der Ploeg LH, Howard AD. Molecular analysis of rat pituitary and hypothalamic growth hormone secretagogue receptors. Mol Endocrinol. 1997;11(4):415–423. doi: 10.1210/mend.11.4.9908. [DOI] [PubMed] [Google Scholar]
- Mitchell V, Bouret S, Beauvillain JC, Schilling A, Perret M, Kordon C, Epelbaum J. Comparative distribution of mRNA encoding the growth hormone secretagogue-receptor (GHS-R) in Microcebus murinus (Primate, lemurian) and rat forebrain and pituitary. J Comp Neurol. 2001;429(3):469–489. doi: 10.1002/1096-9861(20010115)429:3<469::aid-cne8>3.0.co;2-#. [DOI] [PubMed] [Google Scholar]
- Nagaya N, Kangawa K. Ghrelin improves left ventricular dysfunction and cardiac cachexia in heart failure. Curr Opin Pharmacol. 2003;3(2):146–151. doi: 10.1016/s1471-4892(03)00013-4. [DOI] [PubMed] [Google Scholar]
- Nagaya N, Uematsu M, Kojima M, Ikeda Y, Yoshihara F, Shimizu W, Hosoda H, Hirota Y, Ishida H, Mori H, Kangawa K. Chronic administration of ghrelin improves left ventricular dysfunction and attenuates development of cardiac cachexia in rats with heart failure. Circulation. 2001;104(12):1430–1435. doi: 10.1161/hc3601.095575. [DOI] [PubMed] [Google Scholar]
- Nakazato M, Murakami N, Date Y, Kojima M, Matsuo H, Kangawa K, Matsukura S. A role for ghrelin in the central regulation of feeding. Nature. 2001;409(6817):194–198. doi: 10.1038/35051587. [DOI] [PubMed] [Google Scholar]
- Nestler EJ. Under siege: The brain on opiates. Neuron. 1996;16(5):897–900. doi: 10.1016/s0896-6273(00)80110-5. [DOI] [PubMed] [Google Scholar]
- Nogueiras R, Tovar S, Mitchell SE, Rayner DV, Archer ZA, Dieguez C, Williams LM. Regulation of growth hormone secretagogue receptor gene expression in the arcuate nuclei of the rat by leptin and ghrelin. Diabetes. 2004;53(10):2552–2558. doi: 10.2337/diabetes.53.10.2552. [DOI] [PubMed] [Google Scholar]
- Paxinos G, Watson C. The rat brain in stereotaxic coordinates. 4. San Diego: Academic Press; 1998. [DOI] [PubMed] [Google Scholar]
- Prado CL, Pugh-Bernard AE, Elghazi L, Sosa-Pineda B, Sussel L. Ghrelin cells replace insulin-producing beta cells in two mouse models of pancreas development. Proc Natl Acad Sci U S A. 2004;101(9):2924–2929. doi: 10.1073/pnas.0308604100. [DOI] [PMC free article] [PubMed] [Google Scholar]
- Seroogy K, Schalling M, Brene S, Dagerlind A, Chai SY, Hokfelt T, Persson H, Brownstein M, Huan R, Dixon J, et al. Cholecystokinin and tyrosine hydroxylase messenger RNAs in neurons of rat mesencephalon: peptide/monoamine coexistence studies using in situ hybridization combined with immunocytochemistry. Exp Brain Res. 1989a;74(1):149–162. doi: 10.1007/BF00248288. [DOI] [PubMed] [Google Scholar]
- Seroogy KB, Dangaran K, Lim S, Haycock JW, Fallon JH. Ventral mesencephalic neurons containing both cholecystokinin- and tyrosine hydroxylase-like immunoreactivities project to forebrain regions. J Comp Neurol. 1989b;279(3):397–414. doi: 10.1002/cne.902790306. [DOI] [PubMed] [Google Scholar]
- Shuto Y, Shibasaki T, Otagiri A, Kuriyama H, Ohata H, Tamura H, Kamegai J, Sugihara H, Oikawa S, Wakabayashi I. Hypothalamic growth hormone secretagogue receptor regulates growth hormone secretion, feeding, and adiposity. J Clin Invest. 2002;109(11):1429–1436. doi: 10.1172/JCI13300. [DOI] [PMC free article] [PubMed] [Google Scholar]
- Shuto Y, Shibasaki T, Wada K, Parhar I, Kamegai J, Sugihara H, Oikawa S, Wakabayashi I. Generation of polyclonal antiserum against the growth hormone secretagogue receptor (GHS-R): evidence that the GHS-R exists in the hypothalamus, pituitary and stomach of rats. Life Sci. 2001;68(9):991–996. doi: 10.1016/s0024-3205(00)01001-8. [DOI] [PubMed] [Google Scholar]
- Simmons DM, Arriza JL, Swanson LW. A complete protocol for in situ hybridization of messenger RNAs in brain and other tissues with radiolabelled single stranded RNA probes. Journal of Histotechnology. 1989;12:169–181. [Google Scholar]
- Sun Y, Wang P, Zheng H, Smith RG. Ghrelin stimulation of growth hormone release and appetite is mediated through the growth hormone secretagogue receptor. Proc Natl Acad Sci U S A. 2004;101(13):4679–4684. doi: 10.1073/pnas.0305930101. [DOI] [PMC free article] [PubMed] [Google Scholar]
- Tang-Christensen M, Vrang N, Ortmann S, Bidlingmaier M, Horvath T, Tschop M. Central administration of Ghrelin and Agouti-related Protein (AGRP (83–132)) increases food intake and decreases spontaneous locomotor activity in rats. Endocrinology. 2004 doi: 10.1210/en.2004-0529. [DOI] [PubMed] [Google Scholar]
- Tannenbaum GS, Lapointe M, Beaudet A, Howard AD. Expression of growth hormone secretagogue-receptors by growth hormone-releasing hormone neurons in the mediobasal hypothalamus. Endocrinology. 1998;139(10):4420–4423. doi: 10.1210/endo.139.10.6330. [DOI] [PubMed] [Google Scholar]
- Tomasetto C, Karam SM, Ribieras S, Masson R, Lefebvre O, Staub A, Alexander G, Chenard MP, Rio MC. Identification and characterization of a novel gastric peptide hormone: the motilin-related peptide. Gastroenterology. 2000;119(2):395–405. doi: 10.1053/gast.2000.9371. [DOI] [PubMed] [Google Scholar]
- Traebert M, Riediger T, Whitebread S, Scharrer E, Schmid HA. Ghrelin acts on leptin-responsive neurones in the rat arcuate nucleus. J Neuroendocrinol. 2002;14(7):580–586. doi: 10.1046/j.1365-2826.2002.00810.x. [DOI] [PubMed] [Google Scholar]
- Trudel L, Tomasetto C, Rio MC, Bouin M, Plourde V, Eberling P, Poitras P. Ghrelin/motilin-related peptide is a potent prokinetic to reverse gastric postoperative ileus in rat. Am J Physiol Gastrointest Liver Physiol. 2002;282(6):G948–952. doi: 10.1152/ajpgi.00339.2001. [DOI] [PubMed] [Google Scholar]
- Tschop M, Smiley DL, Heiman ML. Ghrelin induces adiposity in rodents. Nature. 2000;407(6806):908–913. doi: 10.1038/35038090. [DOI] [PubMed] [Google Scholar]
- Tschop M, Statnick MA, Suter TM, Heiman ML. GH-releasing peptide-2 increases fat mass in mice lacking NPY: indication for a crucial mediating role of hypothalamic agouti-related protein. Endocrinology. 2002;143(2):558–568. doi: 10.1210/endo.143.2.8633. [DOI] [PubMed] [Google Scholar]
- Van Der Lely AJ, Tschop M, Heiman ML, Ghigo E. Biological, physiological, pathophysiological, and pharmacological aspects of ghrelin. Endocr Rev. 2004;25(3):426–457. doi: 10.1210/er.2002-0029. [DOI] [PubMed] [Google Scholar]
- Van Dijk G, Thiele TE, Donahey JC, Campfield LA, Smith FJ, Burn P, Bernstein IL, Woods SC, Seeley RJ. Central infusions of leptin and GLP-1-(7–36) amide differentially stimulate c-FLI in the rat brain. Am J Physiol. 1996;271(4 Pt 2):R1096–1100. doi: 10.1152/ajpregu.1996.271.4.R1096. [DOI] [PubMed] [Google Scholar]
- Volante M, Allia E, Gugliotta P, Funaro A, Broglio F, Deghenghi R, Muccioli G, Ghigo E, Papotti M. Expression of ghrelin and of the GH secretagogue receptor by pancreatic islet cells and related endocrine tumors. J Clin Endocrinol Metab. 2002;87(3):1300–1308. doi: 10.1210/jcem.87.3.8279. [DOI] [PubMed] [Google Scholar]
- Wang L, Saint-Pierre DH, Tache Y. Peripheral ghrelin selectively increases Fos expression in neuropeptide Y - synthesizing neurons in mouse hypothalamic arcuate nucleus. Neurosci Lett. 2002;325(1):47–51. doi: 10.1016/s0304-3940(02)00241-0. [DOI] [PubMed] [Google Scholar]
- Watson CR, Sakai S, Armstrong W. Organization of the facial nucleus in the rat. Brain Behav Evol. 1982;20(1–2):19–28. doi: 10.1159/000121578. [DOI] [PubMed] [Google Scholar]
- Wierup N, Yang S, McEvilly RJ, Mulder H, Sundler F. Ghrelin is expressed in a novel endocrine cell type in developing rat islets and inhibits insulin secretion from INS-1 (832/13) cells. J Histochem Cytochem. 2004;52(3):301–310. doi: 10.1177/002215540405200301. [DOI] [PubMed] [Google Scholar]
- Willesen MG, Kristensen P, Romer J. Co-localization of growth hormone secretagogue receptor and NPY mRNA in the arcuate nucleus of the rat. Neuroendocrinology. 1999;70(5):306–316. doi: 10.1159/000054491. [DOI] [PubMed] [Google Scholar]
- Williams DL, Grill HJ, Cummings DE, Kaplan JM. Vagotomy dissociates short- and long-term controls of circulating ghrelin. Endocrinology. 2003;144(12):5184–5187. doi: 10.1210/en.2003-1059. [DOI] [PubMed] [Google Scholar]
- Wisse BE, Frayo RS, Schwartz MW, Cummings DE. Reversal of cancer anorexia by blockade of central melanocortin receptors in rats. Endocrinology. 2001;142(8):3292–3301. doi: 10.1210/endo.142.8.8324. [DOI] [PubMed] [Google Scholar]
- Wortley KE, Anderson KD, Garcia K, Murray JD, Malinova L, Liu R, Moncrieffe M, Thabet K, Cox HJ, Yancopoulos GD, Wiegand SJ, Sleeman MW. Genetic deletion of ghrelin does not decrease food intake but influences metabolic fuel preference. Proc Natl Acad Sci U S A. 2004;101(21):8227–8232. doi: 10.1073/pnas.0402763101. [DOI] [PMC free article] [PubMed] [Google Scholar]
- Wren AM, Small CJ, Abbott CR, Dhillo WS, Seal LJ, Cohen MA, Batterham RL, Taheri S, Stanley SA, Ghatei MA, Bloom SR. Ghrelin causes hyperphagia and obesity in rats. Diabetes. 2001;50(11):2540–2547. doi: 10.2337/diabetes.50.11.2540. [DOI] [PubMed] [Google Scholar]
- Yasuda T, Masaki T, Kakuma T, Yoshimatsu H. Centrally administered ghrelin suppresses sympathetic nerve activity in brown adipose tissue of rats. Neurosci Lett. 2003;349(2):75–78. doi: 10.1016/s0304-3940(03)00789-4. [DOI] [PubMed] [Google Scholar]
- Zhang W, Lin TR, Hu Y, Fan Y, Zhao L, Stuenkel EL, Mulholland MW. Ghrelin stimulates neurogenesis in the dorsal motor nucleus of the vagus. J Physiol. 2004;559(Pt 3):729–737. doi: 10.1113/jphysiol.2004.064121. [DOI] [PMC free article] [PubMed] [Google Scholar]
- Zigman JM, Elmquist JK. Minireview: From anorexia to obesity--the yin and yang of body weight control. Endocrinology. 2003;144(9):3749–3756. doi: 10.1210/en.2003-0241. [DOI] [PubMed] [Google Scholar]