Abstract
Diffuse optical tomography (DOT) has been used by several groups to assess cerebral hemodynamics of cerebral ischemia in humans and animals. In this study, we combined DOT with an indocyanine green (ICG)-tracking method to achieve interleaved images of cerebral hemodynamics and blood flow index (BFI) using two middle cerebral artery occlusion (MCAO) rat models. To achieve volumetric images with high-spatial resolution, we first integrated a depth compensation algorithm (DCA) with a volumetric mesh-based rat head model to generate three-dimensional (3D) DOT on a rat brain atlas. Then, the experimental DOT data from two rat models were collected using interleaved strategy for cerebral hemodynamics and BFI during and after ischemic stroke, with and without a thrombolytic therapy for the embolic MCAO model. The acquired animal data were further analyzed using the integrated rat-atlas-guided DOT method to form time-evolving 3D images of both cerebral hemodynamics and BFI. In particular, we were able to show and identify therapeutic outcomes of a thrombolytic treatment applied to the embolism-induced ischemic model. This paper demonstrates that volumetric DOT is capable of providing high-quality, interleaved images of cerebral hemodynamics and blood perfusion in small animals during and after ischemic stroke, with excellent 3D visualization and quantifications.
Keywords: Diffuse optical tomography, middle cerebra artery occlusion, stroke, embolism-induced ischemic model, depth compensation algorithm, three-dimensional reconstruction, hemodynamic concentration contrast, Indocyanine green
1. Introduction
1.1 Ischemic stroke and animal models
Stroke is an emergency cerebrovascular condition and is the major leading cause of death in the United States with more than 130,000 deaths and disabilities annually. Stroke occurs when 1) blood flow to the brain is obstructed (ischemic stroke), or 2) blood vessels break and blood bleeds into brain tissues (hemorrhagic stroke). Of all patients diagnosed with stroke, more than 80 percent experience an ischemic stroke. Animal models are often used to help researchers better understand the pathogenesis of ischemia, to define biochemical changes in brain tissues during and after ischemia, and to discover mechanisms involved in the evolution of ischemic injury to the brain, as well as to examine therapeutic outcomes of new drugs and treatments. Among animal models, rat ischemic models have been well developed and widely utilized because the anatomy of arterial supplies to cerebral hemispheres in rats is essentially similar to that in humans. In particular, middle cerebral artery (MCA) ischemic stroke models are well established in rats mostly through occlusion of MCA using either the craniotomic or endovascular approach because ischemic stroke is often caused by occlusion of MCA and/or its branches in humans.
1.2 Non-invasive optical techniques to measure cerebral hemodynamics
Several types of non-invasive imaging techniques, such as computed tomography (CT) (von Kummer et al., 1997) and magnetic resonance imaging (MRI), especially diffusion- and perfusion-weighted MRI (Neumann-Haefelin et al., 1999), have been used to investigate stroke and its possible treatments in experimental studies. For the last decade, researchers have been investigating non-invasive detection of cerebral hemodynamics using near infrared spectroscopy (NIRS) due to its portability, non-radiation, cost-effectiveness, and high temporal resolution. Since light in the Near-infrared (NIR) range (600–900 nm) can penetrate a few centimeters into brain tissues, it can probe changes in oxygenated (HbO2) and deoxygenated (HbR) hemoglobin concentrations in the cerebral regions. Total hemoglobin concentrations can be quantified by HbT=HbO2+HbR, serving as another hemodynamic contrast in proportion to the cerebral blood volume.
Specifically, with single or limited source-detector pairs, several NIRS measurements were performed in investigating cerebral hemodynamics during cerebral ischemia (Liu et al., 2008; Xia et al., 2007) using a suture-induced rat MCA occlusion (MCAO) model. With multiple source-detector pairs and a similar rat MCAO model, researchers (Chen et al., 2002; Chen et al., 2000) showed two dimensional (2D) topographic maps of HbT after performing spatial interpolation among the multi-channel NIRS readings. Their results exhibited good correlations with MR images and histological brain slices of the animals. Moreover, diffuse optical tomography (DOT), which utilizes diffusion theory to reconstruct tomographic images of multi-channel NIRS with a relatively large number of source-detector pairs, has demonstrated the feasibility of three dimensional (3D) image reconstruction of cerebral hemodynamics during cerebral ischemia in rat MCAO (Culver et al., 2003a) or common carotid artery (CCA) occlusion models (Bluestone et al., 2004b).
1.3 Non-invasive techniques to measure cerebral blood flow
Assessment of cerebral blood flow (CBF) is also important and useful for understanding and interpreting hemodynamic kinetics and cerebral physiology of acute ischemic stroke, especially for embolism-induced ischemia. Continuous observation of regional CBF (rCBF) for patients receiving thrombolytic treatment is crucial because ischemic tissues may be non-functional or dying due to different levels of blood reperfusion, which may cause a severe neurological and fatal deficit in the brain. Studies have shown that infarct volume highly depends on reduction of CBF during cerebral ischemia and perfusion recovery from ischemia (Soriano et al., 1997). There are several techniques providing rCBF measurements, including single photon emission tomography (SPECT) (Kwiatek et al., 2000; Pavics et al., 1999), CT, positron emission tomography (PET) (Johnson et al., 1999; Tuominen et al., 2004), perfusion-weighted MRI, diffuse correlation spectroscopy (DCS) (Shang et al., 2011; Zhou et al., 2006), and laser Doppler flowmetry (Liu et al., 2008; Tonnesen et al., 2005). All of these techniques have been adopted in human and animal studies.
Furthermore, measurements of rCBF by tracking the kinetics of an intravenous tracer or contrast, namely, Indocyanine green (ICG), with NIRS have been reported when evaluating reduction of rCBF for patients with acute ischemic stroke (Terborg et al., 2004). The ICG-tracking technique allows repetitive and minimally invasive (due to the injection of ICG solution) measurements in a very short period of time because of rapid clearance of ICG from the blood stream. Researchers have shown that a blood flow index (BFI) derived from ICG kinetics is significantly correlated with the cortical blood flow (Kuebler et al., 1998), and thus allows rCBF assessment with good reproducibility (Keller et al., 2003; Wagner et al., 2003). Using the NIRS topographic technique, researchers have also shown the feasibility of generating 2D CBF images of infant patients with infarcts and hemorrhages; those images had good correlation with SPECT images (Kusaka et al., 2001).
1.4 Motivation and organization of this paper
The aim of this study was to investigate changes in cerebral hemodynamics and CBF kinetics during and after ischemic stroke, with and without thrombolytic therapy for an embolic MCAO model, using three-dimensional diffuse optical tomography (3D DOT). We have achieved interleaved 3D imaging of hemispheric hemodynamic changes and CBF kinetics after integrating conventional DOT with our recently developed depth compensation algorithm (DCA). The novelty of this paper includes 1) design and implementation of an interleaved method to quantify two sets of changes in both hemoglobin concentrations and BFI during and after MCAO in rat, 2) integration of DCA with a volumetric mesh-based rat head model to generate volumetric DOT on a rat brain atlas, and 3) longitudinal imaging and quantification of cerebral hemodynamics and CBF index before, during, and after a thrombolytic therapy for an embolic MCAO model.
This paper will provide details on several aspects of the study in the following order: First, we will modify and combine our recently developed DCA with a volumetric mesh-based rat head model to generate volumetric DOT on a rat brain atlas/template for improved depth localization and better visualization of MCAO effects in the rat brain. Second, we will describe how a suture-induced MCAO rat model was achieved and measured by a high-density DOT system one hour during and one hour after MCAO. The suture-induced MCAO model is studied mainly for validation of our experimental setup, measurement methodology, and volumetric image reconstruction as this model has been well established and documented. Third, we will introduce how our newly established embolism-induced MCAO rat model was utilized and measured with the same experimental setup and procedures. Next, interleaved data collection, analysis and volumetric image reconstruction will be described for longitudinal monitoring of cerebral hemodynamics and CBF index during and after MCA embolization. We will also discuss the effect of thrombolytic treatment. This work will demonstrate the feasibility of interleaved volumetric DOT to monitor longitudinal progress of cerebral hemodynamics and blood perfusion during and after cerebral ischemia in rats with and without therapeutic treatments. Results will be illustrated through high-quality 3D visualization and quantifications.
We will also discuss the influence of ICG injections on the quantification of hemodynamic variables and effect of thrombolytic treatment. This work will demonstrate the feasibility and limitation of interleaved volumetric DOT to monitor longitudinal progress of cerebral hemodynamics and blood perfusion during and after cerebral ischemia in rats with and without therapeutic treatments.
2. Materials and Methods
2.1 Animal Preparation
Male Sprague-Dawley rats weighing 350–400 grams were purchased from Charles River (Wilmington, MA) and housed in a 12 hr light and 12 hr dark cycle with free access to water and food. All surgical procedures were approved by the Institutional Animal Care and Use Committee of the University of Texas at Arlington and the University of North Texas Health Science Center.
In this study, we created and measured two types of ischemic stroke rat models: suture-induced (Longa et al., 1989; Xia et al., 2007) and embolism-induced MCAO model (Ren et al., 2012), respectively. We briefly describe the procedures here.
Suture-induced ischemic model: The rat was anesthetized with isoflurane (2–2.5%); the left MCA was occluded by monofilament silicon-coated suture introduced throughout the left internal carotid artery (ICA), as shown in (Xia et al., 2007). The time period for occlusion was 60 minutes. Approximately 60 min after occlusion, the suture was smoothly withdrawn for reperfusion.
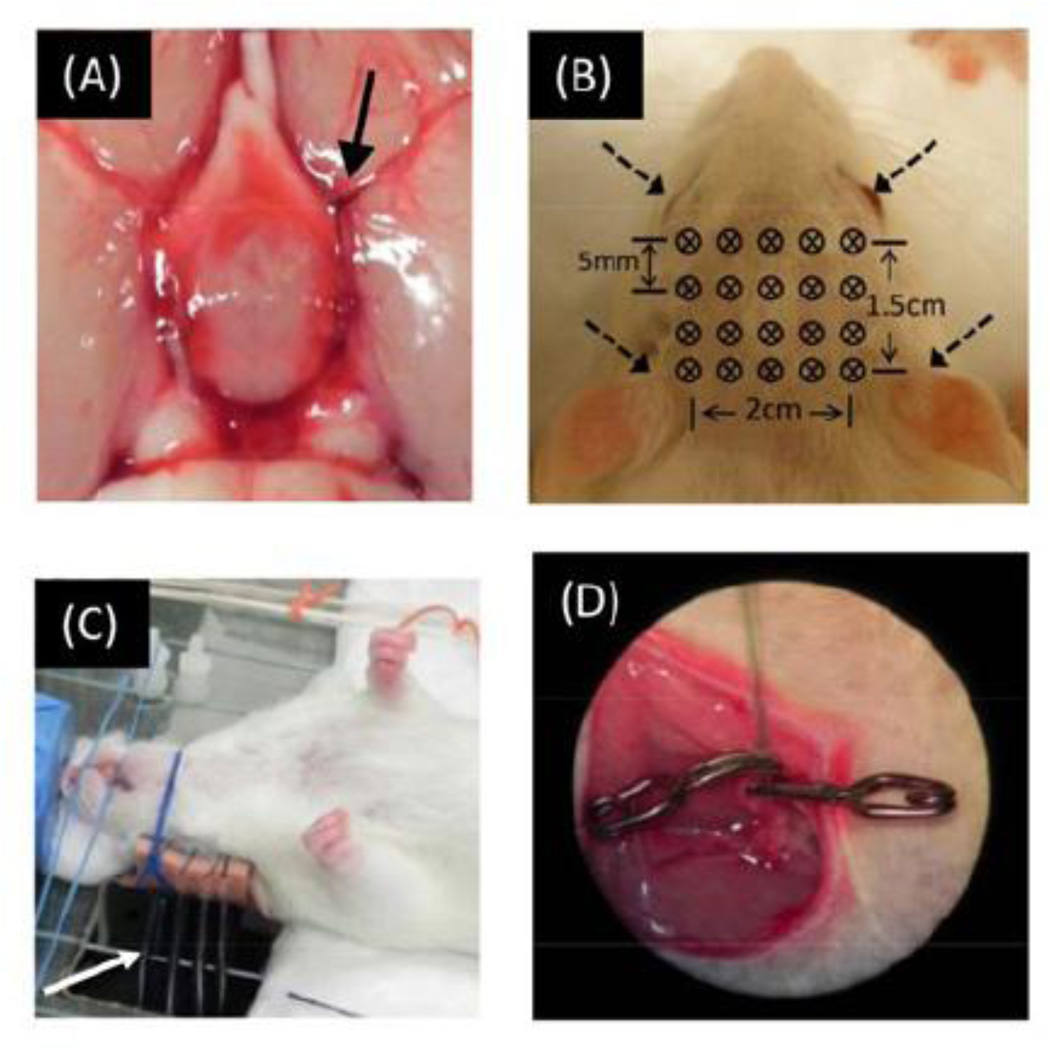
Embolism-induced ischemic model (Fig. 1A): Blood clots mixed with thrombin, fibrinogen, and fresh blood withdrawn from a donor rat were made 24 hours before the stroke induction (Ren et al., 2012). For surgery of embolic MCAO, the rat was anesthetized with isoflurane (2–2.5%); the left external carotid artery (ECA) was exposed through a midline cervical skin incision. Blood clots were then introduced into the lumen of ECA via the PE-50 tubing (inner diameter = 0.58 mm; outer diameter = 0.99 mm) with the tip of the catheter close to the CCA bifurcation for delivering clots toward the brain. One hour after embolization, the rat received thrombolysis, in which recombinant tissue plasminogen activator (rtPA), a thrombolytic treatment, was intravenously injected into the jugular vein at a dose of 5 mg/kg body weight with a 10% bolus and 90% continuous infusion for 30 min (Ren et al., 2012).
Fig. 1.
(A) Embolism-induced MCAO. Clots (indicated by arrow) were delivered by catheter and stayed at MCA bifurcation. (B) Optode geometry for CW-DOT measurements, including a total of 20 bifurcated fibers. (C) Photograph of experimental setup: It shows that the rat was kept in a supine position and several bifurcated fibers (indicated by white arrow) were placed vertically beneath the animal to contact the rat’s scalp. (D) Catheter was implemented in femoral vein for ICG injection.
2.2 Instrumentation and experimental setup for animal study
DOT measurements on a rat head were performed non-invasively with a tomographic imaging system, namely, a dynamic near-infrared optical tomographic instrument, DYNOT (NIRx Medical Technologies, LLC, NY, USA). Laser lights from each of two laser diodes, with wave lengths of 760 nm and 830 nm, were sequentially coupled into different fiber bundles and delivered to various positions on the rat head. Specifically, a fiber array consisted of 20 bifurcated source–detector probes (4 rows x 5 columns) that were placed symmetrically on the rat’s scalp above the region of cerebrum with a nearest inter-optode distance of 5 mm, as shown in Fig. 1B. The full tomographic dataset, involving 20 sources and 20 detectors, contained a total of 380 source-detector pairs/measurements (i.e., 20×19, ignoring the collocation fibers). The system operated in a continuous-wave mode with a frame rate of 1.81 Hz.
The rat hair was trimmed to ensure better fiber-skin contact. During the measurement, the animal was fixed in a rigid platform and kept in the supine position (Fig. 1C). The reason for having the rats in a supine position was that it allowed access to midline cervical structure for MCAO surgery without perturbing the DOT measurement, and it allowed investigators to keep the locations of optodes unchanged throughout the entire period of the experiment. During the measurements, the rats were anesthetized with isoflurane (2–2.5%) in 80% air and 20% O2. Body temperature was monitored by a rectal probe and was maintained by a heating pad between 36.5°C and 37°C. Physiological parameters including heart rate, breath rate, and arterial oxygen saturation were measured and monitored by a pulse oximeter (MouseOx, STARR Life Sciences Corp, MN, USA). Multi-channel NIRS data recorded by DYNOT were pre-processed for each source-detector pair measurement. A band-pass filter, with corner frequencies between 0.01 and 0.3 Hz, was applied to remove the high-frequency instrument noise and low-frequency baseline drift.
2.3 Experimental design to study ischemic stroke in rats
Based on how the ischemic stroke was generated, our experimental protocols were divided into two major groups: G-I was for the suture-induced ischemic model and G-II for embolism-induced ischemic model.
For both models, an ICG-tracking method was also utilized to study reduction of CBF due to focal cerebral ischemia. ICG powder (Sigma-Aldrich Co. LLC, St. Louis, Mo) was dissolved and diluted with saline, having a dosage of 1mg/kg, approximately 0.4 mg per rat. ICG solution was further separated into eight small volumes for multiple injections through the femoral vein at eight different time points during the entire experiment (See Fig. 2). For ICG injection, a catheter was replaced or imbedded (Fig. 1D) into the rat’s cervical skin incision to minimize the leakage of ICG solution.
Fig. 2.
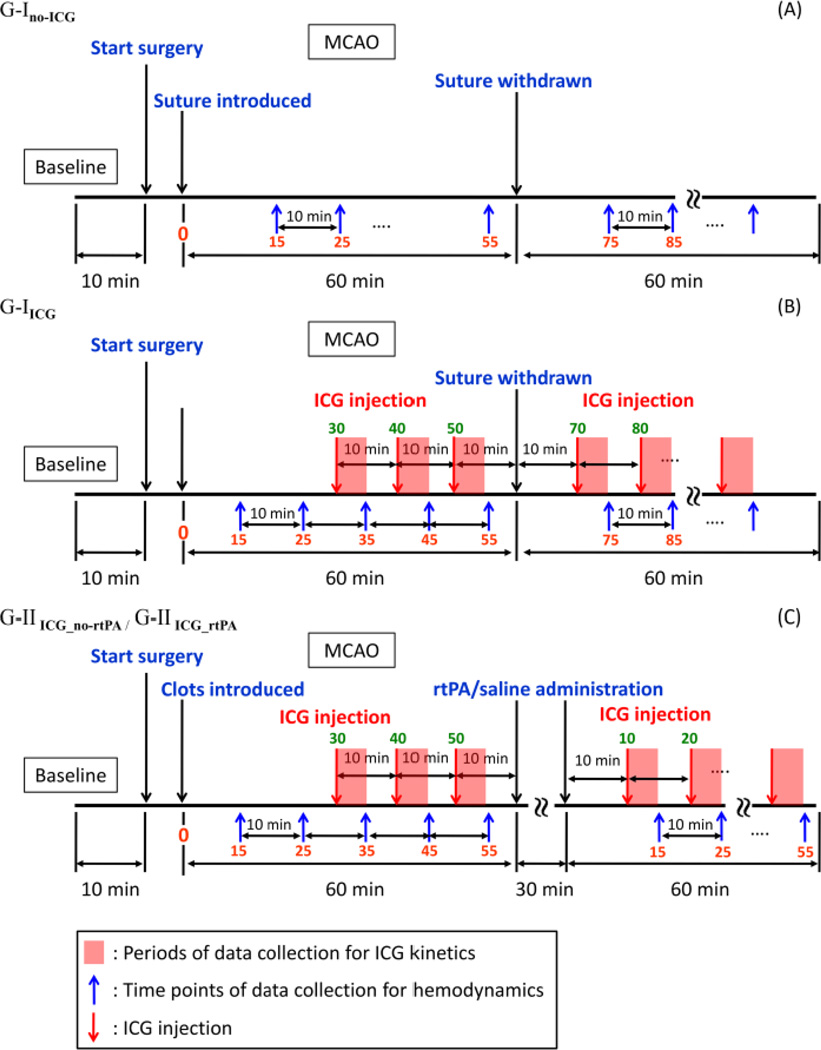
Schematic drawings to show measurement protocols used for the suture-induced ischemic model: (A) G-Ino_ICG without ICG, (B) ICG with G-IICG; for the embolism-induced ischemic model: (C) G-IIICG_no_rtPA and G-IIICG_rtPA without and with rtPA treatment. The x-axis is plotted, but not in scale.
To determine the inter-injection period for ICG, we performed ICG kinetics measurements on normal rats (n=3). For each rat, the ICG solution with an appropriate concentration was injected three times every 30 min. We observed that the recovery time between the injection onset and the time when the optical signals returned to the pre-injection level was 2.2±0.6 min. Based on this result, the inter-injection period was selected to be 10 min, which allows enough time for ICG to be cleared from the animal’s blood stream.
It is also noteworthy that the NIRS measurements of absorption would be interfered by ICG injections. In order to study the effect of ICG injections on the measured changes of hemodynamic signals during cerebral ischemia, we compared the hemodynamic measurements between two sub-groups that were with and without ICG injection. This comparison was carried out using only suture-induced ischemic rat models. The two sub-groups are described as follows.
G-Ino-ICG (n=9): In rats selected for MCAO surgery, the left MCA was occluded by silicon-coated suture for 60 min. followed by reperfusion after smoothly withdrawing the suture. The NIRS measurements were not perturbed by ICG injection.
G-IICG (n=6): Rats selected for this procedure underwent MCAO surgery with the same procedures as that used in G-Ino-ICG. ICG solution was injected at the following time points: 30, 40, 50 min after the suture was introduced, 10 min after withdrawal of the suture, and every 10 min thereafter for 1 hour.
Furthermore, 12 rats were used for the embolism-induced ischemia study. Six rats were treated with rtPA, while the other six rats were used as a control group, receiving a saline injection instead. These two sub-groups are described as follows.
G-IIICG_no-rtPA (permanent cerebral ischemia, control group; n=6): Rats underwent MCAO surgery; the left MCA was occluded by embolic clots for 60 min. Saline was administrated for 30 min after one hour occlusion. ICG solution was also injected at 30, 40, 50 min after embolization, 10 min after saline administration, and every 10 min thereafter for 1hour.
G-IIICG_rtPA (temporary cerebral ischemia, treatment group; n=6): Rats were similarly prepared as G-IIICG_no-rtPA but rtPA was administrated for 30 min after 60 min of embolic MCAO. Time points for ICG solution injections were the same as those used for G-IIICG_no-rtPA for appropriate comparison.
All four sub-groups of representing these experimental protocols are depicted or outlined in Fig. 2.
2.4 Rat Head Model and Forward Light Modeling
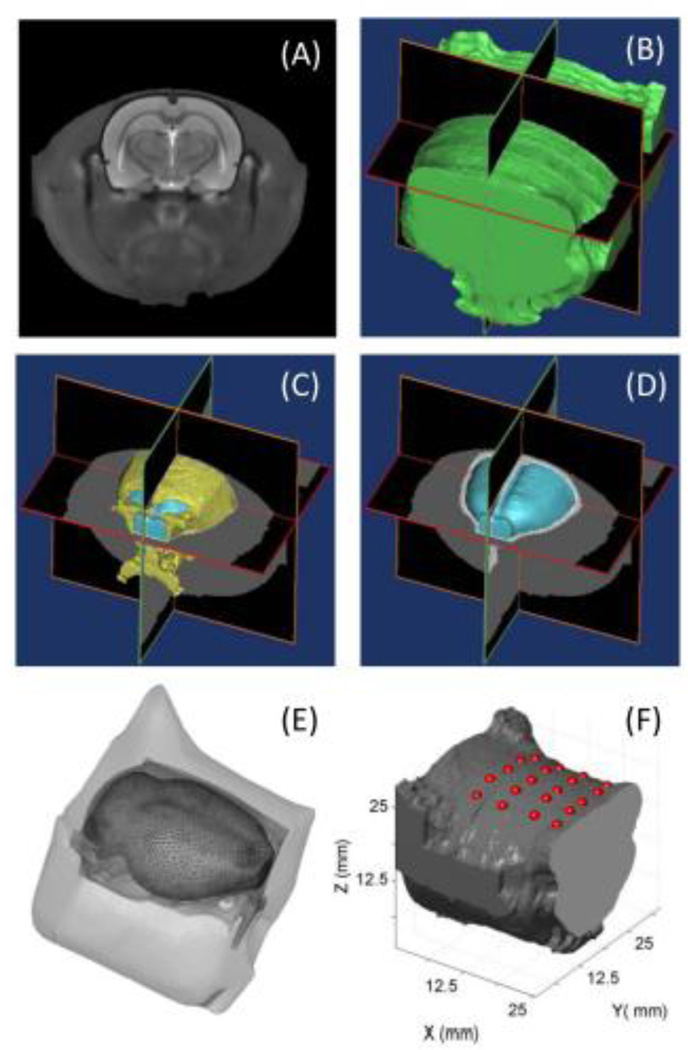
In order to accurately model light propagation in a realistic rat brain, high-quality co-registration of the optical optodes on a rat brain atlas or template was essential. Based on a 3D rat head atlas (Fig. 3A) generated by T2-weighted MRI (Valdes-Hernandez et al., 2011), we identified the boundaries of three main regions of interest (ROI), namely, the skin/muscle, skull, and brain, respectively, and further segmented them using multi-level Otsu’s thresholding technique (Liao et al., 2001). Each of the segmented 2D images was stacked in sequence together to form a 3D volume model as shown in Fig. 3B to 3D. Volumetric finite element model (FEM) meshes (Fig. 3E) were then generated by using a MATLAB-based mesh generator, iso2mesh (http://iso2mesh.sourceforge.net/cgi-bin/index.cgi). This FEM of a rat head contained 16,118 nodes, corresponding to 96,389 linear tetrahedral elements. Each node was belonged to and thus labeled by one of the three ROIs; the node locations were assigned specific tissue optical properties (Bluestone et al., 2004a). Accordingly, the absorption coefficients were 0.02 mm−1 for the rat skin/muscle, 0.005 mm−1 for the rat skull, and 0.015 mm−1 for the rat brain. The corresponding reduced scattering coefficients were 0.68 mm−1 for the rat skin/muscle, 2.2 mm−1 for the rat skull, and 2.2 mm−1 for the rat brain (Bluestone et al., 2004a).
Fig. 3.
(A) T2-weighted MR image of a rat head (Valdes-Hernandez et al., 2011). Iso-surface figures of segmented rat head tissues showing (B) skin/muscle, (C) skull (coded as yellow), and (D) brain (coded as light blue). (E) 3D finite element meshes with three ROIs, including skin/ muscle, skull, and brain. (F) Optodes projection on 3D reconstructed rat head volume.
Next, we needed to achieve a geometric transformation of the rat head coordinates so that the optode locations measured in the real-world coordinates could be read and projected on the MRI coordinates. To do so, we selected four landmarks on the rat head (i.e., the outlet points of the external auditory meatus and the centers of two eyeballs, as marked by four arrows in Fig. 1B) as references to compute the transformation matrix, W. Specifically, the optode locations in a real-world (RW) coordinates system were measured by a 3D Patriot™ digitizer (Polhemus Inc., Colchester, VT) (Cazzell et al., 2012). Using the coordinates of the rat’s eyes and ears as reference points, the affine transformation matrix W was obtained by:
| (1) |
and
| (2) |
where PRWR represents the reference coordinates matrix for the animal’s eyes and ears measured by the 3D digitizer using the real world (RW) coordinate system, and PMRR represents the reference coordinates of the same four points in the MRI (MR) coordinate system. The subscripts ‘r’ and ‘l’ represent right side and left side, respectively.
After the transformation matrix, W, was obtained through equations (1) and (2), the optode locations matrix measured by the digitizer and expressed in the RW coordinates, PRWO, was then ready to be projected onto the surface in the 3D (MRI) rat head model, as written by:
| (3) |
where PMRO represents the coordinates of the optodes in the rat head model given by the MRI coordinates system. After affine transformation, the optode coordinates in z axis were quite close to the surface of the animal head model, but not exactly located on the surface in most cases. In order to ensure projection of the optodes on the animal’s head surface, the norms of closest surface patches were calculated and optodes were then projected along the averaged norm of those patches (Fig. 3F).
Next, forward calculation to model light propagation in the rat head was performed using a FEM-based MATLAB package, NIRFAST (Dehghani et al., 2008), to obtain the Jacobian matrix (also called the sensitivity matrix) J, which represents changes of measured signals on the boundary due to a small absorption perturbation within the interrogated volume by the corresponding optode pair. Using the Rytov approximation (Arridge, 1999), the forward problem for light traveling inside the rat head model can then be written as:
| (4) |
where Δy represents a single-column (n×1) matrix with each matrix element equal to a change in optical density [OD=log(Isource/Imeasured)], as expressed by Δy = (ΔOD11, ΔOD21,…, ΔODm1,…ΔODn1)T. Note that m covers every combination of source-detector pairs that could be formed through the measurement optode array. Specifically, given the 4 × 5 optode array shown in Fig. 1B, matrix Δy in this study had a row dimension of matrix to be mmax = n = 380. Each element of Δy (i.e., ΔODm,1) was obtained by calculating the change in OD at the selected source-detector pair of m due to focal cerebral ischemia with respect to the initial baseline, as written mathematically by
Jrh is the Jacobain matrix derived from the rat head model, previously described herein. Δx represents a matrix of changes in absorption at each node within the 3D rat head coordinates system.
2.5 Image reconstruction and depth compensation algorithm
To recover the change of absorption at each node, the inverse problem was solved using Moore-Penrose generalized approach (Arridge, 1999) with Tikhonov regularization:
| (5) |
where λ is the regularization factor and was chosen as 10−2 times the maximum of diagonal of the matrix , and I is the identity matrix. In this study, we applied our recently developed depth compensation algorithm (DCA) to improve accuracy of depth localization. The details can be found in (Niu et al., 2010a; Niu et al., 2010b) and is briefly described here. To increase the depth sensitivity, the weighting matrix M can be introduced to provide a counterbalanced increase in depth to matrix J with L layers counted from the superficial to deep layers. Accordingly, the measurement sensitivity matrix J within the rat head model can be decomposed into L-layer-based sub-matrices. Then, the M matrix is formed as:
| (6) |
where γ is an adjustment power which varies between 0 and 3, and M(Ji) represents the maximum singular value for measurement sensitivity J at the ith layer, where i=1… L. Notice that the adjustment power, γ, controls the compensating weight in M. A large γ value in M provide a larger weight towards a deep layer. In this study, the adjusted sensitivity matrix is defined as to be used in the inverse calculation. After replacing Jrh with in the image reconstruction equation [i.e., eq. (5)], the reconstructed image can be expressed as:
| (7) |
To implement DCA in the FEM-based rat brain atlas geometry, we needed to determine L to be compatible with the rat brain atlas. Numerically, we took the following steps in order to adapt DCA and to form volumetric DOT within the rat brain model:
- Calculate the total uncompensated sensitivity at node n by:
where represents the total uncompensated sensitivity at node, NM is the total number of measurements (or of source-detector pairs), and Jrhm,n is the uncompensated sensitivity at node n due to the measurement m.(8) Find or quantify each L within the rat head atlas, group all of the nodes located on the scalp of the rat head model as group Ω0 and group the rest of the nodes below the scalp as Ω. Then calculate the distance from an individual node in Ω to all of the nodes in Ω0; use the minimum of all these distances to define the distance between the respective node to the scalp. All the nodes having an equal distance to the rat scalp facilitates a layer within the rat head model to be used in DCA.
Divide the distances into different depths with respect to the surface of the head model. Generate weighting matrix M by calculating the maximum singular values within respective depths or layers.
Modify the sensitivity matrix to be .
Use γ = 1.2 in this study. Computation for compensated will take 10 s using a 3.30 GHz Intel i5-processor with 16 gigabytes memory. must be calculated once for each rat data set at one time point and then applied to the entire time-varying- measurement series.
2.6 Calculation of ICG kinetics and data analysis
The two wavelengths (760 nm and 830 nm) used in the DOT measurements were all close to the maximal absorption spectral peak of ICG; thus, we selected the optical signals measured at 760 nm for reconstructing images associated with ICG concentrations. From each temporal or longitudinal measurement set per animal, a time series of volumetric reconstructed images proportional to the ICG concentrations were obtained. ICG kinetics was then achieved by extracting the signals from each voxel along the time axis. Specifically, the optical signals were first corrected or calibrated to the 5-sec pre-injection baseline level and then de-trended to remove any signal drift due to either the instrument drift or slow hemodynamic drift in the rats during and/or after MCAO. To quantify the ICG kinetics, several parameters were defined and determined as follows (Kuebler et al., 1998).
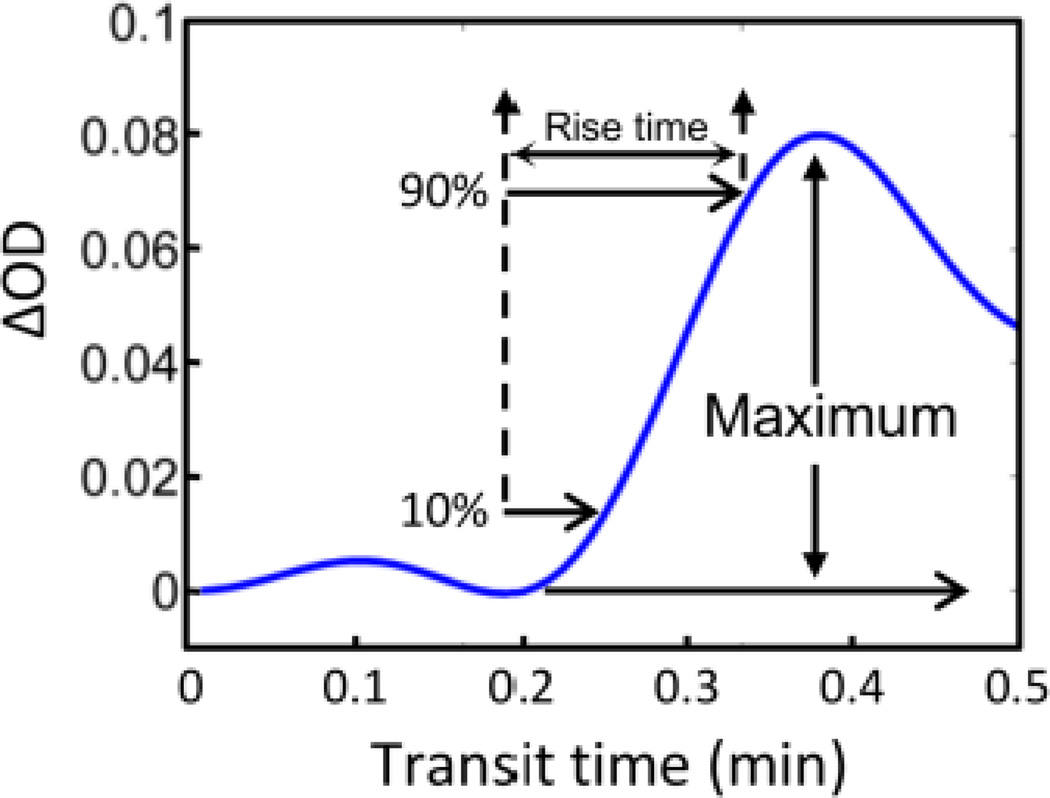
Maximum changes of ICG concentration (ΔICG): For most of NIRS measurements, HbO2 and HbR are two major chromophores, which contribute to changes in optical signals. In this study, nevertheless, ICG was also utilized to study CBF or its index during and after MCAO. Note that we could not obtain the absolute concentration changes of ICG due to the limitation of used wavelengths for measurement. However, we observed significantly large changes or increases in optical density (more than 10-fold) seen right after ICG injection in the animals as compared to the fluctuations of optical signals caused by changes of HbO2 and HbR concentration. Hence, changes of optical density (ΔODICG) were defined as ΔICG in this study (see Fig. 4).
Rise time (RT): RT is defined as the time interval when ΔODICG increased from 10% to 90% of maximum ΔICG, ΔICGmax; this definition could avoid the exact temporal selection of start point of ICG bolus.
-
Blood flow index (BFI): BFI should be defined as:
(9) As described in Section 2.5, changes in light absorption (due to either ischemia or ICG administration) can be reconstructed at each voxel or node in the rat head model. This allows one to reconstruct tomographic images of ΔODICG at different time points when ICG is injected. Accordingly, volumetric ICG kinetic images are generated by calculating the corresponding values of ΔICG, RT, and BFI, at each voxel or mesh node.
In general, BFI is directly proportional to CBF. However, several studies have also reported that BFI can provide accurate, repeatable results only for intra-subject comparisons, but not for inter-subject comparisons because of the unknown proportionality or normalization factor among different animals (Wagner et al., 2003). Thus, averaging individual BFI values across subjects or animals need validation. In order to remove subject-dependent variation, we introduced a BFI ratio, RatioBFI, which computes the ratio between two spatially-averaged BFI values within ROI-2 and ROI-1 for each individual rat. Mathematically, , where BFIs_averaged_ROI−1 and BFIs_averaged_ROI−2 are spatially averaged over each voxel or node within entire regions of ROI-1 and ROI-2, respectively, for each animal. We then averaged the BFI ratios across all rats and calculated a group mean of RatioBFI for each time point (See inline supplementary Figure S1) [insert inline Supplementary Fig. S1].
Fig. 4.
Change of optical density after injection of (ICG). Blood flow index (BFI) is calculated using the maximal light absorption change after intravenous bolus injection of ICG. Rise time is defined by the temporal interval when the optical signal reaches its 90% maximum from its 10% maximum.
2.7 Interleaved data acquisition and volumetric images for hemodynamics and BFI
While the data collection in our animal experiments by the multi-channel DYNOT system was temporally continuous before, during, and after MCAO, two different types of optical density changes (ΔOD), which reflected two types of physiological signals, were acquired in an interleaved format. In general, ΔOD values at a selected wavelength in our rat MCAO measurement should be equal to ΔODtotal = ΔODICG + ΔODno-ICG, where ΔODICG and ΔODno-ICG represent ΔOD values with and without ICG administration in the animal. As mentioned in Sections 2.3 and 2.6, the clearance time of ICG in the animal was about 2.2±0.6 min, while an increase in ΔOD by ICG could be 10-fold or bigger right after ICG injection in the animals. Therefore, we designed an interleaved approach to obtain two phases of data selection/acquisition: One was to grasp the ΔOD values within 3–4 minutes right after ICG injection so that ΔODtotal ≈ ΔODICG; the other was to pick up the optical signals five minutes after ICG administration so that ΔODtotal ≈ ΔODno-ICG since most of ICG was cleared from the rat blood stream by then. The former phase measurement during ΔODtotal ≈ΔODICG allowed us to determine BFI readings as described in Section 2.6, while the latter phase measurement during ΔODtotal ≈ ΔODno-ICG resulted in quantification of HbO2, HbR, and HbT.
Specifically, the interleaved protocol is shown in Fig. 2. For hemodynamic signal (HbO2, HbR, HbT) analysis in all four animal groups (i.e., G-Ino-ICG, G-IICG, G-IIICG_no_rtPA, and G-IIICG_rtPA), we selected the data at specific time windows: 15 min after suture was introduced, followed by every 10 min thereafter until either the suture was withdrawn or rtPA/saline was administered. Note that for G-II (i.e., embolism-induced MCAO) an extra period of 30 min was added one hour after MCAO to infuse the rtPA/saline solution for 30-min thrombolytic/sham treatment (see Fig. 2). On the other hand, for BFI data acquisition in three groups (i.e., G-IICG, G-IIICG_no_rtPA, and G-IIICG_rtPA), ICG solution was injected 30, 40, and 50 min after the MCAO was introduced, 10 min after suture withdrawal or rtPA/saline infusion, and every 10 min thereafter for 1 hour (see Section 2.3 and Fig. 2). Note that a time interval of 5 minutes was given between the ICG injection onset and data grasp for hemodynamic signals in order to minimize the cross talk between changes in hemoglobin concentrations and the early phase of ICG clearance.
2.8 Statistical consideration
All data were expressed as mean ± SD (standard deviation). The significance of differences between group means was determined using Student’s paired t-test. The relationship of hemodynamic changes between G-Ino-ICG and G-IICG for each HbO2, HbR, and HbT at the same time points throughout the entire experiment (before, during, and after MCAO) was examined by Pearson product-moment correlation. Any P value less than 0.05 was considered significant.
3. Results
3.1 Volumetric DOT measurement sensitivity (MS) shown on a rat brain atlas
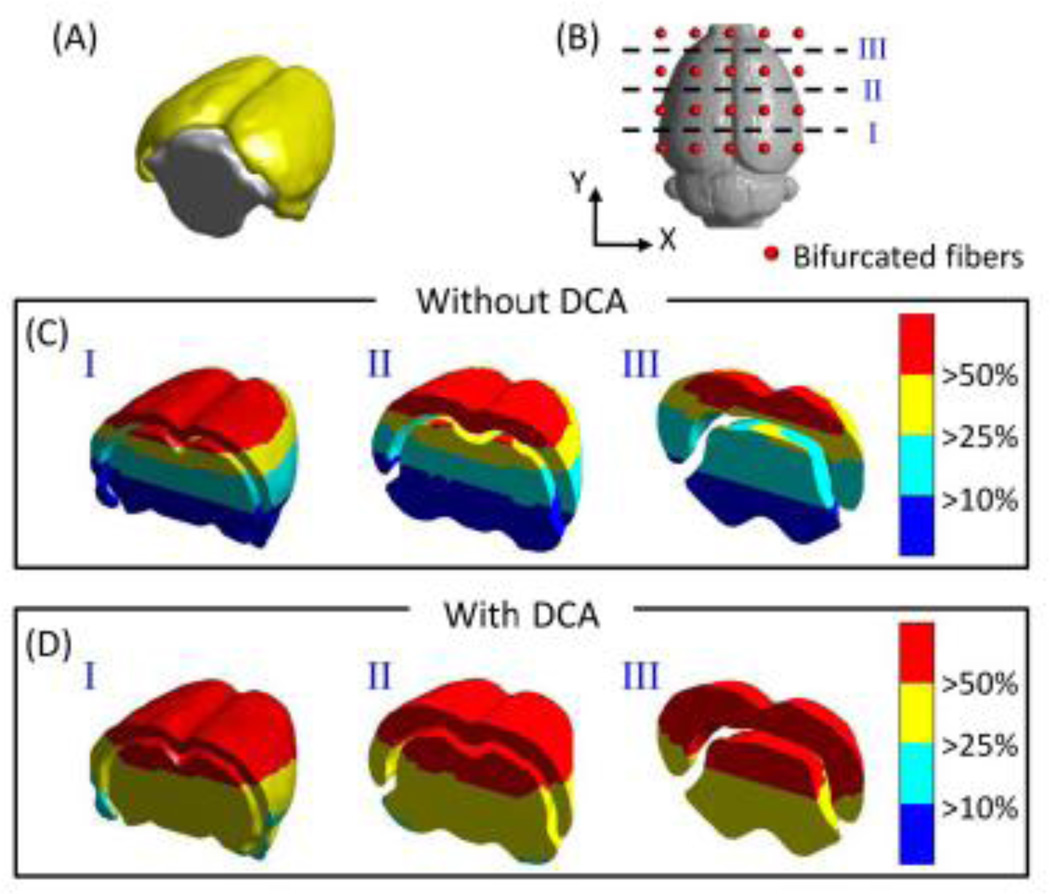
Considering the volumetric distributions of DOT sensitivities, we compared the depth-compensated and depth-uncompensated measurement sensitivities (MS), namely, versus Jrh, within cortical (shown by yellow isosurface in Fig. 5A) and subcortical (shown by gray isosurface in Fig. 5A) areas. Moreover, since the distributions of MS depend highly on the arrangement of optodes, we chose three coronal cross sections to see volumetric sensitivity distributions, as marked by three dashed lines in Fig. 5B: ~2 mm above the bottom row (cross-section I), central line (cross-section II), and ~2 mm below the top row (cross-section III) of the optode array, respectively. Figure 5C and 5D depict the corresponding coronal views of spatial distributions of un-compensated and compensated MS. Both sets of these figures reveal that the cortical and upper subcortical areas/volumes (red colored) have a MS higher than MShigh (MShigh =50% Smax, where Smax is the maximum sensitivity). Without using DCA, Fig. 5C shows that approximately one-third of the cross-sectional cerebral area has a MS lower than MSlow (MSlow =10% Smax), mainly located at the bottom of the subcortical area. After utilizing DCA, Fig. 5D illustrates that almost all the cortical and subcortical areas/volumes have a MS above MSmedium (MSmedium=25% Smax), demonstrating improved MS in depth for imaging deeper tissues.
Fig. 5.
(A) 3D rendered plot of cortical (yellow) and subcortical (gray) region of cerebrum. The distributions of different threshold levels of measurement sensitivities at three coronal locations, as marked in (B), while DCA was not (C) or was (D) applied.
3.2 Rat brain atlas-guided DOT images of cerebral hemodynamics in ischemic rats
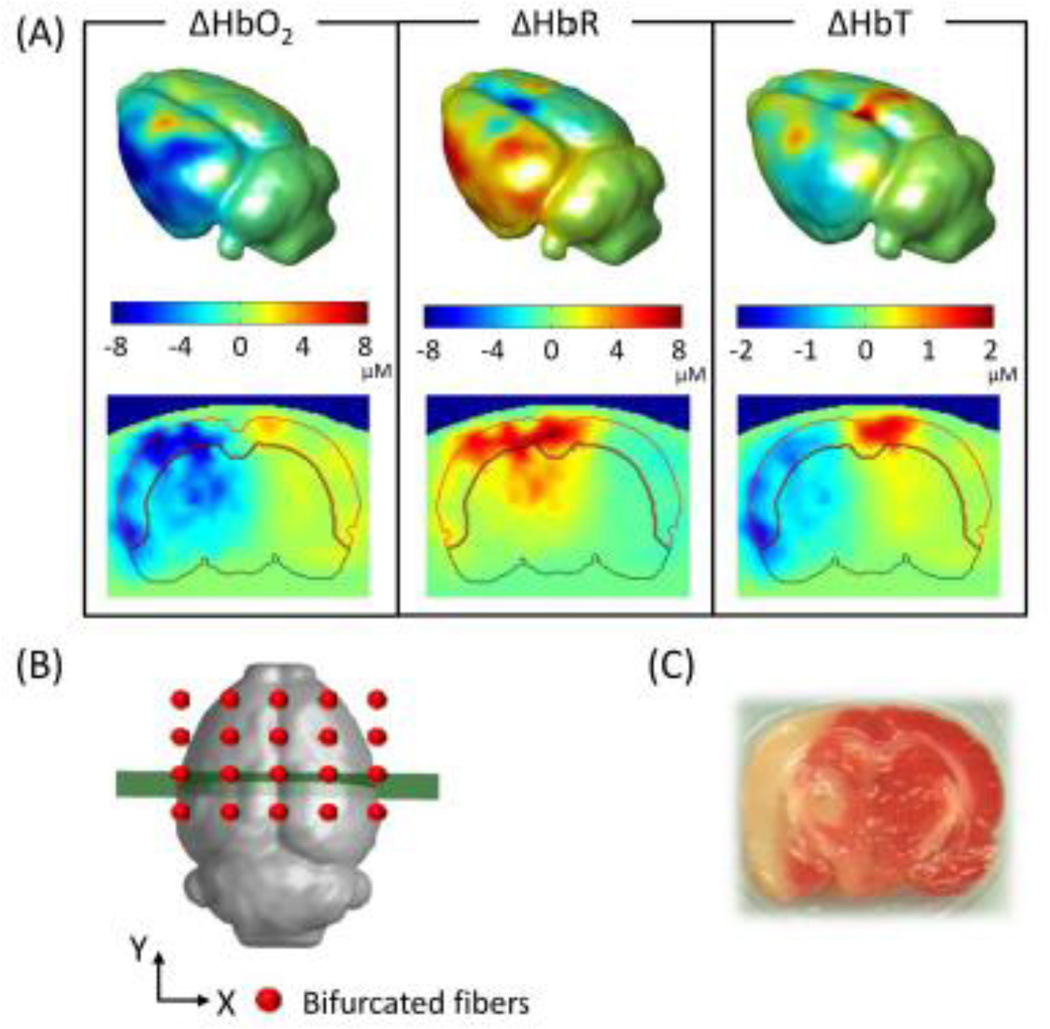
Using the procedures given in Sections 2.4 and 2.5, we were able to obtain volumetric DOT images reconstructed on a rat brain atlas for studying cerebral hemodynamics in ischemic stroke rats. Figure 6A demonstrates reconstructed images from G-Ino-ICG rats during MCAO. The upper row of Fig. 6A shows the isosurface plots or 3D rendered rat brains with changes in oxygenated (ΔHbO2), deoxygenated (ΔHbR), and total hemoglobin (ΔHbT) concentrations, averaged across nine rats, at ~30 min after MCAO. The bottom row illustrates reconstructed tomographic images of ΔHbO2, ΔHbR and ΔHbT sliced along a coronal view, as marked by the thick line across the center of the probe array in Fig. 6B. The areas shown correspond to the middle cerebral artery (MCA) territory. The Isosurface plots in Fig. 6A reveal decreases of ΔHbO2 and ΔHbT and increases in ΔHbR during MCAO. These plots also demonstrate that major hemodynamic changes occurred on the outer side of the left hemispheres, which matched well near the MCA territory. The volumetric DOT results were confirmed by histological analysis [2, 3, 5-triphenyltetrazolium chloride (TTC) staining] of this suture-induced stroke rat model as shown in Fig. 6C. Furthermore, the coronal views of these images exhibit that major hemodynamic changes took place on the left (or ipsi-lateral) side of cortical as well as subcortical regions. Our observation is consistent with a review report (Carmichael, 2005), which documented that most of the animal stroke models produce substantial damages to many different brain regions, including those seen in Fig. 6.
Fig. 6.
Volumetric hemodynamic images reconstructed to show the rat brain at ~30 min after MCAO. (A) Upper row displays the 3D rendered brain of ΔHbO2, ΔHbR and ΔHbT, and lower row shows the respective coronal views at a selected cross-section as sliced and marked in (B). (C) 2,3,5-triphenyltetrazolium chloride stain of the infarct region in a coronal view.
3.3 Changes of cerebral hemodynamics in suture-induced ischemic stroke model
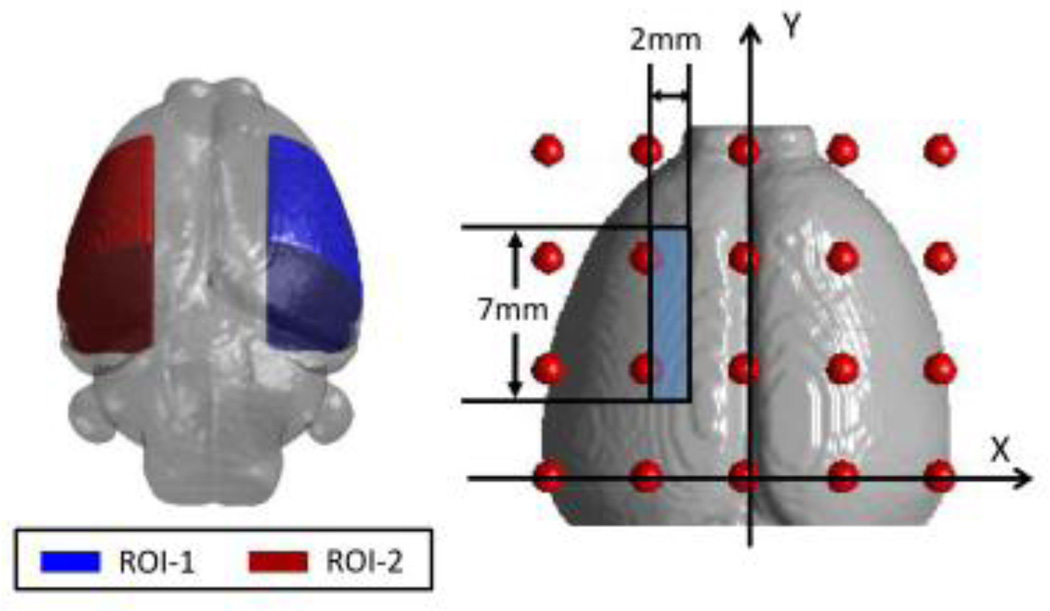
To further investigate the hemodynamic changes during MCAO and reperfusion, we compared the reconstructed DOT images between the ischemic and non-ischemic side of the rat brain. Two regions of interest (ROIs) within the reconstructed images were chosen and located on the outer right side (ROI-1, contralateral control region) and outer left side (ROI-2, ipsilateral ischemic region) of the rat brain, as shown in Fig. 7 with correct dimensions and locations marked.
Fig. 7.
Two region of interest (ROIs) within the rat brain and their corresponding dimensions. ROI-1 is located in the contralateral control hemisphere, while ROI-2 represents the ipsilateral ischemic hemisphere.
3.3.1 Temporal and Spatial Analysis
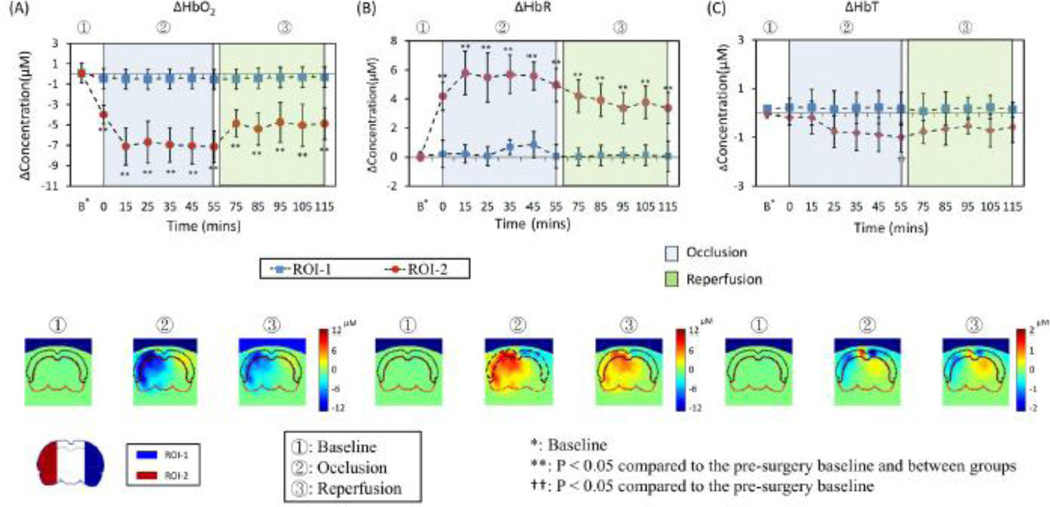
For temporal data analysis, all the FEM-based mesh nodes located within the two ROIs were extracted; the corresponding reconstructed parameters (e.g., ΔHbO and ΔHbR) were spatially summed and averaged at each time point for each rat followed by a grand average over nine rats. Quantitative time traces of hemodynamic changes from these ROIs at different time periods are plotted in the top panel of Fig 8. From Fig. 8A, we observed a significant decrease in ΔHbO2 in ROI-2 while the suture was introduced (0-min at start of occlusion). In the meantime, a dramatic increase of ΔHbR could be seen at the start of occlusion (Fig. 8B). As the suture was withdrawn one hour after MCAO, both ΔHbO2 and ΔHbR values returned gradually toward the pre-MCAO baseline. However, both ΔHbO2 and ΔHbR did not completely recover to the pre-surgery baseline. Regarding the non-ischemic side of the rat brain in ROI-1, small fluctuations were found in both ΔHbO2 and ΔHbR, but there was no statistical significance in either of them as compared to the pre-surgery baselines, respectively.
Fig. 8.
Upper row shows the time tracers of (A) ΔHbO2, (B) ΔHbR and (C) ΔHbT in two ROIs for protocol G-Ino-ICG. Every data point is presented as mean ± SD (standard deviation). Bottom row shows the respective coronal views of reconstructed images sliced across the center of the probe array, as marked in Fig. 6(B), during three representative time points: baseline (t = 0 min), during occlusion (t = 35 min), and after reperfusion (t = 95 min), respectively. On the bottom left corner of the figure, two ROIs are replotted from Fig. 7 for easy ROI recognition.
Furthermore, statistical analysis was taken to compare respective hemodynamic parameters (i.e., ΔHbO2, ΔHbR, ΔHbT) between the two ROIs at selected time points (15 minutes right after MCAO, followed by every 10 min thereafter), as marked in the top panel of Fig. 8. The analysis results suggest that there exist significant differences in ΔHbO2 and ΔHbR between the two ROIs during both periods of occlusion and reperfusion, respectively. Figure 8C shows that ΔHbT in ROI-2 exhibited a similar trend to ΔHbO2; however, there was no statistical difference in ΔHbT between the two ROIs at respective time points, nor between the pre-MCAO baseline and ΔHbT signals before, during, and after MCAO surgery for each ROI.
For spatial data analysis, the bottom panel of Fig. 8 shows three characteristic, time-evolving coronal images averaged over nine rats before, during, and after MCAO (i.e., baseline, 35 min and 95 min after the suture was introduced). Coronal images were sliced along the location marked in Fig. 6B. This set of coronal images consistently reveals that ROI-2 had a much greater decease in ΔHbO and an increase in ΔHbR throughout most of ROI-2 during MCAO, and that the recoveries in both parameters started to occur after the suture was removed; however, recoveries were only partial within ROI-2.
3.3.2 Influence of ICG injection on hemodynamic signals
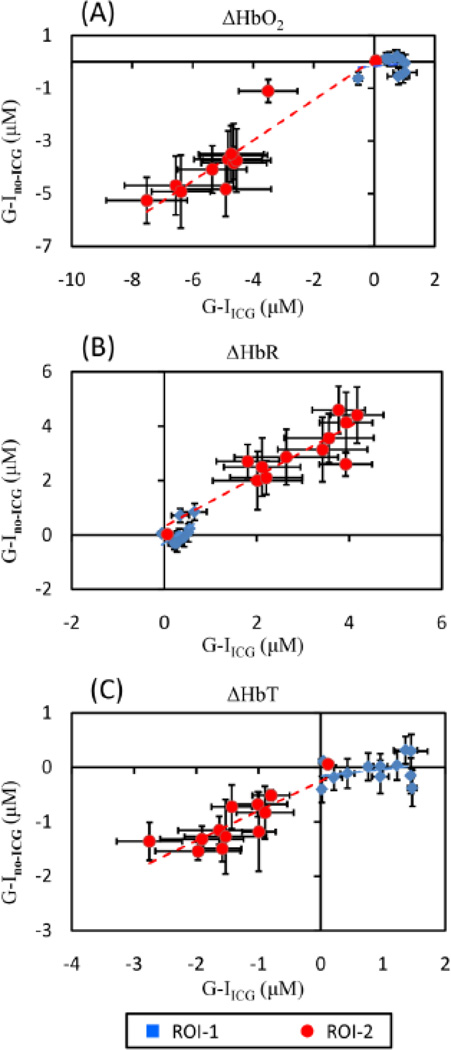
To investigate possible interference on changes of hemodynamic signals from ICG injection, we compared hemodynamic changes taken from both animal groups of G-Ino-ICG and G-IICG. Quantitative hemodynamic changes from these two groups were analyzed using the same procedures as described above. The time points chosen to quantify temporal hemodynamic signals were interleaved with the time points for ICG administration (see Section 2.7), so the inference from ICG absorption should be minimal. Pearson’s correlation coefficients between the two groups (i.e., with and without ICG administration) were calculated for ΔHbO2, ΔHbR, ΔHbT, respectively, throughout the entire time course and are shown in Fig. 9. The results demonstrate good positive correlations between G-Ino-ICG and G-IICG within ROI-2 in ΔHbO2 (r = 0.92; p < 0.001), ΔHbR (r = 0.90; p < 0.001) and ΔHbT (r = 0.84; p < 0.001), as listed in Table 1. Relatively low correlations appear between the two groups within ROI-1 for all three parameters (r = 0.52 for ΔHbO2, 0.54 for ΔHbR, and 0.27 for ΔHbT; p > 0.05; see Table 1 too). We do not expect a high correlation of ΔHbO2 and ΔHbR between G-Ino-ICG and G-IICG in ROI-1 since ROI-1 was the no-injury side and had no consistent pattern of hemodynamic changes observed from each rat. Also, relatively small hemodynamic fluctuations were found throughout entire measurements, but the changes were not significant as compared to the pre-MCAO baseline as shown in Fig. 8. Overall, the analysis on cerebral hemodynamic changes in the two animal groups with and without ICG injection confirmed that the injection of ICG did not significantly affect changes of hemodynamic signals.
Fig. 9.
Scatter plots for comparison of (A) ΔHbO2, (B) ΔHbR and (C) ΔHbT between G-IICG and G-Ino-ICG in two ROIs. The error bars in both X- and Y- axis are standard deviations.
Table 1.
Correlation coefficients of ΔHbO2, ΔHbR, and ΔHbT between G-IICG and G-Ino_ ICG in ROI-1 and ROI-2.
| ROI-1 | ROI-2 | |||
|---|---|---|---|---|
| r | slope | r | slope | |
| ΔHbO2 | 0.52 (p = 0.59) | 0.14 | 0.92 (p = 0.0001)* | 0.77 |
| ΔHbR | 0.54 (p = 0.07) | 1.09 | 0.90 (p = 0.0001)* | 0.89 |
| ΔHbT | 0.27 (p = 0.39) | 0.12 | 0.84 (p = 0.0007)* | 0.55 |
r. correlation coefficient
p< 0.001
3.4 Changes of cerebral hemodynamics in embolism-induced ischemic stroke model
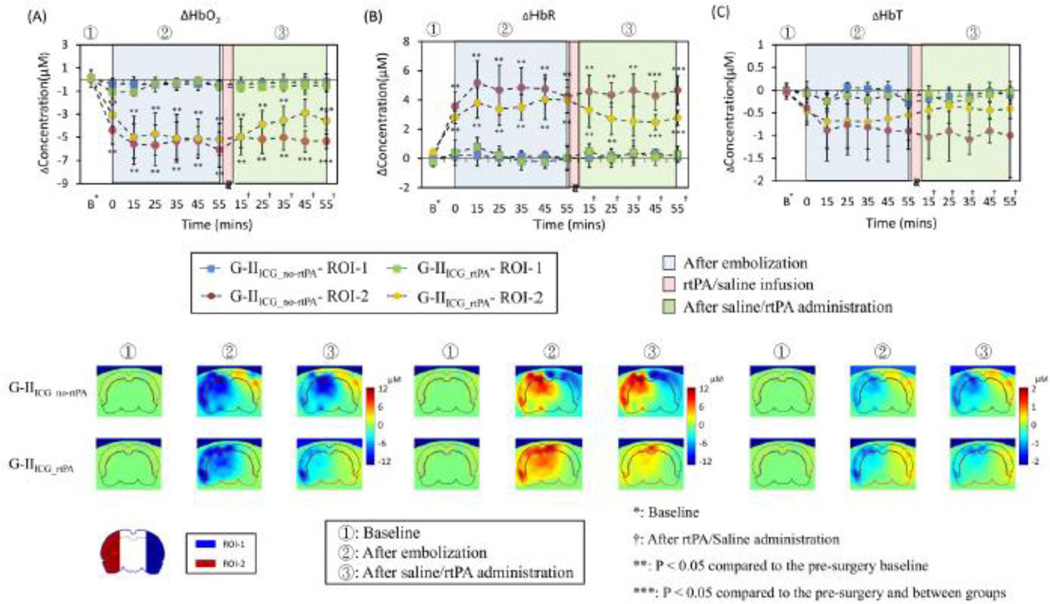
The top panel in Figure 10 shows the quantitative time traces of hemodynamic changes from two embolism-induced ischemia animal groups of G-IIICG_no-rtPA (control group, n=6) and G-IIICG_rtPA (treatment group, n=6). After using the same data analysis procedures as given in Section 3.3.1, we clearly see that the embolism-induced MCAO caused decreases of ΔHbO2 on the ischemic side of the rat brain (ROI-2) after embolization in both groups (down to −5.2±1.1µM in G-IIICG_no-rtPA and −4.7±1.3µM in G-IIICG_rtPA), while increases of ΔHbR also occurred (up to 4.8± 1.2µM in G-IIICG_no-rtPA and 3.7±1.2µM in G-IIICG_rtPA). Further statistical analysis on temporal profiles revealed that in ROI-2, there existed significant differences in ΔHbO2 (see Fig. 10A) and ΔHbR (see Fig. 10B) between the pre-MCAO and post-MCAO readings during the three periods of occlusion, treatment, and reperfusion, respectively, for both treated and untreated groups. In ROI-1, on the other hand, there was no statistically significant change of ΔHbO2 (see Fig. 10A) and ΔHbR (see Fig. 10B) between pre- and post-MCAO signals.
Fig. 10.
Upper row shows the time tracers of (A) ΔHbO2, (B) ΔHbR and (C) ΔHbT in two ROIs for G-IIICG_no-rtPA and G-IIICG_rtPA. Every data point is presented as mean ± SD. Bottom rows show the corresponding coronal views of reconstructed images sliced across the center of the probe array as depicted in Fig. 6B at three time points: baseline (t=0), after embolization (t=35 min), and 35 min after rtPA/saline treatment, respectively, for G-IIICG_no-rtPA and G-IIICG_rtPA. On the left bottom corner of the figure, two ROIs are replotted from Fig. 7 for easy recognition of ROIs.
In particular, for rtPA-treated rats, we found a trend of signal increases in ΔHbO2 (from −4.9± 1.3µM to −3.3±1.1µM; see Fig. 10A) and a trend of signal decreases in ΔHbR (from 3.4±1.4µM to 2.2±0.8µM; see Fig. 10B) in ROI-2 15 minutes after completion of rtPA administration; these trends of recovery continued throughout the entire reperfusion period. For untreated animals, however, there was no significant change before and after injection of saline in both ΔHbO2 and ΔHbR signals. During the recovery period, we especially noticed that within 45 min and 55 min of completed rtPA infusion, respectively, ΔHbR and ΔHbO2 started to show statistically significant differences between treated and untreated animals, as marked in Fig. 10A. While a similar tendency of ΔHbT to increase after rtPA infusion was noted in the treated group, ΔHbT remained no significant changes between the treated and untreated groups over the entire experimental period. No significant difference was seen between pre- and post- MCAO surgery either.
For spatial data analysis, the two bottom panels of Fig. 10 show three characteristic, time-evolving coronal images averaged over six rats at time points before and during MCAO (i.e., baseline and 35 min after embolism was introduced), as well as 35 min after the 30-min rtPA/saline treatment. Images were sliced across the center of optode array as shown in Fig. 6B. This set of coronal images consistently reveals that the treated animal group had a much better improvement than the untreated group in both ΔHbO2 and ΔHbR recovery 45–60 min after rtPA administration, throughout most of ROI-2. However, within this period of time, the recoveries in both parameters were only partial within ROI-2.
3.5 Spatial distribution maps of ICG kinetics
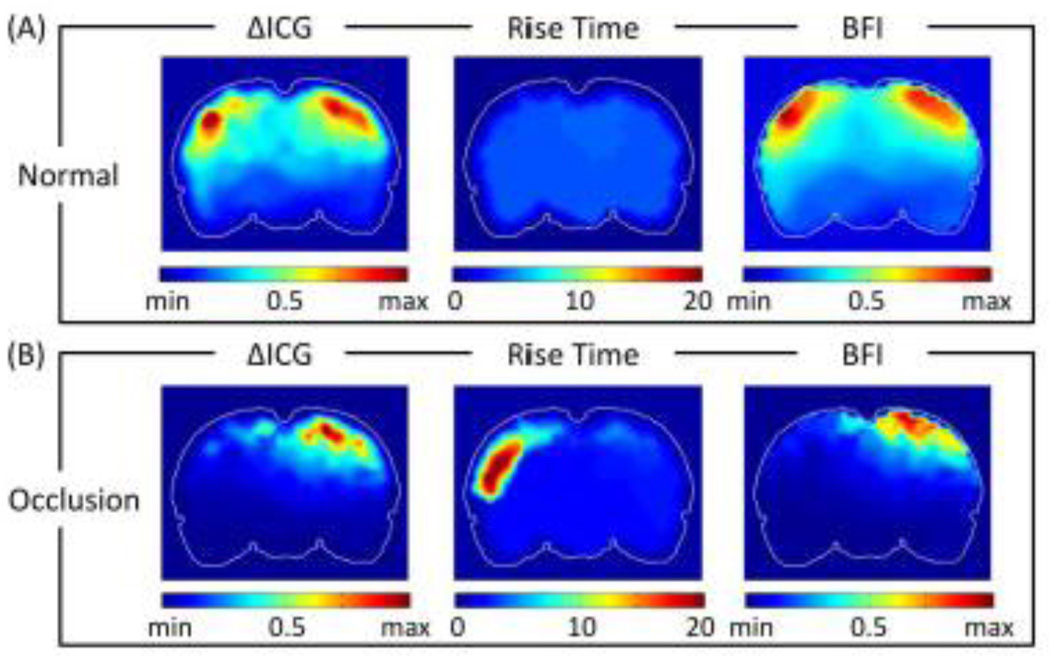
Based on Fig. 4 and eq. (9), we were able to quantify values of ΔICG, RT and thus BFI at each FEM-mesh-based node. We were then able to form volumetric images of respective ICG kinetic parameters after obtaining 3D reconstruction of DOT. Figure 11 shows coronal views, close to the middle of the animal brain (as marked in the left panel), of spatial distribution maps of ΔICG, RT and BFI from normal rats without any occlusion (averaged over six rats) and the rats (n=6 rats) during embolism-induced MCAO. These spatial maps were smoothed using 3 × 3 uniform kernels. Figure 11A shows a relatively symmetric pattern between the two hemispheres in each of the ΔICG, RT and BFI images/maps. Compared to Fig. 11A, Fig. 11B shows a lower ΔICG distribution over the entire ischemic (left) side of rat brain due to the lack of ICG delivery caused by MCA occlusion. Moreover, the RT map displays increases in the transit time of ICG on the ischemic side of hemispheres during occlusion. No such differences between the two hemispheres can be observed in normal rats. Accordingly, the spatial maps of BFI also indicate decreases of cerebral blood flow on the ischemic side of the rat brain.
Fig. 11.
Coronal view of spatial distribution maps of ΔICG, RT, and BFI from (A) normal rats (n=9), and (B) rats during MCAO (n=6). Color scale for ΔICG and BFI are normalized between their own minimum and maximum. Color in RT maps represents time in seconds.
3.5.1 ICG kinetics in suture-induced ischemic model
To calculate time-evolving dynamic changes of BFI throughout the entire measurements before, during and after the suture-induced MCAO, we obtained the spatial BFI maps at the chosen coronal plane (see Fig. 6B) at different time points for each of the G-IICG rats and then normalized their BFI maps individually between their respective maximum and minimum values. Values of normalized BFI were extracted at each node and spatially averaged, respectively, within ROI-1 and ROI-2 (as defined in Fig. 7). As mentioned in Section 2.6, it is not appropriate to make intra-subject comparisons of BFI because of unknown normalization factors among different animals (Wagner et al., 2003). Thus, we introduced the BFI ratio, RatioBFI, as , where BFIs_averaged_ROI–1 and BFIs_averaged_ROI–2 are spatially averaged over each voxel or node within entire regions of ROI-1 and ROI-2, respectively, for each animal.
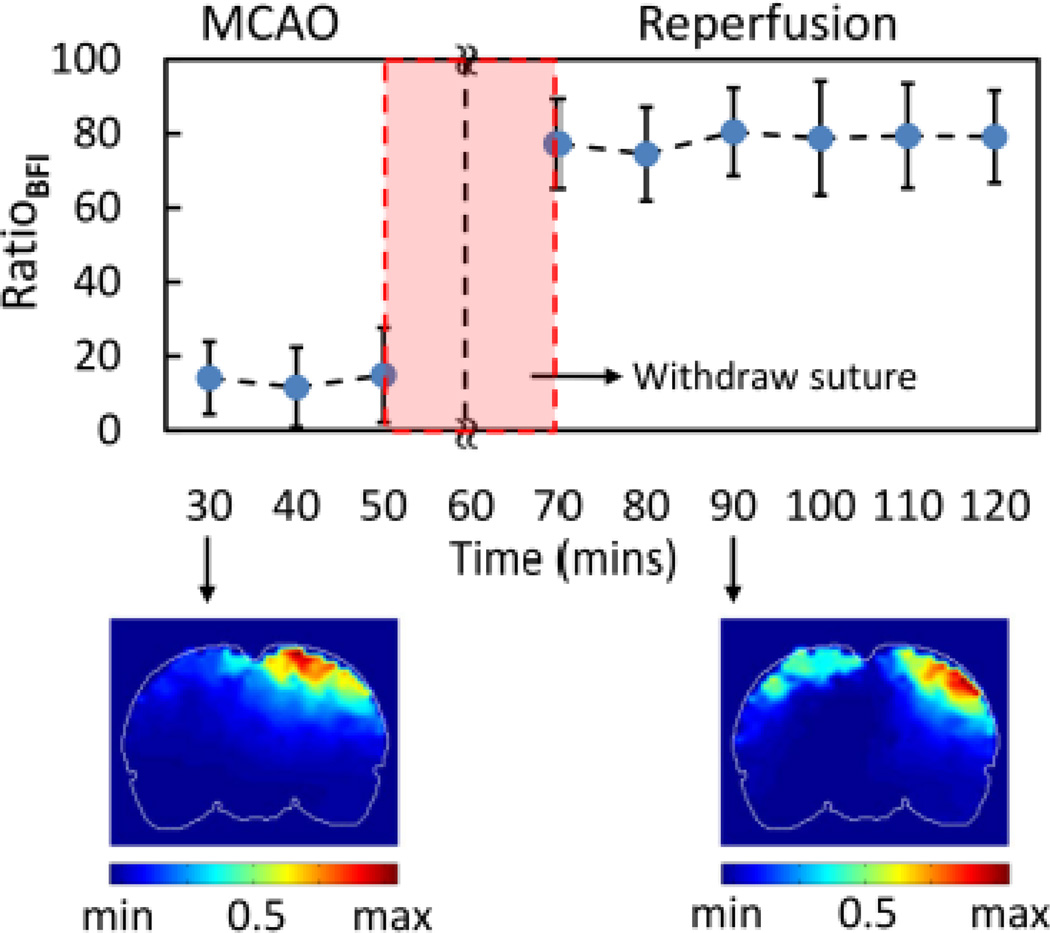
Based on this definition, we obtained a temporal profile (top panel of Fig. 12) of RatioBFI, expressed as a relative reduction of BFI on the occlusion/stroke side with respect to the control side at different time points. For inter-subject comparison, BFI ratios at different time points for each rat were firstly computed and then BFI ratios across the rats were averaged as a group mean of RatioBFI. To demonstrate the variability in RatioBFI among rats, more detailed experimental data are given in Supplementary Material I. (Insert Supplementary Material 1). Figure 12 resulted from an average of six rats; it clearly demonstrates that much less blood flow occurred on the ischemic hemisphere during MCAO, followed by a significant increase after suture was withdrawn, which is a clear indication of prompt recovery of blood reperfusion. Quantitatively, the time trace in Fig. 12 illustrates that the ratio of BFIs between the ischemic and normal side dropped to about 14% (14±11%) during MCAO, recovered to 77% (77±12 %) 10 min after MCAO, and then remained at an average of 79% (79±13%) of BFI in ROI-1. The bottom panels of Fig. 12 show the corresponding spatial maps of normalized BFI ratios 30 min after MCAO and 30 min after reperfusion. Consistently, these two images confirm the gradual recovery of a spatial-symmetry pattern in RatioBFI, which was seen as a characteristic in the BFI of normal rats (see Fig. 11A).
Fig. 12.
Time tracers of BFI ratio in G-IICG. Every data point is represented as mean ± SD (n=6). Bottom row shows cornoal views of BFI images ~35 min after MCAO and ~35 min after suture was withdrawn (reperfusion).
3.5.2 ICG kinetics in embolism-induced ischemic model
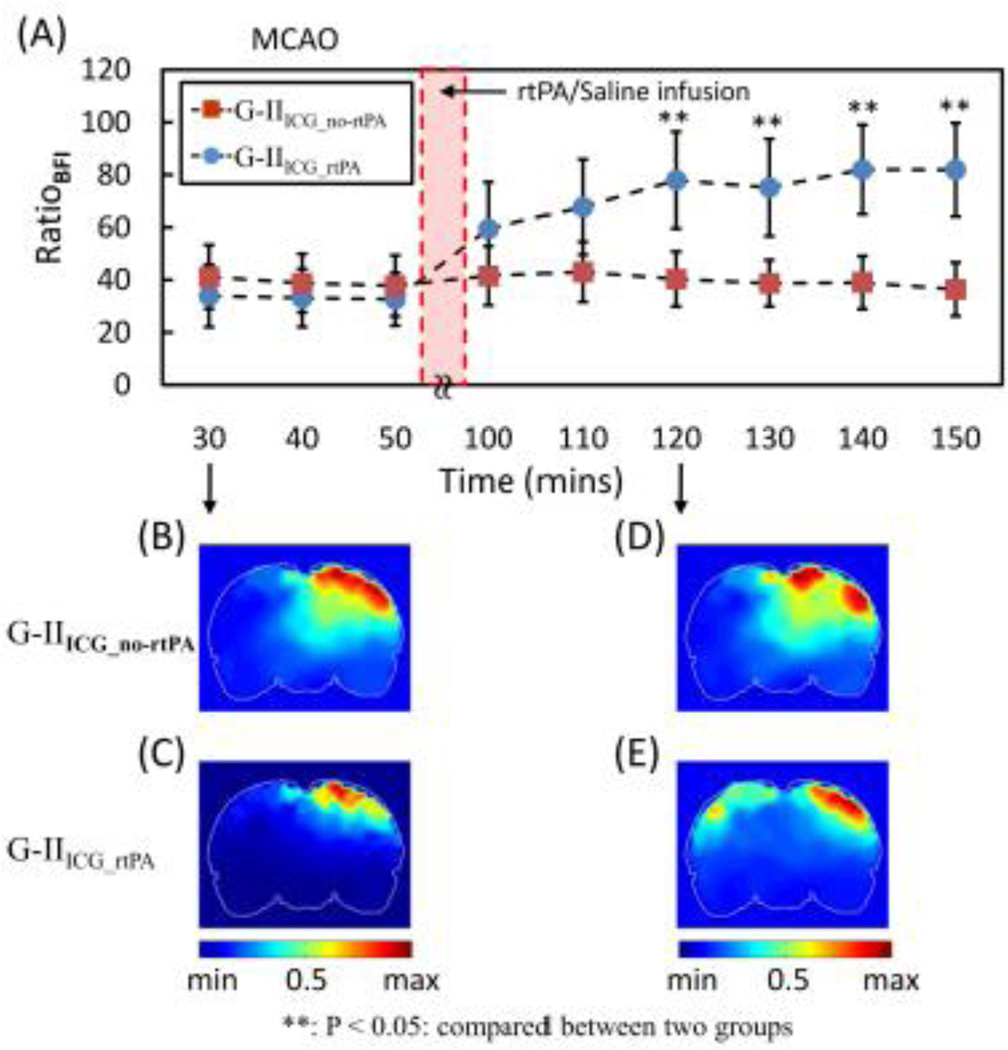
Using the same data processing approach, we analyzed ICG kinetics of the two embolism-induced ischemic rat models: namely, G-IIICG_no-rtPA and G-IIICG_rtPA. The corresponding temporal curves for the two animal groups are given in Fig. 13. Note that rtPA was injected at 60 min after MCAO started, followed by a 30-min treatment time; then the first ICG injection for BFI measurement was administered 10 minutes after the treatment (i.e., 100 min after MCAO or 40 min after rtPA). A trend of recovery in BFI on the left hemisphere is revealed in this figure for G-IIICG_rtPA rats after rtPA administration while no obvious change was found for G-IIICG_no-rtPA rats after saline injection. Specifically, for the untreated group, the normalized RatioBFI in ROI-2 (the ischemic side) dropped to 41% (41±12%) with respect to the BFI over ROI-1 30 min after embolization followed by no changes thereafter. For the rtPA-treated animals, the normalized RatioBFI from ROI-2 decreased to 34% (34±12%) of the BFI over ROI-1 during occlusion, followed by a gradual return to 59% (59±17%) at 10 min after completion of rtPA administration (100 min after MCAO) and to 82% (82±18%) at ~60 min after completion of the treatment (~150 min after MCAO). Statistical differences between the treated and untreated groups were found 30 min after completion of rtPA/saline injection; results remained consistent thereafter.
Fig. 13.
Time tracers of BFI ratio in G-II. Every data point is represented as mean ± SD. Bottom panels display cornoal views of BFI ratio images ~35 min after embolization and ~35 min after MCAO after rtPA (G-IIICG_ rtPA) or saline (G-IIICG_no-rtPA) treatment.
Moreover, bottom left panels of Fig. 13 show the corresponding spatial maps of normalized BFI ratios during embolic MCAO for both treated (Fig. 13C) and untreated (Fig. 13B) rat groups, exhibiting a similar low RatioBFI on the ischemic side. During reperfusion, 30 min after completion of rtPA intervention, values of RatioBFI on the ischemic side of the treated rats appeared to gradually recover throughout the lesion region and exhibit a spatial-symmetry pattern with respect to the distribution of RatioBFI on the control side (Fig. 13E). This recovery characteristic is very similar to that seen in the suture-induced MCAO rats (see Fig. 12). In contrast, saline intervention did not induce any noticeable changes in RatioBFI on the ischemic side of the untreated rats (Fig. 13D).
4. Discussion
In this paper, we presented an experimental study of ischemic stroke using rat MCAO models and high-density DOT measurements. After utilizing DCA and co-registering the optical probes on a rat brain template, we were able to obtain rat brain atlas-guided, volumetric DOT. In particular, an interleaved data acquisition and analysis process was planned and implemented so that we were able to obtain 3D visualization of hemodynamic changes and CBF index in the rat brain, with or without a thrombolytic treatment. Several special aspects of this study are summarized and discussed below:
4.1 Rat brain atlas-guided, volumetric DOT
While DOT suffers from lack of showing anatomical structures, we could calculate hemodynamic changes and compare corresponding differences between ROIs based on anatomical locations if MR images with prior structure information were incorporated. It is well known that reconstruction performances and spatial resolutions of DOT can be enhanced by using a priori structural information (Brooksby et al., 2006; Pogue and Paulsen, 1998), where imaging volumes can be divided into anatomical regions or contours, as ROIs, identified from prior images by MRI or CT. Accordingly, the identified ROIs can be assigned with heterogeneous optical properties so as to reduce the number of unknown optical properties in image reconstructions or in spatial constraint methods (Zhan et al., 2012). However, the key issue of these methods is that accurate subject-specific prior information needs to be acquired. In this study, we used the prior anatomical information to extract ROIs and to project reconstructed volumetric DOT images on a rat brain atlas. Since we did not have subject-specific MR images for each rat, the rat brain atlas-guided DOT matched appropriate anatomical locations only as a group-averaged approximation, but it still provided us with estimated anatomic views of in vivo ischemic rat brains non-invasively. Also, the image reconstruction process described in this study can be easily applied when subject-specific prior information is available.
Arrangement of optodes may affect the measurement sensitivity, MS, and quality of image reconstruction. Xu et al. (Xu et al., 2003) presented the improvement of sensitivity and image quality for deeper tissue structures by adding extra array-opposing fibers, which provided transmission measurements. In our animal measurements, fibers were placed on top of the animal’s scalp, providing a back-reflection optode arrangement. It has been also shown that mathematical compensation algorithms can help greatly improve accuracy of depth localization for deeper tissue structures. Such depth compensated methods have been reported to counterbalance the decrease in measurement sensitivity with increase in depth, thus benefiting the image quality of DOT. Most of the approaches have been developed to image human brain activities (Niu et al., 2010a) or to detect human cancers (Tavakoli and Zhu, 2011; Xu and Piao, 2012). For animal studies, on the other hand, Culver et al. (Culver et al., 2003b) presented an approach using spatially variant regularization to monitor rat brain activation. In this study, our recently developed DCA was adopted to compensate the sensitivity loss in deeper layers and also to reduce the sensitivity on the superficial layer near the optode or measurement surface.
4.2 Effects of baseline optical properties and mesh densities on reconstructed DOT images
It is expected that different baseline optical properties lead to different values of reconstructed hemodynamic changes (i.e., ΔHbO and ΔHbR) since the measurement sensitivity matrix, J, is generated accordingly based on baseline optical parameters (see Section 2.4). Since a large diversity in optical properties of a rat head has been reported by different research groups, we investigated in this sub-section the degree of deviation in reconstructed hemodynamic parameters induced by different baseline optical properties, which were published by several groups. Table 2 lists several sets of published optical properties of a rat head: Set 1 was used earlier in this paper [see Section 2.4 and (Bluestone et al., 2004a)] to obtain reconstructed hemodynamic images due to suture-induced MCAO (Figs. 6 and 8) and embolism-induced MCAO with and without rtPA treatment (Fig. 10). The parameters of Set 2 were introduced by Pogue and Paulsen (Pogue and Paulsen, 1998), who noted a larger absorption coefficient in the rat brain tissues than that in the skin/muscle, which was a somewhat different trend when compared to that in Set 1. Both of these sets list very similar reduced scattering coefficients.
Table 2.
Optical properties of 3-layer and 1-layer homogeneous rat head model
| 3-layer model; µa (mm−1) | 3-layer model; µs’ (mm−1) | |||||
|---|---|---|---|---|---|---|
| skin/muscle | skull | bram | skin/muscle | skull | Brain | |
| Set 1 (Bluestone et al., 2004a) | 0.02 | 0.005 | 0.015 | 0.68 | 2.2 | 2.2 |
| Set 2 (Pogue and Paulsen. 1998) | 0.01 | 0.015 | 0.02 | 0.5 | 2.0 | 2.0 |
| Set 3 (Schmitz et al., 2005) | 0.006 | 0.006 | 0.006 | 1.0 | 1.0 | 1.0 |
| homogeneous model: µa (mm−1) | homogeneous model: µs’ (mm−1) | |||||
| Set 4 (Schmitz et al., 2005) | 0.006 | 1.0 | ||||
Besides baseline optical properties, mesh distributions and densities may affect spatial reconstructions of hemodynamic parameters. To demonstrate this point, the baseline optical properties of a rat head in Set 3 had the same homogeneous values of absorption and reduced scattering coefficients, respectively, for each of the three layers that were seen in the three-layer model used in Sets 1 and 2. On the other hand, Set 4 assumed only a one-layer homogenous model, having the same optical properties as those in Set 3 (Schmitz et al., 2005).
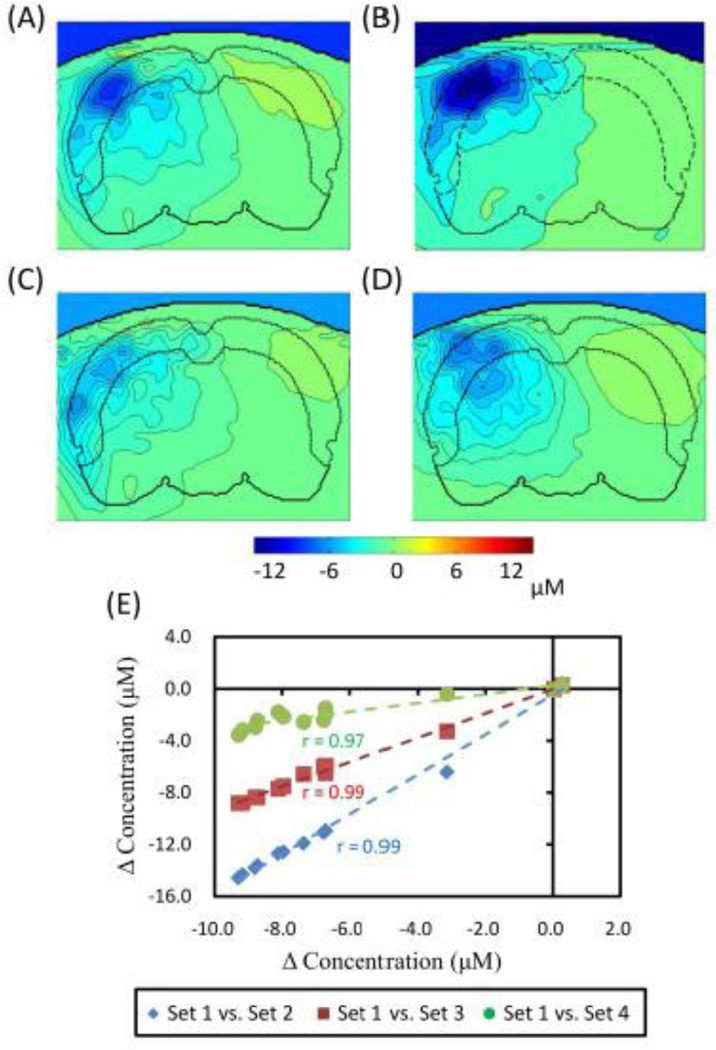
Figure 14A to 14D show cross-sectional contours of reconstructed ΔHbO2 images during cerebral ischemia when four different sets of baseline optical properties or mesh distributions were utilized to generate the MS matrix, J. Figure 14A shows a more dramatic decrease in ΔHbO2 near the upper regions (due to larger absorption and scattering properties) but illustrates a more uniform ΔHbO2 distribution in deeper/central regions, as compared to those in other panels. However, Figs. 14B to 14C reveal a similar ΔHbO2 distribution pattern as most concentration changes are located on the left side of the rat brain. Figure 14D, on the other hand, shows a more diffused and symmetrical/spherical pattern of ΔHbO2 as we look into the left side of hemisphere because of its one-layer homogenous model.
Fig. 14.
Reconstructed images in coronal view of ΔHbO2 from (A) to (D) are reconstructed by different sets of optical properties. Images (C) and (D) were obtained using the same optical properties but (D) was modeled with only one-layer. (E) It shows scatter plots for comparison of ΔHbO2 among four sets of optical properties given in ROI-2. X-axis marks ΔHbO2 values obtained by using set 1 background optical properties, while Y-axis labels ΔHbO2 obtained by other sets of background optical properties.
More quantitatively, as compared to optical properties given by this study’s Set 1, we found an averaged 38% increase in ΔHbO2 amplitude (~30 min after occlusion within ROI-2) when Set 2 was being used, a 3% decrease in amplitude when Set 3 was being used, and a 34% decrease in amplitude when Set 4 was being used. This variation trend is further illustrated by Fig. 14E, which was obtained by comparing the time traces of ΔHbO2 from ROI-2 with the use of 4 sets of background optical properties. High correlations (r= 0.97–0.99; p < 0.05) are observed between the ΔHbO2 results with Set 1 background properties and those with the other three sets of background properties (see Fig. 14E). Overall, this analysis demonstrated that baseline optical properties do affect reconstructed changes in amplitudes of hemodynamic parameters, but they will not affect the trend of dynamic changes throughout the process.
4.3 Two types of MCAO rat models
Two rat MCAO models were measured and investigated in this study. The first model, where focal ischemia was carried out with suture-introduced intraluminal MCAO, has been well developed and widely used to investigate stroke physiology and intervention-related effects by fMRI, PET, and NIRS. Thus, we used it to validate our experimental setup of high-density DOT, to examine interleaved data acquisition and analysis process, and to confirm our volumetric reconstruction methodology. In this part of study, results show statistically significant differences as evidenced by a decrease of ΔHbO2 and an increase of ΔHbR during the occlusion period across the injured brain side, ROI-2 (see Fig. 8). These significant changes started within the early ischemic period (10–15 min after suture was introduced), followed by the recovery of ΔHbO2 and ΔHbR in the early period of reperfusion. An indicator of total blood volume (ΔHbT), however, did not show any statistical difference in its change as compared to that at the pre-surgery baseline. All the observations were consistent with previous publications (Culver et al., 2003a; Liu et al., 2008).
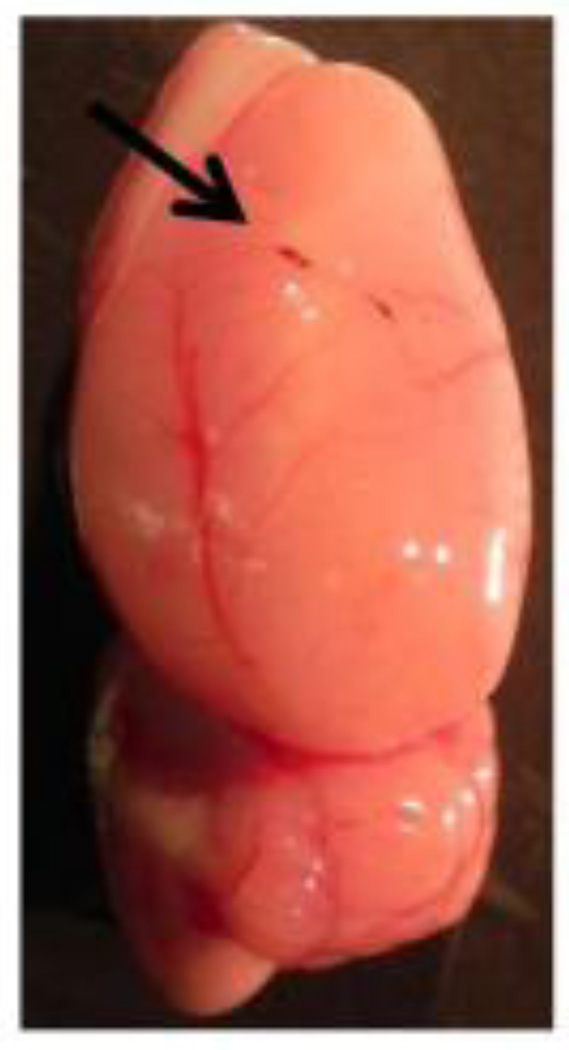
A newly developed embolism-induced ischemic model, which more closely mimics ischemic stroke in humans than the suture model, was also measured and investigated in this study. In general, this embolic stroke model provides more precise lodgment or simulation of clots at MCA bifurcation, thus improving the reproducibility and similarity of ischemic injury. Also, treatment of ischemic stroke with rtPA has been well documented, which helps restore blood flow and oxygen in the focal stroke region affected by embolism-induced cerebral ischemia in both humans (Berrouschot et al., 2000) and animals (Busch et al., 1998; Haelewyn et al., 2010; Jiang et al., 1998). In this study, we were able to demonstrate that time-evolving effects or longitudinal monitoring of thrombolytic therapy with rtPA could be achieved by non-invasive volumetric DOT using the embolic MCAO rat model. Specifically, the treated G-IIICG-rtPA animal group exhibited gradual recovery in both cerebral hemodynamics (Fig. 10) and blood reperfusion (Fig. 13), similar to those seen after withdrawal of the suture in the suture-induced MCAO model (Figs. 8 and 12). After recanalization, however, the recovery of increasing ΔHbO2 and decreasing ΔHbR were found to be slower as compared to those in the suture model since the process of clot breakdown took time, relatively much slower than withdrawing a suture. In order to validate our DOT results, we also performed histology analysis on the post-surgery animal brains and found small breaking-down clots at a couple of peripheral branches of MCA, but only in one of the six rtPA-treated rats (Fig. 15); however, no significant effect was observed when checking for changes in hemodynamic parameters. Both temporal and spatial results from G-IIICG_no-rtPA rats reveal the outcome of a permanent rat MCAO model, while the hemodynamic changes reconstructed from G-IIICG_rtPA animals represent reversible retrieval of cerebral functions because of a timely therapeutic intervention, without causing obvious changes thereafter.
Fig. 15.
Rat brain sample removed from G-IIICG_rtPA. A small breaking-down clot was found at peripheral branch of MCA (indicated by arrow).
4.4 Advantages of Interleaved Data Acquisition and Analysis
One novelty of this study was to develop and achieve interleaved data acquisition and analysis (see Fig. 2) in order to obtain both hemodynamic parameters (ΔHbO2 and ΔHbR) and BFI, or to obtain volumetric DOT images of ΔHbO2, ΔHbR, and BFI during and after ischemic stroke. Specifically, we determined and utilized a 10-min inter-injection interval based on our pilot study, which showed a rapid clearance time of ICG to be ~5 minutes or shorter in the blood stream of a living biological system (such as rats). Then, the measured optical density changes by multi-channel NIRS were temporally interleaved into two categories during data analysis: 1) the data taken 0–5 min right after ICG administration was used to derive BFI; 2) the data collected 5–10 min after ICG injection gave rise to ΔHbO2 and ΔHbR, with small interference from ICG absorption. This enabled us to acquire volumetric DOT images of ΔHbO2, ΔHbR, and BFI, before, during, and after MCAO in both ischemic stroke rat models.
It is known, however, that NIRS or DOT measurements would be perturbed by multiple ICG injections, potentially by a small amount of ICG residual, thus leading to possible errors in quantification of ΔHbO2 and ΔHbR. To avoid such faulty outcomes, we carefully studied the effect of transit ICG injection on changes of hemodynamic parameters (see Sections 2.7, 3.3.2, and Fig. 9). We found that each of the hemodynamic parameters (i.e., ΔHbO2, ΔHbR, and ΔHbT) are highly correlated between G-Ino_ ICG and G-IICG on the ischemic side, indicating no significant effects due to ICG injection on trends of ΔHbO2, ΔHbR, and ΔHbT during and after suture-induced MCAO. Also, the body-weight-proportioned ICG concentration was carefully calculated and diluted several times for injection; we expected to have minimal ICG accumulation or recirculation. There was one clear peak found in temporal profiles of optical density changes per ICG injection, but it did not affect results. De Visscher et al. (De Visscher et al., 2002) also observed a lack of ICG accumulation or recirculation in related experiments.
To investigate the reduction of CBF during cerebral ischemia, ICG-tracking technique was employed in our study. For a suture-induced MCAO model, it has been well documented that occlusion leads to a decrease in CBF to approximately 30% to 40% of the pre-ischemic baseline (Alkayed et al., 1998; Yang et al., 1994). CBF was recovered to approximate 80% of the baseline after reperfusion (Liu et al., 2008). Our results exhibited that BFI on the ischemic side dropped to approximately 14% of that on the control side during occlusion and then returned to 79%. In terms of the embolism-induced MCAO model, our study shows a relatively broader range of CBF drop after embolization compared to the suture-induced MCAO model. rtPA-mediated recanalization also exhibited a different range of CBF recovery. The reason could be the complexity of embolic model itself, e.g., length of clots, types of clot, etc. Our results showed that BFI on the ischemic side dropped to approximately 34% of that on the control side in G-IIICG-rtPA after embolization and then returned to about 82% after rtPA treatment. The BFI ratio decreased to 40% during the occlusion and remained stable with no significant changes after saline injection in G-IIICG_no-rtPA. Similar results were reported consistently by Haelewyn et al. (Haelewyn et al., 2010) where rats were only administered with saline after embolization.
Notice that a large standard deviation is shown in our analysis and may be caused by the inter-subject variation. Although all procedures were done by a well-trained surgeon, the differences among animals still could not be eliminated. Notice that the BFI ratios in this study were calculated based on the assumption that no significant changes occurred on the control regions during MCAO and reperfusion for both rat models. Culver et al. (Culver et al., 2003a) showed that CBF on the control side of animal brain remained relatively stable during occlusion and reperfusion in rats with the suture-induced ischemic stroke model. Haelewyn et al. (Haelewyn et al., 2010) also presented no significant changes on the non-ischemic side of rat brain when using the embolism-induced model. Although ICG-tracking techniques do not allow absolute quantification of CBF, our results demonstrated the feasibility of using continuous-wave NIRS measurement combined with ICG-tracking strategy to study the trend of dynamic changes of CBF due to cerebral ischemia.
4.5 Influence of ICG on quantification of hemodynamic variables
In section 3.3.2 and Table 1, we showed that the slopes of correlations of ΔHbO2, ΔHbR, and ΔHbT in ROI-2 between G-IICG and G-Ino_ICG are 0.77, 0.89, and 0.55, while the respective correlation coefficients are high (0.90, 0.92, and 0.84). The implication of this set of results seems that readings of ΔHbO2, ΔHbR, and ΔHbT induced by MCAO in the rat brains are affected by ICG injections. To examine whether an increase in ICG clearance time between adjacent ICG injections could help increase the correlation slopes between the two rat groups with and without ICG interventions, we computed the correlations between the two groups at 5, 7, and 9 min after ICG injections. Table 3 lists the corresponding values for all three ΔHbO2, ΔHbR, and ΔHbT parameters at three post-injection times. Paired t-tests were performed between the two groups at each of the three time points and gave rise to no statistically significant difference between them, respectively, as given in the table. Furthermore, results from one-way ANOVA also show no significant differences among three different time marks for all hemodynamic parameters (p = 0.89 for ΔHbO2, p = 0.94 for ΔHbR and p = 0.52 for ΔHbT). In conclusion, the interference of ICG residuals was not large enough to cause a significant effect in hemodynamic changes during and after ischemic stroke.
Table 3.
Comparison of correlation coefficients of hemodynamic parameters between G-IICG and G-Ino_ICG
| ΔHbO2 | ΔHbR | ΔHbT | ||||
|---|---|---|---|---|---|---|
| slope* | p+ | slope* | p+ | slope* | p+ | |
| 5 min | 0.77 | 0.51 | 0.89 | 0.81 | 0.55 | 0.13 |
| 7 min | 0.84 | 0.58 | 0.90 | 0.82 | 0.65 | 0.16 |
| 9 min | 0.81 | 0.52 | 0.88 | 0.81 | 0.63 | 0.15 |
This slope can be calculated and visualized using Fig. 9.
This p value is obtained by a paired t-test between G-IICG and G-Ino_ICG.
To completely minimize or eliminate the interference of ICG residuals, there are other approaches. First, we may reduce the concentration of ICG or injection volume and/or increase the inter-injection period. However, this approach may cause decease in signal-to-noise ratio for ICG kinetics, leading to quantification errors during calculations. Also, increasing the inter-injection period will cause a loss of temporal resolution, which means we collect fewer temporal points to help determine the dynamic changes of CBF. Further investigation on how to optimally design the interleaved temporal data acquisition will help strengthen the proposed methodology. Ultimately, we wish to separate absorption of ICG from those of hemoglobin derivatives with minimal cross-talks between them. This can be achieved by increasing the number of wavelengths used from two to three or more, so absorption of ICG and that of hemoglobin species (HbO and HbR) can be quantified simultaneously and independently.
For the embolism-induced model, we did not particularly study the interference of ICG injections to validate our methodology. However, since we have observed and shown similar spatial and temporal changes in hemodynamic parameters (compare Figs. 8 and 10) and RatioBFI patterns (compare Figs. 12 and 13) in the two MCAO rat models, we expect to have a similar effect of ICG on the signals measured for the embolism-induced model.
4.6 Comparison of Ratios of BFI before and after MCAO
As shown in Figs. 11 to 13, increases in BFI and RatioBFI are observed after either suture removal or rtPA treatment. It would be also interesting to compare RatioBFI values during recovery to the baseline values obtained before MCAO. Since the baseline values of RatioBFI in MCAO rats before surgery should be equivalent to those from normal rats (N = 6) without MCAO surgery, we used RatioBFI values of normal rats as the baseline for comparison. Specifically, the averaged RatioBFI for 6 normal rats was 98.4±8.2%. We also identified RatioBFI values from suture-induced MCAO rats (N=6) at six different time points (with a 10-min temporal interval) after suture removal. As shown in Fig. 11A in section 3.5, a symmetric pattern of BFI between two hemispheres is clear. After comparing baseline BFI ratio with those at different time points after suture removal, as shown by inline Supplementary Figure S2, [insert inline Supplementary Figure S2], we obtained several observations: 1) no obvious changes in BFI ratios were found during the period of reperfusion, meaning that CBF remained a relative stable level during reperfusion; 2) the mean BFI ratios after suture removal were statistically lower than that in baseline, indicating that CBF did not recover completely to the pre-surgery status although they increased greatly (see Fig. 12). This observation is consistent with those presented by Liu et al. (Liu et al., 2008), reporting that CBF measured by Laser Doppler flowmetry did not return to pre-surgery baseline.
The decrease in CBF on the ischemic hemisphere after MCAO could be due to the MCAO model itself. In our suture-induced ischemic stroke, the left common carotid artery (CCA) was permanently cauterized during MCAO surgery. Blood could be supplied only from contralateral side or the non-ischemic hemisphere for blood circulation. However, somewhat inconsistent conclusions on CBF recovery after reperfusion were reported by different research groups. The inconsistency may result from uses of different measurement modalities as the fundamental physics and data processing method for each modality are different. Even with the same modality (Laser Doppler flowmetry) to measure CBF recovery after reperfusion, Tueryen et al. (Tureyen et al., 2004) showed CBF returned to the baseline level within 20 min while Liu et al. demonstrated CBF did not recover to baseline even 60 min after suture was withdrawn. Our results provide good agreement with those by Liu et al., but a definite conclusion on time evolution of CBF recovery remains to be confirmed by future studies.
4.7 Weakness of the study
While we demonstrated in preceding sections that we can combine DOT with an ICG-tracking method to achieve interleaved 3D images of cerebral hemodynamics and blood flow index in two MCAO rat models, the spatial resolution is still limited by the nature of light scattering in tissues. With a dense optode array used in this study (see Fig. 1B), the best spatial resolution that we could achieve is still in a several-millimeter range, not permitting to observe detailed structures of occluded blood vessels. This intrinsic limitation might be improved by using a photo-acoustic approach (Wang and Hu, 2012), which needs further exploration and confirmation. Another weakness of the current method is the requirement for frequent injections of ICG because it is invasive and is limited by the total number of injections or by the maximal injected volume of ICG that a subject can tolerate. Further technical development is necessary in order to solve this problem, but it is beyond the focus of this study.
5. Conclusions
In conclusion, we have utilized a continuous-wave DOT system to study and image the changes of hemodynamic parameters resulting from suture-induced and embolism-induced rat stroke models. Meanwhile, by using the same experimental setup with the ICG-tracking method, we were able to investigate dynamic changes in cerebral perfusion at multiple temporal points during and after cerebral ischemia without extra instrumentation and with little interference of measurements. Moreover, utilizing DCA to achieve volumetric image reconstruction facilitated 3D hemodynamics (i.e., HbO2 and Hb) and BFI imaging. The methodology developed in this study also provided us with an excellent visualization and quantification tool to gain insight into cerebral changes at different sites of the rat brain undergoing ischemic stroke or treatment. Our analyzed results have exhibited consistent patterns of changes in cerebral hemodynamics and perfusion from both rat models during occlusion and reperfusion, and they are also in good agreement with previous studies. Overall, this research demonstrates that the interleaved imaging approach as shown herein is a useful and feasible tool to study stroke physiology and can also be used in evaluating the effect of thrombolysis.
Supplementary Material
Highlights.
Integration of a depth compensation algorithm and rat head atlas for volumetric DOT.
Time-evolving 3D images of cerebral hemodynamics and blood flow index (BFI) in rats.
Interleaved method to image cerebral hemodynamics and BFI in two rat stroke models.
Longitudinal visualization to monitor responses to thrombolysis in embolism rats.
Acknowledgements
This work has been supported by the National Institutes of Health (5R33CA101098). Authors gratefully acknowledge the help of Dr. Haijing Niu from State Key Laboratory of Cognitive Neuroscience and Learning, Beijing Normal University, Beijing, China, for her suggestions in DCA. Authors especially acknowledge members of the NMD Lab at Tohoku University for permission to use their rat atlas. Authors also acknowledge two MATLAB-based packages available on the website, which are FEM solver NIRFAST: http://www.dartmouth.edu/~nir/nirfast/ and mesh generator iso2mesh: http://iso2mesh.sourceforge.net/cgi-bin/index.cgi.
Abbreviations
- 3D
three-dimensional
- BFI
blood flow index
- CBF
cerebral blood flow
- CCA
common carotid artery
- CT
computed tomography
- DCA
depth compensation algorithm
- DOT
diffuse optical tomography
- DYNOT
dynamic near-infrared optical tomographic instrument
- ECA
external carotid artery
- FEM
finite element model
- GI
Group I to represent the suture-induced MCAO rat model
- GII
Group II to represent the embolism-induced MCAO rat model
- HbO2
oxygenated hemoglobin concentration
- HbR
deoxygenated hemoglobin concentration
- HbT
total hemoglobin concentration
- ICG
Indocyanine green
- ICA
internal carotid artery
- MCA
middle cerebral artery
- MCAO
middle cerebral artery occlusion
- MRI
magnetic resonance imaging
- NIR
near-infrared
- NIRFAST
a FEM-based MATLAB package
- NIRS
near-infrared spectroscopy
- OD
optical density
- RatioBFI
a ratio between two spatially-averaged BFI values within ROI-2 and ROI-1
- rCBF
regional CBF
- ROI
region of interest
- rtPA
recombinant tissue plasminogen activator
- RW
real world
Footnotes
Publisher's Disclaimer: This is a PDF file of an unedited manuscript that has been accepted for publication. As a service to our customers we are providing this early version of the manuscript. The manuscript will undergo copyediting, typesetting, and review of the resulting proof before it is published in its final citable form. Please note that during the production process errors may be discovered which could affect the content, and all legal disclaimers that apply to the journal pertain.
References
- http://www.cdc.gov/stroke/facts_statistics.htm.
- Alkayed NJ, Harukuni I, Kimes AS, London ED, Traystman RJ, Hurn PD. Gender-linked brain injury in experimental stroke. Stroke. 1998;29:159–165. doi: 10.1161/01.str.29.1.159. discussion 166. [DOI] [PubMed] [Google Scholar]
- Arridge SR. Optical tomography in medical imaging Inverse Probl. 1999;15:R41–R93. [Google Scholar]
- Berrouschot J, Barthel H, Hesse S, Knapp WH, Schneider D, von Kummer R. Reperfusion and metabolic recovery of brain tissue and clinical outcome after ischemic stroke and thrombolytic therapy. Stroke. 2000;31:1545–1551. doi: 10.1161/01.str.31.7.1545. [DOI] [PubMed] [Google Scholar]
- Bluestone AY, Stewart M, Lasker J, Abdoulaev GS, Hielscher AH. Three-dimensional optical tomographic brain imaging in small animals, part 1: hypercapnia. J Biomed Opt. 2004a;9:1046–1062. doi: 10.1117/1.1784471. [DOI] [PubMed] [Google Scholar]
- Bluestone AY, Stewart M, Lei B, Kass IS, Lasker J, Abdoulaev GS, Hielscher AH. Three-dimensional optical tomographic brain imaging in small animals, part 2: unilateral carotid occlusion. J Biomed Opt. 2004b;9:1063–1073. doi: 10.1117/1.1784472. [DOI] [PubMed] [Google Scholar]
- Brooksby B, Pogue BW, Jiang S, Dehghani H, Srinivasan S, Kogel C, Tosteson TD, Weaver J, Poplack SP, Paulsen KD. Imaging breast adipose and fibroglandular tissue molecular signatures by using hybrid MRI-guided near-infrared spectral tomography. Proc Natl Acad Sci U S A. 2006;103:8828–8833. doi: 10.1073/pnas.0509636103. [DOI] [PMC free article] [PubMed] [Google Scholar]
- Busch E, Kruger K, Allegrini PR, Kerskens CM, Gyngell ML, Hoehn-Berlage M, Hossmann KA. Reperfusion after thrombolytic therapy of embolic stroke in the rat: magnetic resonance and biochemical imaging. J Cereb Blood Flow Metab. 1998;18:407–418. doi: 10.1097/00004647-199804000-00009. [DOI] [PubMed] [Google Scholar]
- Carmichael ST. Rodent models of focal stroke: size, mechanism, and purpose. NeuroRx. 2005;2:396–409. doi: 10.1602/neurorx.2.3.396. [DOI] [PMC free article] [PubMed] [Google Scholar]
- Cazzell M, Li L, Lin ZJ, Patel SJ, Liu HL. Comparison of neural correlates of risk decision making between genders: An exploratory fNIRS study of the Balloon Analogue Risk Task (BART) Neuroimage. 2012;62:1896–1911. doi: 10.1016/j.neuroimage.2012.05.030. [DOI] [PubMed] [Google Scholar]
- Chen W, Lu G, Lichty W. Localizing the focus of ischemic stroke with near infrared spectroscopy. Chin Med J (Engl) 2002;115:84–88. [PubMed] [Google Scholar]
- Chen WG, Li PC, Luo QM, Zeng SQ, Hu B. Hemodynamic assessment of ischemic stroke with near-infrared spectroscopy. Space Med Med Eng (Beijing) 2000;13:84–89. [PubMed] [Google Scholar]
- Culver JP, Durduran T, Furuya D, Cheung C, Greenberg JH, Yodh AG. Diffuse optical tomography of cerebral blood flow, oxygenation, and metabolism in rat during focal ischemia. J Cereb Blood Flow Metab. 2003a;23:911–924. doi: 10.1097/01.WCB.0000076703.71231.BB. [DOI] [PubMed] [Google Scholar]
- Culver JP, Siegel AM, Stott JJ, Boas DA. Volumetric diffuse optical tomography of brain activity. Opt Lett. 2003b;28:2061–2063. doi: 10.1364/ol.28.002061. [DOI] [PubMed] [Google Scholar]
- De Visscher G, van Rossem K, Van Reempts J, Borgers M, Flameng W, Reneman RS. Cerebral blood flow assessment with indocyanine green bolus transit detection by near-infrared spectroscopy in the rat. Comp Biochem Physiol A Mol Integr Physiol. 2002;132:87–95. doi: 10.1016/s1095-6433(01)00533-5. [DOI] [PubMed] [Google Scholar]
- Dehghani H, Eames ME, Yalavarthy PK, Davis SC, Srinivasan S, Carpenter CM, Pogue BW, Paulsen KD. Near infrared optical tomography using NIRFAST: Algorithm for numerical model and image reconstruction. Commun Numer Methods Eng. 2008;25:711–732. doi: 10.1002/cnm.1162. [DOI] [PMC free article] [PubMed] [Google Scholar]
- Haelewyn B, Risso JJ, Abraini JH. Human recombinant tissue-plasminogen activator (alteplase): why not use the 'human' dose for stroke studies in rats? J Cereb Blood Flow Metab. 2010;30:900–903. doi: 10.1038/jcbfm.2010.33. [DOI] [PMC free article] [PubMed] [Google Scholar]
- Jiang Q, Zhang RL, Zhang ZG, Ewing JR, Divine GW, Chopp M. Diffusion-, T2-, and perfusion-weighted nuclear magnetic resonance imaging of middle cerebral artery embolic stroke and recombinant tissue plasminogen activator intervention in the rat. J Cereb Blood Flow Metab. 1998;18:758–767. doi: 10.1097/00004647-199807000-00007. [DOI] [PubMed] [Google Scholar]
- Johnson DL, Wiebe JS, Gold SM, Andreasen NC, Hichwa RD, Watkins GL, Boles Ponto LL. Cerebral blood flow and personality: a positron emission tomography study. Am J Psychiatry. 1999;156:252–257. doi: 10.1176/ajp.156.2.252. [DOI] [PubMed] [Google Scholar]
- Keller E, Nadler A, Alkadhi H, Kollias SS, Yonekawa Y, Niederer P. Noninvasive measurement of regional cerebral blood flow and regional cerebral blood volume by near-infrared spectroscopy and indocyanine green dye dilution. Neuroimage. 2003;20:828–839. doi: 10.1016/S1053-8119(03)00315-X. [DOI] [PubMed] [Google Scholar]
- Kuebler WM, Sckell A, Habler O, Kleen M, Kuhnle GE, Welte M, Messmer K, Goetz AE. Noninvasive measurement of regional cerebral blood flow by near-infrared spectroscopy and indocyanine green. J Cereb Blood Flow Metab. 1998;18:445–456. doi: 10.1097/00004647-199804000-00013. [DOI] [PubMed] [Google Scholar]
- Kusaka T, Isobe K, Nagano K, Okubo K, Yasuda S, Kondo M, Itoh S, Onishi S. Estimation of regional cerebral blood flow distribution in infants by near-infrared topography using indocyanine green. Neuroimage. 2001;13:944–952. doi: 10.1006/nimg.2001.0755. [DOI] [PubMed] [Google Scholar]
- Kwiatek R, Barnden L, Tedman R, Jarrett R, Chew J, Rowe C, Pile K. Regional cerebral blood flow in fibromyalgia: single-photon-emission computed tomography evidence of reduction in the pontine tegmentum and thalami. Arthritis Rheum. 2000;43:2823–2833. doi: 10.1002/1529-0131(200012)43:12<2823::AID-ANR24>3.0.CO;2-E. [DOI] [PubMed] [Google Scholar]
- Liao P-S, Chen T-S, Chung P-C. A fast algorithm for multilevel thresholding. J Inf Sci Eng. 2001;17:713–727. [Google Scholar]
- Liu L-F, Yeh C-K, Chen C-H, Wong T-W, Chen J-JJ. Measurement of Cerebral Blood Flow and Oxygen Saturation Using Laser Doppler Flowmetry and Near Infrared Spectroscopy in Ischemic Stroke Rats. Med. Biol. Eng. 2008;28:101–105. [Google Scholar]
- Longa EZ, Weinstein PR, Carlson S, Cummins R. Reversible middle cerebral artery occlusion without craniectomy in rats. Stroke. 1989;20:84–91. doi: 10.1161/01.str.20.1.84. [DOI] [PubMed] [Google Scholar]
- Neumann-Haefelin T, Wittsack HJ, Wenserski F, Siebler M, Seitz RJ, Modder U, Freund HJ. Diffusion- and perfusion-weighted MRI. The DWI/PWI mismatch region in acute stroke. Stroke. 1999;30:1591–1597. doi: 10.1161/01.str.30.8.1591. [DOI] [PubMed] [Google Scholar]
- Niu H, Lin ZJ, Tian F, Dhamne S, Liu H. Comprehensive investigation of three-dimensional diffuse optical tomography with depth compensation algorithm. J Biomed Opt. 2010a;15:046005. doi: 10.1117/1.3462986. [DOI] [PMC free article] [PubMed] [Google Scholar]
- Niu H, Tian F, Lin ZJ, Liu H. Development of a compensation algorithm for accurate depth localization in diffuse optical tomography. Opt Lett. 2010b;35:429–431. doi: 10.1364/OL.35.000429. [DOI] [PubMed] [Google Scholar]
- Pavics L, Grunwald F, Reichmann K, Horn R, Kitschenberg A, Hartmann A, Menzel C, Schomburg AG, Overbeck B, Csernay L, Biersack HJ. Regional cerebral blood flow single-photon emission tomography with 99mTc-HMPAO and the acetazolamide test in the evaluation of vascular and Alzheimer's dementia. Eur J Nucl Med. 1999;26:239–245. doi: 10.1007/s002590050383. [DOI] [PubMed] [Google Scholar]
- Pogue BW, Paulsen KD. High-resolution near-infrared tomographic imaging simulations of the rat cranium by use of a priori magnetic resonance imaging structural information. Opt Lett. 1998;23:1716–1718. doi: 10.1364/ol.23.001716. [DOI] [PubMed] [Google Scholar]
- Ren M, Lin Z-J, Qiana H, Gourava CR, Liu R, Liu H, Yang S-H. Embolic middle cerebral artery occlusion model using thrombin and fibrinogen composed clots in rat. J Neurosci Methods. 2012 doi: 10.1016/j.jneumeth.2012.09.006. [DOI] [PMC free article] [PubMed] [Google Scholar]
- Schmitz CH, Graber HL, Pei Y, Farber M, Stewart M, Levina RD, Levin MB, Xu Y, Barbour RL. Dynamic studies of small animals with a four-color diffuse optical tomography imager. Rev. Sci. Instrum. 2005;76:094302. [Google Scholar]
- Shang Y, Chen L, Toborek M, Yu G. Diffuse optical monitoring of repeated cerebral ischemia in mice. Opt Express. 2011;19:20301–20315. doi: 10.1364/OE.19.020301. [DOI] [PMC free article] [PubMed] [Google Scholar]
- Soriano MA, Sanz O, Ferrer I, Planas AM. Cortical infarct volume is dependent on the ischemic reduction of perifocal cerebral blood flow in a three-vessel intraluminal MCA occlusion/reperfusion model in the rat. Brain Res. 1997;747:273–278. doi: 10.1016/s0006-8993(96)01285-1. [DOI] [PubMed] [Google Scholar]
- Tavakoli B, Zhu Q. Depth-correction algorithm that improves optical quantification of large breast lesions imaged by diffuse optical tomography. J Biomed Opt. 2011;16:056002. doi: 10.1117/1.3573814. [DOI] [PMC free article] [PubMed] [Google Scholar]
- Terborg C, Bramer S, Harscher S, Simon M, Witte OW. Bedside assessment of cerebral perfusion reductions in patients with acute ischaemic stroke by near-infrared spectroscopy and indocyanine green. J Neurol Neurosurg Psychiatry. 2004;75:38–42. [PMC free article] [PubMed] [Google Scholar]
- Tonnesen J, Pryds A, Larsen EH, Paulson OB, Hauerberg J, Knudsen GM. Laser Doppler flowmetry is valid for measurement of cerebral blood flow autoregulation lower limit in rats. Exp Physiol. 2005;90:349–355. doi: 10.1113/expphysiol.2004.029512. [DOI] [PubMed] [Google Scholar]
- Tuominen S, Miao Q, Kurki T, Tuisku S, Poyhonen M, Kalimo H, Viitanen M, Sipila HT, Bergman J, Rinne JO. Positron emission tomography examination of cerebral blood flow and glucose metabolism in young CADASIL patients. Stroke. 2004;35:1063–1067. doi: 10.1161/01.STR.0000124124.69842.2d. [DOI] [PubMed] [Google Scholar]
- Tureyen K, Vemuganti R, Sailor KA, Dempsey RJ. Infarct volume quantification in mouse focal cerebral ischemia: a comparison of triphenyltetrazolium chloride and cresyl violet staining techniques. J Neurosci Methods. 2004;139:203–207. doi: 10.1016/j.jneumeth.2004.04.029. [DOI] [PubMed] [Google Scholar]
- Valdes-Hernandez PA, Sumiyoshi A, Nonaka H, Haga R, Aubert-Vasquez E, Ogawa T, Iturria-Medina Y, Riera JJ, Kawashima R. An in vivo MRI Template Set for Morphometry, Tissue Segmentation, and fMRI Localization in Rats. Front Neuroinform. 2011;5:26. doi: 10.3389/fninf.2011.00026. [DOI] [PMC free article] [PubMed] [Google Scholar]
- von Kummer R, Allen KL, Holle R, Bozzao L, Bastianello S, Manelfe C, Bluhmki E, Ringleb P, Meier DH, Hacke W. Acute stroke: usefulness of early CT findings before thrombolytic therapy. Radiology. 1997;205:327–333. doi: 10.1148/radiology.205.2.9356611. [DOI] [PubMed] [Google Scholar]
- Wagner BP, Gertsch S, Ammann RA, Pfenninger J. Reproducibility of the blood flow index as noninvasive, bedside estimation of cerebral blood flow. Intensive Care Med. 2003;29:196–200. doi: 10.1007/s00134-002-1592-z. [DOI] [PubMed] [Google Scholar]
- Wang LV, Hu S. Photoacoustic tomography: in vivo imaging from organelles to organs. Science. 2012;335:1458–1462. doi: 10.1126/science.1216210. [DOI] [PMC free article] [PubMed] [Google Scholar]
- Xia M, Yang S, Simpkins JW, Liu H. Noninvasive monitoring of estrogen effects against ischemic stroke in rats by near-infrared spectroscopy. Appl Opt. 2007;46:8315–8321. doi: 10.1364/ao.46.008315. [DOI] [PubMed] [Google Scholar]
- Xu G, Piao D. A Geometric-Differential-Sensitivity Based Reconstruction Algorithm Improves Target-Depth Localization for Trans-Lumenal Outward-Imaging Diffuse Optical Tomography. Miami, Florida: Biomedical Optics (BIOMED); 2012. [Google Scholar]
- Xu H, Dehghani H, Pogue BW, Springett R, Paulsen KD, Dunn JF. Near-infrared imaging in the small animal brain: optimization of fiber positions. J Biomed Opt. 2003;8:102–110. doi: 10.1117/1.1528597. [DOI] [PubMed] [Google Scholar]
- Yang G, Chan PH, Chen J, Carlson E, Chen SF, Weinstein P, Epstein CJ, Kamii H. Human copper-zinc superoxide dismutase transgenic mice are highly resistant to reperfusion injury after focal cerebral ischemia. Stroke. 1994;25:165–170. doi: 10.1161/01.str.25.1.165. [DOI] [PubMed] [Google Scholar]
- Zhan Y, Eggebrecht AT, Culver JP, Dehghani H. Image quality analysis of high-density diffuse optical tomography incorporating a subject-specific head model. Front Neuroenergetics. 2012;4:6. doi: 10.3389/fnene.2012.00006. [DOI] [PMC free article] [PubMed] [Google Scholar]
- Zhou C, Yu G, Furuya D, Greenberg J, Yodh A, Durduran T. Diffuse optical correlation tomography of cerebral blood flow during cortical spreading depression in rat brain. Opt Express. 2006;14:1125–1144. doi: 10.1364/oe.14.001125. [DOI] [PubMed] [Google Scholar]
Associated Data
This section collects any data citations, data availability statements, or supplementary materials included in this article.


