

Abstract
Background
The survival rates and prognostic factors for salivary duct carcinoma (SDC) are not clear.
Methods
Survival estimates and prognostic factors were evaluated for 228 patients with SDC identified from the Surveillance, Epidemiology, and End Results (SEER) database.
Results
Median overall survival (OS) duration for patients with SDC was 79 months and 5-year disease-specific survival (DSS) rate was 64%. Among patients with SDC with lymph node involvement, larger primary tumor size (>3 cm) was associated with twice the risk of death (p < .03). Factors predictive of improved DSS were age (p = .01), tumor size (p = .006), tumor grade (p = .02), and lymph node involvement (p < .001). Adjuvant radiotherapy did not improve survival when compared to surgery alone for early-stage (I–II) disease (p = .28).
Conclusion
Younger patients with SDC (<50 years) showed a better prognosis. Primary tumor size and lymph node involvement were independent and additive risk factors for poor prognosis. The role of adjuvant radiotherapy in the treatment of SDC needs to be explored further.
Keywords: salivary duct carcinoma, survival rates, prognostic factors, radiation, SEER
INTRODUCTION
Infiltrating salivary duct carcinoma (SDC) is an uncommon adenocarcinoma arising from the ductal epithelium of major salivary glands.1 Several previous case series have reported preponderance of SDC in men and in individuals in their sixth or seventh decades of life.1–3 Histologic appearance of SDC is that of a high-grade adenocarcinoma resembling mammary ductal carcinoma with duct formation, a solid, papillary, or cribriform growth pattern, and intraductal comedonecrosis. An in situ component has been noted and several histologic subtypes have been described, including mucin rich, sarcomatoid, and micropapillary types.1
Although SDCs predominantly arise from the parotid and submandibular gland, there have also been case reports of SDC arising out of minor salivary glands, oral cavity, and larynx.4–7 Patients with SDC often present with lymph node involvement at diagnosis.3 Therefore, SDC is often treated aggressively, with radical resection and neck dissection followed by adjuvant radiotherapy.2,3 Given its low incidence, most previous estimates of survival and prognostic indicators for SDC have been obtained mainly from case reports, small series, and literature reviews.2,3,8–12 Therefore, clear survival estimates and description of prognostic indicators have not been published. This study utilized the data from the Surveillance, Epidemiology and End Results (SEER) program of the National Cancer Institute to evaluate the incidence and survival of SDC.13 We also evaluated the importance of patient demographics, clinical presentation, and treatment choices on the prognosis of patients with SDC.
MATERIALS AND METHODS
This study was based on SEER data included patients with SDC diagnosed between 1973 and 2008. The SEER database, the most comprehensive population-based data source of cancer incidence and survival in the United States, covers approximately 28% of the U.S. population. This dataset provides information on patient demographics, cancer site, histomorphologic classification, clinical stage at diagnosis, treatment history and sequence (surgery and radiation only), follow-up duration, and vital status.14
For this study, SDC cases were identified based on International Classification of Disease-03 histology code (8500/3) and International Classification of Disease-03 site codes (C00.0–C14.8 and C30.0–C32.9). After restricting the cases to those with a histopathologic confirmation of diagnosis, we identified 228 patients with SDC. Overall and disease-specific survival (DSS) estimates were based on the information on these 228 patients. Overall tumor stage was based on tumor size, extent of disease, and lymph node status according to the American Joint Committee on Cancer Cancer Staging Manual, seventh edition.15 Tumor size was categorized at different levels for comparison (≤2 cm vs >2 cm, ≤3 cm vs >3 cm, and ≤4 cm vs >4 cm). Tumor grade was categorized as low grade (classified in SEER data as well differentiated or moderately differentiated) and higher grade (poorly differentiated or undifferentiated).
Absolute overall and DSS rates at specific time intervals and median survival rates were calculated. Survival analyses were used to evaluate the importance of age, sex, primary site, tumor stage, tumor size, tumor grade, lymph node status, and treatment strategies to survival of patients with SDC. These survival differences were evaluated using Kaplan–Meier survival curves. Differences in survival distributions were evaluated by the log-rank test. The survival differences were further explored through multivariate Cox regression models with adjustment for other significant variables. The results of this analysis are presented as hazard ratios (HRs) with 95% confidence intervals (CIs). All survival estimates were truncated at 10 years after disease diagnosis. Analyses were performed using SPSS data analysis software (version 16.0., SPSS, Chicago, IL).
RESULTS
SDC constituted <1.8% of all major salivary gland tumors in the SEER database. SDC was diagnosed more commonly in men (73%) and in patients between 60 and 80 years of age (54%). The median age at diagnosis was 66 years (Table 1). More than 60% of the patients were diagnosed between the years 2000 and 2008. These cancers predominantly arose in the parotid gland (72%), followed by the submandibular gland (15%). Sixty-five percent of the patients were diagnosed with advanced disease (stage III or IV) and about 50% of the patients had lymph node involvement at diagnosis. Among the 193 patients with primary tumor size information, the mean tumor size was 2.8 cm (range, 0.5–10 cm). The average tumor sizes for submandibular and parotid SDCs were 3.2 cm and 2.8 cm, respectively. This difference was not statistically significant (p = .30). Sixty-two of the patients (27%) were treated with surgery alone, 161 patients (71%) were treated with surgery and adjuvant radiotherapy, and 5 patients (2%) were treated with radiotherapy alone. Adjuvant radiotherapy was used in 55% of patients with stage I/II, 76% of patients with stage III, and 87% of patients with stage IV disease.
TABLE 1.
Patient and tumor characteristics based on 228 patients with infiltrating salivary duct carcinoma in the Surveillance, Epidemiology, and End Results database.
| Characteristic | No. of patients (n = 228) | Percentage |
|---|---|---|
| Age, y | ||
| ≤50 | 33 | 14.5 |
| 51–60 | 45 | 19.7 |
| 61–70 | 65 | 28.5 |
| 71–80 | 59 | 25.9 |
| >80 | 26 | 11.4 |
| Sex | ||
| Male | 166 | 72.8 |
| Female | 62 | 27.2 |
| Race | ||
| White, non-Hispanic | 173 | 75.9 |
| Black | 17 | 7.5 |
| Hispanic | 18 | 7.9 |
| Other | 20 | 8.8 |
| Year of diagnosis | ||
| 1973–1995 | 62 | 27.2 |
| 1996–2003 | 72 | 31.6 |
| 2004–2008 | 94 | 41.2 |
| Primary cancer site | ||
| Parotid gland | 163 | 71.5 |
| Submandibular gland | 33 | 14.5 |
| Major salivary gland, NOS | 13 | 5.7 |
| Other oral cavity and oropharyngeal sites (including minor salivary glands) |
19 | 8.3 |
| SEER historic stage (n = 225) | ||
| Localized disease | 83 | 36.9 |
| Regional disease | 98 | 43.6 |
| Distant disease | 44 | 19.5 |
| Lymph node involvement (n = 225) | ||
| Involved | 111 | 49.3 |
| Not involved | 114 | 50.7 |
| Tumor size (n = 193) | ||
| ≤2 cm | 85 | 44.0 |
| >2 cm–3 cm | 50 | 25.9 |
| >3 cm | 58 | 30.1 |
| Overall stage of cancer (n = 225) | ||
| I or II* | 78 | 34.7 |
| III† | 49 | 21.8 |
| IV-A or IV-B‡ | 85 | 37.7 |
| IV-C§ | 13 | 5.8 |
| Tumor grade (n = 149) | ||
| Well differentiated | 10 | 6.7 |
| Moderately differentiated | 19 | 12.8 |
| Poorly differentiated | 78 | 52.3 |
| Undifferentiated | 42 | 28.2 |
| Treatment | ||
| Surgery only (n = 62) | ||
| Surgery without lymph node dissection |
25 | 11.0 |
| Surgery with lymph node dissection |
21 | 9.2 |
| Lymph node dissection only | 2 | 0.9 |
| Surgery, NOS | 14 | 6.1 |
| Radiation with/without surgery (n = 166) |
||
| Radiation only | 5 | 2.2 |
| Radiation + lymph node dissection |
5 | 2.2 |
| Surgery with lymph node dissection + radiation |
108 | 47.4 |
| Surgery without lymph node dissection + radiation |
48 | 21.1 |
Abbreviations: NOS, not otherwise specified; SEER, Surveillance, Epidemiology, and End Results.
Localized disease, size ≤4 cm.
Localized disease, size >4 cm (or) regional disease with direct extension only (or) regional disease with single ipsilateral lymph node.
Regional disease with extension to mandible, ear canal, and/or facial nerve (or) regional disease with >1 lymph node positive for disease.
Distant site(s)/lymph node(s).
Lymph node involvement was detected in 52% of both parotid and submandibular SDC. However, lymph node involvement was more common (74%) in patients with a primary tumor size >3 cm (Figure 1A). There was a significant linear relationship between size of the tumor and likelihood of lymph node involvement (p for trend, < .001). Similarly, lymph node involvement was more common in patients (64%) with high-grade tumors (Figure 1B). There was a significant positive correlation between tumor grade and likelihood of lymph node involvement (p for trend, < .001). A significantly greater percentage of low-grade tumors (91%) were also ≤3 cm in size, when compared to high-grade tumors (63%; p = .007).
FIGURE 1.

Relationship between tumor size, tumor grade, and lymph node involvement. (A) Relationship between the size of the primary tumor and lymph node involvement (based on 193 patients). Statistically significant linear trend (p for trend, < .001). (B) Relationship between the tumor grade and lymph node involvement (based on 148 patients). Statistically significant linear trend (p for trend, < .001). LN, lymph node. [Color figure can be viewed in the online issue, which is available at wileyonlinelibrary.com.]
On 10-year follow-up, 70 patients (30%) died of their SDC disease and 26 (11%) died of other causes. The median follow-up duration for the survivors was 53 months. The median overall survival (OS) duration for SDC was 79 months (Table 2). The absolute 5-year DSS rate for all stages was 64% and the 10-year DSS was 56%. A significantly better 5-year DSS was noted in patients younger than 50 years of age (86% vs 59%; p = .01) and in cancers that were low grade (89% vs 47%; p = .02), early overall stage I/II (84% vs 50%; p < .001), ≤3 cm in size (>65% vs 47%; p = .006), and with uninvolved lymph nodes (80% vs 44%; p < .001). Further, patients with lymph node positive tumors ≤3 cm had a better median DSS (59 months) compared with patients with lymph node positive tumors >3 cm in size (41 months).
TABLE 2.
Overall and disease-specific survival rates for infiltrating salivary duct carcinoma cases reported in Surveillance, Epidemiology, and End Results database.
| DSS rate (%)* |
|||||||
|---|---|---|---|---|---|---|---|
| Factor | Median OS, mo | Median DSS, mo | 1 y | 2 y | 3 y | 5 y | 10 y |
| All salivary duct carcinoma (n = 228) | 79 | >120† | 91 | 82 | 78 | 64 | 56 |
| Age at diagnosis, y | |||||||
| ≤50 (n = 33) | >120† | >120† | 100 | 94 | 94 | 86 | 78 |
| 51–60 (n = 45) | 58 | >120† | 95 | 85 | 77 | 54 | 54 |
| 61–70 (n = 65) | 50 | 59 | 85 | 79 | 72 | 49 | 35 |
| >70 (n = 85) | 74 | >120† | 89 | 78 | 76 | 70 | 62 |
| p < .001‡ | p = .01‡ | ||||||
| Sex | |||||||
| Male (n = 166) | 80 | >120† | 92 | 84 | 79 | 64 | 56 |
| Female (n = 62) | 80 | >120† | 86 | 79 | 77 | 62 | 58 |
| p = .90‡ | p = .77‡ | ||||||
| Primary site | |||||||
| Parotid only (n = 163) | 78 | >120† | 91 | 82 | 77 | 62 | 58 |
| Submandibular only (n = 33) | 45 | 58 | 94 | 80 | 76 | 48 | 35 |
| p = .57‡ | p = .20‡ | ||||||
| Tumor grade | |||||||
| Well or moderately differentiated (n = 29) | >120† | >120† | 89 | 89 | 89 | 89 | 71 |
| Poorly or undifferentiated (n = 120) | 47 | 56 | 90 | 79 | 73 | 47 | 44 |
| p value = .02‡ | p value = .02‡ | ||||||
| Overall stage | |||||||
| I or II (n = 78) | >120† | >120† | 96 | 91 | 90 | 84 | 76 |
| III (n = 49) | 86 | >120† | 96 | 88 | 86 | 67 | 67 |
| IV-A or IV-B (n = 85) | 40 | 46 | 90 | 76 | 69 | 45 | 40 |
| IV-C (n = 13) | 15 | 17 | 54 | 46 | 35 | 12 | 0 |
| p < .001‡ | p < .001‡ | ||||||
| SEER historic stage | |||||||
| Localized (n = 83) | >120† | >120† | 96 | 92 | 91 | 86 | 78 |
| Regional (n = 98) | 51 | >120† | 93 | 84 | 76 | 54 | 51 |
| Distant (n = 44) | 38 | 40 | 76 | 60 | 56 | 29 | 20 |
| p < .001‡ | p < .001‡ | ||||||
| Lymph node status | |||||||
| Negative (n = 114) | >120† | >120† | 95 | 90 | 88 | 80 | 73 |
| Positive (n = 111) | 44 | 48 | 87 | 74 | 68 | 44 | 38 |
| p < .001‡ | p < .001‡ | ||||||
| Tumor size | |||||||
| ≤2 cm (n = 85) | 84 | >120† | 94 | 90 | 86 | 66 | 55 |
| >2–3 cm (n = 50) | 95 | >120† | 96 | 88 | 79 | 75 | 75 |
| >3 cm (n = 58) | 43 | 46 | 83 | 64 | 64 | 47 | 42 |
| p value = .03‡ | p value = .006‡ | ||||||
Abbreviations: OS, overall survival; DSS, disease-specific survival; SEER, Surveillance, Epidemiology, and End Results.
Absolute survival rates.
Median not reached at 10-year follow-up.
Based on log-rank test.
On univariate analyses (Table 3), the OS was significantly better with younger age (p = .001), lower tumor grade (p = .02), early overall stage (p < .001), absence of lymph node involvement (p < .001), smaller tumor size (p 5 .05), and with surgical treatment (p = .04). Similarly, the DSS also varied based on age (p = .01), tumor grade (p = .02), overall stage (p < .001), lymph node status (p < .001), tumor size (p = .03), and treatment type (p = .05).
TABLE 3.
Factors affecting overall survival and disease-specific survival.
| OS |
DSS |
|||||||
|---|---|---|---|---|---|---|---|---|
| Univariate model |
Multivariate model |
Univariate model |
Multivariate model |
|||||
| Factors | HR (95% CI) |
p
value |
HR (95% CI) |
p
value |
HR (95% CI) |
p
value |
HR (95% CI) |
p
value |
| Age at diagnosis, y* | ||||||||
| ≤50 (n = 33) | 1 | 1 | 1 | 1 | ||||
| 51–60 (n = 45) | 3.29 (1.31–8.26) | .001 | 2.82 (0.99–8.11) | .002 | 2.66 (1.04–6.82) | .01 | 1.97 (0.66–5.90) | .01 |
| 61–70 (n = 65) | 4.89 (2.03–11.81) | 4.05 (1.48–11.04) | 3.94 (1.61–9.64) | 3.10 (1.09–8.78) | ||||
| >70 (n = 85) | 4.69 (1.99–11.10) | 3.97 (1.50–10.51) | 2.38 (0.97–5.82) | 2.00 (0.71–5.61) | ||||
| Sex† | ||||||||
| Male (n = 166) | 1 | 1 | 1 | 1 | ||||
| Female (n = 62) | 1.03 (0.65–1.62) | .90 | 1.13 (0.68–1.88) | .64 | 1.08 (0.64–1.83) | .77 | 1.21 (0.67–2.19) | .53 |
| Primary site‡ | ||||||||
| Parotid (n = 163) | 1 | 1 | 1 | 1 | ||||
| Submandibular (n = 33) |
1.28 (0.76–2.15) | .35 | 1.34 (0.76–2.37) | .32 | 1.48 (0.83–2.65) | .18 | 1.57 (0.83–2.98) | .17 |
| Tumor grade§ | ||||||||
| Well or moderately differentiated (n = 29) |
1 | 1 | 1 | 1 | ||||
| Poorly or undifferentiated (n = 120) |
2.36 (1.16–4.82) | .02 | 2.10 (1.02–4.34) | .05 | 2.63 (1.11–6.23) | .02 | 2.50 (1.03–6.07) | .04 |
| Overall stage§ | ||||||||
| I or II (n = 78) | 1 | 1 | 1 | 1 | ||||
| III (n = 49) | 2.17 (1.18–3.98) | 1.76 (0.95–3.27) | 1.62 (0.75–3.51) | 1.35 (0.62–2.98) | ||||
| IV-A or IV-B (n = 85) | 3.52 (2.03–6.10) | < .001 | 3.47 (1.99–6.08) | < .001 | 3.60 (1.89–6.86) | < .001 | 3.53 (1.84–6.79) | < .001 |
| IV-C (n = 13) | 9.37 (4.40–19.97) | 9.46 (4.40–20.37) | 11.86 (5.28–26.62) | 12.23 (5.37–27.89) | ||||
| Lymph node status§ | ||||||||
| Negative (n = 114) | 1 | 1 | 1 | 1 | ||||
| Positive (n = 111) | 2.58 (1.68–3.94) | < .001 | 2.44 (1.59–3.76) | < .001 | 3.21 (1.92–5.38) | < .001 | 3.98 (1.86–5.28) | < .001 |
| Tumor size§ | ||||||||
| ≤2 cm (n = 85) | 1 | 1 | 1 | 1 | ||||
| >2–3 cm (n = 50) | 1.05 (0.59–1.86) | .03 | 1.01 (0.56–1.80) | .05 | 0.69 (0.32–1.47) | .03 | 0.66 (0.31–1.42) | .03 |
| >3 cm (n = 58) | 1.90 (1.15–3.13) | 2.01 (1.19–3.40) | 2.00 (1.14–3.51) | 1.99 (1.10–3.58) | ||||
| Treatment type†† | ||||||||
| Surgery only (n = 60) | 1 | 1 | 1 | 1 | ||||
| Adjuvant radiation (n = 161) |
1.65 (1.02–2.68) | .04 | 0.99 (0.57–1.73) | .39 | 1.84 (1.01–3.33) | .05 | 1.08 (0.54–2.15) | .28 |
| Year of diagnosisf | ||||||||
| 1973–2000 (n = 86) | 1 | 1 | 1 | 1 | ||||
| 2000–2008 (n = 142) | 1.56 (0.98–2.47) | .07 | 1.03 (0.62–1.71) | .91 | 1.97 (1.04–3.38) | .03 | 1.23 (0.67–2.23) | .51 |
Abbreviations: OS, overall survival; DSS, disease-specific survival, HR, hazard ratio; CI, confidence interval.
Multivariate models adjusted for sex, race, tumor site, size, lymph node status, and treatment modality.
Multivariate models adjusted for age, race, tumor site, size, lymph node status, and treatment modality.
Multivariate models adjusted for age, sex, race, tumor size, lymph node status, and treatment modality.
Multivariate models adjusted for age, sex, race, tumor site, and treatment modality.
Multivariate models adjusted for age, sex, race, tumor site, size, and lymph node status.
Multivariate models adjusted for age, sex, race, tumor site, size, lymph node status, and treatment modality.
The results of Cox regression multivariate analyses evaluating OS and DSS are presented in Table 3. Patients who were younger than 50 years had a significantly better DSS when compared with other age groups (51–60, 61–70, and >70 years). The risk of disease-specific death was significantly higher in patients older than 50 years of age (HR, 2.91; 95% CI, 1.14–7.40; p = .03), with adjustment for sex, race, cancer site, overall stage, tumor size, lymph node status, and treatment type (Figure 2A). There was no significant difference in OS or DSS between men and women (Table 3). Similarly, there was no sex-driven difference in survival when patients younger than 50 years were analyzed separately. There was no statistically significant difference in survival based on the year of diagnosis (Table 3). On multivariate models, there was no survival difference between patients diagnosed in the later part of the study and the ones diagnosed during the earlier part of the study (before 2000 vs after 2000) or when diagnostic year was stratified as tertiles (diagnosed before 1995 vs 1996–2003 vs after 2004).
FIGURE 2.

Comparison of disease-specific survival (DSS) by patient age, primary tumor size, and lymph node involvement. (A) Comparing patients <50 and >50 years of age (hazard ratio [HR], 2.91; 95% confidence interval [CI], 1.14–7.40*; p = .03). (B) Comparing patients with and without lymph node involvement (HR, 2.43; 95% CI, 1.35–4.39*; p = .003). (C) Comparing patients with tumor size of <3 cm and >3 cm (HR, 1.86; 95% CI, 1.05–3.30*; p = .03). (D) Comparing tumor size of <3 cm and >3 cm among patients with lymph node involvement (HR, 2.15; 95% CI, 1.08–4.30*; p = .03). *HR calculated based on Cox regression model after adjusting for age, sex, race, cancer site, and treatment type. [Color figure can be viewed in the online issue, which is available at wileyonlinelibrary.com.]
Advancing overall tumor stage was associated with a poorer prognosis (Table 3). Similarly, the risk of disease-specific death was significantly higher for tumors with higher tumor grade (HR, 2.50; 95% CI, 1.03–6.07; p = .04), with lymph node involvement (HR, 2.43; 95% CI, 1.35–4.39; p = .003), and for tumors of size >3 cm (HR, 1.86; 95% CI, 1.05–3.30; p = .03), after adjusting for other significant variables (Figure 2B and 2C). Even patients with lymph node–positive tumors of >3 cm size had a significantly worse prognosis when compared to tumors of ≤3 cm in size (HR, 2.15; 95% CI, 1.08–4.30; p = .03; Figure 2D).
We also evaluated the survival difference between patients treated with surgery alone and patients treated with surgery and adjuvant radiation (Table 3). On univariate analysis, the patients undergoing surgery alone showed a significantly better OS and DSS. However, after adjusting for other significant risk factors like age, sex, race, cancer site, size and lymph node status, there was no significant difference in DSS between the 2 treatment groups (HR, 1.08; 95% CI, 0.54–2.15; p = .28). Similar results were noted when these 2 treatment modalities were compared after stratifying by stage of the disease (Figure 3).
FIGURE 3.
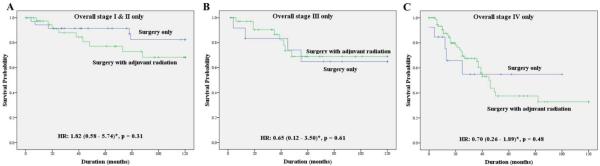
Disease-specific survival (DSS) comparing the surgery only group to the adjuvant radiation group stratified by stage. (A) Comparing the surgery only group to the adjuvant radiation group among patients with stage I and II disease (hazard ratio [HR], 1.82; 95% confidence interval [CI], 0.58–5.74*; p = .31). (B) Comparing the surgery only group to the adjuvant radiation group among patients with stage III disease (HR, 0.65; 95% CI, 0.12–3.50*; p = .61). (C) Comparing the surgery only group to the adjuvant radiation group among patients with stage IV disease (HR, 0.70; 95% CI, 0.26–1.89*; p = .48). *Hazard ratio calculated based on Cox regression model after adjusting for age, sex, race, and anatomic site. [Color figure can be viewed in the online issue, which is available at wileyonlinelibrary.com.]
DISCUSSION
The current study based on 228 histologically confirmed cases, is the largest study on SDC to date. This study contains 3 novel findings: (1) patient age significantly affects the prognosis, with best prognosis in patients <50 years of age (Tables 2 and 3); (2) there is no apparent survival benefit to adjuvant radiation therapy in early stage (I–II) disease (Figure 3A); however, given some of the caveats explored later, the role of adjuvant radiotherapy in the treatment of SDC needs to be explored further; and (3) tumor size and lymph node involvement were both independent and additive risk factors for poor prognosis in patients with lymph node involvement. The presence of primary tumor size >3 cm was associated with twice the risk of death compared to tumor size of ≤3 cm (Figure 2D.)
Age
The name “infiltrating salivary ductal carcinoma” was proposed because of its morphological and clinical similarity with high-grade infiltrating ductal carcinoma of the breast. However, breast carcinomas diagnosed in young patients (<50 years of age) portend poorer prognosis.16,17 This has also been confirmed by studies using the same SEER data source as the current study.18,19 In stark contrast, patients with SDC younger than 50 years of age had a better prognosis than patients over 50 years of age.
Similarly, previously published pathologic findings also demonstrate that SDC is biologically distinct from ductal carcinoma of the breast. Although 75% and 65% of ductal breast carcinomas are estrogen and progesterone receptor positive, respectively, only a small percentage of SDC express these markers.8,11,20–22 SEER data do not provide information receptor status.
The role of adjuvant radiation therapy
At present, there are no consistent therapeutic guidelines for this type of cancer. Perhaps influenced by the resemblance to aggressive infiltrating ductal carcinoma of the breast, similar treatment strategies—including complete surgical excision with lymph node dissection and adjuvant radiation–have often been extrapolated to SDC, irrespective of the tumor stage.2,3,9,23,24 Although there is some evidence of improved local regional control,12 the role of adjuvant radiation in improving the survival in patients with SDC is not clear. None of the previous studies was large enough to evaluate the efficacy of adjuvant radiotherapy in improving the survival in these patients. Based on the current results, adjuvant radiation did not provide any added survival benefit in patients with SDC with stage I or II disease (Figure 3A).
The role of adjuvant radiotherapy for stage III or IV SDC needs to be explored further. Only 24% and 13% of patients with stage III and IV disease, respectively, were offered surgery alone, so the additional value of radiation is unclear. However, the absence of a marked effect (Figure 3B) suggests that the survival benefit of adjuvant radiation, if any, may be small. This further suggests that the clinical course of SDC might be different from that of high-grade mammary ductal carcinoma.
In addition to the limitations arising from the paucity of patients with advanced disease who were not given adjuvant radiation therapy, it is possible that even the patients with early-stage disease who underwent adjuvant radiation were selectively chosen based on high-risk clinical factors, thereby biasing their survival estimates. However, the reasons for therapeutic choices are not captured in the SEER database. Similarly, the SEER database does not provide information on local and regional disease recurrence, thereby making it impossible to evaluate the role of adjuvant radiation in improving local regional control in this patient population. Therefore, further research incorporating these outcome measures is needed to confirm or refute these findings.
Tumor size and lymph node involvement
Although some studies reported a poorer survival in patients with SDC with lymph node involvement,2,8,25,26 several others did not.9,23,27 Similarly inconsistent results were reported on tumor size on survival. Hui et al28 noted poor prognosis in patients with tumors of ≥3 cm. Similarly, a few other studies also reported poor outcome associated with SDC of size >2 cm.2,11,26 On the other hand, several other studies found no correlation between tumor size and prognosis.8,9,23,27 The current study observed a poorer survival associated with both tumor size and lymph node involvement. Additionally, a correlation between tumor size and presence of nodal disease was also noted. Patients with tumor size >3 cm had twice the incidence of nodal disease (p < .03). Only 1 other study has reported this finding in patients with SDC.28
Other demographic, clinical characteristics, and survival
Prior studies reported a better survival for parotid SDC compared to submandibular SDC.10,28 In this study, the patients with parotid SDC showed a 5-year DSS of 62% compared to 5-year DSS of submandibular SDC of 48%; however, this difference was not statistically significant. The distribution of demographic and clinical characteristics of SDC in the current study is consistent with the results reported by previous studies.2,3,8–11 These results confirm that SDC is more frequently found in the parotid gland and occurs more commonly in men and in patients between the ages of 60 and 80 years. SDC is mostly diagnosed at a later stage (stage III/IV) and often has lymph node involvement at the time of presentation, as shown by several other studies.2,3,8,10
The current study also provides detailed estimates of short-term, 5-year, and 10-year survival rates for patients with SDC. The 5-year DSS of 64% is better than the 12% to 40% previously reported.2,10 Because most of the previous literature originated in large tertiary care centers, a referral bias toward advanced and higher grade tumors is possible. Another possible explanation for the better survival rates in this series could be a “cohort effect” because of improved diagnostic and therapeutic capabilities in the later decades. We evaluated this by conducting multivariate analysis stratified by the year of diagnosis and did not notice any statistically significant difference between the groups. Similarly, adding the year of diagnosis to the Cox regression models did not significantly change the estimates; thereby reducing the possibility of a “cohort effect” bias.
Limitations
Although this study presents the largest series on SDC, to the best of our knowledge, certain limitations exist. The diagnosis of SDC is usually straightforward in high histologic grade tumors with classic morphology. However, with low- to intermediate-grade tumors, some nosologic controversy still persists. In a study published in 1996, Delgado et al29 proposed a less aggressive variant of SDC, and similar findings were reported subsequently by a different group.30 This less aggressive SDC variant, which was mostly intraductal and usually smaller in size (most measuring 1–2 cm), was described as a low-grade tumor. Recently, however, a new classification has been proposed for these low-grade cancers. The most recent World Health Organization monograph lists the separate entity classified as low-grade cribriform cystadenocarcinoma.1 Evidence of progression from low/intermediate grade does exist; however, it is unclear whether these cases behave as conventional high-grade SDC.31 It is possible that the low-grade tumors reported as SDC in the SEER database might, in some cases, actually represent low-grade cribriform cystadenocarcinoma because a greater percent of low-grade tumors measured ≤3 cm and were mostly associated with indolent biology with 5-year DSS of 89%. Apart from tumor grade,29,30 other morphological features like the presence of a micropapillary or sarcomatoid component, and perineural and angiolymphatic invasion,23,25 have been shown to affect the prognosis of patients with SDC. Unfortunately, the SEER data do not provide enough histopathology detail to evaluate these characteristics.
Thus, the clinical and histopathological diagnostic criteria for SDC have evolved over the past few decades. The SEER data was collected from several different centers over a long period of time. Therefore, the possibility of bias because of the use of nonuniform diagnostic criteria by different pathologists at different time periods cannot be dismissed. Ameliorating this effect, however, is that 73% of the patients with SDC in SEER were diagnosed after the year 1996. Furthermore, analyses stratified by the decade and tertile of the year of diagnosis also did not reveal any statistically significant difference in survival over time.
CONCLUSION
This study, based on SEER data, provides the most comprehensive estimate of survival and prognostic factors in SDC. Factors such as patient age, tumor size, lymph node status, and tumor grade influence the prognosis of SDC. The role of adjuvant radiotherapy in the treatment of SDC needs to be explored further.
REFERENCES
- 1.Barnes L, Eveson JW, Reichart P, Sidaransky D, editors. Pathology and Genetics of Head and Neck Tumours. IARC Press; Lyon, France: 2005. World Health Organization Classification of Tumours. [Google Scholar]
- 2.Guzzo M, Di Palma S, Grandi C, Molinari R. Salivary duct carcinoma: clinical characteristics and treatment strategies. Head Neck. 1997;19:126–133. doi: 10.1002/(sici)1097-0347(199703)19:2<126::aid-hed7>3.0.co;2-6. [DOI] [PubMed] [Google Scholar]
- 3.Barnes L, Rao U, Krause J, Contis L, Schwartz A, Scalamogna P. Salivary duct carcinoma. Part I. A clinicopathologic evaluation and DNA image analysis of 13 cases with review of the literature. Oral Surg Oral Med Oral Pathol. 1994;78:64–73. doi: 10.1016/0030-4220(94)90119-8. [DOI] [PubMed] [Google Scholar]
- 4.Epivatianos A, Dimitrakopoulos J, Trigonidis G. Intraoral salivary duct carcinoma: a clinicopathological study of four cases and review of the literature. Ann Dent. 1995;54:36–40. [PubMed] [Google Scholar]
- 5.Ferlito A, Gale N, Hvala H. Laryngeal salivary duct carcinoma: a light and electron microscopic study. J Laryngol Otol. 1981;95:731–738. doi: 10.1017/s0022215100091350. [DOI] [PubMed] [Google Scholar]
- 6.Kumar RV, Kini L, Bhargava AK, et al. Salivary duct carcinoma. J Surg Oncol. 1993;54:193–198. doi: 10.1002/jso.2930540315. [DOI] [PubMed] [Google Scholar]
- 7.Theaker JM. Extramammary Paget’s disease of the oral mucosa with in situ carcinoma of minor salivary gland ducts. Am J Surg Pathol. 1988;12:890–895. doi: 10.1097/00000478-198811000-00010. [DOI] [PubMed] [Google Scholar]
- 8.Lewis JE, McKinney BC, Weiland LH, Ferreiro JA, Olsen KD. Salivary duct carcinoma. Clinicopathologic and immunohistochemical review of 26 cases. Cancer. 1996;77:223–230. doi: 10.1002/(SICI)1097-0142(19960115)77:2<223::AID-CNCR1>3.0.CO;2-N. [DOI] [PubMed] [Google Scholar]
- 9.Hosal AS, Fan C, Barnes L, Myers EN. Salivary duct carcinoma. Otolaryngol Head Neck Surg. 2003;129:720–725. doi: 10.1016/S0194-59980301386-X. [DOI] [PubMed] [Google Scholar]
- 10.Jaehne M, Roeser K, Jaekel T, Schepers JD, Albert N, Löoning T. Clinical and immunohistologic typing of salivary duct carcinoma: a report of 50 cases. Cancer. 2005;103:2526–2533. doi: 10.1002/cncr.21116. [DOI] [PubMed] [Google Scholar]
- 11.Delgado R, Vuitch F, Albores Saavedra J. Salivary duct carcinoma. Cancer. 1993;72:1503–1512. doi: 10.1002/1097-0142(19930901)72:5<1503::aid-cncr2820720503>3.0.co;2-k. [DOI] [PubMed] [Google Scholar]
- 12.Kim JY, Lee S, Cho KJ, et al. Treatment results of post-operative radiotherapy in patients with salivary duct carcinoma of the major salivary glands. Br J Radiol. 2012;85:e947–e952. doi: 10.1259/bjr/21574486. [DOI] [PMC free article] [PubMed] [Google Scholar]
- 13.Surveillance, Epidemiology, and End Results (SEER) Program . Research Data (1973–2008) National Cancer Institute, DCCPS, Surveillance Research Program, Cancer Statistics Branch; www.seer.cancer.gov released April 2011, based on the November 2010 submission. [Google Scholar]
- 14.National Cancer Institute Overview of the Surveillance, Epidemiology, and End Results Program. Available at: http://seer.cancer.gov/about/overview.html. Accessed May 1, 2013.
- 15.Edge SB, Byrd DR, Compton CC, Fritz AG, Greene FL, Trotti A, editors. AJCC Cancer Staging Manual. 7th Springer; NewYork, NY: 2010. [Google Scholar]
- 16.Fredholm H, Eaker S, Frisell J, Holmberg L, Fredriksson I, Lindman H. Breast cancer in young women: poor survival despite intensive treatment. PLoS One. 2009;4:e7695. doi: 10.1371/journal.pone.0007695. [DOI] [PMC free article] [PubMed] [Google Scholar]
- 17.Chung M, Chang HR, Bland KI, Wanebo HJ. Younger women with breast carcinoma have a poorer prognosis than older women. Cancer. 1996;77:97–103. doi: 10.1002/(SICI)1097-0142(19960101)77:1<97::AID-CNCR16>3.0.CO;2-3. [DOI] [PubMed] [Google Scholar]
- 18.Swanson GM, Lin CS. Survival patterns among younger women with breast cancer: the effects of age, race, stage, and treatment. J Natl Cancer Inst Monogr. 1994:69–77. [PubMed] [Google Scholar]
- 19.Merrill RM, Bird JS. Effect of young age on prostate cancer survival: a population-based assessment (United States) Cancer Causes Control. 2002;13:435–443. doi: 10.1023/a:1015764507609. [DOI] [PubMed] [Google Scholar]
- 20.Barnes L, Rao U, Contis L, Krause J, Schwartz A, Scalamogna P. Salivary duct carcinoma. Part II. Immunohistochemical evaluation of 13 cases for estrogen and progesterone receptors, cathepsin D, and c-erbB-2 protein. Oral Surg Oral Med Oral Pathol. 1994;78:74–80. doi: 10.1016/0030-4220(94)90120-1. [DOI] [PubMed] [Google Scholar]
- 21.Moriki T, Ueta S, Takahashi T, Mitani M, Ichien M. Salivary duct carcinoma: cytologic characteristics and application of androgen receptor immunostaining for diagnosis. Cancer. 2001;93:344–350. doi: 10.1002/cncr.9050. [DOI] [PubMed] [Google Scholar]
- 22.Martinez–Barba E, Cortes–Guardiola JA, Minguela–Puras A, Torroba–Caron A, Mendez–Trujillo S, Bermejo–Lopez J. Salivary duct carcinoma: clinicopathological and immunohistochemical studies. J Craniomaxillofac Surg. 1997;25:328–334. doi: 10.1016/s1010-5182(97)80035-2. [DOI] [PubMed] [Google Scholar]
- 23.Colmenero Ruiz C, Patróon Romero M, Martín Péerez M. Salivary duct carcinoma: a report of nine cases. J Oral Maxillofac Surg. 1993;51:641–646. doi: 10.1016/s0278-2391(10)80263-0. [DOI] [PubMed] [Google Scholar]
- 24.McGrane F, Shrimali RK, Robertson AG, Paterson C, Correa PD. The importance of adjuvant radiotherapy in treatment of localised salivary duct carcinoma. Clin Oncol. 2011;23:S45–S46. [Google Scholar]
- 25.Luna MA, Batsakis JG, Ordóñez NG, Mackay B, Tortoledo ME. Salivary gland adenocarcinomas: a clinicopathologic analysis of three distinctive types. Semin Diagn Pathol. 1987;4:117–135. [PubMed] [Google Scholar]
- 26.Brandwein MS, Jagirdar J, Patil J, Biller H, Kaneko M. Salivary duct carcinoma (cribriform salivary carcinoma of excretory ducts). A clinicopathologic and immunohistochemical study of 12 cases. Cancer. 1990;65:2307–2314. doi: 10.1002/1097-0142(19900515)65:10<2307::aid-cncr2820651024>3.0.co;2-1. [DOI] [PubMed] [Google Scholar]
- 27.Afzelius LE, Cameron WR, Svensson C. Salivary duct carcinoma–a clinicopathologic study of 12 cases. Head Neck Surg. 1987;9:151–156. doi: 10.1002/hed.2890090304. [DOI] [PubMed] [Google Scholar]
- 28.Hui KK, Batsakis JG, Luna MA, Mackay B, Byers RM. Salivary duct adenocarcinoma: a high grade malignancy. J Laryngol Otol. 1986;100:105–114. doi: 10.1017/s0022215100098807. [DOI] [PubMed] [Google Scholar]
- 29.Delgado R, Klimstra D, Albores–Saavedra J. Low grade salivary duct carcinoma. A distinctive variant with a low grade histology and a predominant intraductal growth pattern. Cancer. 1996;78:958–967. doi: 10.1002/(SICI)1097-0142(19960901)78:5<958::AID-CNCR4>3.0.CO;2-8. [DOI] [PubMed] [Google Scholar]
- 30.Brandwein–Gensler M, Hille J, Wang BY, et al. Low-grade salivary duct carcinoma: description of 16 cases. Am J Surg Pathol. 2004;28:1040–1044. doi: 10.1097/01.pas.0000128662.66321.be. [DOI] [PubMed] [Google Scholar]
- 31.Weinreb I, Tabanda–Lichauco R, Van der Kwast T, Perez–Ordoñez B. Low-grade intraductal carcinoma of salivary gland: report of 3 cases with marked apocrine differentiation. Am J Surg Pathol. 2006;30:1014–1021. doi: 10.1097/00000478-200608000-00013. [DOI] [PubMed] [Google Scholar]