Abstract
Aging not only affects the whole body performance but also alters cellular biological properties, including cell proliferation and differentiation. This study was designed to determine the effect of aging on the mechanical properties of tendon stem cells (TSCs), a newly discovered stem cell type in tendons, using quartz thickness shear mode (TSM) resonators. TSCs were isolated from both old and young rats, and allowed to grow to confluency on the surface of TSM resonators. The admittance spectrums of TSM with TSC monolayer were acquired, and a series of complex shear modulus G′ + jG″ as well as average thickness hTSC were calculated based on a two-layer-loading transmission line model (TLM) for TSM resonator sensor. The results showed an overall increase in G′, G″ and hTSC during aging process. Specifically, the storage modulus G′ of aging TSCs was over ten times than that of young, revealing an important increase in stiffness of aging TSCs. Additionally, through phase-contrast and scanning electronic microscopy, it was shown that aging TSCs were large, flat and heterogeneous in morphologies while young TSCs were uniformly elongated. Increased cell size and irregular cell shape might be associated with the dense cytoskeleton organization, which could lead to an increase in both stiffness and viscosity. These results are in agreement with previously published data using different measurement methods, indicating TSM resonator sensor as a promising tool to measure the mechanical properties of cells.
Keywords: TSM, TSC, Aging, Viscoelasticity
1. Introduction
Tendon is fibrous connective tissue that transmits muscular force to bone thus enabling joint motion and body movement. Tendon had been considered to contain only tenocytes for a long time. However, some recent studies demonstrated that human, rat and mouse tendons also contain multi-potent adult stem cells, termed tendon stem/progenitor cells (TSCs) [1,2]. Compared with tenocytes, TSCs exhibit distinct properties in various aspects, including cell morphology, marker expression, as well as proliferation and differentiation potential [3,4]. It is known that aging leads to a decline in the functional competence of human body and also degenerative changes in tendons [5]. At the cellular level, Zhou et al. reported that aging TSCs have deceased proliferation rate, delayed cell cycle progression and altered cell fate patterns [6]. Presently, most studies concerning TSC aging focus on proliferation and differentiation, while discussions on fundamental mechanical properties, such as elasticity, viscosity and Poisson’s ratio, are quite limited. Changes in viscoelasticity during the aging process of TSCs’ should be investigated as an essential parameter, and the results from such studies could contribute immensely to the aging-related treatment of tendon injury.
So far, a variety of measurement methods have been developed for detection of cellular viscoelasticity, for example, magnetic bead microrheometry (MBM), atomic force microscopy (AFM), microplate manipulation, microfluorimetry and so on [7–12]. Most of them (except microfluorimetry) need to apply an external force on individual cell in an invasive manner. For MBM, the diameter of ferrimagnetic microbead is approximately 1–5 μm, while the normal radius of AFM probe is even under 1 μm. As a result, it is difficult for these methods to present statistical results, although local measurement could be conducted on some specific parts of cells. Meanwhile, measurement process of these methods is also time-consuming. In comparison, micofluorimetry as a non-invasive technique could provide relevant mechanical property measurement of cell group, but only limited to cellular viscosity. Due to its high sensitivity, simple structure, and easy interconnection with electronic measurement systems, quartz thickness-shear-mode (TSM) resonator has been applied to characterize the viscoelastic properties of materials bounded on its surface [13,14]. TSM resonator consists of a thin disk of AT-cut quartz with circular Au/Cr electrodes deposited on both sides, which can be electrically excited in a number of resonant thickness-shear modes. When its surface loading condition varies, for example cell monolayer adhering on the surface, the electrically-excited acoustic-wave propagation could change accordingly through entire quartz crystal, allowing a simple, quantitative and non-invasive method to extract the complex shear modulus of adherent cells. Two general types of equivalent-circuit models are proposed to describe the TSM resonator: the lumped-element model (Butterworth-Van Dyke, BVK) and the distributed model (Transmission Line Model, TLM), and the former could be derived from reduction of the later in near-resonant circumstances [15]. Because of the zero error between its assumption and actual TSM electrical response, TLM is chosen to provide a comprehensive description for TSM with viscoelastic cell monolayer [15,16].
In this study, viscoelastic properties of aging and young TSCs from rats were characterized by TSM resonators. Acquired admittance spectrums of TSM were sent into a programmed analyzer based on two-layer-loading TLM, and corresponding storage modulus G′, loss modulus G″, as well as average thickness hTSC for TSC monolayer were obtained. An overall increase in G′, G″ and hTSC during aging process is attributed to the internal dense cytoskeleton, which also induces apparent variations in cell morphologies accordingly. Our results were in agreement with those from other methods, indicating an advisable mechanical measurement technique for cell-biology applications.
2. Material preparation and experiment details
2.1. Isolation and culture of TSCs
In this study, we isolated TSCs from the Achilles tendons of both old rats (20 month. 300–350 g) and young rats (8 week, 200–250 g). Briefly, the middle portion of tendons was retrieved by cutting the tendon samples 5 mm from the tendon-bone insertion and tendon-muscle junction. After removing the tendon sheath and surrounding paratenon, the middle tendon portion tissues were weighed and minced into small pieces (1 mm × 1 mm × 1 mm). Each 100 mg tissue sample was digested with 3 mg collagenase type I (Life Technologies, Carlsbad, CA, USA) and 4 mg dispase (Stemcell Technologies, Vancouver, BC, Canada) in 1 ml phosphate-buffered saline (PBS, Mediatech Inc., Manassas, VA, USA) at 37 °C for 1 h. The suspensions were centrifuged at 1500 G for 15 min, and the cell pellet was resuspended in growth medium consisting of Dulbecco’s modified Eagle’s medium (DMEM, Lonza, Walkersville, MD, USA) containing 20% fetal bovine serum (FBS, Atlanta Biologicals, Lawrenceville, GA, USA), 100 U/ml penicillin, 100 μg/ml streptomycin, and 2 μM glutamine (Thermo Fisher Scientific Inc., Waltham, MA, USA). A single-cell suspension was obtained by diluting the suspension to 1 cell/μl and then cultured in T25 flasks at 37°C with 5% CO2. After 8–10 days in culture, colonies formed as the Achilles TSCs were visible on the surface of culture flask. Individual cell colonies were collected using trypsin (Life Technologies, Carlsbad, CA, USA) and transferred to separate T25 flasks for further culture.
2.2. Measurement and characterization of TSCs
Fig. 1 schematically shows the measurement system of 10-MHz TSM resonator (International Crystal Manufacturing, Oklahoma City, OK, USA) for TSCs. The diameter of TSM central circle electrode was 5.10 mm. One tube (6.20 mm/8.00 mm × 6 mm) of poly(dimethylsiloxane) (PDMS, Dow Corning, Midland, MI, USA) was located around the upper electrode, forming the well-like structure for TSC culture. The admittance spectrum of TSM was obtained using an Agilent 4294A Precision Impedance Analyzer (Agilent Technologies, Palo Alto, CA, USA). Prior to the measurements, TSM resonators with empty wells were sterilized overnight by exposure to UV light. Subsequently, the entire electrode surface of TSM was coated with collagen by incubating the well with 100 μl 100 μg/ml collagen type I (Stemcell Technologies, Vancouver, BC, Canada) in PBS for 2 h. After washing these wells three times in PBS, they were refilled with 100 μl 1.0 × 10⁵ cell/ml TSC suspensions from old and young rat Achilles tendons. TSM resonators were maintained in an incubator at 37 °C with 5% CO2 for 12.5 h, and corresponding admittances were detected every 1 min. In addition, the initial admittances of unloaded TSM resonators as well as TSM with culture medium and collagen coating were also recorded for further extraction of TSC viscoelastic properties. All measurements were performed three times. After measurements, TSM resonators were removed from the measurement system. TSCs on electrodes were then fixed with 4% paraformaldehyde in PBS and treated with 0.1% Triton X-100 for 10 min before staining the nuclei with Hoechst 33342 (10 μg/ml). Washed three times in PBS, these stained TSCs were examined by fluorescent microscopy (Eclipse TE2000-U, Nikon, Japan).
Fig. 1.
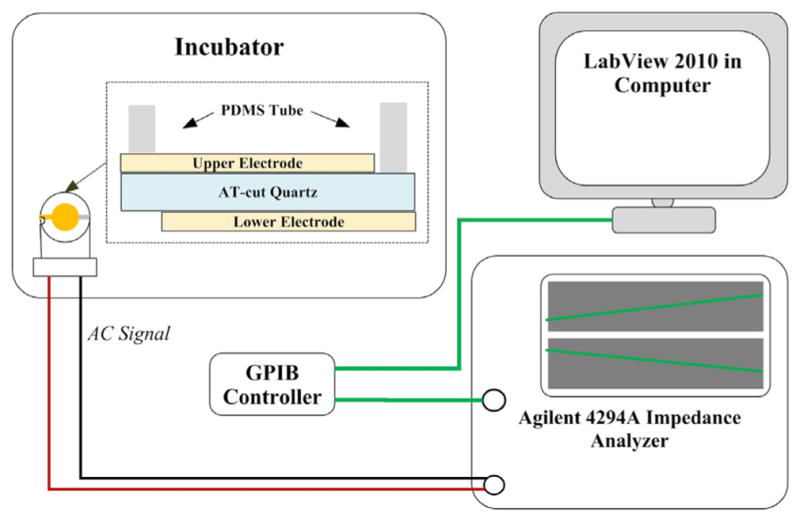
Schematic diagram of TSM measurement system.
In parallel experiments, identical dose of TSC suspensions were cultured in collagen-coated 96-well culture plate and PDMS wells on Au/Si wafer. After 12 h, the morphologies of TSCs were observed through phase-contrast microscopy (Eclipse TS100, Nikon, Japan) and scanning electron microscopy (XL-30 FEG SEM, FEI/Philips, Japan, accelerating voltage: 5 kV), respectively. Then, TSCs in 96-well plate were also fixed with 4% paraformaldehyde in PBS and treated with 0.1% Triton X-100 for 10 min. Fluorescein phalloidin in methanol was applied at a dilution ratio of 1:40 for 20 min for actin staining, and these stained TSCs were examined by fluorescent microscopy as well after washing.
3. Theoretical model and analytical methods
3.1. TLM model of multilayer loaded TSM
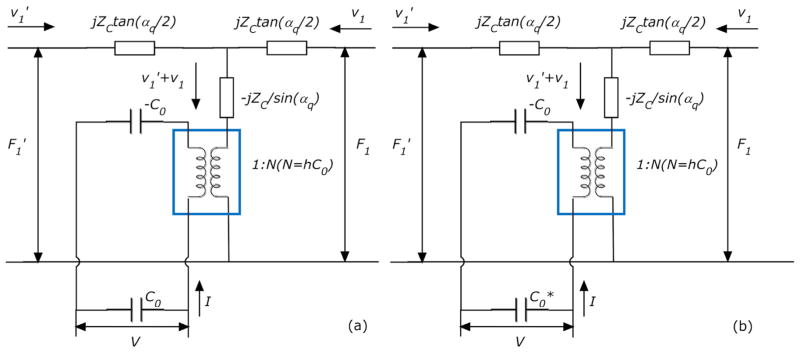
As shown in Fig. 2(a), TLM for TSM resonators has two acoustic ports and one electrical port, and via a transformer (marked by a square) the acoustic variables, force F and linear velocity ν, are coupled to an electrical port [17]. The acoustic-electrical analogy of TLM could be defined as that,
Fig. 2.
TLM of TSM resonator.
| (1) |
where F1, F1′ and ν1, ν1′ are the external force and linear velocity at TSM resonator surfaces, respectively; and ZC, αq, h and C0 are defined as follows, with relevant parameters shown in Table 1.
Table 1.
Parameters of TSM resonator [18].
| Density of quartz | ρq | 2.651 × 10³ kg m−3 | |
|---|---|---|---|
| Shear stiffness of quartz |
|
2.970 × 10¹⁰ N m−2 + jωηq | |
| Piezoelectric constant of quartz | eq = e26 | 9.657 × 10⁻² A s m−2 | |
| Dielectric permittivity of quartz | εq = ε22 | 3.982 × 10⁻¹¹ A2 s4 kg−1 m−3 | |
| Surface area of TSM resonator | A | 2.047 × 10⁻⁵ m2 | |
| Thickness of TSM resonator | hq (theoretical) | 165 μm |
| (2) |
Letting Z1 = F1/ν1, Z1′ = F1′/ν1′ to represent the surface loading condition of TSM resonator, (1) is rewritten as,
| (3) |
where
| (4) |
Defining complex electrical impedance Z = V/I, complex electrical admittance Y = I/V, then Z and Y are expressed as,
| (5) |
where
| (6) |
Generally, for unloaded TSM, both surfaces are stress free with two short-circuit acoustic terminations of F1 = Z1 = F1′ = Z1′ = 0. Substituting the Z1 and Z1′ into (5) Y expression,
| (7) |
However, with extra layers (upper/lower electrodes, TSC monolayer and culture medium) on TSM surfaces, Z1 and Z1′ are changed accordingly depending on these layers’ own physical and mechanical properties. For Au/Cr electrodes on both sides are relatively thin (~100 nm), their effects on surface loading Z1 and Z1′ values are neglected, simplifying the original theoretical model effectively. Thus, Z1 is determined only by the properties of loading layers on upper electrode, and Z1′ is always zero. Using boundary conditions (internal force and linear velocity) between different layers, TLM model could be represented further as Fig. 3(a), and the corresponding transfer matrix is given as that [17],
Fig. 3.

TLM of multilayer loaded TSM resonator.
| (8) |
where have similar definitions with Zq, αq,
| (9) |
Defining Zn = Fn/νn, Zn+1 = Fn+1/νn+1, then
| (10) |
Substituting Z1 and Z1′ into (5) Y expression,
| (11) |
Nevertheless, considering the excluded electrode effect of TSM, other non-uniformity influences as well as surrounding perturbations, modified TLM model is proposed as shown in Fig. 2(b). Taking these uncertainties into account, the total parallel capacitance is defined as that [19],
| (12) |
where C0 is TSM static capacitance, and Cp is the external capacitance. With as a desirable way of compensation for previous model, (5) and (11) are respectively rewritten into (12) and (13). This model establishes an explicit relationship between experimental observations (TSM electrical response) and relevant device parameters, which is of great significance in the following algorithm analysis.
| (13) |
| (14) |
3.2. Multilayer loading model of TSC adhesion
In this study, the actual multilayer-loading model for TSM resonator with TSC adhesion is consisting of three mechanical impedance layers: the collagen coating, the TSC monolayer and semi-infinite viscous liquid layer (culture medium). Because the collagen coating is quite thin (under 20 nm), this model could be simplified while considering the collagen coating as an intrinsic effect included into TSM resonator itself. By acquiring an optimal solution set of effective parameters of TSM resonator (ηq, hq, C0 and Cp) from initial admittance, effect of collagen coating is compensated as well as other perturbations. An equivalent two-layer-loading model is adopt in this study as described in Fig. 3(b). Assuming TSC monolayer as isotropic, homogeneous and uniform coating on Quartz, and could be calculated as follows,
| (15) |
where GTSC is the shear modulus of TSC monolayer. Meanwhile, as the culture medium is semi-infinite,
| (16) |
where ηMed is the viscosity of culture medium. Thus, Z1 in (14) could be expressed as follows,
| (17) |
With only culture medium on electrode surface, the TSM resonator is contacting directly with semi-infinite viscous fluid, and the corresponding expression of Z1 is as follows,
| (18) |
3.3. Extraction of TSM-related parameters
As discussed above, for an appropriate analysis of TSM admittance, parameter calibration of unloaded TSM plays an important role in compensating additional effects from Au/Cr electrodes, collagen coating and other perturbations. In this section, the optimal solution set of effective parameters of TSM (ηq, hq, C0 and Cp) is determined, where those effects are considered as some intrinsic characteristics of TSM resonator. Two input variables are required in the algorithm of parameter extraction: (a) The admittance spectrum Y(ωi) = G(ωi) + jB(ωi) of unloaded TSM (or TSM with collagen coating, which is considered as a special unloaded case as discussed), where i is assigned with from 1 to n, and n is the number of acquired angular frequency points. For Agilent 4294A in this study, n = 801; (b) The total parallel capacitance which is measured at double fundamental-resonance frequency based on the limiting relationship [20]. By Regula-Falsi iteration method, a series of valid solution sets (ηq, hq and C0) are obtained, and optimal solution is chosen among them as the one that makes the error function achieve the smallest value [21]. Error function is defined as (19), representing the cumulative error of experimental admittance spectrum deviating from the theoretical one,
| (19) |
where G(ωi)TLM, B(ωi)TLM are developed from (14), and G(ωi)EXP, B(ωi)EXP are from experimental admittance. Table 2 lists extracted effective parameters (hq, μq, C0 and Cp) for unloaded TSM and TSM with collagen coating. Both fitting are well-acceptable with the error of 0.0372% and 0.0280%, leading to affirmative calibrated parameters of TSM resonator. As is discussed, there are a variety of neglected perturbations on TSM surface, including the Au/Cr electrodes, PDMS wells and other damping effects. Thus, it can be seen from Table 2 that effective TSM thickness is slightly larger than theoretical value 165 μm, and quartz viscosity is also increased compared with reference value 0.00035 Pa s [19]. In the meantime, it is illustrated that collagen absorption does not cause distinct changes in calibrated TSM parameters, when only external capacitance Cp increasing to some extent. Simplified bilayer-loading model for TSC adhesion is confirmed further from this perspective, and all these parameters given in Table 2 will be used in following fitting calculation.
Table 2.
Calibrated parameters of TSM resonator.
| Effective parameters | Unloaded TSM | TSM with collagen coating |
|---|---|---|
| Thickness of TSM hq | 166.39 μm | 166.39 μm |
| Viscosity of quartz μq | 0.0416 Pa s | 0.0402 Pa s |
| Static capacity of TSM C0 | 4.5884 pF | 4.5940 pF |
| External capacity of TSM Cp | 6.8496 pF | 7.4308 pF |
3.4. Extraction of TSC complex shear modulus
Prior to the extraction of TSC complex shear modulus, complex impedance of culture medium should be acquired firstly. Certain input variables are needed in algorithm of ZMed: (a) The admittance spectrum Y(ωi) = G(ωi) + jB(ωi) of TSM with culture medium; (b) Relevant effective TSM parameters extracted in previous section, including equivalent thickness hq, quartz viscosity μq, static capacitance C0, and total parallel capacitance . Conducting the Regula-Falsi iteration method and error comparison as above, optimal solution is obtained,
| (20) |
With (a) the modified effective parameters for TSM with collagen coating and (b) the complex impedance of culture medium, as well as (c) the admittance spectrum Y(ωi) = G(ωi) + jB(ωi) for TSM with TSC adhesion, the specific solution of complex shear modulus GTSC = G′ + jG″ and average thickness hTSC of TSC monolayer could be determined based on similar algorithm. The G″ discretization within an appropriate range is operated firstly, and corresponding G′ is obtained by Regula-Falsi iteration method. Among all these valid solution sets (G′, G″ and hTSC) recorded during this process, an optimal solution is selected as the one could make the error function defined as (19) get the smallest value.
4. Results and discussions
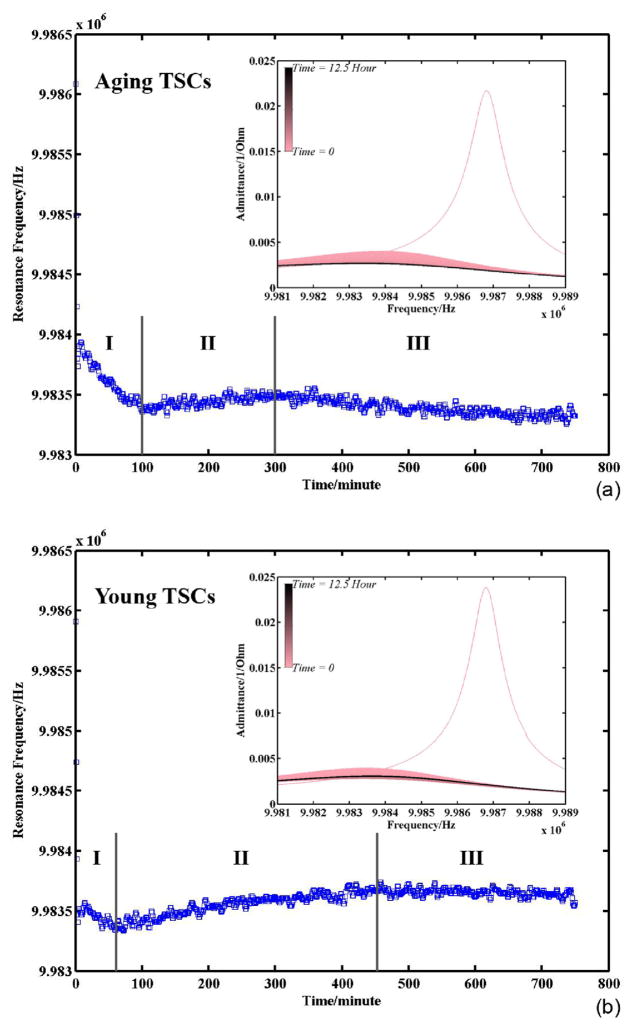
Fig. 4 presents the variation of TSM resonance frequency during TSC adhesion: (a) is for TSCs from old rats and (b) is for TSCs from young rats. The insets are their corresponding admittance spectrum sets, where the resonance frequencies are collected. The spectrum recording endured for 12.5 h. As the time goes on, the color of admittance spectrums in plots is shifting from pink to black gradually. It is illustrated that with the adhesion of both aging and young TSCs, the intensity of resonance peaks is decreasing gradually, and the FWHM (Full Width at Half Maximum) tends to be larger. The resonance frequencies extracted from these resonance peaks exhibit similar variation tendency for both aging and young TSCs as well. As it is marked, the entire frequency variation during TSC adhesion experiences three regions: I rapid decrease, II reverse increase, and III slow decrease to be stable. The main differences between (a) and (b) are merely expressed in the time distributed in three regions, as well as magnitude of frequency variation. Generally speaking, the procedure of cell adhesion has three stages: attachment, spreading, and formation of focal adhesions and stress fibers [22]. The stage of cell attachment, which involves cell receptor-substrate ligand interactions, is considered as an intermediate state between weak contact and strong adhesion. The attached cells increase their surface contact area with the substrate through the formation of actin microfilaments and cell spreading, and then organize their cytoskeleton by the formation of focal adhesions and actin-containing stress fibers. In our experiments, Au/Cr electrode surface is pre-coated with collagen, which is considered a primary and structural part of extracellular matrix (ECM) in tendons [23]. When suspending cells are approaching to the substrate, these ECM proteins are bound by integrin receptors composed of α/β chains, which span the plasma membrane [24,25]. Receptor-ligand binding induces initial attachment, and then TSCs undergo the following two stages successively. As it is shown in Fig. 4, in the beginning there is an obvious decease in TSM resonance frequency with a great number of TSCs falling down and attaching on electrodes. With more and more TSCs finishing attachment, TSC spreading becomes the predominant behavior, resulting in a reverse increase of TSM resonance frequency in region II. In region III, quite a large part of TSCs is in the third stage to form the focal adhesions, which function as structural links between the cytoskeleton and ECM protein substrate. Therefore, resonance frequency of TSM resonators is decreased slightly. With decreasing tendency in region III is eliminating and the variation curve is stable, all TSCs in medium are considered adhered on electrodes completely. In this case, the admittance spectrum acquired after 11 h could be adopted for TSC monolayer characterization.
Fig. 4.
Resonance frequency of TSM resonator with TSC adhesion (insets are corresponding admittance spectrum sets).
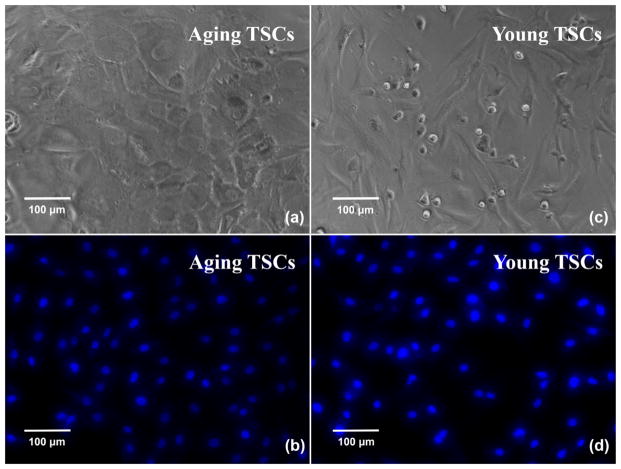
Fig. 5 shows TSC microscopy photos after cell suspension is kept in wells for 12 h: (a) and (b) are for TSCs from old rats, and (c) and (d) are for TSCs from young rats. (a) and (c) are obtained by phase-contrast microscopy, where cell suspension is added into 96-well plate. Both aging and young TSCs adhere and form relatively-uniform cell monolayer as assumed in the theoretical model. There is no obvious overlap or blank space on the substrate, leading to an appropriate assumption in the following calculation. Meanwhile, the TSCs on the electrodes of TSM resonators are nuclei stained and observed through fluorescent microscopy (Fig. 5(b) and (d)). As that in 96-well plate, TSCs seeded into PDMS wells exhibit the similar consistency and uniformity, indicating TSC monolayer an isotropic, homogeneous layer further. Nevertheless, it is also illustrated quite different morphologies between aging and young TSCs. As shown in (a) and (c), compared to young TSCs with characteristic elongated shape as fibroblasts, aging TSCs possess enlarged, flat, polygonal cell shape, extending without any specific directions. There are obvious changes in TSC morphologies during aging process, which will be discussed in details in following paragraphs.
Fig. 5.
Phase-contrast and fluorescence (nuclei staining) photos of TSCs.
Based on the TSM multilayer loading model introduced previously, the corresponding programmed analyzer was built up for extraction of TSC viscoelastic properties. Assuming TSC monolayer as an isotropic, homogeneous loading layer, its equivalent density is required in this algorithm. As it is known, a typical animal eukaryotic cell consists of five major structural parts, from outside to inside: an extracellular matrix (ECM), an external plasma membrane, the cytosol interlaced by a cytoskeleton, a variety of membranebounded organelles suspended in cytosol, and a nucleus to house the DNA [23]. Among them, cytoskeleton as an intricate 3-demensional array of microfilaments, microtubules and intermediate filaments, helps establish and maintain cell shape. With its support for cellular architecture, the lipid plasma membrane surrounding defines the cell’s boundary accordingly. As the formation of focal adhesions, the cytoskeleton is anchored with collagen on the substrate. As a result, the ECM, cytoskeleton, as well as the lipid membranes make up to be the most crucial factor of cell viscoelasticity together. In addition, the gel-like plasma (including cytoplasmic proteins and organelles) around the cytoskeleton, also has an influence on cell viscoelasticity. In this algorithm, three equivalent densities of TSC monolayer are adopted: 1.20 g/cm3, 1.10 g/cm3 and 1.00 g/cm3. For the primary component of ECM and cytoskeleton is a variety of protein fibers, such as collagen, actin and fibrin, a theoretical protein density of 1.20 g/cm3 is chosen as the upper limit [26]. Meanwhile, assuming the plasma as special protein solution, the density of pure water, 1.00 g/cm3, is accepted as the lower limit.
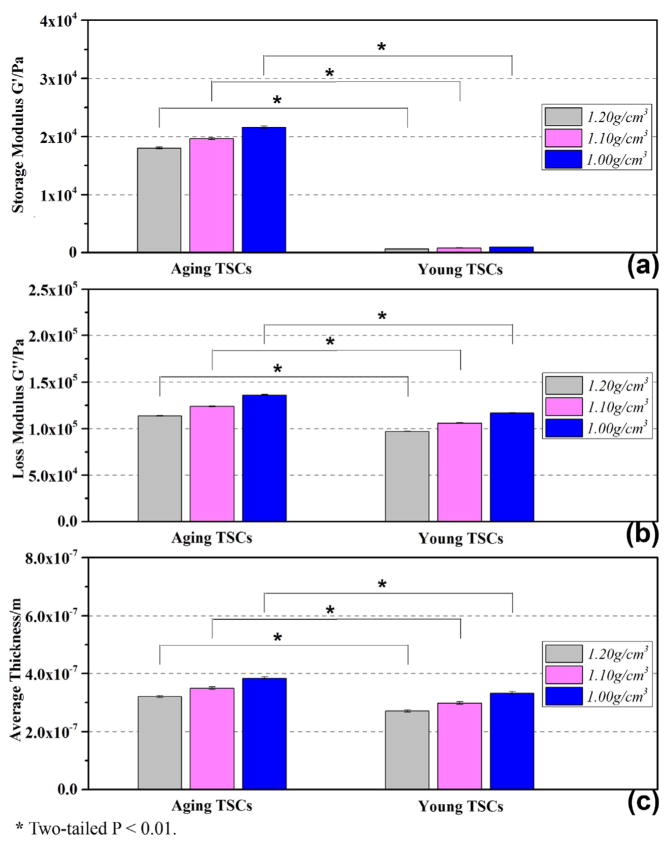
Sending the admittance spectrum acquired from 11.5 to 12.5 h to the analyzer, a series of complex shear modulus of TSC monolayer G′, G″ as well as average thickness hTSC were obtained. Fig. 6 gives the statistical results of G′, G″ and hTSC for aging and young TSCs, and the fitting-error analysis in extraction procedure is shown in Fig. 7. Fig. 7(a) and (b) are representative comparison between experimental and fitting curves of Y = G + jB, where Y is the admittance spectrum collected after 12 h. The error upper limit is set as 1% in algorithm. Much smaller than this setting point, the fitting-error results for both aging and young TSC monolayer are stabilized under 0.1%, indicating certainty and reliability of extracted G′ and G″ in Fig. 6. G′, G″ and hTSC from different equivalent densities of TSC monolayer are marked in Fig. 6, respectively. It is illustrated that G′ and G″ present similar increasing tendency as equivalent density is decreasing, and the corresponding thickness is also rising as a result of near-constant mass load. Shear modulus G′ and loss modulus G″ of aging TSCs increase from 18030 ± 171 Pa to 21608 ± 205 Pa and from 113654 ± 348 Pa to 136209 ± 422 Pa, respectively, with the adopted density decreasing from 1.20 g/cm3 to 1.00 g/cm3. In the meantime, the average thickness of TSCs s rising gradually from 320.56 ± 3.42 nm to 384.23 ± 4.13 nm. Comparing the viscoelastic properties of aging and young TSCs, the aging TSCs possess both larger storage modulus and loss modulus, as well as average thickness. The storage modulus of aging TSCs is over ten times than that of young, revealing an obvious increasing in stiffness of TSCs from young to aging. In the case of 1.10 g/cm3, storage modulus G′ of aging and young TSCs are 19658 ± 187 Pa and 824 ± 13 Pa, respectively. In comparison, the loss modulus exhibits a relatively-slight increasing: with 1.10 g/cm3 as preset density, G″ for aging and young TSCs are 123910 ± 383 Pa and 105915 ± 363 Pa, respectively. Besides, the corresponding thickness hTSC of aging TSC monolayer is 349.47 ± 3.78 nm, which is approximately 15% larger than that of young (298.32 ± 4.39 nm). These differences between aging and young TSCs have an important relation with their architecture. In order to get more details concerning cellular architecture, including cytoskeleton organization and adhesion thickness, TSCs were detected by both SEM and fluorescent microscopy.
Fig. 6.
Complex shear modulus and average thickness of TSCs.
Fig. 7.
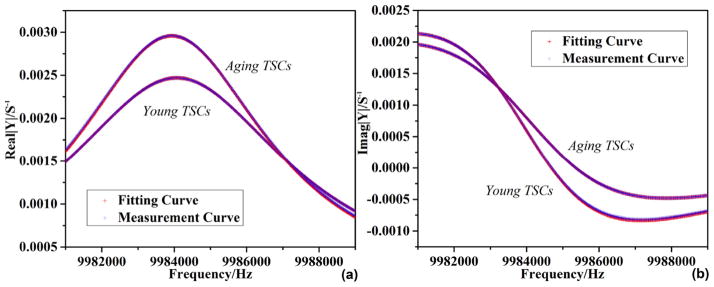
Admittance spectrum fitting of TSM resonator with TSC adhesion.
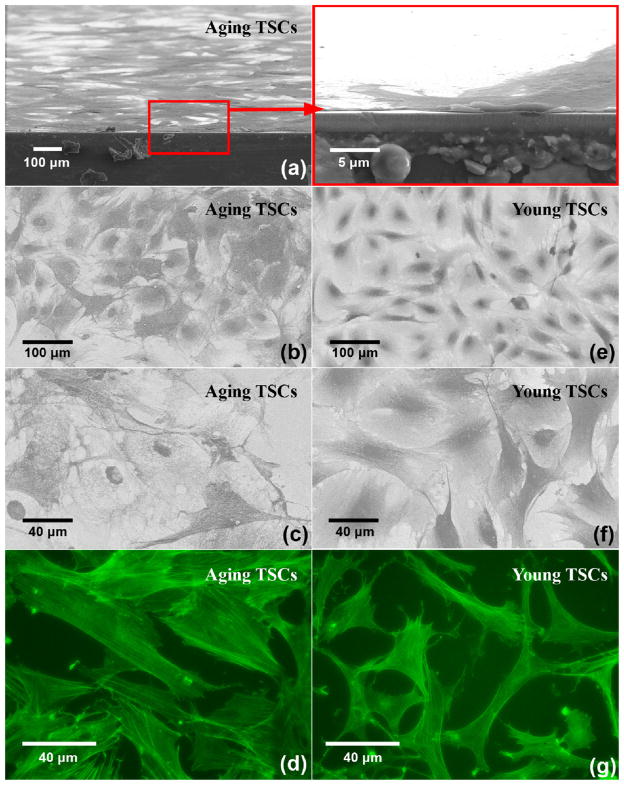
Fig. 8 are SEM ((a)–(c), (e)–(f)) and fluorescence ((d) and (g)) photos: (a) is the cross-section observation of aging TSCs; (b) and (c) present the adhesion pattern of aging TSCs when (e) and (f) of young TSCs; and (d) and (g) describe the internal actin cytoskeleton of aging TSCs and young. It could be seen that TSC monolayers are uniform and compact across the entire surface as in Fig. 6, without any obvious overlap or uncovered space. The relatively-low roughness is in good agreement with our presupposition, guaranteeing an affirmative fitting in TLM analysis. Fig. 8(b), (c), (e) and (f) reveals morphology details of adherent TSCs on electrodes. For aging TSCs, cell spreading is extending from spherical membrane in random directions, forming an irregular polygonal circumference. Comparing with this large, flat cell shape, young TSCs tend to spread along a specific direction to form an elongated, slender shape. The lamel-lipodium and filopodium are often observed along the edge of two polar of young TSCs, while no similar phenomenon is found in aging ones. As it is known, with TSCs spreading, actin microfilaments are formed extensively in cells, and then actin-containing stress fibers are organized and linked with ECM, establishing and supporting cell shape. The actin cytoskeletons in both aging and young TSCs, which largely determine cell morphologies, are shown in Fig. 8(d) and (g). It is illustrated that numerous actin microfilaments are occupying most of the cytoplasmic area in both aging and young TSCs. However, compared with discrete, flocculent ones in young TSCs, actin microfilaments in aging TSCs tend to form long, filamentous bundles: some are closely parallel along one certain direction, as another set of parallel bundles cross them in different direction. There is a considerable increase in the number and individual size of actin microfilaments during aging of TSCs, when similar conclusions have been drawn on other general fibroblasts. Wang et al. reported increased organization of cytoskeleton in aging human dermal fibroblasts, which was considered as a result of an increasing in the abundance of cytoplasmic filaments [27]. Hereafter, Nishio et al. suggested further that overproducing of vimentin filaments in skin fibroblast cytoskeleton resulted in senescent cell morphologies [28,29]. Schulze et al. proposed in vivo aging process, the cytoskeletal polymers showed a shift from monomeric G-actin to polymerized, filamentous F-actin, but no significant changes in vimentin and microtubule content [30]. Fluorescence analysis provides an explanation that aging TSCs possess a dense cytoskeletal organization compared to young TSCs, which causes the former increased cell size and irregular cell shape. For aging TSCs, the dense cytoskeleton could be attributed to overproducing of actin microfilaments and some other specific protein, aggregation or mutation. Considering cytoskeleton as structural and supportive component, its inherent variations not only lead to an apparent increasing in average thickness of TSC monolayer, but also induce both stiffness and viscosity to increase during aging process.
Fig. 8.
SEM and fluorescence (actin staining) photos of TSCs.
In the meantime, from Fig. 8(a) the average thickness hTSC of aging TSC monolayer is obtained as approximately 400 nm, exhibiting great consistence with theoretical model (hTSC = 384.23 ± 4.13 nm with density of 1.00 g/cm3). Thus, SEM photos confirm reliability of our extracted results further. In the case of 1.00 g/cm3, the viscoelasticity of aging and young TSCs are 21608 + 136209j and 985 + 116582j Pa respectively. Using η = G″/ω, δ = (2η/ωρ)1/2, effective viscosity of them are obtained as 2.17 and 1.86 cp, and shear wave decay length are 263 nm and 244 nm. hTSC is approximately 1.5 times of decay length δ, theoretically indicating a critically damped shear wave propagating through TSC monolayer. Thus ignoring the small effect of upper liquid layer, single TSC-monolayer loading model could be applied, and corresponding viscoelasticity of aging and young TSCs were calculated respectively as 20151 + 114772j and 853 + 100570j Pa, which are slightly decreased comparing with previous G′, G″. Although the viscoelasticity variation of TSCs during aging process in this model presents highly consistent tendency with results from two-layer-loading model, standard deviation of G′, G″ as well as fitting errors are increased accordingly. Furthermore, if considering TSC monolayer as semi-infinite viscous layer, no convergent solutions could be obtained under an appropriate error range (1%). From this perspective, as the estimated decay length and average thickness of TSC monolayer are close, the two-layer-loading model should be adopted in order to reduce system error included in theoretical model effectively.
Comparing with cell viscoelasticity by other techniques, including MBM, AFM, microplate manipulation and microfluorimetry shown in Table 3, our result could reach agreement by different extent, even though various cell types, and local measurement on individual cell conducted in most methods. According to viscoelasticity theory, complex shear modulus GTSC = G′ + G″ is dependent on oscillation frequency ω. Their relation is described in power-law structural damping model functionally as that,
Table 3.
Comparison of fibroblast viscoelasticity by different measurement methods.
| Method | Cell type | G′ (Pa) | Viscosity (cp) | Measuring frequency (Hz) | Local measurement | External force | Reference |
|---|---|---|---|---|---|---|---|
| MBM | NIH 3T3 | 2 × 10³–4 × 10³ | 2 × 10³ | – | Yes | Yes | [35] |
| AFM | 3T3 | 200–715 | 100–500 | 50–300 | Yes | Yes | [32,33] |
| Microplate manipulation | Chick fibroblast | 600–1000 | 1 × 10⁷ | – | Yes | Yes | [34] |
| Microfluorimetry | Swiss 3T3 | – | 1.1 ± 0.2 | 5–200M | No | No | [36] |
| (21) |
where G0 is a modulus scale factor, f0 is a frequency scale factor, α is the power-law exponent usually assigned in 0.10–0.16, λ is structural damping coefficient related to α by λ = tan(πα/2), and μ is Newtonian viscous damping coefficient [8,31]. With α of small values, the factor Γ(1 − α) cos(πα/2) is close to unity and so (21) could be simplified as,
| (22) |
Thus, as G0 = constant, G′ ∞ fα. When α is assigned with 0.12, storage modulus G′ of aging and young TSCs at 160 Hz is calculated as 5744 and 262 Pa, respectively. When α = 0.14, G′ turn out to be 4606 and 210 Pa. The shear modulus G′ of young TSCs transformed at low frequency is of the same order magnitude with results for 3T3s by AFM and chick fibroblasts by microplate method [32–34], and G′ of aging TSCs transformed at low frequency keep consistent order with that of 3T3 fibroblasts from analysis of magnetic bead microrheometry as well [35]. From this perspective, it is indicated that storage modulus G′ of TSC monolayer could reflect shear stiffness of individual cell to some extent. Meanwhile, due to quite similar measurement conditions (non-invasive, group test, at high frequencies), our viscosity results reach good agreement with that from microfluorimetry [36]. In comparison, η of fibroblasts by other techniques at low frequencies appear to be several orders of magnitude larger [32–35]. This frequency-dependent variation matches power-law structural damping model partially while G″ ∞ fα−1 as G0 = constant and viscous damping coefficient μ is ignored. In fact, there are obvious differences in η among these low-frequency, local measurement methods, suggesting significant effect of measurement environment on loss modulus G″ at low frequencies. With frequency-dependent relation is eliminated at high frequencies and μ becomes the dominant factor, the TSM measurement could obtain non-mutative, stable loss modulus as microfluorimetry. Therefore, G′ and G″ as statistical stiffness and viscosity of TSC monolayer, could exhibit characteristic viscoelasticity of individual TSC in a group, and at the same time avoid too much fluctuations from individual differences. In addition, because of the stable, average, statistical features of TSM measurements, the differences of viscoelasticity between aging and young TSCs could also be amplified appropriately compared with that expressed by other techniques, implying a potential of TSM technique for mechanical-property mark. Through high-frequency TSM measurement, the reliable and repeatable complex shear modules of cell monolayers with various cytoskeleton organization are provided in an economic, simple, invasive manner. Meanwhile, the average thickness of cell monolayer, as reflection of cell size, could be obtained with viscoelastic properties, which could not be realized in other techniques. According to variations in shear modulus of cell monolayer, as well as average thickness, internal architecture of cell could be deduced and corresponding status in a variety of procedures (contractility, proliferation, differentiation, etc.) be acquired.
5. Conclusion
In this study, quartz TSM resonator is adopted to extract the complex shear modulus of adherent TSC monolayer owing to its high sensitivity, repeatability and easy connection with electrical measurement systems. 100 μl 1.0 × 10⁵ cell/ml TSC suspensions from old and young rats were added respectively, and corresponding admittances were detected every 1 min. Sending admittance spectrums acquired from 11.5 to 12.5 h to an analyzer, which is established based on a two-layer-loading TLM, a series of complex shear modulus of TSC monolayer G′, G″ and average thickness hTSC were obtained. The results showed an overall increase in storage modulus, loss modulus, as well as average thickness during aging process. The storage modulus of aging TSCs was over ten times than that of young, revealing an important rise in stiffness of TSCs. Meanwhile, both phase-contrast and SEM photos presented enlarged, flat and heterogeneous cell shape for aging TSCs when young TSCs possessed general elongated, slender shape. Increased cell size and irregular cell shape is attributed to the dense cytoskeleton organization, which induces both stiffness and viscosity to increase. Our results concerning TSC monolayer are consistent with those obtained through other techniques, including MBM and AFM. These results identify an economic, non-invasive, promising method to measure the viscoelastic properties of TSCs, which could contribute to aging-related treatment of tendon injury. Furthermore, viscoelasticity changes reflect internal cytoskeleton variations that are also involved extensively in a series of cell activities, such as contractility, proliferation, and differentiation. The reliable and repeatable complex shear modulus is provided by TSM resonators, indicating its potential as a useful biophysical marker for defining aging TSCs.
Acknowledgments
This work is supported in part by AR060920 and AR061395 (JHW).
Biographies

Huiyan Wu was born in Yangzhou, Jiangsu, China, in 1986. She received B.S. and M.S in Material Science & Engineering from Xi’an Jiaotong University, Xi’an, China. She is currently a PhD student in Department of Mechanical Engineering and Materials Science at University of Pittsburgh. Her research interests include nano-materials, film materials, biomaterials, and corresponding BAW sensor, SAW sensor, biosensor applications.

Guangyi Zhao received B.S. in Biological Science from East China University of Science and Technology in 2011. He is currently a PhD student in Department of Bioengineering, University of Pittsburgh. His research field is tendon regeneration, chronic tendon disease etiology and treatment with Platelet-Rich-Plasma.
Hongfei Zu was born in Linyi, Shandong, China, in 1986. He received B.S. in Department of Microelectronics from Xi’an Jiaotong University, Xi’an, China, in 2009 and M.S. in Department of Electronics Science and Technology from Xi’an Jiaotong University, Xi’an, China, in 2012. He is currently a PhD student in the Department of Mechanical Engineering and Materials Science at University of Pittsburgh. His research interests include high temperature sensor and surface acoustic wave (SAW) and bulk acoustic wave (BAW) sensor applications.

James H.-C. Wang is a Professor and Director of the MechanoBiology Laboratory within the Department of Orthopaedic Surgery at the University of Pittsburgh. He is also a Professor in the Departments of Physical Medicine and Rehabilitation, Bioengineering, and Mechanical Engineering & Materials Science. Further, Dr. Wang holds the position of Adjunct Professor in the Harbin Medical University and the Third Military Medical University at China.
Dr. Wang received his BS degree in Solid Mechanics and his MS degree in Experimental Biomechanics from Tongji University in Shanghai, China; and his PhD in Bioengineering from the University of Cincinnati in 1996. After graduation, he did postdoctoral fellowships at Texas University Health Science Center in El Paso, Johns Hopkins Medical School, and Washington University in St. Louis. Dr. Wang became a faculty in the Musculoskeletal Research Center, Department of Orthopaedic Surgery, School of Medicine, University of Pittsburgh in 1998.
Dr. Wang’s primary research interests are in the following areas: 1) Understanding the cellular and molecular mechanisms of tendinopathy; 2) Role of tendon/ligament stem cells in tendon/ligament mechanobiology; 3) Functional tissue engineering of tendon/ligament injuries using PRP, stem cells, and tissue specific engineered matrix; 4) Application of cell transduction force microscopy (CTFM) to biological research.
Dr. Wang has authored over 100 scientific papers and 185 abstracts. He has also served on study sections at the NIH, NSF, and many other funding agencies, and is an academic editor, editorial board member, and reviewer for many scientific journals, including PloS ONE and the Journal of Biomechanics.
Dr. Wang served as the President of the Society of Physical Regulation in Biology and Medicine (SPRBM) in 2008 and is the current President-Elect of the International Chinese Musculoskeletal Research Society (ICMRS).

Qing-Ming Wang is a Professor and Director of Mechanical Engineering Graduate Program in the Department of Mechanical Engineering and Materials Science, University of Pittsburgh, Pennsylvania. He received the B.S. and M.S. degrees in Materials Science and Engineering from Tsinghua University, Beijing, China, in 1987 and 1989, respectively, and the Ph.D. degree in Materials from the Pennsylvania State University in 1998.
Dr. Wang’s primary research interests are in microelectromechanical systems (MEMS) and microfabrication; thin film bulk acoustic wave resonators (FBAR) and acoustic wave sensors; functional nanomaterials and devices; and piezoelectric and electrostrictive thin films and composites for transducer, actuator, and sensor applications.
He is a member of IEEE, IEEE-UFFC, ASME, and the American Society of Engineering Education.
References
- 1.Lui PPY, Chan KM. Tendon-derived stem cells (TDSCs): from basic science to potential roles in tendon pathology and tissue engineering applications. Stem Cell Reviews and Reports. 2011;7:15. doi: 10.1007/s12015-011-9276-0. [DOI] [PubMed] [Google Scholar]
- 2.Lui PPY. Identity of tendon stem cells – how much do we know? Journal of Cellular and Molecular Medicine. 2013;17(1):10. doi: 10.1111/jcmm.12007. [DOI] [PMC free article] [PubMed] [Google Scholar]
- 3.Zhang J, Wang JHC. Characterization of differential properties of rabbit tendon stem cells and tenocytes. BMC Musculosskeletal Disorder. 2010;11:11. doi: 10.1186/1471-2474-11-10. [DOI] [PMC free article] [PubMed] [Google Scholar]
- 4.Zhang J, et al. Differential properties of human ACL and MCL stem cells may be responsible for their differential healing capacity. BMC Musculosskeletal Disorder. 2011;9:14. doi: 10.1186/1741-7015-9-68. [DOI] [PMC free article] [PubMed] [Google Scholar]
- 5.Tuite DJ, Renstrom PAFH, O’Brien M. The aging tendon. Scandinavian Journal of Medicine & Science in Sports. 1996;7:6. doi: 10.1111/j.1600-0838.1997.tb00122.x. [DOI] [PubMed] [Google Scholar]
- 6.Zhou Z, et al. Tendon-derived stem progenitor cell aging defective self-renewal and altered fate. Aging Cell. 2010;9:5. doi: 10.1111/j.1474-9726.2010.00598.x. [DOI] [PMC free article] [PubMed] [Google Scholar]
- 7.Bausch AR, Moller W, Sackmann E. Measurement of local viscoelasticity and forces in living cells by magnetic tweezers. Biophysical Journal. 1999;76:7. doi: 10.1016/S0006-3495(99)77225-5. [DOI] [PMC free article] [PubMed] [Google Scholar]
- 8.Fabry B, et al. Scaling the Microrheology of Living Cells. Physical Review Letters. 2001;87(14):4. doi: 10.1103/PhysRevLett.87.148102. [DOI] [PubMed] [Google Scholar]
- 9.Kuznetsova TG, et al. Atomic force misroscopy probing of cell elasticity. Micron. 2007;38:10. doi: 10.1016/j.micron.2007.06.011. [DOI] [PubMed] [Google Scholar]
- 10.Li QS, et al. AFM indentation study of breast cancer cells. Biochemical and Biophysical Research Communications. 2008;374:5. doi: 10.1016/j.bbrc.2008.07.078. [DOI] [PubMed] [Google Scholar]
- 11.Fernández P, Pullarkat PA, Ott A. A master relation defines the nonlinear viscoelasticity of single fibroblasts. Biophysical Journal. 2006;90(10):10. doi: 10.1529/biophysj.105.072215. [DOI] [PMC free article] [PubMed] [Google Scholar]
- 12.Srivastava A, Krishnamoorthy G. Cell type and spatial location dependence of cytoplasmic viscosity measured by time-resolved fluorescence microscopy. Archives of Biochemistry and Biophysics. 1997;340(2):9. doi: 10.1006/abbi.1997.9910. [DOI] [PubMed] [Google Scholar]
- 13.Bandey HL, et al. Modeling the response of thickness-shear mode resonators under various loading conditions. Analytical Chemistry. 1999;71(11):10. doi: 10.1021/ac981272b. [DOI] [PubMed] [Google Scholar]
- 14.Hossenlopp J, et al. Characterization of epoxy resin (SU-8) film using thickness-shear mode (TSM) resonator under various conditions. Journal of Polymer Science B: Polymer Physics. 2004;42:12. [Google Scholar]
- 15.Ballantine DS, et al. Acoustic wave sensor: theory, design and physicochemical applications. In: Stern R, Levy M, editors. Applications of Modern Acoustics. Academic Press; 1997. [Google Scholar]
- 16.Jimenez Y, et al. A contribution to solve the problem of coating properties extraction in quartz crystal microbalance applications, IEEE Transactions on Ultrasonics. Ferroelectrics, and Frequency Control. 2006;53:16. [PubMed] [Google Scholar]
- 17.Kino GS. Acoustic Waves: Devices Imaging, and Analog Signal Processing. Prentice-Hall Inc; Englewood Cliffs: 2000. p. 625. [Google Scholar]
- 18.Salt D. Hy-Q Handbook of Quartz Crystal Devices. Van Nostrand Reinhold (UK) Co. Ltd; London: 1987. [Google Scholar]
- 19.Lucklum R, et al. Determination of complex shear modulus with thickness shear mode resonators. Journal of Physics D: Applied Physics. 1997;30:11. [Google Scholar]
- 20.Cady WG. Piezoelectricity: An Introduction to the Theory and Applications of Electromechanical Phenomena in Crystals. Dover; New York: 1964. p. 822. [Google Scholar]
- 21.Qin L, et al. Characterization of polymer nanocomposite films using quartz thickness shear mode (TSM) acoustic wave sensor. Sensors & Actuators A. 2007;136:7. [Google Scholar]
- 22.Murphy-Ullrich JE. The de-adhesive activity of matricellular proteins: is intermediate cell adhesion an adaptive state? The Hournal of Clinical Investigation. 2001;107(7):6. doi: 10.1172/JCI12609. [DOI] [PMC free article] [PubMed] [Google Scholar]
- 23.Hardin J, Bertoni G, Kleinsmith LJ. Becker’s World of the Cell. Pearson Education. 2012 [Google Scholar]
- 24.Burridge K, et al. Focal adhension-transmambrance junctions between the extracellular matrix and the cytoskeleton. Annual Reviews of Cell Biology. 1988;4:39. doi: 10.1146/annurev.cb.04.110188.002415. [DOI] [PubMed] [Google Scholar]
- 25.Ginsberg MH, Du X, Plow EF. Inside-out integrin signalling. Current Opinion in Cell Biology. 1992;4:6. doi: 10.1016/0955-0674(92)90099-x. [DOI] [PubMed] [Google Scholar]
- 26.Fischer H, Polikarpov I, Craievish A. Average protein density is a molecular-weight-dependent function. Protein Science. 2004;13:4. doi: 10.1110/ps.04688204. [DOI] [PMC free article] [PubMed] [Google Scholar]
- 27.Wang E, Gundersen D. Increased organization of cytoskeleton accompanying the aging of human fibroblasts in vitro. Experimental Cell Research. 1984;154:12. doi: 10.1016/0014-4827(84)90679-7. [DOI] [PubMed] [Google Scholar]
- 28.Nishio K, et al. Senescence and cytoskeleton: overproduction of vimentin induces senescent-like morphology in human fibroblasts. Histochemistry & Cell Biology. 2001;116:7. doi: 10.1007/s004180100325. [DOI] [PubMed] [Google Scholar]
- 29.Nishio K, Inoue A. Senescence-associated alterations of cytoskeleton: extraordinary production of vimentin that anchors cytoplasmic P53 in senescent human fibroblasts. Histochemistry & Cell Biology. 2005;123:11. doi: 10.1007/s00418-005-0766-5. [DOI] [PubMed] [Google Scholar]
- 30.Schulze C, et al. Stiffening of human skin fibroblasts with aging. Biophysical Journal. 2010;99:9. doi: 10.1016/j.bpj.2010.08.026. [DOI] [PMC free article] [PubMed] [Google Scholar]
- 31.Smith BA, et al. Probing the viscoelastic behavior of cultured airway smooth muscle cells with atomic force microscopy: stiffening induced by contractile agonist. Biophysical Journal. 2005;88(4):14. doi: 10.1529/biophysj.104.046649. [DOI] [PMC free article] [PubMed] [Google Scholar]
- 32.Mahaffy RE, et al. Quantitative analysis of the viscoelastic properties of thin regions of fibroblasts using atomic force microscopy. Biophysical Journal. 2004;86(3):17. doi: 10.1016/S0006-3495(04)74245-9. [DOI] [PMC free article] [PubMed] [Google Scholar]
- 33.Park S, et al. Cell motility and local viscoelasticity of fibroblasts. Biophysical Journal. 2005;89(6):13. doi: 10.1529/biophysj.104.053462. [DOI] [PMC free article] [PubMed] [Google Scholar]
- 34.Thoumine O, Ott A. Time scale dependent viscoelastic and contractile regimes in fibroblasts probed by microplate manipulation. Journal of Cell Science. 1997;110:8. doi: 10.1242/jcs.110.17.2109. [DOI] [PubMed] [Google Scholar]
- 35.Bausch AR, et al. Local measurements of viscoelastic parameters of adherent cell surfaces by magnetic bead microrheometry. Biophysical Journal. 1998;75(4):12. doi: 10.1016/S0006-3495(98)77646-5. [DOI] [PMC free article] [PubMed] [Google Scholar]
- 36.Bicknese S, et al. Cytoplasmic viscosity near the cell plasma membrance-measurement by evanescent field frequency-domain microfluorimetry. Biophysical Journal. 1993;65:11. doi: 10.1016/S0006-3495(93)81179-2. [DOI] [PMC free article] [PubMed] [Google Scholar]


