

This phase II study analyzed anthropometrical, nutritional, and biochemical factors associated with gastrointestinal toxicity (GT) induced by afatinib. Malnutrition is associated with a higher risk of severe GT induced by afatinib. Therefore determination of nutritional status and body composition could identify patients at higher risk of severe GT and allow treatment with lower doses according to tolerance.
Keywords: Nutritional status, Gastrointestinal toxicity, Malnourishment, Afatinib, Phase II trial, Non-small cell lung cancer
Abstract
Background.
The main reason for dose reduction of afatinib is gastrointestinal toxicity (GT). In a phase II study, we analyzed anthropometrical, nutritional, and biochemical factors associated with GT induced by afatinib.
Materials and Methods.
Patients diagnosed with non-small cell lung cancer who progressed to prior chemotherapy received 40 mg of afatinib. Malnutrition was determined by Subjective Global Assessment, and lean body mass (LBM) was determined by computed tomography scan analysis using a pre-established Hounsfield unit threshold. Toxicity was obtained during four cycles by Common Terminology Criteria for Adverse Events.
Results.
Eighty-four patients were enrolled. Afatinib was administered as the second, third, and fourth line of treatment in 54.8%, 38.1%, and 7.12% of patients, respectively. Severe diarrhea, mucositis, and overall severe GT were present in 38.9%, 28.8%, and 57.5%, respectively. Of the patients, 50% developed dose-limiting toxicity (DLT). Patients with malnutrition have higher risk for severe GT. Patients with lower LBM and body mass index developed more DLT (71.4% vs. 18.8%).
Conclusion.
Malnutrition is associated with a higher risk of severe GT induced by afatinib. Determination of nutritional status and body composition are helpful in identifying patients at higher risk of severe GT and could allow initiating treatment with lower doses according to tolerance.
Implications for Practice:
Body composition analysis, specifically lean body mass quantification, and nutritional status assessment are significant clinical variables to take into account when assessing oncological patients. This study on patients with non-small cell lung cancer treated with afatinib showed the important impact that malnutrition and low lean body mass have on the risk for developing dose-limiting toxicity and severe gastrointestinal toxicity. Still more research needs to be done to explore dose adjustment according to lean body mass, especially in drugs that are given at fixed doses, such as afatinib. However, this study presents evidence for the clinical oncologist to have a closer follow-up with malnourished patients and even to consider a lower starting dose until therapeutic dose is achieved.
Introduction
Lung cancer continues to be the leading cause of cancer-related deaths worldwide [1, 2]. In Mexico, more than 95% of patients present with advanced-stage disease at the moment of the diagnosis [3]; therefore, the objective of treatment should be improving survival and quality of life [4]. Response to platinum-based cytotoxic chemotherapy in patients with advanced disease continues to be limited [4, 5]. In patients with non-small cell lung cancer (NSCLC) with tumors with epidermal growth factor receptor (EGFR) mutation and EGFR tyrosine-kinase inhibitors (TKIs) such as gefitinib and erlotinib have shown to induce a high antitumor activity [6]. Thus, TKIs have shown an increase in objective response rates and progression-free survival; however, resistance to these drugs is eventually acquired by different mechanisms [7].
Afatinib, a first-in-class irreversible ErbB family blocker, is a therapeutic option for patients who develop resistance to other TKIs [8], as well as in patients with EGFR mutation as first-line treatment as shown on two phase III clinical trials [9, 10], because it improves response rates and progression-free survival. Hence, a better disease-related symptom control for cough and dyspnea occurs, in comparison with chemotherapy [11].
However, there are adverse effects (AE) induced by afatinib; the most common are cutaneous and gastrointestinal (diarrhea, dysphagia, and mucositis). Prevalence of diarrhea in patients receiving 40 mg of afatinib, in phase II and III studies is as high as 90.3% (all grades of diarrhea) and 9.9% (grade 3–4 diarrhea). Another important gastrointestinal AE is mucositis, which presents in 61%–90% of patients treated with afatinib, with only 3%–9.7% of the cases being grade 3 [9–11].
Prevalence of malnutrition, determined by Subjective Global Assessment, is nearly 50% in patients with NSCLC of recent diagnosis [12, 13]. Clinical factors such as sex, age, body composition (i.e., the body proportion of lean and adipose tissues), performance, and nutritional status have been associated with a higher risk of developing treatment-related toxicity in patients with different types of cancer [14]. Furthermore, malnutrition and hypoalbuminemia have been associated with higher toxicity in patients with NSCLC treated with chemotherapy based in platinum [15]. Low muscle mass, also named sarcopenia [15, 16], has been studied in oncology patients and has been found to be a significant predictor of toxicity in patients treated with sorafenib and sunitinib; moreover, patients with sarcopenia and a body mass index (BMI) of <25 kg m2 have been observed to be at even higher risk [17, 18]. Lean body mass is an important tissue for drug metabolism, it has been observed that patients with lower lean body mass (LBM) have higher drug exposure (i.e., mg/LBM kg) [15].
To our knowledge, there is no reported evidence of factors associated with a higher toxicity risk induced by afatinib, especially gastrointestinal toxicity (GT), which is the primary reason for dose reduction. This is likely to provoke an impact on the quality of life and prognosis. Then the aim of the present study was to assess malnutrition and LBM of patients receiving afatinib after progression to chemotherapy, as well as their association to severe GT and dose-limiting toxicity (DLT), as part of a phase II study.
Materials and Methods
Patient Selection
Patients from the Thoracic Oncology Unit at Instituto Nacional de Cancerología of Mexico were included in the study. Eligible patients had histologically documented NSCLC stage IV, measurable disease according to the RECIST 1.1 criteria, aged 18 years and older, Eastern Cooperative Oncology Group (ECOG) performance status of ≤3, and suitable hematopoietic, hepatic, and renal function. All patients received chemotherapy based on platinum at least one cycle in first line treatment. Exclusion criteria were unstable systemic disease including active infections, uncontrolled concomitant diseases, inability to take oral medications, and impaired intestinal absorption.
Procedures
Patients received a starting daily oral dose of afatinib 40 mg/day. Treatment was continued until documented disease progression, withdrawal caused by severe adverse events, or withdrawal of consent. Doses of afatinib available were: 50, 40, and 30 mg, respectively. Afatinib treatment could be discontinued temporarily until the patient had recovered to a level of <1 or baseline National Cancer Institute Common Terminology Criteria for Adverse Events (CTCAE). Reduced doses below 30 mg were not allowed. Patients experiencing more than one adverse event of grade 3 or greater, those who underwent a subsequent toxicity of grade 2 or greater after dose reduction, and those who did not recover from the toxicity within 14 days were discontinued of afatinib treatment. Following recovery from toxicity, the drug should be restarted at an adjusted dose. Clinical, anthropometrical, and biochemical data were obtained prospectively at baseline, at least 1 week prior to initiation with afatinib. Diagnosis, clinical TMN stage, and performance status were determined by a clinical oncologist. Patients with selection criteria were fully informed about the aim of the study, invited to participate, and asked to sign an informed consent form.
Body Composition
Lumbar skeletal muscle mass was assessed by computerized tomography (CT) image analysis using the Slice-O-Matic software version 4.3 (Tomovision, Montreal, Canada), pre-established Hounsfield unit (HU) thresholds were used to identify and quantify muscle (−29 +150 HU). This measurement was performed by means of the third lumbar vertebra (L3) as an anatomical landmark, because it has been demonstrated to have a high correlation with whole-body skeletal muscle [19, 20]. Total LBM was estimated from muscle cross-sectional areas as described [19]: LBM (kg) = [0.30 × (skeletal muscle area at L3 using CT [cm2]) + 6.06].
Adverse Effects
Toxicity was assessed at every visit during the first 4 months with afatinib, using CTCAE version 4.0. Patients who developed adverse effects received appropriate supportive care. In case of any diarrhea grade 3, nausea, or vomiting for a consecutive week, afatinib was discontinued for up to 14 days. After this period of recovery, afatinib could be restarted with a dose reduction of 10 mg. If a second afatinib discontinuation was necessary because of toxicity, it could be done; however, afatinib had to be permanently discontinued if a third occurrence of severe adverse events occurred. The highest grade of toxicity reported was used to determine its presence. Severe GT was defined as the presence of grades 3 or 4 according to CTCAE guidelines. The study was submitted and approved by the institutional board and ethics committee (No. 011/005 ICI and CB/672 and No. 012/035/ICI and CB/772).
Follow-Up
Patients were evaluated once a week during the first 2 weeks of treatment and then every month until disease progression, withdrawal, or loss to follow-up. During the whole treatment with afatinib, patients underwent clinical evaluations and biochemical profiling. Every 2 months, CT scan analysis was performed to assess response.
Statistical Methods
A sample size of 66 patients per group provided a 90% probability of detecting a difference in our 30% endpoint (gastrointestinal [GI] toxicity severity) between the groups. Thereby rejecting the null hypothesis of equal proportions with a p value of 0.05 as a two-sided test, we also estimated a 10% withdrawal. For descriptive purposes, continuous variables were summarized as arithmetic means, medians, and SDs, whereas categorical variables were expressed as proportions. All continuous variables were dichotomized according with the median. The χ2 or Fisher exact test were used for assessing the statistical significance of clinical and biochemical parameters. Statistically significant and borderline significant variables (p ≤ .1) were included in a multivariate logistic regression analysis. Statistical significance was determined with a p ≤ .05 in a two-sided test. All the statistical analyses were conducted using the SPSS, version 20, software (SPSS software, IBM Corp., Armonk, NY, http://www-01.ibm.com/software/analytics/spss/).
Results
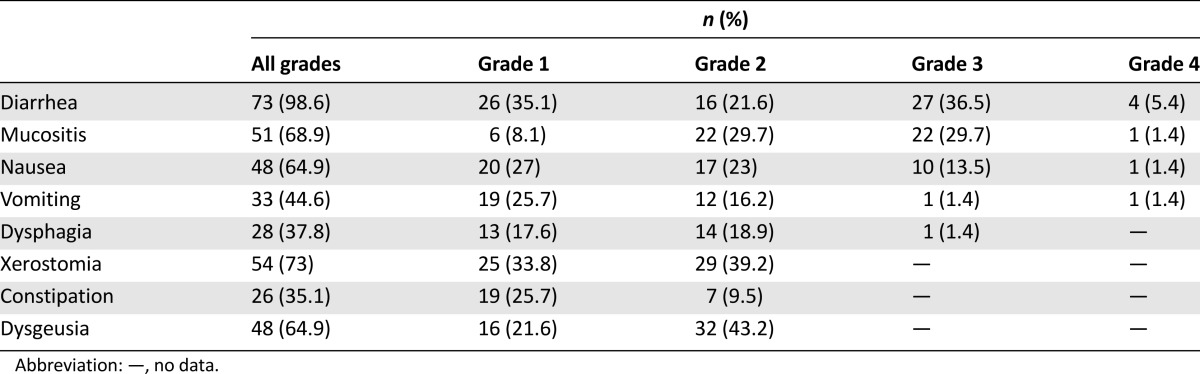
Eighty-four patients were assessed at baseline (Table 1). Mean age was 59.3 years, 70.2% were women, 94% had adenocarcinoma, 91.7% had a good performance status (ECOG 0–1), and median weight and body surface (BS) were 58.6 kg and 1.61 m2, respectively. After the 4-month follow-up, 74 patients were evaluated (Fig. 1). Adverse effects related to afatinib are shown in Table 2; the most common were diarrhea (98.6%) followed by mucositis (68.9%). Overall severe GT (grades 3 and 4) included presentation of at least one of the following adverse effects in grades 3 or 4: diarrhea, mucositis, constipation, xerostomy, nausea, vomiting, dysphagia, and dysgeusia. Also, 39 patients (53.4%) developed DLT.
Table 1.
Baseline characteristics of patients (n = 68 for sarcopenia; n = 84 for other variables)
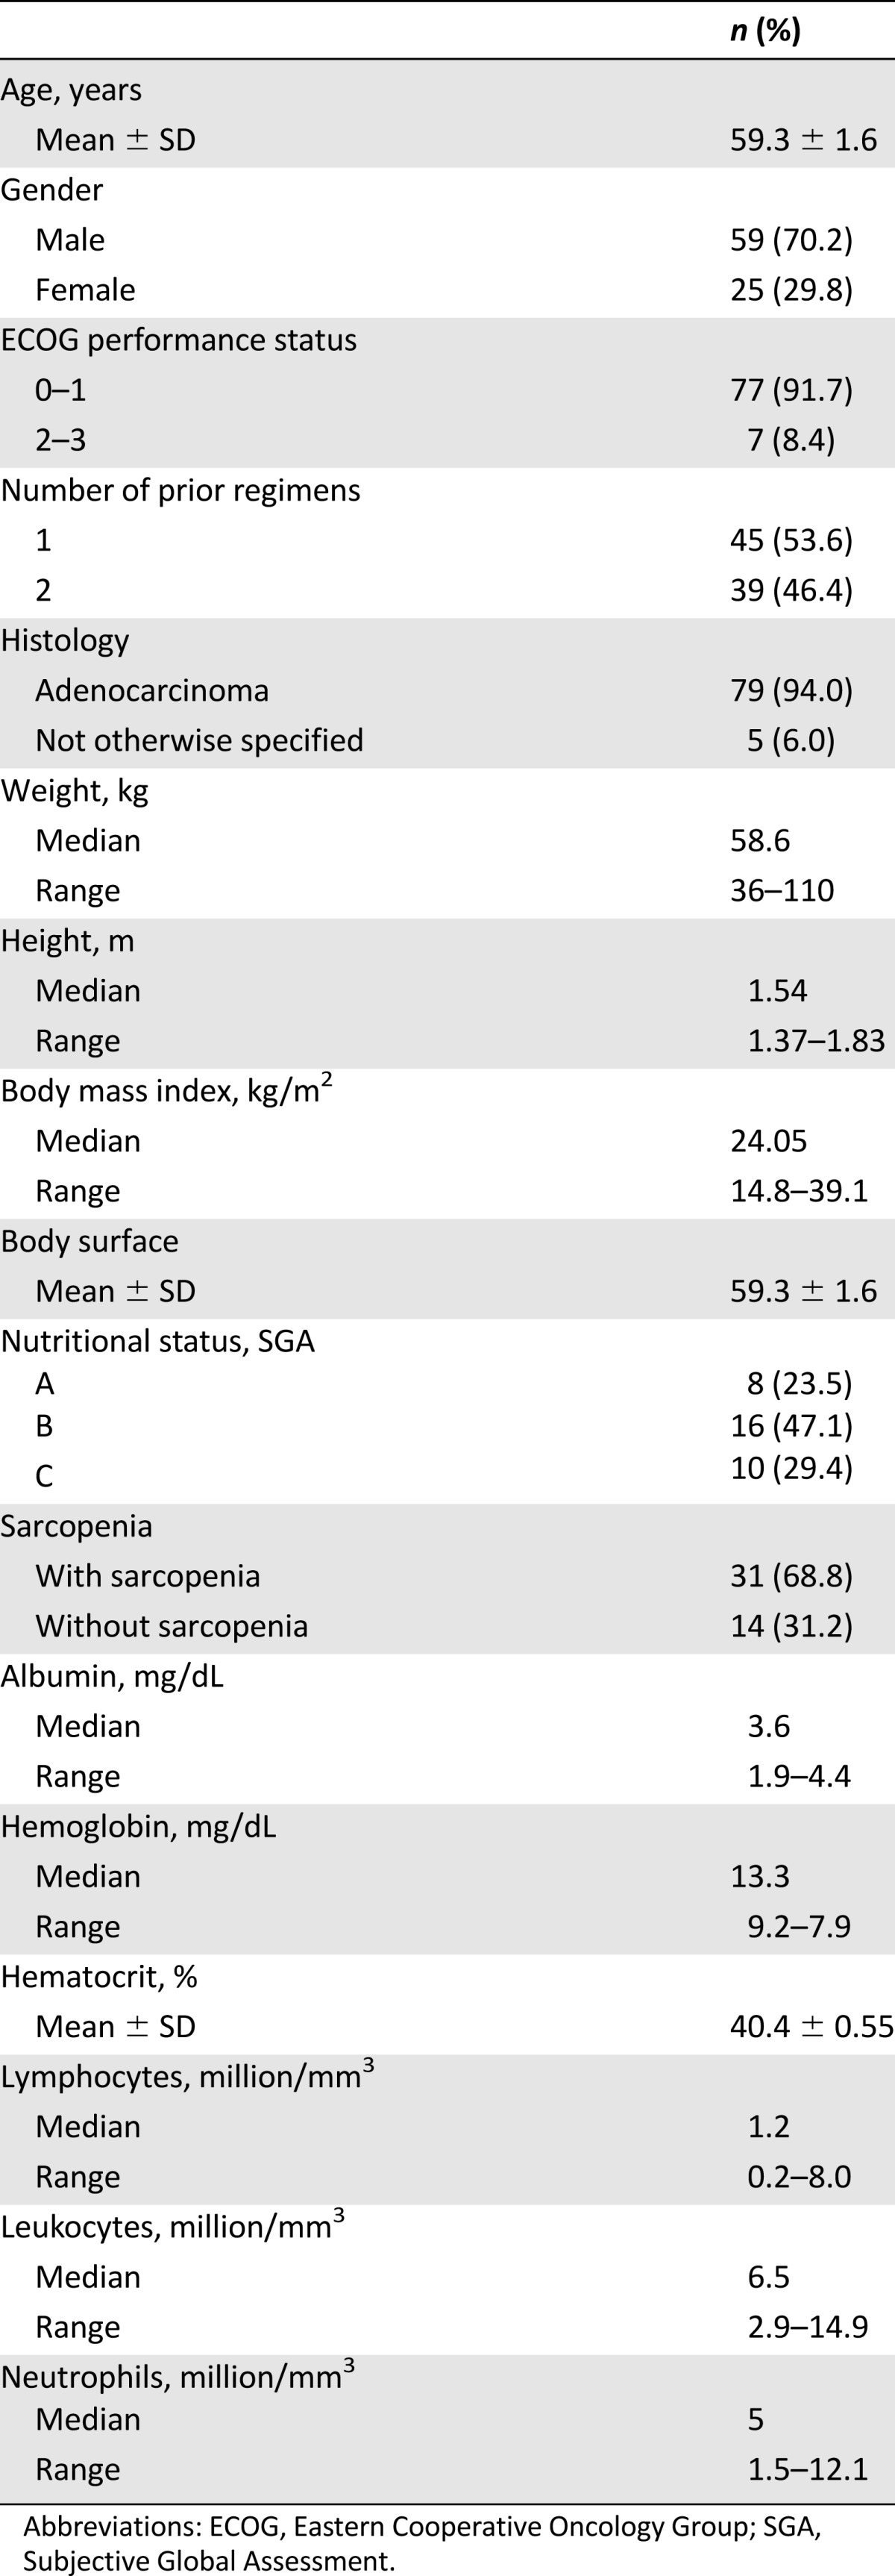
Figure 1.

CONSORT flowchart.
Abbreviation: CT, computerized tomography.
Table 2.
Gastrointestinal toxicity induced by afatinib (n = 74)
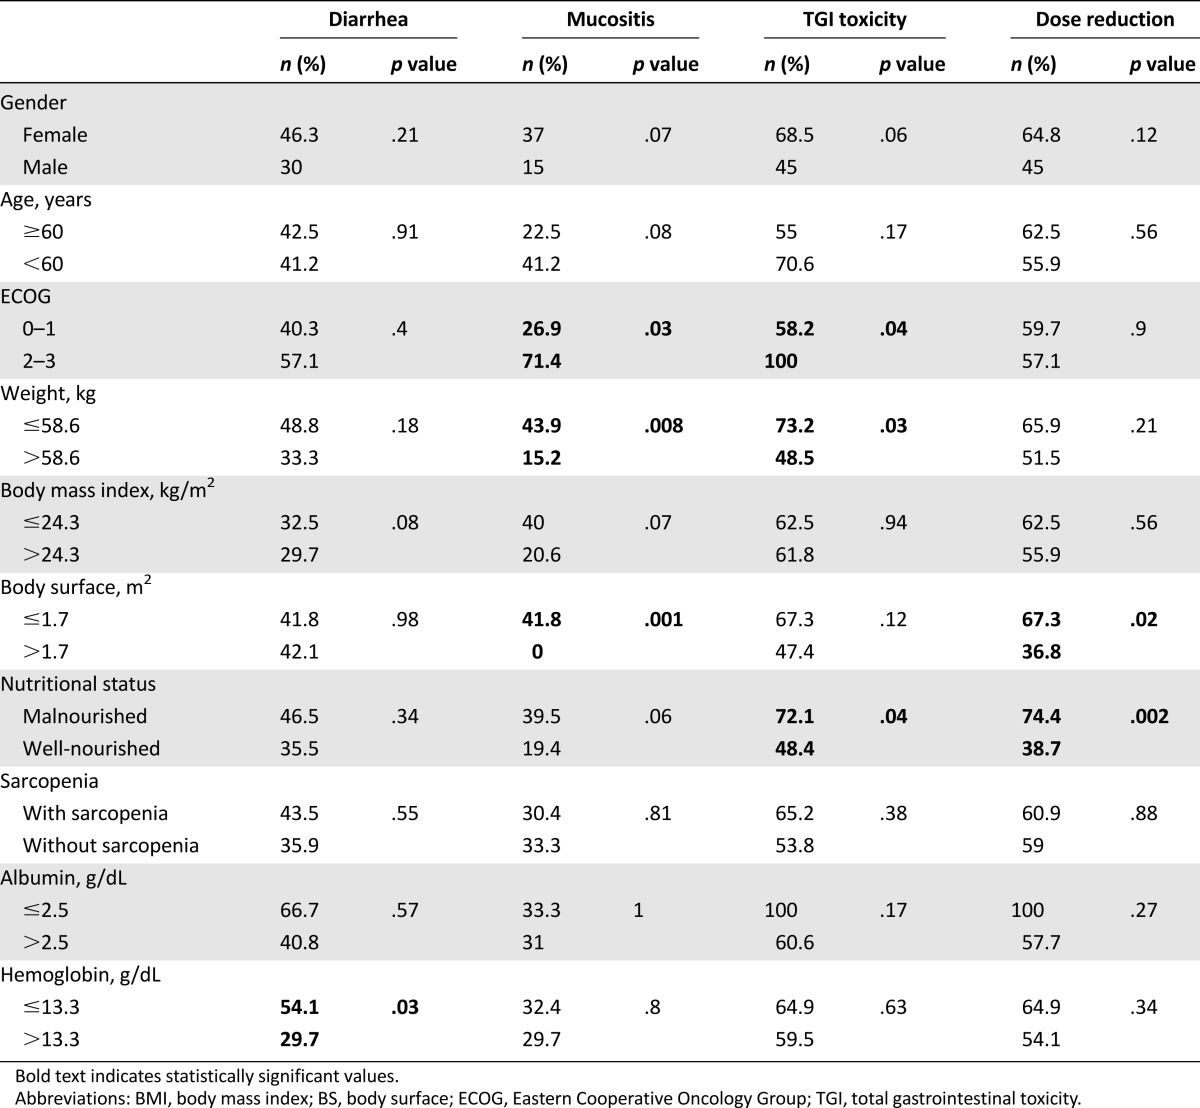
Factors associated with severe diarrhea, mucositis, and other GT are shown in Table 3. No association was found between the development of severe diarrhea and mucositis simultaneously; only 6 patients presented both severe toxicities at the same time (p = .929). The only variable with significant association to development of severe diarrhea was the presence of hemoglobin of <13.3 mg/dL (54.1% vs. 29.7%, p = .03). Several variables were statistically significant for the development of severe mucositis: ECOG of ≥2 (71.4% vs. 26.9%, p = .03), weight of ≤58.6 kg (43.9% vs. 15.2%, p = .008), and BS of ≤1.7 m2 (41.8% vs. 0%, p = .001). For severe overall GI toxicity, significance was observed for the following variables: ECOG of ≥2 (58.2 vs. 100%, p = .04), weight of ≤58.6 kg (73.2% vs. 48.5%, p = .03), and the diagnosis of malnutrition according to Subjective Global Assessment (72.1% vs. 48.4%, p = .04). For DLT, the statistically significant variables were malnutrition (74.7% vs. 38.7%, p = .002) and BS of <1.7 m2 (67.3 vs. 36.8%, p = .02). We did not find differences between patients who received afatinib in the second line versus the third or fourth line.
Table 3.
Factors associated with severe adverse effects (n = 74)
Statistically significant and nearly significant variables were used in the multivariate analysis model shown in Table 4. The results show that malnutrition in patients with advanced NSCLC is a significant factor for the risk of developing severe GT induced by afatinib, as well as an independent risk factor for the development of DLT. Moreover, Figure 2 shows the distribution of patients according to BMI and LBM/dose of afatinib (40 mg). Patients with lower LBM and BMI (inside the box) developed more DLT than patients with higher LBM and BMI values (71.4% vs. 18.8%, p = .0017).
Table 4.
Factors associated to severe gastrointestinal toxicity and dose-limiting toxicity induced by afatinib in patients with advanced non-small cell lung cancer
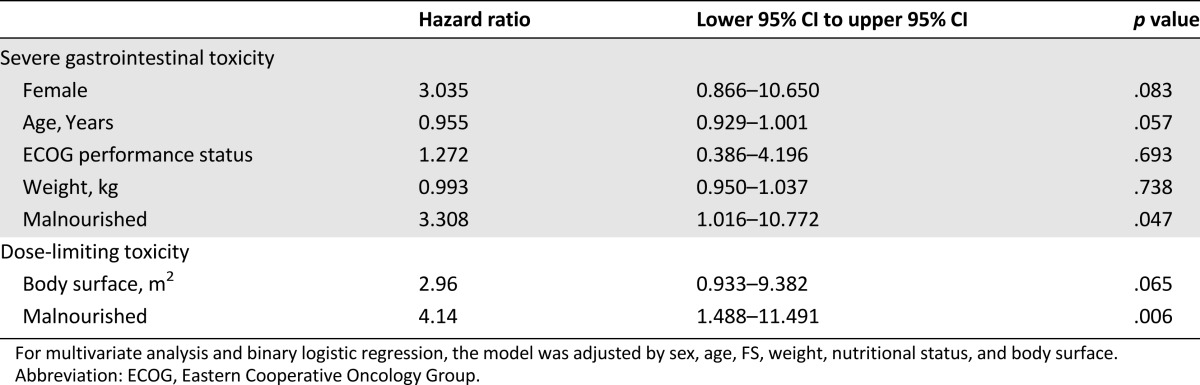
Figure 2.

Dose-limiting toxicity and patient distribution according to body mass index and LBM/mg of afatinib. The scatter plot highlights the variation and relation between body mass index and LBM kg/40 mg of afatinib each patient initially received. The box shows patients with low LBM in whom dose-limiting toxicity was more present (p = .0017).
Abbreviation: LBM, lean body mass.
Sixty-five patients had RECIST evaluation; global response to afatinib by RECIST was 50.8% (33 of 65). Patients with DLT had 42.2% (18 of 39) of response rate, whereas patients without dose reduction had a response rate of 57.5% (15 of 26) (p = .362). Median follow-up was 12.1 (0.3–26.5) months. Mean progression-free survival (PFS) 10.9 months (95% confidence interval [CI]: 6.7–15.3). Patients who did not require dose reduction had a PFS of 14.6 months (95% CI: 7.2–22), whereas patients with DLT had a PFS of 9.2 months (95% CI: 4.5–13.8) (p = .337) (Fig. 3).
Figure 3.

Progression-free survival with or without afatinib reduction.
Abbreviation: CI, confidence interval.
Within the sample of patients, those with the EGFR mutation were selected, and survival outcomes were analyzed. A nonstatistically significant tendency to poorer PFS and OS was observed in patients with sarcopenia compared with patients with no sarcopenia: 6.1 months (95% CI: 2.9–9.3) versus 9.2 months (95% CI: 2.4–15.9) p = .153 and 27.8 months (95% CI: 14.8–40.8) versus 39.5 months (95% CI: 31.8–47.2) p = .170, respectively (Fig. 4A, 4B).
Figure 4.

Sarcopenia and survival. (A): Sarcopenia and progression-free survival. (B): Sarcopenia and overall survival.
Abbreviation: CI, confidence interval.
Discussion
Malnutrition, determined by Subjective Global Assessment, has been often recognized as part of advance disease in oncological patients, and it has been related to a lower treatment tolerance, worst quality of life, and worst prognosis [13, 21]. To the best of our knowledge, this is the first study that analyzes the association between nutritional, anthropometrical, pathological, and biochemical factors and the development of GT in patients diagnosed with advanced NSCLC treated with afatinib. Baseline characteristics were similar to those reported in a comparable Mexican population of patients with newly diagnosed NSCLC [15]. However, a higher prevalence of malnutrition was found in the present study (59.5%), probably because patients treated with afatinib had already progressed during cytotoxic chemotherapy; hence, more functional and physical alterations could be present, as well as previous toxicity induced by chemotherapy.
After 4 months of treatment with afatinib, patients developed more severe GT (grades 3 and 4) than results reported from previous phase II and III trials with 40 mg of afatinib in NSCLC patients (17%–37% vs. 41.9%) [8, 9, 22]. Remarkably, no grade 4 toxicity has been reported in previous trials. Although in this trial, grade 4 toxicity was reported for diarrhea (5.4%), mucositis (1.4%), and nausea and vomiting (1.4%). Difference in the incidence of toxicity could be explained by possible differences in body composition and nutritional status between the Mexican population and others enrolled in other clinical trials. Moreover, 53.4% of the patients required dose reduction because of toxicity. Nevertheless, dose reduction did not show statistical significance in the response rate or PFS; however, the design of this study was not intended to assess DLT, which can mean having a poor statistical power for this variable.
The association between some nutritional parameters and treatment toxicity has been studied previously in Mexican patients diagnosed with NSCLC treated with first-line chemotherapy. A higher development of adverse effects as anemia, neuropathy, anorexia, lymphopenia, nausea, and fatigue were associated with malnutrition (31 vs. 22, p = .028) and hypoalbuminemia (62 vs. 43, p = .002) [15]. In the present study, malnutrition was independently associated with a higher risk of severe GT and DLT induced by afatinib. Targeted therapies like TKI of the EGFR, such as erlotinib, gefitinib, and afatinib, are administered in established doses, regardless of anthropometrical variables such as weight or BS; this could mean higher concentration in blood and cause more toxicity. Moreover, patients with malnutrition, sarcopenia, and lower BMI could have alterations in the drug metabolism because of a lower LBM; hence, they have higher exposure to afatinib and more risk of developing severe GT. Women are usually less muscular than men; thus, this could explain the difference in toxicity development between men and women. In our results, we found a statistical tendency in which women developed more severe mucositis (p = .07), overall GT (p = .06), and DLT (p = .12).
Although diagnosis of sarcopenia, using cutoff points as described by Prado et al. [14], was not found to be statistically associated with DLT or overall severe GT, we found that lower LBM and BMI <25 kg/m2 were significantly associated with DLT (p = .0017). These findings are consistent with other studies analyzing LBM and toxicity with other cancer treatments, suggesting that LBM and body size (BMI) are variables that affect the risk of toxicity. Sarcopenia has been associated with higher toxicity in diverse cancer patients undergoing various treatments as capecitabine [23], vandetanib [24] and sorafenib [25]. Moreover, sarcopenia and lower BMI were shown to increase the risk of DLT in patients with renal cancer treated with sunitinib [26]. Hence, the use of body composition analysis through CT images should be promoted to identify patients with low lean body mass in a timely manner and take the necessary measures to prevent DLT.
Other studies have explored the presence of sarcopenia in obese patients diagnosed with cancer and its effect on different clinical outcomes [14]. One study used CT images to evaluate body composition in patients diagnosed with pancreas cancer and found that overweight/obese patients with sarcopenia (40.9%) had a worse prognosis than those with no sarcopenia [27]. In our study, few obese/overweight patients were found, and only six had sarcopenic obesity. Thus, no differences were observed between sarcopenic and not sarcopenic overweight/obese patients regarding the development of DLT or severe GT. Further studies should address this subset of patients treated with afatinib and other TKIs.
Full-dose administration may not be the best option for malnourished and/or sarcopenic patients. Thus, more studies are needed to analyze the effect of dose reduction on response rate, PFS, and OS. In the present study, although the differences in PFS between patients with DLT and those without dose reduction were not statistically significant, a trend to higher PFS is shown in patients without DLT. Moreover, sarcopenia has been found to be a prognostic factor in patients with different types of cancer. In a study in patients diagnosed with melanoma, a significant association was found between sarcopenia and poorer OS and PFS [28]. Accordingly, although not statistically significant, we observed that patients with sarcopenia have worse OS and PFS.
Clearly, patients with higher GT have a worst quality of life [13], which can result in treatment desertion. Our results suggest that patients with malnutrition, low LBM, and lower BMI treated with afatinib should have a closer follow-up to promote timely toxicity treatment, and patients at high risk could even be initiated with lower doses of afatinib and raise the dose according to tolerance. The main limitations of this study were the number of nonanalyzable CT images and the loss of follow-up through the first 4 months of treatment. Despite this, we were able to analyze a large sample of patients.
Conclusion
Our results highlight the importance of assessing body composition as a routine exam for cancer patients, as well as a timely and constant nutritional status evaluation and intervention. More research regarding sarcopenia and cancer treatments needs to be done to fully understand the role of lean tissue in the metabolism of cancer treatments, as well as the effect on lean and muscle tissue of nutritional interventions such as oral nutritional supplementation with eicosapentaenoic acid and other nutrients and therefore the impact in the risk of developing severe toxicity in patients treated with TKI and other chemotherapy schemes.
Acknowledgment
Boehringer Ingelheim México S.A. (Mexico City, Mexico) provided afatinib as a donation but did not interfere in the trial design or results analysis.
Footnotes
For Further Reading: Martin Schuler, Jürgen R. Fischer, Christian Grohé et al. Experience With Afatinib in Patients With Non-Small Cell Lung Cancer Progressing After Clinical Benefit From Gefitinib and Erlotinib. The Oncologist 2014; 19:1100–1109.
Implications for Practice: This analysis of a large cohort of patients treated mainly in the community oncology setting confirms the activity of afatinib, an irreversible ErbB family blocker, in heavily pretreated metastatic non-small cell lung cancer. In particular, patients with tumors harboring somatic EGFR mutations derive a clinical meaningful benefit from afatinib, despite progressing on prior treatments with reversible EGFR inhibitors gefitinib or erlotinib. In some patients receiving multiple EGFR-targeting lines, the second and third lines provided prolonged disease control. Maintaining ErbB blockade by afatinib is an attractive strategy in EGFR-dependent lung cancer with acquired resistance to gefitinib or erlotinib.
Author Contributions
Conception/Design: Oscar Arrieta, Martha De la Torre-Vallejo, Jenny Turcott, Eleazar-Omar Macedo-Pérez, Karla Sánchez-Lara, Vickie E. Baracos
Provision of study material or patients: Oscar Arrieta, Martha De la Torre-Vallejo, Diego López-Macías, David Orta, Jenny Turcott, Eleazar-Omar Macedo-Pérez, Vickie E. Baracos
Collection and/or assembly of data: Oscar Arrieta, Martha De la Torre-Vallejo, Diego López-Macías, David Orta, Jenny Turcott, Eleazar-Omar Macedo-Pérez, Laura-Alejandra Ramírez-Tirado, Vickie E. Baracos
Data analysis and interpretation: Oscar Arrieta, Diego López-Macías, Jenny Turcott, Karla Sánchez-Lara, Laura-Alejandra Ramírez-Tirado, Vickie E. Baracos
Manuscript writing: Oscar Arrieta, Martha De la Torre-Vallejo, Diego López-Macías, David Orta, Eleazar-Omar Macedo-Pérez, Karla Sánchez-Lara, Laura-Alejandra Ramírez-Tirado, Vickie E. Baracos
Final approval of manuscript: Oscar Arrieta, Martha De la Torre-Vallejo, Diego López-Macías, David Orta, Jenny Turcott, Eleazar-Omar Macedo-Pérez, Karla Sánchez-Lara, Laura-Alejandra Ramírez-Tirado, Vickie E. Baracos
Disclosures
The authors indicated no financial relationships.
References
- 1.Siegel R, Ma J, Zou Z, et al. Cancer statistics, 2014. CA Cancer J Clin. 2014;64:9–29. doi: 10.3322/caac.21208. [DOI] [PubMed] [Google Scholar]
- 2.Ferlay J, Shin HR, Bray F, et al. Estimates of worldwide burden of cancer in 2008: GLOBOCAN 2008. Int J Cancer. 2010;127:2893–2917. doi: 10.1002/ijc.25516. [DOI] [PubMed] [Google Scholar]
- 3.Arrieta O, Guzmán-de Alba E, Alba-López LF, et al. National consensus of diagnosis and treatment of non-small cell lung cancer [in Spanish] Rev Invest Clin. 2013;65(suppl 1):S5–S84. [PubMed] [Google Scholar]
- 4.Arrieta Ó, Núñez-Valencia C, Reynoso-Erazo L, et al. Health-related quality of life in patients with lung cancer: Validation of the Mexican-Spanish version and association with prognosis of the EORTC QLQ-LC13 questionnaire. Lung Cancer. 2012;77:205–211. doi: 10.1016/j.lungcan.2012.02.005. [DOI] [PubMed] [Google Scholar]
- 5.Schiller JH, Harrington D, Belani CP, et al. Comparison of four chemotherapy regimens for advanced non-small-cell lung cancer. N Engl J Med. 2002;346:92–98. doi: 10.1056/NEJMoa011954. [DOI] [PubMed] [Google Scholar]
- 6.Dziadziuszko R, Jassem J. Epidermal growth factor receptor (EGFR) inhibitors and derived treatments. Ann Oncol. 2012;23(suppl 10):x193–x196. doi: 10.1093/annonc/mds351. [DOI] [PubMed] [Google Scholar]
- 7.Yu HA, Arcila ME, Rekhtman N, et al. Analysis of tumor specimens at the time of acquired resistance to EGFR-TKI therapy in 155 patients with EGFR-mutant lung cancers. Clin Cancer Res. 2013;19:2240–2247. doi: 10.1158/1078-0432.CCR-12-2246. [DOI] [PMC free article] [PubMed] [Google Scholar]
- 8.Miller VA, Hirsh V, Cadranel J, et al. Afatinib versus placebo for patients with advanced, metastatic non-small-cell lung cancer after failure of erlotinib, gefitinib, or both, and one or two lines of chemotherapy (LUX-Lung 1): A phase 2b/3 randomised trial. Lancet Oncol. 2012;13:528–538. doi: 10.1016/S1470-2045(12)70087-6. [DOI] [PubMed] [Google Scholar]
- 9.Wu YL, Zhou C, Hu CP, et al. Afatinib versus cisplatin plus gemcitabine for first-line treatment of Asian patients with advanced non-small-cell lung cancer harbouring EGFR mutations (LUX-Lung 6): An open-label, randomised phase 3 trial. Lancet Oncol. 2014;15:213–222. doi: 10.1016/S1470-2045(13)70604-1. [DOI] [PubMed] [Google Scholar]
- 10.Sequist LV, Yang JC, Yamamoto N, et al. Phase III study of afatinib or cisplatin plus pemetrexed in patients with metastatic lung adenocarcinoma with EGFR mutations. J Clin Oncol. 2013;31:3327–3334. doi: 10.1200/JCO.2012.44.2806. [DOI] [PubMed] [Google Scholar]
- 11.Yang JC, Hirsh V, Schuler M, et al. Symptom control and quality of life in LUX-Lung 3: A phase III study of afatinib or cisplatin/pemetrexed in patients with advanced lung adenocarcinoma with EGFR mutations. J Clin Oncol. 2013;31:3342–3350. doi: 10.1200/JCO.2012.46.1764. [DOI] [PubMed] [Google Scholar]
- 12.Sánchez-Lara K, Turcott JG, Juárez-Hernández E, et al. Effects of an oral nutritional supplement containing eicosapentaenoic acid on nutritional and clinical outcomes in patients with advanced non-small cell lung cancer: Randomised trial. Clin Nutr. 2014;33:1017–1023. doi: 10.1016/j.clnu.2014.03.006. [DOI] [PubMed] [Google Scholar]
- 13.Sánchez-Lara K, Turcott JG, Juárez E, et al. Association of nutrition parameters including bioelectrical impedance and systemic inflammatory response with quality of life and prognosis in patients with advanced non-small-cell lung cancer: A prospective study. Nutr Cancer. 2012;64:526–534. doi: 10.1080/01635581.2012.668744. [DOI] [PubMed] [Google Scholar]
- 14.Prado CM, Lieffers JR, McCargar LJ, et al. Prevalence and clinical implications of sarcopenic obesity in patients with solid tumours of the respiratory and gastrointestinal tracts: A population-based study. Lancet Oncol. 2008;9:629–635. doi: 10.1016/S1470-2045(08)70153-0. [DOI] [PubMed] [Google Scholar]
- 15.Arrieta O, Michel Ortega RM, Villanueva-Rodríguez G, et al. Association of nutritional status and serum albumin levels with development of toxicity in patients with advanced non-small cell lung cancer treated with paclitaxel-cisplatin chemotherapy: A prospective study. BMC Cancer. 2010;10:50. doi: 10.1186/1471-2407-10-50. [DOI] [PMC free article] [PubMed] [Google Scholar]
- 16.Cruz-Jentoft AJ, Baeyens JP, Bauer JM, et al. Sarcopenia: European consensus on definition and diagnosis: Report of the European Working Group on sarcopenia in older people. Age Ageing. 2010;39:412–423. doi: 10.1093/ageing/afq034. [DOI] [PMC free article] [PubMed] [Google Scholar]
- 17.Fearon K, Strasser F, Anker SD, et al. Definition and classification of cancer cachexia: An international consensus. Lancet Oncol. 2011;12:489–495. doi: 10.1016/S1470-2045(10)70218-7. [DOI] [PubMed] [Google Scholar]
- 18.Antoun S, Baracos VE, Birdsell L, et al. Low body mass index and sarcopenia associated with dose-limiting toxicity of sorafenib in patients with renal cell carcinoma. Ann Oncol. 2010;21:1594–1598. doi: 10.1093/annonc/mdp605. [DOI] [PubMed] [Google Scholar]
- 19.Mourtzakis M, Prado CM, Lieffers JR, et al. A practical and precise approach to quantification of body composition in cancer patients using computed tomography images acquired during routine care. Appl Physiol Nutr Metab. 2008;33:997–1006. doi: 10.1139/H08-075. [DOI] [PubMed] [Google Scholar]
- 20.Shen W, Punyanitya M, Wang Z, et al. Total body skeletal muscle and adipose tissue volumes: Estimation from a single abdominal cross-sectional image. J Appl Physiol (1985) 2004;97:2333–2338. doi: 10.1152/japplphysiol.00744.2004. [DOI] [PubMed] [Google Scholar]
- 21.Luo J, Chen YJ, Narsavage GL, et al. Predictors of survival in patients with non-small cell lung cancer. Oncol Nurs Forum. 2012;39:609–616. doi: 10.1188/12.ONF.609-616. [DOI] [PubMed] [Google Scholar]
- 22.Yang JC, Shih JY, Su WC, et al. Afatinib for patients with lung adenocarcinoma and epidermal growth factor receptor mutations (LUX-Lung 2): A phase 2 trial. Lancet Oncol. 2012;13:539–548. doi: 10.1016/S1470-2045(12)70086-4. [DOI] [PubMed] [Google Scholar]
- 23.Prado CM, Baracos VE, McCargar LJ, et al. Sarcopenia as a determinant of chemotherapy toxicity and time to tumor progression in metastatic breast cancer patients receiving capecitabine treatment. Clin Cancer Res. 2009;15:2920–2926. doi: 10.1158/1078-0432.CCR-08-2242. [DOI] [PubMed] [Google Scholar]
- 24.Massicotte MH, Borget I, Broutin S, et al. Body composition variation and impact of low skeletal muscle mass in patients with advanced medullary thyroid carcinoma treated with vandetanib: Results from a placebo-controlled study. J Clin Endocrinol Metab. 2013;98:2401–2408. doi: 10.1210/jc.2013-1115. [DOI] [PubMed] [Google Scholar]
- 25.Mir O, Coriat R, Blanchet B, et al. Sarcopenia predicts early dose-limiting toxicities and pharmacokinetics of sorafenib in patients with hepatocellular carcinoma. PLoS One. 2012;7:e37563. doi: 10.1371/journal.pone.0037563. [DOI] [PMC free article] [PubMed] [Google Scholar]
- 26.Huillard O, Mir O, Peyromaure M, et al. Sarcopenia and body mass index predict sunitinib-induced early dose-limiting toxicities in renal cancer patients. Br J Cancer. 2013;108:1034–1041. doi: 10.1038/bjc.2013.58. [DOI] [PMC free article] [PubMed] [Google Scholar]
- 27.Tan BH, Birdsell LA, Martin L, et al. Sarcopenia in an overweight or obese patient is an adverse prognostic factor in pancreatic cancer. Clin Cancer Res. 2009;15:6973–6979. doi: 10.1158/1078-0432.CCR-09-1525. [DOI] [PubMed] [Google Scholar]
- 28.Sabel MS, Lee J, Cai S, et al. Sarcopenia as a prognostic factor among patients with stage III melanoma. Ann Surg Oncol. 2011;18:3579–3585. doi: 10.1245/s10434-011-1976-9. [DOI] [PubMed] [Google Scholar]