

Abstract
BACKGROUND & AIMS
Screening decreases colorectal cancer (CRC) incidence and mortality. Colonoscopy has become the most common CRC screening test in the United States, but the degree to which it protects against CRC of the proximal colon is unclear. We examined US trends in rates of resection for proximal vs distal CRC, which reflect CRC incidence, in the context of national CRC screening data, before and since Medicare’s 2001 decision to pay for screening colonoscopy.
METHODS
We used the Nationwide Inpatient Sample, the largest US all-payer inpatient database, to estimate age-adjusted rates of resection for distal and proximal CRC, from 1993 to 2009, in adults. Temporal trends were analyzed using Joinpoint regression analysis.
RESULTS
The rate of resection for distal CRC decreased from 38.7 per 100,000 persons (95% confidence interval [CI], 35.4 – 42.0) to 23.2 per 100,000 persons (95% CI, 20.9 –25.5) from 1993 to 2009, with annual decreases of 1.2% (95% CI, 0.1%–2.3%) from 1993 to 1999, followed by larger annual decreases of 3.8% (95% CI, 3.3%– 4.3%) from 1999 to 2009 (P < .001). In contrast, the rate of resection for proximal CRC decreased from 30.0 per 100,000 persons (95% CI, 27.4 –32.5) to 22.7 per 100,000 persons (95% CI, 20.6 –24.7) from 1993 to 2009, but significant annual decreases of 3.1% (95% CI, 2.3%– 4.0%) occurred only after 2002 (P < .001). Rates of resection for CRC decreased for adults ages 50 years and older, but increased for younger adults.
CONCLUSIONS
These findings support the hypothesis that population-level decreases in rates of resection for distal CRC are associated with screening, in general, and that implementation of screening colonoscopy, specifically, might be an important factor that contributes to population-level decreases in rates of resection for proximal CRC.
Keywords: Colon Cancer, Epidemiology, Surgery, Early Detection
Colorectal cancer (CRC) is the second leading cause of cancer-related mortality in the United States.1 It is estimated that 143,000 new cases of CRC will be diagnosed and that 52,000 deaths will be attributed to CRC in the United States in 2012.1 CRC incidence in the United States has been declining for decades, with a substantial fraction of the recent decline likely attributable to screening and CRC prevention by polypectomy.1,2
Screening for adenomas, the precursors of most CRCs, and for early stage CRC decreases CRC incidence and mortality.3-6 CRC screening rates in the United States have increased steadily.7-10 Although early screening efforts relied on fecal occult blood testing (FOBT) and sigmoidoscopy, colonoscopy has dominated in the United States since Medicare’s decision to cover screening colonoscopy in average-risk persons in 2001, and similar decisions by commercial insurers.10-16 FOBT primarily detects CRC, not adenomas, and sigmoidoscopy reduces only distal CRC incidence.3-6 Colonoscopy can provide complete colonic examination and can incorporate polypectomy.17,18 Recent studies that questioned colonoscopy’s effectiveness in decreasing proximal CRC incidence and mortality19,20 have led to a reappraisal of its merits relative to sigmoidoscopy.21 Subsequent studies have reported protection by colonoscopy against both distal and proximal CRC.22,23 The identification of physician specialty, polypectomy rate and site of service as predictors of interval, or postcolonoscopy proximal CRC22 suggests possible explanations for the differences in the effect of colonoscopy observed in different studies.
Whether colonoscopy, as practiced in the community, protects against proximal CRC is a pressing public health question. We examined US national trends in CRC resection rates, contrasting proximal vs distal disease and older vs younger persons. Our aims were to place temporal trends in CRC epidemiology in the context of national trends in CRC screening, just as breast cancer incidence trends have been placed in the context of trends in use of hormone replacement therapy and other risk factors.24
Materials and Methods
Data Source
We analyzed hospitalization data from the Nationwide Inpatient Sample (NIS), the largest all-payer inpatient care database in the United States, developed by the Agency for Health Care Research and Quality as part of the Healthcare Cost and Utilization Project. The NIS is a 20% stratified probability sample of US hospitals with detailed clinical and resource use information, and contains data for 5– 8 million hospital stays per year.25 The sampling frame for the NIS is all US nonfederal, short-term, general, and other specialty hospitals, including public and academic hospitals.25 Five hospital characteristics including geographic region, bed size, teaching status, urban/rural location, and ownership/control were used to divide the US community hospitals into strata. The stratified probability sample of hospitals is drawn with sampling probabilities proportional to the number of US community hospitals in each stratum. All the inpatient records from the selected hospitals are included to derive the NIS. Sampling design variables and weight variables are provided to calculate national estimates of discharges and trends over time. To facilitate trend analysis using multiple years of NIS data, NIS trend weights are provided by the Healthcare Cost and Utilization Project to adjust for changes in sampling frame and methods over time.25
The major strength of the NIS is its large sample size and a sampling strategy designed to be representative of the entire country. It provides data that are complementary to data from the Surveillance, Epidemiology and End Results (SEER) program, which reflect detailed cancer registry data from specific geographic areas.26,27
Study Population
The NIS was used to study all inpatient discharges that resulted in surgical resection of CRC from 1993 to 2009. CRC resection rates closely reflect CRC incidence because most persons with CRC undergo one surgery regardless of stage at diagnosis.28
Analyses were restricted to adults aged 18 years or older at hospital admission. Trends were analyzed for all adults and for 4 predetermined age subgroups: 18 –39, 40 – 49, 50 –75, and ≥76 years. These age groups reflect, respectively, persons younger than routine screening ages, persons for whom screening is recommended given a family history of CRC, persons at average CRC risk for whom screening is recommended, and persons for whom routine screening is not recommended by the US Preventive Services Task Force (USPSTF).29 Additional focused analyses were performed for the age subgroups of 50 – 64 years and 65–75 years to contrast a subgroup for which Medicare is not a major insurer vs one for which it is the major insurer.
Study Outcomes
The primary outcome was surgical resection of CRC. A case of CRC resection was defined by a hospitalization including both an International Classification of Diseases, 9th revision, Clinical Modification procedure code for colorectal resection (17.31–17.36, 17.39, 45.71– 45.76, 45.79, 45.8, 45.81– 45.83, 48.40 – 48.43, 48.49, 48.5– 48.52, 48.59, 48.61– 48.65, 48.69) and a diagnosis code for malignant neoplasm of the colon (153.0 –153.4, 153.6 –153.9, 230.3), rectum (154.0, 154.1, 154.8, 230.4), or digestive system (235.2, 239.0). International Classification of Diseases, 9th revision, Clinical Modification diagnosis and procedure codes are revised every October by introducing new codes and/or eliminating some codes.30 We ensured that appropriate codes were used for each year studied by using the conversion table provided by the Centers for Disease Control and Prevention.30
The anatomic site of CRC was defined as proximal by procedure codes for laparoscopic or open surgical resection proximal to but not including the splenic flexure (17.32–17.34, 45.72–45.74), and was defined as distal by procedure codes for laparoscopic or open surgical resection including the splenic flexure, descending, sigmoid colon, or rectum (17.35, 17.36, 45.75, 45.76, 48.40–48.43, 48.49, 48.5–48.52, 48.59, 48.61–48.65, 48.69). When the procedure code did not specify anatomic site, the anatomic site was defined by the diagnosis code. In 3.2% of cases (71,222 of 2,225,513), the anatomic site could not be determined, and these cases were excluded from the site-specific analyses.
Statistical Analysis
To examine trends in CRC resection from 1993 to 2009, and to allow comparisons between demographic subgroups based on age and sex, national estimates of direct age-adjusted CRC resection rates and 95% confidence intervals (CIs) were calculated for each year of the study period for all adults, and were stratified by age group and sex. Resection rates were calculated for CRC overall, which includes proximal and distal CRC as well as the small fraction of cases in which anatomic site could not be determined, and then separately for proximal and distal CRC.
To estimate national rates and to calculate variances accurately, appropriate survey procedures in SAS statistical software version 9.2 (SAS Institute, Inc, Cary, NC) were used to account for the complexity of the NIS survey design with stratification and clustering. Population data from the US Bureau of the Census were used to calculate direct age-adjusted resection rates per 100,000 persons for every study year, using the year 2000 US standard population as the reference standardizing population.31-33 All results reported are age-adjusted resection rates, standardized to the US 2000 standard population.
Trends in age-adjusted CRC resection rates over time were analyzed using Joinpoint regression program version 3.5.2 from the SEER program of the National Cancer Institute.34 Joinpoint regression methodology is used widely to study changes in trends in cancer rates over time, enabling investigators to identify statistically significant changes in trends. The Joinpoint program determines the number of significant joinpoints (the points in time when trends changed) by performing permutation tests, and fits a log-linear model to each segment. The following set of default specifications was specified in advance, as is common practice34: the maximum number of joinpoints was set to 3, the minimum number of observations for a joinpoint was set to 3, and the minimum number of observations between 2 joinpoints was set to 4. The slope of a line segment is described as the annual percentage change (APC). Statistically significant APC values are interpreted as evidence of a significant change in the rate over the specific time period. We present P values comparing line segments with different APCs.35
Results
Contrasting Trends in Proximal Versus Distal CRC Resection Rates
The overall CRC resection rate in the United States decreased from 71.1 (95% CI, 65.9 –76.2) per 100,000 persons in 1993 to 47.3 (95% CI, 43.4 –51.2) per 100,000 persons in 2009 (Figure 1A, Table 1). Annual decreases were more marked after 2000 than before 2000 (P < .001) (Figure 1A, Table 1).
Figure 1.

US colorectal cancer resection rates for all adults. In contrast with distal colorectal cancer resection rates, proximal colon cancer resection rates decreased significantly only after 2002. Curves show the results of Joinpoint analyses. (A) Colorectal cancer overall, (B) distal colorectal cancer, and (C) proximal colon cancer.
Table 1.
Temporal trends in CRC Resection Rates for all Adults
| Age-adjusted resection rate per 100,000 persons (95% CI)
|
Trend 1
|
Trend 2
|
||||
|---|---|---|---|---|---|---|
| 1993 | 2009 | Time period | Annual percentage change (95% CI) | Time period | Annual percentage change (95% CI) | |
| All adults (age ≥18 y) | ||||||
| All colorectal cancer | 71.1 (65.9–76.2) | 47.3 (43.4–51.2) | 1993–2000 | −0.9 (−1.7 to −0.1) | 2000–2009 | −3.4 (−3.9 to −2.8) |
| Proximal colon cancer | 30.0 (27.4–32.5) | 22.7 (20.6–24.7) | 1993–2002 | −0.5 (−1.0 to 0.1) | 2002–2009 | −3.1 (−4.0 to −2.3) |
| Distal colorectal cancer | 38.7 (35.4–42.0) | 23.2 (20.9–25.5) | 1993–1999 | −1.2 (−2.3 to −0.1) | 1999–2009 | −3.8 (−4.3 to −3.3) |
| Age ≥76 y | ||||||
| All colorectal cancer | 384.3 (359.4–409.2) | 216.4 (199.2–233.6) | 1993–2000 | −1.8 (−2.8 to −0.8) | 2000–2009 | −4.4 (−5.1 to −3.7) |
| Proximal colon cancer | 193.9 (178.7–209.0) | 130.9 (120.0–141.8) | 1993–2001 | −1.1 (−2.0 to −0.3) | 2001–2009 | −3.6 (−4.4 to −2.8) |
| Distal colorectal cancer | 178.6 (165.3–191.9) | 80.1 (72.0–88.1) | 1993–2000 | −3.0 (−4.1 to −1.9) | 2000–2009 | −5.8 (−6.6 to −5.0) |
| Age 50–75 y | ||||||
| All colorectal cancer | 128.8 (119.5–138.0) | 87.5 (80.8–94.3) | 1993–2000 | −0.6 (−1.4 to 0.3) | 2000–2009 | −3.4 (−4.0 to −2.8) |
| Proximal colon cancer | 47.6 (43.7–51.6) | 38.4 (35.2–41.7) | 1993–2002 | 0.2 (−0.4 to 0.9) | 2002–2009 | −3.1 (−4.0 to −2.1) |
| Distal colorectal cancer | 76.4 (70.1–82.8) | 46.6 (42.3–50.8) | 1993–1999 | −0.9 (−2.2 to 0.3) | 1999–2009 | −3.9 (−4.5 to −3.4) |
| Age 40–49 y | ||||||
| All colorectal cancer | 16.0 (14.0–17.9) | 18.9 (16.8–21.0) | 1993–2009 | 1.3 (0.8–1.8) | — | — |
| Proximal colon cancer | 5.4 (4.5–6.3) | 5.4 (4.6–6.2) | 1993–2009 | 0.9 (0.2–1.6) | — | — |
| Distal colorectal cancer | 10.0 (8.6–11.3) | 12.7 (11.1–14.3) | 1993–2009 | 1.5 (0.9–2.1) | — | — |
| Age 18–39 y | ||||||
| All colorectal cancer | 2.5 (2.1–2.9) | 3.1 (2.7–3.5) | 1993–2009 | 2.4 (1.7–3.1) | — | — |
| Proximal colon cancer | 0.9 (0.7–1.1) | 1.0 (0.8–1.2) | 1993–2009 | 1.9 (1.1–2.7) | — | — |
| Distal colorectal cancer | 1.5 (1.2–1.8) | 1.9 (1.6–2.2) | 1993–2009 | 2.8 (2.0–3.7) | — | — |
The distal CRC resection rate decreased from 38.7 (95% CI, 35.4 – 42.0) per 100,000 persons in 1993 to 23.2 (95% CI, 20.9 –25.5) per 100,000 persons in 2009, with an initial period of significant annual decreases followed by a period of more substantial annual decreases (Figure 1B, Table 1). From 1993 to 1999, the distal CRC resection rate decreased by 1.2% (95% CI, 0.1%–2.3%) per year, followed by an accelerated decline of 3.8% (95% CI, 3.3%– 4.3%) per year from 1999 to 2009 (P < .001) (Figure 1B, Table 1).
In contrast with the trend for the distal CRC resection rate, the proximal CRC resection rate decreased significantly only after 2002. The proximal CRC resection rate decreased from 30.0 (95% CI, 27.4–32.5) per 100,000 persons in 1993 to 22.7 (95% CI, 20.6–24.7) per 100,000 persons in 2009 (Figure 1C, Table 1). However, there was no significant change during an initial period from 1993 to 2002. After 2002, the proximal CRC resection rate decreased by 3.1% (95% CI, 2.3%–4.0%) per year (P < .001) (Figure 1C, Table 1).
CRC Resection Rates for Different Age Groups
For persons age 50 years and older, overall CRC resection rates decreased from 1993 to 2009, with trends similar to those observed for all adults (Figure 2A and B, Table 1). In contrast, the overall CRC resection rates increased by 1.3% (95% CI, 0.8%–1.8%) per year for persons aged 40–49 years and by 2.4% (95% CI, 1.7%–3.1%) per year for persons aged 18–39 years from 1993 to 2009 (Figure 2C and D, Table 1).
Figure 2.

US overall colorectal cancer resection rates by age group. In contrast with decreasing rates in adults eligible for screening, increasing rates were observed in younger adults. Curves show the results of Joinpoint analyses. (A) Persons aged ≥76 years, (B) persons aged 50–75 years, (C) persons aged 40–49 years, and (D) persons aged 18–39 years.
The trends in distal CRC resection rates in the older age groups were similar to those observed for all adults. For persons aged 76 years and older, distal CRC resection rates decreased by 3.0% (95% CI, 1.9%– 4.1%) per year from 1993 to 2000, with an accelerated decline of 5.8% (5.0%–6.6%) per year from 2000 to 2009 (P < .001) (Figure 3A, Table 1). For persons aged 50 –75 years, distal CRC resection rates showed a decrease of 0.9% (95% CI, −0.3% to 2.2%) per year from 1993 to 1999 that was not statistically significant, and a decrease of 3.9% (95% CI, 3.4%– 4.5%) per year from 1999 to 2009 (P < .001) (Figure 3C, Table 1).
Figure 3.

US distal and proximal colorectal cancer resection rates by age group. Curves show the results of Joinpoint analyses. (A) Distal colorectal cancer in persons age ≥76 years. (B) Proximal colon cancer in persons age ≥76 years. (C) Distal colorectal cancer in persons age 50–75 years. (D) Proximal colon cancer in persons age 50–75 years. (E) Distal colorectal cancer in persons age 18–39 and 40–49 years. (F) Proximal colon cancer in persons age 18–39 and 40–49 years.
The trends in proximal CRC resection rates in older age groups also were similar to those observed for all adults. For persons aged 76 years and older, proximal CRC resection rates decreased by 1.1% (95% CI, 0.3%–2.0%) per year from 1993 to 2001, and by 3.6% (2.8%– 4.4%) per year from 2001 to 2009 (P < .001) (Figure 3B, Table 1). For persons aged 50 –75 years, there was no significant decrease in the proximal CRC resection rate from 1993 to 2002, and a decrease of 3.1% (95% CI, 2.1%– 4.0%) per year was observed from 2002 to 2009 (P < .001) (Figure 3D, Table 1).
For persons aged 50 – 64 years, distal CRC resection rates showed a significant decrease of 3.3% (95% CI, 2.3%–4.3%) per year only after 2001, whereas proximal CRC resection rates showed an increase of 0.8% (95% CI, 0.3%–1.4%) per year before 2003 and then a decrease of 3.3% (95% CI, 2.2%– 4.4%) per year from 2003 to 2009 (P < .001). For persons aged 65–75 years, distal CRC resection decreased by 1.7% (95% CI, 0.6%–2.8%) per year from 1993 to 1999, followed by an accelerated decline of 4.8% (95% CI, 4.3%–5.4%) per year from 1999 to 2009 (P < .001), whereas proximal CRC resection rates declined significantly at a rate of 3.2% (95% CI, 2.1%– 4.4%) per year only after 2002.
In contrast to decreases in both distal and proximal CRC resection rates observed in older adults, increases in both distal and proximal CRC resection rates were observed in persons aged 40–49 years and 18–39 years (Figure 3E and F; Table 1). In these younger age groups, the increases in resection rates were more prominent for distal than for proximal CRC (Table 1).
CRC Resection Rates for Women Versus Men
Analyses stratified by sex showed similar overall trends for women and men (Figure 4, Tables 2 and 3). For both sexes, distal CRC resection rates showed significant decreases from 1993 to 1999, and then accelerated decreases from 1999 to 2009 (Figure 4, Tables 2 and 3). For women, proximal CRC resection rates showed no significant change from 1993 to 2002, but a significant decrease after 2002. For men, proximal CRC resection rates decreased by 1.0% (95% CI, 0.3%–1.7%) per year from 1993 to 2001, followed by an accelerated decrease after 2001.
Figure 4.

US colorectal cancer resection rates by sex. Curves show the results of Joinpoint analyses. (A) Colorectal cancer overall in women, (B) colorectal cancer overall in men, (C) distal colorectal cancer in women, (D) distal colorectal cancer in men, (E) proximal colon cancer in women, and (F) proximal colon cancer in men.
Table 2.
Temporal Trend in CRC Resection Rates for Women
| Age-adjusted surgery rate per 100,000 persons (95% CI)
|
Trend 1
|
Trend 2
|
||||
|---|---|---|---|---|---|---|
| 1993 | 2009 | Time period | Annual percentage change (95% CI) | Time period | Annual percentage change (95% CI) | |
| All adults (age ≥18 y) | ||||||
| All colorectal cancer | 61.2 (56.1–66.4) | 41.8 (37.8–45.7) | 1993–2001 | −0.8 (−1.5 to −0.1) | 2001–2009 | −3.6 (−4.3 to −2.8) |
| Proximal colon cancer | 27.9 (25.0–30.7) | 21.5 (19.2–23.8) | 1993–2002 | 0.0 (−0.7 to 0.8) | 2002–2009 | −3.3 (−4.4 to −2.1) |
| Distal colorectal cancer | 31.4 (28.1–34.7) | 19.1 (16.8–21.5) | 1993–1999 | −1.2 (−2.2 to −0.2) | 1999–2009 | −3.9 (−4.3 to −3.4) |
| Age ≥76 y | ||||||
| All colorectal cancer | 332.9 (309.3–356.5) | 199.4 (182.3–216.5) | 1993–2001 | −1.5 (−2.4 to −0.7) | 2001–2009 | −4.6 (−5.5 to −3.7) |
| Proximal colon cancer | 179.7 (164.1–195.4) | 126.2 (114.5–137.9) | 1993–2001 | −0.6 (−1.8 to 0.5) | 2001–2009 | −3.5 (−4.6 to −2.4) |
| Distal colorectal cancer | 143.4 (130.5–156.2) | 68.4 (60.4–76.4) | 1993–2000 | −2.4 (−3.4 to −1.4) | 2000–2009 | −6.0 (−6.7 to −5.2) |
| Age 50–75 y | ||||||
| All colorectal cancer | 110.1 (101.0–119.3) | 74.8 (68.1–81.4) | 1993–2002 | −0.9 (−1.5 to −0.3) | 2002–2009 | −3.9 (−4.8 to −3.0) |
| Proximal colon cancer | 44.7 (40.2–49.3) | 36.2 (32.4–40.1) | 1993–2002 | 0.7 (−0.3 to 1.6) | 2002–2009 | −3.3 (−4.6 to −1.9) |
| Distal colorectal cancer | 61.8 (55.6–68.1) | 36.5 (32.6–40.5) | 1993–1999 | −1.4 (−2.7 to −0.1) | 1999–2009 | −4.0 (−4.6 to −3.4) |
| Age 40–49 y | ||||||
| All colorectal cancer | 14.1 (12.0–16.3) | 17.1 (14.7–19.5) | 1993–2009 | 1.1 (0.3–2.0) | — | — |
| Proximal colon cancer | 5.1 (3.9–6.2) | 5.1 (4.0–6.1) | 1993–2009 | 0.6 (−0.3 to 1.5) | — | — |
| Distal colorectal cancer | 8.6 (7.1–10.2) | 11.4 (9.5–13.3) | 1993–2009 | 1.4 (0.4–2.3) | — | — |
| Age 18–39 y | ||||||
| All colorectal cancer | 2.2 (1.7–2.7) | 2.9 (2.4–3.4) | 1993–2009 | 2.8 (1.8–3.9) | — | — |
| Proximal colon cancer | 0.7 (0.4–0.9) | 0.8 (0.6–1.1) | 1993–2009 | 2.9 (1.2–4.5) | — | — |
| Distal colorectal cancer | 1.5 (1.1–1.9) | 2.0 (1.6–2.4) | 1993–2009 | 3.1 (1.9–4.2) | — | — |
Table 3.
Temporal Trend in CRC Resection Rates for Men
| Age-adjusted surgery rate per 100,000 persons (95% CI)
|
Trend 1
|
Trend 2
|
||||
|---|---|---|---|---|---|---|
| 1993 | 2009 | Time period | Annual percentage change (95% CI) | Time period | Annual percentage change (95% CI) | |
| All adults (age ≥ 18 y) | ||||||
| All colorectal cancer | 85.6 (78.4–92.8) | 53.9 (48.9–58.9) | 1993–1999 | −1.1 (−2.2 to −0.1) | 1999–2009 | −3.4 (−3.9 to −2.9) |
| Proximal colon cancer | 33.3 (29.6–37.0) | 24.1 (21.4–26.7) | 1993–2001 | −1.0 (−1.7 to −0.3) | 2001–2009 | −2.9 (−3.6 to −2.3) |
| Distal colorectal cancer | 49.2 (44.3–54.1) | 28.1 (24.9–31.4) | 1993–1999 | −1.5 (−2.9 to −0.2) | 1999–2009 | −4.0 (−4.6 to −3.4) |
| Age ≥76 y | ||||||
| All colorectal cancer | 482.4 (443.4–521.4) | 243.6 (220.7–266.5) | 1993–2000 | −2.8 (−3.8 to −1.7) | 2000–2009 | −4.8 (−5.5 to −4.1) |
| Proximal colon cancer | 222.7 (199.1–246.3) | 138.8 (124.5–153.2) | 1993–2001 | −2.0 (−2.7 to −1.4) | 2001–2009 | −3.9 (−4.5 to −3.3) |
| Distal colorectal cancer | 244.5 (220.8–268.2) | 98.3 (85.7–110.8) | 1993–2009 | −5.0 (−5.4 to −4.5) | — | — |
| Age 50–75 y | ||||||
| All colorectal cancer | 151.5 (139.5–163.6) | 101.8 (93.1–110.5) | 1993–1999 | −0.3 (−1.4 to 0.8) | 1999–2009 | −3.3 (−3.8 to −2.8) |
| Proximal colon cancer | 51.1 (45.9–56.3) | 40.8 (36.7–44.9) | 1993–2002 | −0.3 (−1.1 to 0.5) | 2002–2009 | −2.9 (−4.0 to −1.8) |
| Distal colorectal cancer | 94.3 (85.6–103.0) | 57.8 (52.0–63.7) | 1993–1999 | −0.7 (−2.0 to 0.7) | 1999–2009 | −3.9 (−4.5 to −3.3) |
| Age 40–49 y | ||||||
| All colorectal cancer | 17.8 (15.3–20.4) | 20.4 (17.9–22.9) | 1993–2009 | 1.3 (0.9–1.6) | — | — |
| Proximal colon cancer | 5.7 (4.4–7.1) | 5.6 (4.6–6.7) | 1993–2009 | 1.0 (0.1–1.8) | — | — |
| Distal colorectal cancer | 11.3 (9.4–13.3) | 13.8 (11.8–15.7) | 1993–2009 | 1.5 (1.1–1.9) | — | — |
| Age 18–39 y | ||||||
| All colorectal cancer | 2.7 (2.2–3.3) | 3.2 (2.6–3.7) | 1993–2009 | 1.9 (1.2–2.6) | — | — |
| Proximal colon cancer | 1.1 (0.8–1.4) | 1.2 (0.9–1.5) | 1993–2009 | 1.1 (0.2–1.9) | — | — |
| Distal colorectal cancer | 1.5 (1.1–1.9) | 1.8 (1.4–2.2) | 1993–2009 | 2.6 (1.8–3.4) | — | — |
Discussion
Our analysis of CRC resection rates in the United States shows differences in temporal trends for proximal vs distal CRC, and for older vs younger persons. For all adults, the distal CRC resection rate decreased from 1993 to 1999, followed by an accelerated decrease from 1999 to 2009. In contrast, the proximal CRC resection rate decreased significantly only after 2002. These trends for all adults reflect the trends for persons age 50 years and older, in whom most cases of CRC are diagnosed.1 In contrast, significant increases in both proximal and distal CRC resection rates were observed in persons younger than 50 years of age. The extent to which colonoscopy protects against proximal CRC is unclear,19-21 and whether colonoscopy, as practiced in the community, protects against proximal CRC is a pressing public health question. Our results are consistent with the hypothesis that population-level decreases in distal CRC resection rates are associated with CRC screening in general, but that implementation of screening colonoscopy specifically, which began with its inclusion in screening guidelines in 1997 and was established firmly in routine practice with the decision by Medicare to cover screening colonoscopy for average-risk persons in 2001, may be one important factor contributing to population-level decreases in proximal CRC resection rates.
There have not been changes in the surgical management of proximal vs distal CRC that would explain the trends we observed. Consequently, the contrasting trends in proximal vs distal CRC resection rates reflect contrasting trends in incidence.28 Our estimated annual CRC resection rates are slightly lower than the reported CRC incidence rates based on data from the SEER program.1,36 This is explained by the fact that federal hospitals are not included in the NIS, and that a very small number of patients with CRC do not undergo surgical resection.28
Trends in cancer incidence rates reflect changes in risk factors and preventive interventions such as screening for premalignant lesions, but probably not changes in genetic factors given the short time scale. Various data sources document the increase in CRC screening in the US population over time, and the dominant role of screening colonoscopy in the past decade.7-16,37-39 These include national surveys,7-12,37,38 claims data,13-15,39 and endoscopic databases.16,39
Data from the Behavioral Risk Factor Surveillance System (BRFSS) show a steady increase in the fraction of Americans who have been screened for CRC, with a progressive increase in the use of lower endoscopy and a decrease in the use of FOBT.7-10 The BRFSS does not differentiate between sigmoidoscopy and colonoscopy. Data from the National Health Interview Survey show similar trends.37,38 In 2000, the National Health Interview Survey distinguished for the first time between sigmoidoscopy and colonoscopy. Between 2000 and 2003, the fraction of people who reported having had a colonoscopy increased from 19% to 30% in women older than age of 50 years, and from 20% to 34% in men older than age of 50 years, whereas FOBT and sigmoidoscopy use decreased.11,12
Claims data from Medicare and Tricare data show increases of 45% and 34% in colonoscopy volume from 1999 to 2001, with complementary decreases in the volumes of sigmoidoscopies and barium enemas.13 Colonoscopy use accounts for most of the increase over time in the fraction of Medicare enrollees who are up to date with CRC screening, with approximately 15% of Medicare enrollees having undergone colonoscopy in 1999, and more than 30% in 2003.14,15 Data from the Clinical Outcomes Research Initiative show a dramatic increase in the rate of screening colonoscopy between 1998 and 2002.16 In both Medicare claims and Clinical Outcomes Research Initiative data, colonoscopy accounted for approximately 70% of all lower endoscopies in 1999, and approximately 90% in 2003.39
Figure 5 shows our principal results and data on the prevalence of CRC screening from the BRFSS40 and identification of landmark years in the history of CRC screening. It is worth emphasizing that early detection may decrease CRC mortality, but that any screening-related decrease in CRC incidence is the result of removal of precancerous lesions. The USPSTF first endorsed CRC screening with FOBT and flexible sigmoidoscopy in 1996. Medicare extended coverage for these services in average-risk persons and for colonoscopy in high-risk persons in 1997. Colonoscopy was included as a CRC screening option in guidelines proposed by the American Cancer Society and national gastroenterology societies in 1997.41 The USPSTF first included colonoscopy as a screening option in 2002,42 and again in 2008.29 The multisociety guidelines continued to include screening colonoscopy as an option in 2003,43 and identified it in 2008 as one of the screening tests that detect both adenomas and CRC, and not primarily CRC such as with fecal-based tests.44 Medicare extended coverage for screening colonoscopy in average-risk persons in 2001, with similar decisions by commercial insurers. It is likely that both guidelines and insurance coverage have had an impact on the use of CRC screening tests. Overall, we observed comparable trends for age subgroups 50–64 years, for which Medicare is not a major insurer, and 65–75 years, for which Medicare is the major insurer.
Figure 5.
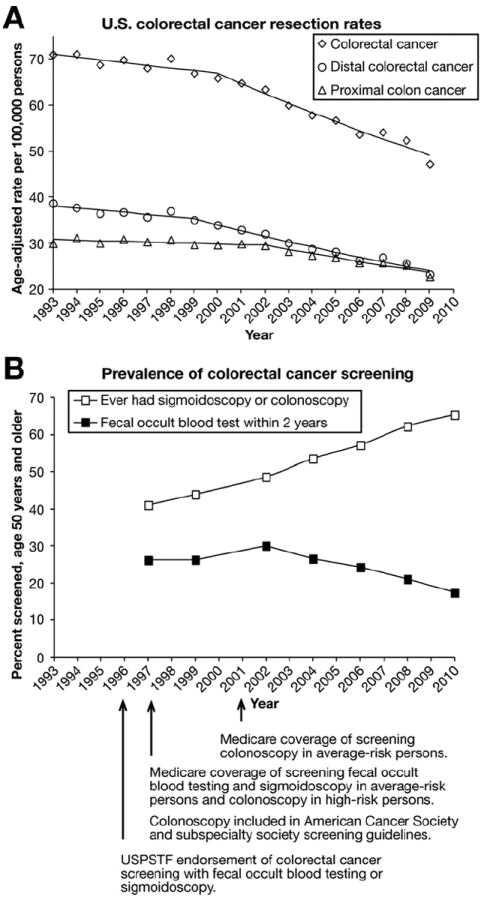
Trends in colorectal cancer resection rates and use of screening tests. (A) US colorectal cancer resection rates for all adults. Curves show the results of Joinpoint analyses. (B) Data on the prevalence of colorectal cancer screening in adults age 50 years and older from the Behavior Risk Factor Surveillance System.40 Colonoscopy has been the most common screening test since Medicare’s decision to cover screening colonoscopy in average-risk persons in 2001, and similar decisions by commercial insurers. The American Cancer Society and subspecialty society guidelines endorsed screening colonoscopy in 1997, and the US Preventive Services Task Force endorsed it in 2002. Colonoscopy accounted for most lower endoscopies in the past decade, and sigmoidoscopy accounted for only a small fraction. Proximal colon cancer resection rates began decreasing only in the era of screening colonoscopy.
As illustrated in Figure 5, proximal CRC resection rates began to decrease significantly only in the period when screening colonoscopy came to dominate CRC screening. It is likely that the use of screening colonoscopy began to increase gradually in the late 1990s, possibly in relation to the evolution in guidelines, but data from that period do not allow a clear distinction between the use of sigmoidoscopy and colonoscopy (Figure 5).7-10 If increased use of colonoscopy with polypectomy were the main factor explaining the eventual decrease in proximal CRC resection rates, a lag period of several years such as the one that was observed (Figure 5) would be expected, given that the malignant transformation from adenoma to invasive CRC takes years. It is unlikely that FOBT or sigmoidoscopy use explain the trend in proximal CRC resection rates because FOBT uptake rates have been relatively flat over time, and have decreased in the past decade (Figure 5), whereas sigmoidoscopy use has decreased substantially.7-10
Our findings that CRC resection rates have increased in adults younger than age 50 years corroborate similar reports based on SEER data.45,46 These trends probably reflect an increase in the prevalence of CRC risk factors47 and the absence of screening in these younger adults. Although a lower threshold to use colonoscopy to evaluate symptoms could have shifted some cases of CRC that might otherwise have been diagnosed shortly after age 50 years to a diagnosis shortly before age 50 years, we do not believe that this is likely to explain the steady increases in CRC resection rates observed over the long study period for persons aged 18–39 years as well as those aged 40–49 years. The possible causes for the observed increases merit further study. If the increases in CRC resection rates in younger adults reflect the underlying natural history in older adults, then the presumed impact of screening would be greater than it appears. If specific subgroups of younger persons at higher CRC risk can be identified, then screening guidelines for such subgroup may need to be developed.
The results for women and men were similar overall, with one potentially important difference. In both sexes, proximal CRC resection rates showed substantial decreases starting several years after distal CRC resection rates showed accelerated decreases. However, in women, proximal CRC resection rates did not show any significant change before 2002, whereas in men, they did show a 1.0% (95% CI, 0.3%–1.7%) annual decrease from 1993 to 2001. It is not clear whether sex-specific differences in screening methods, effectiveness, or other factors account for this contrasting result between sexes.
Our study had several limitations. First, because the NIS does not contain data on CRC risk factors or screening, we were unable to investigate patient-level associations between CRC resection rates and these predictors, or to provide information that refines the estimate of colonoscopy’s impact on proximal CRC risk and the factors that influence that effect. Second, although the temporal trends in CRC resection rates coincide with major public health events related to screening guidelines and insurance coverage (Figure 5), we cannot establish a cause-and-effect relationship. Alternative or additional relevant factors could include changes in use of medications with chemopreventive benefit such as nonsteroidal agents or hormone replacement therapy, changes in the prevalence of other risk factors such as smoking, and the evolution in the practice of colonoscopy, with growing attention to quality measures such as preparation, cecal intubation rate, adenoma detection rate, and identification of flat lesions. Third, it is recommended that trend analysis using the NIS be performed only starting in 1993,25 and we therefore did not study earlier years. Fourth, a very small number of patients could have had more than one CRC resection.28 Fifth, analyses of secular trends can suggest an association, but not establish causation. However, as noted in analyses of breast cancer incidence, major changes in cancer incidence over time provide a unique opportunity to examine the possible impact of preventive interventions and other risk factors.24 Sixth, analyses stratified by race and ethnicity were not performed given the limitations of race and ethnicity data provided in NIS for certain states.
In conclusion, distal CRC resection rates in the United States decreased significantly in the past 2 decades, more markedly in recent years. In contrast, proximal CRC resection rates decreased significantly only in the past decade, which coincides with the implementation and increase in the use of screening colonoscopy. In adults younger than age 50 years, CRC resection rates increased, which probably reflects changes in the prevalence of risk factors and merits further study. In the context of national CRC screening trends, our results are consistent with the hypothesis that population-level decreases in distal CRC resection rates are associated with CRC screening in general, and that screening colonoscopy specifically may be one important factor contributing to population-level decreases in proximal CRC resection rates.
Acknowledgments
Funding
Supported by a National Institutes of Health T32 training grant (T32DK007056 to P.A.M.).
Abbreviations used in this paper
- APC
annual percentage change
- BRFSS
Behavioral Risk Factor Surveillance System
- CI
confidence interval
- CRC
colorectal cancer
- FOBT
fecal occult blood testing
- NIS
Nationwide Inpatient Sample
- SEER
Surveillance Epidemiology and End Results
- USPSTF
US Preventive Services Task Force
Footnotes
Presented in part at Digestive Disease Week, May 19–22 2012, San Diego, CA.
Conflicts of interest
The authors disclose no conflicts.
References
- 1.Siegel R, Naishadham D, Jemal A. Cancer statistics, 2012. CA Cancer J Clin. 2012;62:10–29. doi: 10.3322/caac.20138. [DOI] [PubMed] [Google Scholar]
- 2.Edwards BK, Ward E, Kohler BA, et al. Annual report to the nation on the status of cancer, 1975–2006, featuring colorectal cancer trends and impact of interventions (risk factors, screening, and treatment) to reduce future rates. Cancer. 2010;116:544–573. doi: 10.1002/cncr.24760. [DOI] [PMC free article] [PubMed] [Google Scholar]
- 3.Atkin WS, Edwards R, Kralj-Hans I, et al. Once-only flexible sigmoidoscopy screening in prevention of colorectal cancer: a multicentre randomised controlled trial. Lancet. 2010;375:1624–1633. doi: 10.1016/S0140-6736(10)60551-X. [DOI] [PubMed] [Google Scholar]
- 4.Mandel JS, Bond JH, Church TR, et al. Reducing mortality from colorectal cancer by screening for fecal occult blood. Minnesota Colon Cancer Control Study. N Engl J Med. 1993;328:1365–1371. doi: 10.1056/NEJM199305133281901. [DOI] [PubMed] [Google Scholar]
- 5.Mandel JS, Church TR, Bond JH, et al. The effect of fecal occult-blood screening on the incidence of colorectal cancer. N Engl J Med. 2000;343:1603–1607. doi: 10.1056/NEJM200011303432203. [DOI] [PubMed] [Google Scholar]
- 6.Segnan N, Armaroli P, Bonelli L, et al. Once-only sigmoidoscopy in colorectal cancer screening: follow-up findings of the Italian Randomized Controlled Trial–SCORE. J Natl Cancer Inst. 2011;103:1310–1322. doi: 10.1093/jnci/djr284. [DOI] [PubMed] [Google Scholar]
- 7.Screening for colorectal cancer–United States, 1992–1993, and new guidelines. MMWR Morb Mortal Wkly Rep. 1996;45:107–110. [PubMed] [Google Scholar]
- 8.Janes GR, Blackman DK, Bolen JC, et al. Surveillance for use of preventive health-care services by older adults, 1995–1997. MMWR CDC Surveill Summ. 1999;48:51–88. [PubMed] [Google Scholar]
- 9.Trends in screening for colorectal cancer–United States, 1997 and 1999. MMWR Morb Mortal Wkly Rep. 2001;50:162–166. [PubMed] [Google Scholar]
- 10.Vital signs: colorectal cancer screening, incidence, and mortality–United States, 2002-2010. MMWR Morb Mortal Wkly Rep. 2011;60:884–889. [PubMed] [Google Scholar]
- 11.Meissner HI, Breen N, Klabunde CN, et al. Patterns of colorectal cancer screening uptake among men and women in the United States. Cancer Epidemiol Biomarkers Prev. 2006;15:389–394. doi: 10.1158/1055-9965.EPI-05-0678. [DOI] [PubMed] [Google Scholar]
- 12.Phillips KA, Liang SY, Ladabaum U, et al. Trends in colonoscopy for colorectal cancer screening. Med Care. 2007;45:160–167. doi: 10.1097/01.mlr.0000246612.35245.21. [DOI] [PubMed] [Google Scholar]
- 13.Robertson RH, Burkhardt JH, Powell MP, et al. Trends in colon cancer screening procedures in the US Medicare and Tricare populations: 1999–2001. Prev Med. 2006;42:460–462. doi: 10.1016/j.ypmed.2006.01.014. [DOI] [PubMed] [Google Scholar]
- 14.Fenton JJ, Tancredi DJ, Green P, et al. Persistent racial and ethnic disparities in up-to-date colorectal cancer testing in medicare enrollees. J Am Geriatr Soc. 2009;57:412–418. doi: 10.1111/j.1532-5415.2008.02143.x. [DOI] [PubMed] [Google Scholar]
- 15.Schenck AP, Peacock SC, Klabunde CN, et al. Trends in colorectal cancer test use in the medicare population, 1998–2005. Am J Prev Med. 2009;37:1–7. doi: 10.1016/j.amepre.2009.03.009. [DOI] [PubMed] [Google Scholar]
- 16.Harewood GC, Lieberman DA. Colonoscopy practice patterns since introduction of medicare coverage for average-risk screening. Clin Gastroenterol Hepatol. 2004;2:72–77. doi: 10.1016/s1542-3565(03)00294-5. [DOI] [PubMed] [Google Scholar]
- 17.Winawer SJ, Zauber AG, Ho MN, et al. Prevention of colorectal cancer by colonoscopic polypectomy. The National Polyp Study Workgroup. N Engl J Med. 1993;329:1977–1981. doi: 10.1056/NEJM199312303292701. [DOI] [PubMed] [Google Scholar]
- 18.Lieberman DA, Weiss DG, Bond JH, et al. Use of colonoscopy to screen asymptomatic adults for colorectal cancer. Veterans Affairs Cooperative Study Group 380. N Engl J Med. 2000;343:162–168. doi: 10.1056/NEJM200007203430301. [DOI] [PubMed] [Google Scholar]
- 19.Baxter NN, Goldwasser MA, Paszat LF, et al. Association of colonoscopy and death from colorectal cancer. Ann Intern Med. 2009;150:1–8. doi: 10.7326/0003-4819-150-1-200901060-00306. [DOI] [PubMed] [Google Scholar]
- 20.Brenner H, Hoffmeister M, Arndt V, et al. Protection from right- and left-sided colorectal neoplasms after colonoscopy: population-based study. J Natl Cancer Inst. 2010;102:89–95. doi: 10.1093/jnci/djp436. [DOI] [PubMed] [Google Scholar]
- 21.Neugut AI, Lebwohl B. Colonoscopy vs sigmoidoscopy screening: getting it right. JAMA. 2010;304:461–462. doi: 10.1001/jama.2010.1001. [DOI] [PubMed] [Google Scholar]
- 22.Baxter NN, Sutradhar R, Forbes SS, et al. Analysis of administrative data finds endoscopist quality measures associated with postcolonoscopy colorectal cancer. Gastroenterology. 2011;140:65–72. doi: 10.1053/j.gastro.2010.09.006. [DOI] [PubMed] [Google Scholar]
- 23.Brenner H, Chang-Claude J, Seiler CM, et al. Protection from colorectal cancer after colonoscopy: a population-based, case-control study. Ann Intern Med. 2011;154:22–30. doi: 10.7326/0003-4819-154-1-201101040-00004. [DOI] [PubMed] [Google Scholar]
- 24.Ravdin PM, Cronin KA, Howlader N, et al. The decrease in breast-cancer incidence in 2003 in the United States. N Engl J Med. 2007;356:1670–1674. doi: 10.1056/NEJMsr070105. [DOI] [PubMed] [Google Scholar]
- 25.HCUP Nationwide Inpatient Sample (NIS) Healthcare Cost and Utilization Project (HCUP) Agency for Healthcare Research and Quality; Rockville, MD: 1993–2009. [January 10, 2012]. Available: www.hcup-us.ahrq.gov/nisoverview.jsp. [Google Scholar]
- 26.Hollenbeck BK, Taub DA, Dunn RL, et al. Quality of care: partial cystectomy for bladder cancer–a case of inappropriate use? J Urol. 2005;174:1050–1054. doi: 10.1097/01.ju.0000169477.30477.3d. discussion, 1054. [DOI] [PubMed] [Google Scholar]
- 27.Schlansky B, Sonnenberg A. Epidemiology of noncardia gastric adenocarcinoma in the United States. Am J Gastroenterol. 2011;106:1978–1985. doi: 10.1038/ajg.2011.213. [DOI] [PubMed] [Google Scholar]
- 28.Wingo PA, Guest JL, McGinnis L, et al. Patterns of inpatient surgeries for the top four cancers in the United States, National Hospital Discharge Survey, 1988–95. Cancer Causes Control. 2000;11:497–512. doi: 10.1023/a:1008944209648. [DOI] [PubMed] [Google Scholar]
- 29.Screening for colorectal cancer: US Preventive Services Task Force recommendation statement. Ann Intern Med. 2008;149:627–637. doi: 10.7326/0003-4819-149-9-200811040-00243. [DOI] [PubMed] [Google Scholar]
- 30.International Classification of Diseases, Ninth Revision, Clinical Modification (ICD-9-CM) Centers for Disease Control and Prevention; [January 10, 2012]. Available: http://www.cdc.gov/nchs/icd/icd9cm.htm. [Google Scholar]
- 31.National Center for Health Statistics. Bridged-race intercensal estimates of the July 1, 1990–July 1, 1999, United States resident population by county, single-year of age, sex, race, and Hispanic origin. Prepared by the U.S. Census Bureau with support from the National Cancer Institute; [January 10, 2012]. Released July 26, 2004. Available: www.cdc.gov/nchs/nvss/bridged_race.htm. [Google Scholar]
- 32.National Center for Health Statistics. Postcensal estimates of the resident population of the United States for July 1, 2000-July 1, 2009, by year, county, age, bridged race, Hispanic origin, and sex (Vintage 2009) Prepared under a collaborative arrangement with the US Census Bureau; [January 10, 2012]. released June 20, 2010. Available: www.cdc.gov/nchs/nvss/bridged_race.htm. [Google Scholar]
- 33.Day JC. US Bureau of the Census, current population reports, P25-1130. Washington, DC: U.S. Government Printing Office; 1996. [January 10, 2012]. Population projections of the United States by age, sex, race, and Hispanic origin: 1995 to 2050. Available: http://www.census.gov/prod/1/pop/p25-1130/p251130.pdf. [Google Scholar]
- 34.JoinPoint Regression Program, version 3.5–April 2011. Statistical Methodology and Applications Branch and Data Modeling Branch, Surveillance Research Program National Cancer Institute; [January 10, 2012]. Available: http://surveillance.cancer.gov/joinpoint/ [Google Scholar]
- 35.Kim HJ, Fay MP, Feuer EJ, et al. Permutation tests for joinpoint regression with applications to cancer rates. Stat Med. 2000;19:335–351. doi: 10.1002/(sici)1097-0258(20000215)19:3<335::aid-sim336>3.0.co;2-z. [DOI] [PubMed] [Google Scholar]
- 36.Schootman M, Lian M, Deshpande AD, et al. Temporal trends in geographic disparities in small-area-level colorectal cancer incidence and mortality in the United States. Cancer Causes Control. 2011;22:1173–1181. doi: 10.1007/s10552-011-9796-6. [DOI] [PMC free article] [PubMed] [Google Scholar]
- 37.Chen X, White MC, Peipins LA, et al. Increase in screening for colorectal cancer in older Americans: results from a national survey. J Am Geriatr Soc. 2008;56:1511–1516. doi: 10.1111/j.1532-5415.2008.01796.x. [DOI] [PubMed] [Google Scholar]
- 38.Swan J, Breen N, Coates RJ, et al. Progress in cancer screening practices in the United States: results from the 2000 National Health Interview Survey. Cancer. 2003;97:1528–1540. doi: 10.1002/cncr.11208. [DOI] [PubMed] [Google Scholar]
- 39.Sonnenberg A, Amorosi SL, Lacey MJ, et al. Patterns of endoscopy in the United States: analysis of data from the Centers for Medicare and Medicaid Services and the National Endoscopic Database. Gastrointest Endosc. 2008;67:489–496. doi: 10.1016/j.gie.2007.08.041. [DOI] [PubMed] [Google Scholar]
- 40.Centers for Disease Control and Prevention. Office of Surveillance, Epidemiology, and Laboratory Services. [January 10, 2012];Behavioral Risk Factor Surveillance System. Available: http://apps.nccd.cdc.gov/brfss.
- 41.Winawer SJ, Fletcher RH, Miller L, et al. Colorectal cancer screening: clinical guidelines and rationale. Gastroenterology. 1997;112:594–642. doi: 10.1053/gast.1997.v112.agast970594. [DOI] [PubMed] [Google Scholar]
- 42.US Preventive Services Task Force. Screening for colorectal cancer: recommendation and rationale. Ann Intern Med. 2002;137:129–131. doi: 10.7326/0003-4819-137-2-200207160-00014. [DOI] [PubMed] [Google Scholar]
- 43.Winawer S, Fletcher R, Rex D, et al. Colorectal cancer screening and surveillance: clinical guidelines and rationale–update based on new evidence. Gastroenterology. 2003;124:544–560. doi: 10.1053/gast.2003.50044. [DOI] [PubMed] [Google Scholar]
- 44.Levin B, Lieberman DA, McFarland B, et al. Screening and surveillance for the early detection of colorectal cancer and adenomatous polyps, 2008: a joint guideline from the American Cancer Society, the US Multi-Society Task Force on Colorectal Cancer, and the American College of Radiology. Gastroenterology. 2008;134:1570–1595. doi: 10.1053/j.gastro.2008.02.002. [DOI] [PubMed] [Google Scholar]
- 45.Siegel RL, Jemal A, Ward EM. Increase in incidence of colorectal cancer among young men and women in the United States. Cancer Epidemiol Biomarkers Prev. 2009;18:1695–1698. doi: 10.1158/1055-9965.EPI-09-0186. [DOI] [PubMed] [Google Scholar]
- 46.O’Connell JB, Maggard MA, Liu JH, et al. Rates of colon and rectal cancers are increasing in young adults. Am Surg. 2003;69:866–872. [PubMed] [Google Scholar]
- 47.World Cancer Research Fund/American Institute for Cancer Research. Food, nutrition, physical activity, and the prevention of cancer: a global perspective. Washington, DC: AICR; 2007. [Google Scholar]