

Abstract
Background
Obesity and abdominal obesity are independently associated with morbidity and mortality. Physical activity attenuates these risks. We examined trends in obesity, abdominal obesity, physical activity, and caloric intake in U.S. adults from 1988 to 2010.
Methods
Univariate and multivariate analyses were performed using National Health and Nutrition Examination Survey (NHANES) data.
Results
Average body-mass index (BMI) increased by 0.37% (95% CI, 0.30-0.44%) per year in both women and men. Average waist circumference increased by 0.37% (95% CI, 0.30-0.43%) and 0.27% (95% CI, 0.22-0.32%) per year in women and men, respectively. The prevalence of obesity and abdominal obesity increased substantially, as did the prevalence of abdominal obesity among overweight adults. Younger women experienced the greatest increases. The proportion of adults who reported no leisure-time physical activity increased from 19.1% (95% CI, 17.3-21.0%) to 51.7% (95% CI, 48.9-54.5%) in women, and from 11.4% (95% CI, 10.0-12.8%) to 43.5% (95% CI, 40.7-46.3%) in men. Average daily caloric intake did not change significantly. BMI and waist circumference trends were associated with physical activity level, but not caloric intake. The associated changes in adjusted BMIs were 8.3% (95% CI, 6.9-9.6%) higher among women and 1.7% (95% CI, 0.68-2.8%) higher among men with no leisure-time physical activity compared to those with an ideal level of leisure-time physical activity.
Conclusions
Our analyses highlight important dimensions of the public health problem of obesity, including trends in younger women and in abdominal obesity, and lend support to the emphasis placed on physical activity by the Institute of Medicine.
Keywords: body-mass index, waist circumference, weight, diet, exercise, adiposity, calories, obesity, abdominal obesity, physical activity
Introduction
The Institute of Medicine (IOM) identifies obesity as a health issue of monumental importance to the nation.1 Obesity, defined as a body mass index (BMI) of ≥30 kg/m2, is associated with multiple comorbidities including cardiovascular disease and cancer, and higher risk of all-cause mortality.1, 2 Overweight, defined as a BMI of 25.0-29.9 kg/m2, has been associated with an increased risk of death in several studies.2-4 Over two thirds of U.S. adults are considered obese or overweight.5, 6 The cost of obesity-related illness approximates 20% of annual U.S. health care spending.1 Life expectancy could decline due to the effects of obesity.7
Increased waist circumference is an independent predictor of morbidity and mortality, even in persons with a normal BMI.8-11 The National Institutes of Health recommends measuring waist circumference in addition to weight and height in primary care practice in order to help guide weight management.12
The causes of obesity are multifactorial, and reflect the balance between energy intake and expenditure.1, 13 Physical activity is a key component of weight management.12 Of the IOM's five recommendations to address the national obesity epidemic, the first is to make physical activity an integral and routine part of life.1
Our aims were to characterize trends in, and associations between, overweight and obesity, abdominal obesity, physical activity, and caloric intake in U.S. adults in the last two decades. We explored trends in the prevalence of abdominal obesity within strata defined by BMI, given the health risks of increased waist circumference independent of BMI, and we explored the relationships between measures of obesity and levels of physical activity and caloric intake.
Methods
Data source
We used data from the National Health and Nutrition Examination Survey (NHANES), beginning with NHANES-III (1988-1994) and including the continuous NHANES 2-year survey cycles from 1999-2000 to 2009-2010.14 The samples in each cycle were selected using a stratified, multistage, clustered probability sampling design, described in detail before.15, 16
Study population
All examined participants of age 18 years and older, except pregnant women, were included. For the caloric intake analyses, only eligible participants who had reliable and complete 24-hour dietary recall data were included.
Subgroup analyses were performed for subgroups of self-identified race/ethnicity with sufficiently large samples: non-Hispanic white, non-Hispanic black, and Mexican-American.14
Definition of anthropometric measures
During the examination component of NHANES, height, weight and waist circumference were measured. Based on BMI, individuals were categorized as normal weight (18.5-24.99 kg/m2), overweight (25.0-29.99 kg/m2), or obese (30 kg/m2 or higher).8 Abdominal obesity was defined based on a waist circumference of >88 cm for women and >102 cm for men.8, 17
Definition of leisure-time physical activity levels
Participants were grouped into three levels of leisure-time physical activity: ideal, intermediate, and none. This was accomplished by following the methods and definitions of the specific NHANES surveys (Appendix).
Definition of dietary measures
Total caloric intake per day was estimated based on the total energy intake (kcal, or calories) reported in the first 24-hour recall data set. These data were obtained during the examination component of NHANES by trained dietary interviewers using an automated dietary interview system.15, 16
Statistical analyses
Analyses were performed for all adults, and after stratification by gender, predefined age strata of 18-39, 40-64, and 65 years and older, and race/ethnicity. Data from each cycle were considered to be from the mid-point of each period.
To examine trends in BMI, waist circumference and daily energy intake, we calculated national estimates of age-adjusted averages and 95% confidence intervals (CIs) for each survey cycle. We used linear regression to assess trends in log transformed BMI, waist circumference and daily energy intake by including the midpoints of each survey cycle as a continuous variable. In order to address possible changes in BMI trends over time, we used joinpoint analysis (Appendix).18 The results are expressed as annual percentage change (APC).
To examine trends in the prevalence of obesity, abdominal obesity and the levels of physical activity, we calculated national estimates of age-adjusted proportions and 95% CIs for each survey cycle. We assessed changes over time using logistic regression analysis by including the midpoints of each survey cycle as a continuous variable. We present odds ratios and 95% CIs reflecting the odds of fulfilling criteria for a specific category in a given year versus the previous year. We performed separate analyses to examine trends in abdominal obesity for overweight and obese adults, defined by BMI.
Analyses stratified by three pre-specified levels of leisure-time physical activity were performed for trends in the measures of obesity and daily energy intake. To examine the independent effects of physical activity and daily energy intake, we performed multivariate regression analysis with log transformed BMI and waist circumference as response variables, and year, physical activity level, and daily energy intake as explanatory variables, adjusted for age, age squared and gender. As sensitivity analyses, we first used only the continuous NHANES data, in which total minutes spent on physical activity can be estimated; and second, only data from 1999-2000 to 2005-2006, including activity related to transportation and domestic work, as the physical activity questionnaire was consistent in these cycles (Appendix).
All analyses were performed with appropriate survey procedures in SAS v9.3 (SAS Institute Inc., Cary, NC). Survey design variables and weight variables were used to account for the complexity of the NHANES survey design with stratification and clustering. Averages and prevalence rates were age-adjusted to the year 2000 U.S. standard population.19
Results
Body-Mass Index and Obesity
From 1988-1994 to 2009-2010, the average BMI in the U.S. increased by 0.37% (95% CI, 0.30-0.44%) per year in both women and men. Average BMI increased in all age and racial/ethnic groups (Figure 1, Table 1). The age subgroup with the greatest annual increase was 18-39 year-old women (Table 1). Joinpoint analyses identified a change in the trend for average BMI only in women, with annual increases of 0.60% (95% CI, 0.50-0.69%) from 1991 to 2002, and smaller annual increases of 0.22% (95% CI, 0.11-0.32%) from 2002 to 2010. Among women, average BMI was highest among non-Hispanic blacks and lowest among non-Hispanic whites; among men, it was similar across racial/ethnic groups (Figure 1, Table 1, Appendix Table 1).
Figure 1.
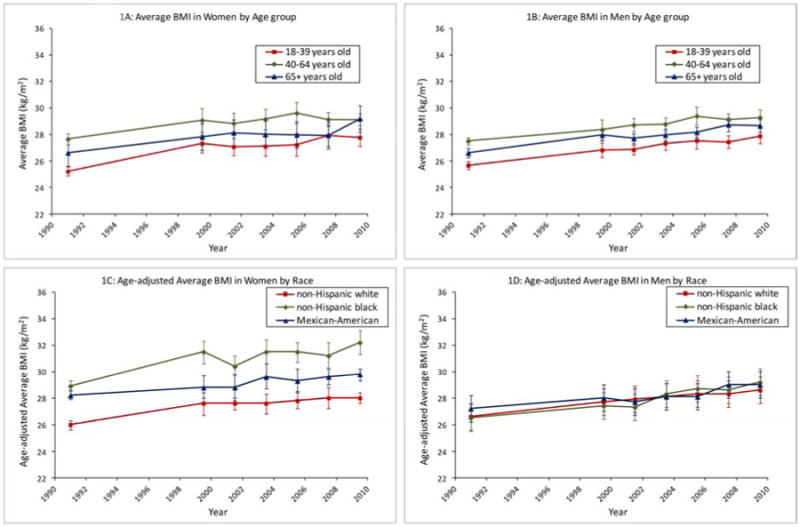
Trends in average body-mass index (BMI) in U.S. adults, 1988-2010. (A) Trends in women, by age-group. (B) Trends in men, by age-group. (C) Trends in women, by racial/ethnic group. (D) Trends in men, by racial/ethnic group.
Table 1. Trends in average body-mass index, waist circumference, and prevalence of obesity and abdominal obesity, U.S. adults, 1988-2010 *.
| Body mass index and waist circumference | Category based on body-mass index | Category based on waist circumference | ||||
|---|---|---|---|---|---|---|
| Mean body mass index in kg/m2 (95% CI) | Mean waist circumference in cm(95% CI) | Obese, % of population (95% CI) | Overweight, % of population(95% CI) | Normal weight, % of population(95% CI) | Abdominal obesity, % of population(95% CI) | |
| Women | ||||||
| 18 years and older | ||||||
| 1988-1994 | 26.4 (26.2-26.7) | 88.6 (87.9-89.3) | 24.9 (23.1-26.8) | 25.5 (24.1-26.9) | 45.7 (43.7-47.7) | 46.0 (43.9-48.0) |
| 2009-2010 | 28.6 (28.3-28.9) | 94.9 (93.9-95.8) | 35.4 (33.6-37.3) | 27.4 (24.5-30.3) | 34.3 (31.9-36.8) | 61.5 (58.8-64.2) |
| Trend | APC 0.37 (0.30-0.44) | APC 0.37 (0.30-0.43) | OR 1.026 (1.019-1.033) | OR 1.004 (0.997-1.011) | OR 0.976 (0.970-0.983) | OR 1.036 (1.029-1.044) |
| 18-39 years | ||||||
| 1988-1994 | 25.2 (24.8-25.6) | 83.2 (82.4-84.1) | 20.0 (17.6-22.3) | 19.4 (17.5-21.3) | 55.4 (52.8-58.0) | 29.3 (26.0-32.6) |
| 2009-2010 | 27.8 (27.1-28.4) | 91.3 (89.6-93.1) | 31.2 (27.9-34.5) | 23.4 (18.9-27.8) | 42.2 (37.4-47.0) | 49.1 (43.6-54.6) |
| Trend | APC 0.47 (0.35-0.59) | APC 0.49 (0.40-0.59) | OR 1.033 (1.022-1.044) | OR 1.011 (1.000-1.022) | OR 0.972 (0.963-0.981) | OR 1.046 (1.033-1.058) |
| 40-64 years | ||||||
| 1988-1994 | 27.6 (27.2-28.1) | 92.2 (91.2-93.2) | 30.6 (27.7-33.4) | 28.5 (26.2-30.7) | 38.3 (35.2-41.4) | 55.7 (52.8-58.6) |
| 2009-2010 | 29.1 (28.7-29.6) | 96.9 (95.9-97.9) | 38.5 (34.8-42.1) | 29.4 (26.0-32.8) | 29.4 (25.9-32.8) | 68.7 (65.3-72.0) |
| Trend | APC 0.26 (0.15-0.36) | APC 0.28 (0.20-0.36) | OR 1.018 (1.008-1.029) | OR 1.000 (0.990-1.009) | OR 0.982 (0.972-0.992) | OR 1.030 (1.020-1.040) |
| 65 years and older | ||||||
| 1988-1994 | 26.6 (26.3-26.9) | 93.2 (92.4-94.1) | 23.6 (21.4-25.9) | 33.3 (31.2-35.4) | 39.6 (36.7-42.4) | 63.7 (60.3-67.1) |
| 2009-2010 | 29.2 (28.5-29.9) | 98.5 (97.4-99.7) | 38.6 (33.5-43.7) | 32.5 (27.7-37.2) | 26.9 (23.6-30.3) | 74.9 (72.4-77.5) |
| Trend | APC 0.37 (0.27-0.48) | APC 0.26 (0.17-0.34) | OR 1.029 (1.017-1.041) | OR 1.002 (0.992-1.012) | OR 0.976 (0.966-0.987) | OR 1.028 (1.016-1.041) |
| 18 years and older, non-Hispanic white | ||||||
| 1988-1994 | 26.0 (25.6-26.3) | 87.7 (86.8-88.6) | 22.5 (20.3-24.8) | 24.2 (22.6-25.9) | 49.3 (46.8-51.8) | 43.2 (40.6-45.9) |
| 2009-2010 | 28.0 (27.6-28.4) | 94.2 (93.0-95.4) | 32.2 (29.1-35.3) | 26.8 (22.3-31.3) | 37.8 (34.6-41.0) | 59.0 (55.5-62.5) |
| Trend | APC 0.37 (0.27-0.47) | APC 0.38 (0.30-0.46) | OR 1.026 (1.016-1.035) | OR 1.007 (0.998-1.016) | OR 0.975 (0.967-0.984) | OR 1.037 (1.027-1.047) |
| 18 years and older, non-Hispanic black | ||||||
| 1988-1994 | 28.9 (28.5-29.3) | 93.6 (92.7-94.5) | 37.4 (34.7-40.0) | 29.3 (27.5-31.1) | 30.4 (28.0-32.8) | 60.2 (57.6-62.8) |
| 2009-2010 | 32.2 (31.3-33.1) | 100.5 (98.3-102.7) | 57.3 (51.8-62.8) | 23.4 (20.2-26.6) | 17.1 (13.7-20.5) | 75.9 (69.9-81.9) |
| Trend | APC 0.51 (0.37-0.64) | APC 0.38 (0.28-0.48) | OR 1.039 (1.028-1.050) | OR 0.987 (0.979-0.996) | OR 0.963 (0.952-0.974) | OR 1.038 (1.025-1.052) |
| 18 years and older, Mexican-American | ||||||
| 1988-1994 | 28.2 (27.9-28.6) | 92.4 (91.7-93.2) | 34.1 (31.4-36.8) | 33.1 (30.9-35.3) | 31.3 (28.5-34.0) | 60.7 (58.5-62.9) |
| 2009-2010 | 29.8 (29.3-30.2) | 97.4 (96.1-98.7) | 43.8 (40.4-47.1) | 34.0 (30.4-37.7) | 21.5 (18.6-24.3) | 74.1 (69.9-78.3) |
| Trend | APC 0.32 (0.21-0.44) | APC 0.38 (0.28-0.47) | OR 1.027 (1.014-1.040) | OR 1.000 (0.989-1.010) | OR 0.973 (0.961-0.985) | OR 1.043 (1.029-1.057) |
| Men | ||||||
| 18 years and older | ||||||
| 1988-1994 | 26.6 (26.4-26.8) | 95.6 (95.1-96.0) | 19.9 (18.4-21.3) | 39.7 (38.1-41.3) | 39.1 (37.1-41.2) | 29.1 (27.4-30.7) |
| 2009-2010 | 28.6 (28.2-29.0) | 100.4 (99.3-101.5) | 34.6 (31.0-38.1) | 38.1 (35.9-40.3) | 26.3 (22.6-29.9) | 42.0 (38.6-45.3) |
| Trend | APC 0.37 (0.30-0.44) | APC 0.27 (0.22-0.32) | OR 1.042 (1.033-1.050) | OR 0.997 (0.992-1.003) | OR 0.967 (0.959-0.975) | OR 1.036 (1.028-1.044) |
| 18-39 years | ||||||
| 1988-1994 | 25.7 (25.4-26.0) | 90.1 (89.4-90.8) | 14.5 (12.8-16.2) | 34.4 (31.7-37.1) | 49.4 (46.8-51.9) | 14.3 (12.6-16.1) |
| 2009-2010 | 27.9 (27.3-28.5) | 95.4 (94.0-96.8) | 31.8 (26.5-37.2) | 33.4 (30.3-36.5) | 33.5 (28.3-38.8) | 29.2 (25.1-33.3) |
| Trend | APC 0.40 (0.31-0.49) | APC 0.29 (0.22-0.36) | OR 1.052 (1.039-1.065) | OR 0.999 (0.990-1.008) | OR 0.967 (0.958-0.976) | OR 1.045 (1.034-1.057) |
| 40-64 years | ||||||
| 1988-1994 | 27.5 (27.2-27.8) | 99.1 (98.5-99.8) | 25.1 (23.0-27.3) | 43.3 (40.5-46.1) | 30.8 (27.6-34.0) | 37.5 (34.4-40.6) |
| 2009-2010 | 29.3 (28.7-29.8) | 103.3 (101.8-104.8) | 36.8 (32.8-40.8) | 42.8 (38.4-47.2) | 19.5 (15.1-24.0) | 47.8 (43.2-52.4) |
| Trend | APC 0.33 (0.23-0.43) | APC 0.23 (0.16-0.31) | OR 1.032 (1.021-1.043) | OR 0.998 (0.989-1.008) | OR 0.964 (0.951-0.977) | OR 1.029 (1.017-1.041) |
| 65 years and older | ||||||
| 1988-1994 | 26.6 (26.3-26.9) | 100.5 (99.7-101.3) | 20.3 (17.2-23.4) | 44.0 (40.6-47.5) | 33.8 (30.4-37.3) | 45.3 (41.9-48.7) |
| 2009-2010 | 28.7 (28.2-29.1) | 105.7 (104.5-106.9) | 36.0 (31.0-41.0) | 38.3 (33.1-43.4) | 24.6 (19.8-29.3) | 59.4 (54.4-64.4) |
| Trend | APC 0.38 (0.29-0.47) | APC 0.28 (0.21-0.35) | OR 1.042 (1.028-1.057) | OR 0.990 (0.978-1.002) | OR 0.974 (0.962-0.987) | OR 1.036 (1.024-1.047) |
| 18 years and older, non-Hispanic white | ||||||
| 1988-1994 | 26.6 (26.4-26.9) | 96.3 (95.9-96.8) | 20.0 (18.2-21.8) | 40.3 (38.3-42.4) | 38.4 (36.0-40.8) | 30.2 (28.4-31.9) |
| 2009-2010 | 28.6 (28.1-29.1) | 101.3 (100.0-102.6) | 35.2 (30.7-39.8) | 37.7 (35.1-40.3) | 26.1 (21.5-30.7) | 44.4 (40.3-48.5) |
| Trend | APC 0.35 (0.27-0.43) | APC 0.26 (0.21-0.32) | OR 1.040 (1.030-1.050) | OR 0.996 (0.989-1.003) | OR 0.968 (0.959-0.978) | OR 1.039 (1.030-1.047) |
| 18 years and older, non-Hispanic black | ||||||
| 1988-1994 | 26.5 (26.2-26.7) | 92.4 (91.8-93.0) | 20.6 (18.6-22.6) | 36.2 (34.1-38.3) | 40.9 (38.7-43.2) | 23.1 (21.2-25.0) |
| 2009-2010 | 29.2 (28.5-29.9) | 98.4 (97.0-99.8) | 38.0 (33.2-42.7) | 30.3 (25.9-34.6) | 30.3 (27.6-33.0) | 37.9 (33.7-42.1) |
| Trend | APC 0.51 (0.41-0.61) | APC 0.35 (0.28-0.42) | OR 1.052 (1.040-1.064) | OR 0.989 (0.980-0.999) | OR 0.968 (0.961-0.976) | OR 1.045 (1.034-1.056) |
| 18 years and older, Mexican-American | ||||||
| 1988-1994 | 27.2 (26.9-27.4) | 95.6 (94.9-96.2) | 23.3 (21.4-25.2) | 43.6 (41.0-46.2) | 32.1 (29.8-34.3) | 29.1 (26.7-31.4) |
| 2009-2010 | 29.0 (28.2-29.7) | 100.2 (98.4-101.9) | 34.8 (29.5-40.1) | 46.3 (42.2-50.3) | 18.6 (14.1-23.2) | 41.6 (35.9-47.4) |
| Trend | APC 0.41 (0.28-0.55) | APC 0.32 (0.22-0.43) | OR 1.038 (1.021-1.056) | OR 1.007 (0.997-1.018) | OR 0.957 (0.943-0.972) | OR 1.038 (1.019-1.056) |
APC = annual percentage change; OR = odds ratio for being in given category compared to previous year
Appendix Table 1 shows results by age/ethnicity
The prevalence of obesity increased from 24.9% (95% CI, 23.1-26.8%) to 35.4% (95% CI, 33.6-37.3%) in women, and from 19.9% (95% CI, 18.4-21.3%) to 34.6% (95% CI, 31.0-38.1%) in men. These increases were associated with decreases in the proportions of normal weight women and men, and no change in the proportions of overweight women and men (Table 1). Compared to the previous year, the odds ratio for being categorized as obese in any given year was 1.026 (95% CI, 1.019-1.033) for women and 1.042 (95% CI, 1.033-1.050) for men. Similar trends were observed in all age groups (Table 1). Sex-specific differences between racial/ethnic groups in obesity prevalence paralleled the BMI results (Table 1, Appendix Figure 1, Appendix Table 1).
Waist Circumference and Abdominal Obesity
The average waist circumference increased by 0.37% (95% CI, 0.30-0.44%) per year in women and 0.27% (95% CI, 0.22-0.32%) per year in men. Increases in average waist circumference were observed in all age and racial/ethnic groups (Figure 2, Table 1). As with BMI, the subgroup with the greatest annual increase in average waist circumference was 18-39 year-old women (Table 1). Among women, average waist circumference was largest among non-Hispanic blacks and smallest among non-Hispanic whites; in contrast, among men, it was largest among non-Hispanic whites and smallest among non-Hispanic blacks (Figure 2, Table 1, Appendix Table 1).
Figure 2.
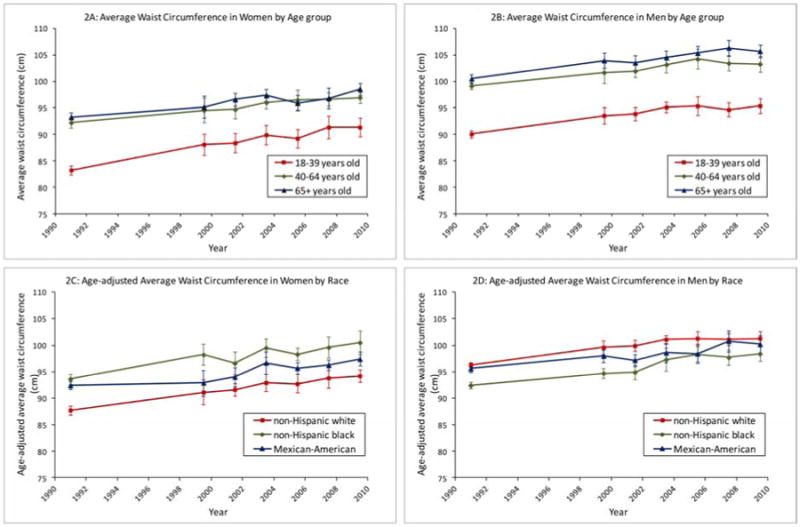
Trends in average waist circumference in U.S. adults, 1988-2010. (A) Trends in women, by age-group. (B) Trends in men, by age-group. (C) Trends in women, by racial/ethnic group. (D) Trends in men, by racial/ethnic group.
The changes in average waist circumference were associated with increases in the prevalence of abdominal obesity (Appendix Figure 2, Table 1), from 46.0% (95% CI, 43.9-48.0%) to 61.5% (95% CI, 58.8-64.2%) in women, and from 29.1% (95% CI, 27.4-30.7%) to 42.0% (95% CI, 38.6-45.3%) in men. The annual increases were most pronounced in younger persons, but the prevalence of abdominal obesity increased with age (Table 1). Sex-specific differences between racial/ethnic groups in abdominal obesity prevalence paralleled the waist circumference results (Table 1, Appendix Figure 2, Appendix Table 1).
Abdominal Obesity by Body-Mass Index Category
Among adults categorized as normal weight based on BMI, the prevalence of abdominal obesity increased significantly only in women, from 9.6% (95% CI, 8.1-11.0%) to 13.8% (95% CI, 10.1-17.5%) (Appendix Table 2).
Among adults categorized as overweight based on BMI, the prevalence of abdominal obesity increased from 66.1% (95% CI, 62.7-69.4%) to 80.8% (95% CI, 78.1-83.5%) in women, and from 24.5% (95% CI, 22.1-26.8%) to 27.8% (95% CI, 24.3-31.3%) in men (Appendix Table 2). Compared to the previous year, the odds ratio for fulfilling criteria for abdominal obesity in a given year was 1.045 (95% CI, 1.032-1.057) for overweight women, and 1.017 (95% CI, 1.007-1.027) for overweight men.
The majority (>90%) of U.S. adults categorized as obese based on BMI were also categorized as having abdominal obesity (Appendix Table 2).
Appendix Table 2 displays the results by age group.
Physical Activity
The proportion of adults who reported no leisure-time physical activity increased from 19.1% (95% CI, 17.3-21.0%) to 51.7% (95% CI, 48.9-54.5%) in women, and from 11.4% (95% CI, 10.0-12.8%) to 43.5% (95% CI, 40.7-46.3%) in men. These changes were accompanied by decreases in the proportions of adults who reported intermediate or ideal levels of leisure-time physical activity (Table 2). Compared to the previous year, the odds ratio for reporting no leisure-time physical activity in a given year was 1.074 (95% CI, 1.064-1.084) for women, and 1.083 (95% CI, 1.071-1.094) for men (Table 2). Among both women and men, the proportions reporting no leisure-time physical activity were higher among non-Hispanic blacks and Mexican-Americans than among non-Hispanic whites (Table 2). Table 2 and Appendix Table 3 display the results by age and race/ethnicity.
Table 2. Trends in reported levels of leisure-time physical activity and daily caloric intake, U.S. adults, 1988-2010 *.
| Reported leisure-time physical activity | Mean energy intake in kcal/day(95% CI) | |||
|---|---|---|---|---|
| None, % of population (95% CI) | Intermediate level, % of population (95% CI) | Ideal level, % of population(95% CI) | ||
| Women | ||||
| 18 years and older | ||||
| 1988-1994 | 19.1 (17.3-21.0) | 45.0 (43.1-46.9) | 35.9 (33.2-38.5) | 1761 (1735-1788) |
| 2009-2010 | 51.7 (48.9-54.5) | 18.6 (17.3-19.8) | 29.8 (27.7-31.9) | 1781 (1749-1812) |
| Trend | OR 1.074 (1.064-1.084) | OR 0.939 (0.933-0.944) | OR 0.990 (0.981-0.999) | APC 0.07 (-0.06-0.20) |
| 18-39 years | ||||
| 1988-1994 | 14.0 (11.9-16.1) | 50.0 (46.6-53.4) | 36.0 (32.9-39.1) | 1941 (1889-1992) |
| 2009-2010 | 47.5 (43.4-51.5) | 20.4 (17.7-23.1) | 32.1 (29.1-35.2) | 1873 (1820-1926) |
| Trend | OR 1.078 (1.066-1.090) | OR 0.932 (0.923-0.941) | OR 1.002 (0.993-1.012) | APC -0.20 (-0.38--0.02) |
| 40-64 years | ||||
| 1988-1994 | 19.2 (16.7-21.7) | 46.0 (43.6-48.3) | 34.9 (31.4-38.4) | 1697 (1666-1727) |
| 2009-2010 | 49.9 (47.0-52.7) | 19.4 (17.4-21.4) | 30.7 (28.4-33.0) | 1771 (1705-1837) |
| Trend | OR 1.072 (1.059-1.086) | OR 0.938 (0.930-0.947) | OR 0.990 (0.978-1.002) | APC 0.23 (0.01-0.45) |
| 65 years and older | ||||
| 1988-1994 | 31.8 (28.4-35.2) | 30.3 (27.7-32.8) | 38.0 (34.0-41.9) | 1474 (1446-1503) |
| 2009-2010 | 66.3 (60.9-71.7) | 12.1 (8.7-15.5) | 21.7 (16.7-26.7) | 1578 (1508-1647) |
| Trend | OR 1.071 (1.056-1.087) | OR 0.956 (0.946-0.967) | OR 0.956 (0.941-0.972) | APC 0.37 (0.17-0.57) |
| 18 years and older, non-Hispanic white | ||||
| 1988-1994 | 15.6 (13.7-17.4) | 46.7 (44.5-49.0) | 37.7 (34.6-40.8) | 1771 (1740-1802) |
| 2009-2010 | 46.1 (41.1-51.0) | 20.0 (18.0-22.1) | 33.9 (30.3-37.5) | 1791 (1754-1828) |
| Trend | OR 1.077 (1.062-1.092) | OR 0.939 (0.932-0.946) | OR 0.994 (0.982-1.006) | APC 0.09 (-0.06-0.24) |
| 18 years and older, non-Hispanic black | ||||
| 1988-1994 | 30.5 (27.4-33.5) | 41.3 (39.1-43.5) | 28.3 (25.5-31.0) | 1729 (1696-1763) |
| 2009-2010 | 66.2 (62.5-69.8) | 17.1 (15.3-18.9) | 16.8 (13.2-20.3) | 1787 (1697-1877) |
| Trend | OR 1.064 (1.052-1.076) | OR 0.943 (0.935-0.952) | OR 0.982 (0.971-0.993) | APC 0.16 (-0.08-0.40) |
| 18 years and older, Mexican-American | ||||
| 1988-1994 | 33.2 (30.9-35.5) | 41.0 (38.5-43.4) | 25.8 (22.4-29.2) | 1698 (1656-1741) |
| 2009-2010 | 66.5 (61.6-71.3) | 12.1 (9.5-14.7) | 21.4 (17.1-25.7) | 1732 (1633-1832) |
| Trend | OR 1.069 (1.054-1.085) | OR 0.928 (0.915-0.942) | OR 0.991 (0.975-1.006) | APC 0.06 (-0.27-0.40) |
| Men | ||||
| 18 years and older | ||||
| 1988-1994 | 11.4 (10.0-12.8) | 43.5 (41.7-45.3) | 45.0 (42.8-47.2) | 2616 (2569-2663) |
| 2009-2010 | 43.5 (40.7-46.3) | 14.8 (12.8-16.8) | 41.7 (38.1-45.3) | 2511 (2443-2578) |
| Trend | OR 1.083 (1.071-1.094) | OR 0.931 (0.924-0.937) | OR 0.993 (0.985-1.001) | APC -0.17 (-0.32--0.01) |
| 18-39 years | ||||
| 1988-1994 | 8.9 (7.1-10.6) | 44.0 (41.0-47.1) | 47.1 (44.0-50.2) | 2973 (2900-3046) |
| 2009-2010 | 34.1 (28.6-39.5) | 14.3 (11.6-17.0) | 51.6 (45.6-57.5) | 2678 (2583-2772) |
| Trend | OR 1.065 (1.051-1.079) | OR 0.930 (0.920-0.940) | OR 1.012 (1.001-1.023) | APC -0.48 (-0.69--0.28) |
| 40-64 years | ||||
| 1988-1994 | 11.2 (9.3-13.2) | 46.5 (43.3-49.7) | 42.2 (39.2-45.3) | 2516 (2444-2587) |
| 2009-2010 | 47.9 (45.3-50.4) | 16.2 (13.3-19.1) | 35.9 (32.6-39.3) | 2561 (2466-2656) |
| Trend | OR 1.100 (1.084-1.116) | OR 0.928 (0.917-0.939) | OR 0.981 (0.970-0.991) | APC 0.16 (-0.06-0.37) |
| 65 years and older | ||||
| 1988-1994 | 18.3 (15.8-20.8) | 35.1 (32.6-37.6) | 46.6 (43.3-50.0) | 1977 (1927-2027) |
| 2009-2010 | 56.1 (52.0-60.2) | 12.7 (10.1-15.2) | 31.3 (27.6-35.0) | 1978 (1905-2050) |
| Trend | OR 1.087 (1.073-1.100) | OR 0.942 (0.932-0.953) | OR 0.964 (0.954-0.974) | APC -0.01 (-0.24-0.23) |
| 18 years and older, non-Hispanic white | ||||
| 1988-1994 | 9.6 (8.1-11.0) | 45.0 (42.6-47.4) | 45.4 (42.8-48.0) | 2667 (2616-2718) |
| 2009-2010 | 39.3 (35.6-43.1) | 16.3 (13.2-19.3) | 44.4 (39.0-49.9) | 2569 (2485-2654) |
| Trend | OR 1.089 (1.072-1.105) | OR 0.933 (0.925-0.942) | OR 0.994 (0.983-1.004) | APC -0.09 (-0.26-0.07) |
| 18 years and older, non-Hispanic black | ||||
| 1988-1994 | 15.9 (13.4-18.4) | 38.3 (36.0-40.7) | 45.8 (42.8-48.7) | 2455 (2388-2521) |
| 2009-2010 | 51.6 (47.2-55.9) | 8.8 (4.8-12.7) | 39.7 (35.8-43.5) | 2442 (2284-2600) |
| Trend | OR 1.071 (1.058-1.084) | OR 0.926 (0.916-0.937) | OR 0.994 (0.983-1.005) | APC 0.03 (-0.25-0.30) |
| 18 years and older, Mexican-American | ||||
| 1988-1994 | 23.6 (20.1-27.1) | 40.7 (37.7-43.6) | 35.8 (33.4-38.1) | 2468 (2411-2526) |
| 2009-2010 | 58.2 (50.8-65.7) | 12.1 (7.6-16.6) | 29.7 (25.5-33.9) | 2411 (2323-2499) |
| Trend | OR 1.061 (1.044-1.079) | OR 0.917 (0.902-0.933) | OR 1.003 (0.990-1.017) | APC -0.13 (-0.41-0.15) |
APC = annual percentage change; OR = odds ratio for being in given category compared to previous year
Appendix Table 3 shows results by age/ethnicity
Caloric intake
Average daily caloric intake did not change significantly over time for women or men as a whole, or when stratified by race/ethnicity (Table 2). The results differed by age, gender and leisure-time physical activity level (Table 3, Appendix Table 4). Average daily caloric intake increased significantly for women who reported no leisure-time physical activity, and decreased significantly for men who reported an ideal level of leisure-time physical activity (Table 3).
Table 3.
Trends in prevalence of obesity, abdominal obesity and daily caloric intake stratified by reported level of leisure-time physical activity, U.S. adults, 1988-2010.
| Category based on body-mass index, Odds ratio (95% CI) of being in category in any given year compared to previous year | Category based on waist circumference, Odds ratio (95% CI) of being in category in any given year compared to previous year Abdominal obesity | Mean energy intake, Annual percentage change (95% CI) | |||
|---|---|---|---|---|---|
| Obese | Overweight | Normal weight | Abdominal obesity | ||
| Women | |||||
| No reported leisure-time physical activity | 1.020 (1.010-1.030) | 0.997 (0.985-1.009) | 0.987 (0.978-0.995) | 1.026 (1.015-1.038) | 0.27 (0.02-0.52) |
| Intermediate level of reported leisure-time physical activity | 1.029 (1.018-1.040) | 1.003 (0.993-1.014) | 0.974 (0.963-0.985) | 1.037 (1.027-1.048) | 0.09 (-0.11-0.28) |
| Ideal level of reported leisure-time physical activity | 1.020 (1.008-1.032) | 1.013 (1.002-1.025) | 0.977 (0.966-0.989) | 1.037 (1.025-1.048) | 0.08 (-0.13-0.30) |
| Men | |||||
| No reported leisure-time physical activity | 1.053 (1.037-1.070) | 1.003 (0.991-1.016) | 0.947 (0.933-0.962) | 1.048 (1.032-1.065) | 0.19 (-0.14-0.53) |
| Intermediate level of reported leisure-time physical activity | 1.029 (1.016-1.041) | 1.004 (0.993-1.014) | 0.971 (0.959-0.983) | 1.029 (1.018-1.039) | -0.13 (-0.34-0.09) |
| Ideal level of reported leisure-time physical activity | 1.045 (1.030-1.060) | 1.000 (0.992-1.008) | 0.967 (0.955-0.978) | 1.036 (1.024-1.048) | -0.22 (-0.40--0.04) |
Body-Mass Index and Obesity by Physical Activity Strata
Average BMI increased in women and men in all three strata of leisure-time physical activity (Appendix Table 4). Increases in average BMI were observed in nearly all age and gender subgroups stratified by leisure-time physical activity (Appendix Table 4). The prevalence of obesity increased in women and men in all three strata of leisure-time physical activity (Table 3). Similar patterns were seen across racial/ethnic groups (data not shown).
Waist Circumference and Abdominal Obesity by Physical Activity Strata
Average waist circumference increased over time in women and men in all three strata of leisure-time physical activity (Appendix Table 4). Increases in average waist circumference were observed in nearly all age and gender subgroups stratified by leisure-time physical activity (Appendix Table 4). The prevalence of abdominal obesity increased in women and men within all strata of leisure-time physical activity (Table 3). Similar patterns were seen across racial/ethnic groups (data not shown).
Body-Mass Index and Waist Circumference: Associations with Leisure-Time Physical Activity and Caloric Intake
BMI and waist circumference both increased significantly in women and men after adjusting for leisure-time physical activity, caloric intake, and age. The magnitude of the increases was associated with level of leisure-time physical activity, but not with caloric intake.
The associated changes in BMI were 5.5% (95% CI, 4.3-6.7%) higher among women with an intermediate level of leisure-time physical activity and 8.3% (95% CI, 6.9-9.6%) higher among women with no leisure-time physical activity than among women with an ideal level of leisure-time physical activity. For men, the respective measures were 1.2% (95% CI, 0.15-2.2%) higher and 1.7% (95% CI, 0.68-2.8%) higher.
The associated changes in waist circumferences were 4.2% (95% CI, 3.3-5.0%) higher among women with an intermediate level of leisure-time physical activity and 6.4% (95% CI, 5.4-7.4%) higher among women with no leisure-time physical activity than among women with an ideal level of leisure-time physical activity. For men, the respective measures were 2.1% (95% CI, 1.4-2.9%) higher and 2.5% (95% CI, 1.7-3.3%) higher.
In analyses stratified by race/ethnicity, the associations between increases in BMI and waist circumference and level of leisure-time physical activity were statistically significant for non-Hispanic white women and men, and Mexican-American women (Appendix Table 5).
Sensitivity analyses showed similar results (Appendix).
Discussion
Our analyses highlight important dimensions of the public health problem of obesity in the U.S. Average BMI, average waist circumference, the prevalence of obesity, and the prevalence of abdominal obesity increased substantially over the past two decades in both women and men. The annual increases in BMI have been most pronounced in younger women, the greatest increases in the prevalence of abdominal obesity have been in younger women and men, and both obesity and abdominal obesity preferentially affected non-Hispanic black women. Furthermore, the prevalence of abdominal obesity has increased among normal weight women, and among overweight women and men. These changes have occurred in the context of substantial increases in the proportion of adults reporting no leisure-time physical activity, but in the absence of any significant population-level changes in average daily caloric intake. At the population level, we found a significant association between the level of leisure-time physical activity, but not daily caloric intake, and the increases in both BMI and waist circumference.
While the overall trends in obesity in the U.S. are well appreciated and obesity prevalence may be stabilizing,5, 6, 20, 21 our analyses highlight troublesome trends in younger adults, in women, and in abdominal obesity prevalence, as well as persistent racial/ethnic disparities. Overall, normal weight women and overweight women and men have become more “abdominally obese.” Given that obesity prevalence increased significantly between 1999-2010 in males aged 2-19 years, but not in females,22 it is possible that young adult women may be particularly vulnerable to weight gain. It remains controversial whether overweight alone increases mortality risk,2 but the trends in abdominal obesity among the overweight are concerning in light of the risks associated with increased waist circumference independent of BMI.8-11
Our findings do not support the popular notion that the rise in obesity in the U.S. can be attributed primarily to sustained increases over time in the average daily caloric intake of Americans.23 We found no evidence that average daily caloric intake has increased over the last two decades. Previous analyses have noted increases over longer time periods,24 but decreases more recently.25
In contrast, our analyses identified significant associations between the reported level of leisure-time physical activity in the population and all measures of obesity. Other investigators have examined this relationship.26, 27 Physical inactivity is an independent predictor of mortality.28 Physical activity can protect against weight gain29 and attenuates the increased mortality risk associated with obesity.30, 31 However, an ideal level of physical activity does not by itself ensure a normal weight (Table 3).
Our results are based on a series of cross-sectional surveys, and not a prospective cohort study. They do not suggest that caloric intake is not an important determinant of obesity at the level of an individual. A previous analysis of NHANES 1971-1975 through 1999-2002 reported an increase in food energy density roughly parallel to U.S. obesity prevalence rates.32 Diet composition may be relevant at the population level, but we found no substantial changes in the daily fat, carbohydrate and protein intake during our study period (Appendix Table 6). Analyses of the major macronutrients, however, do not address specific sources of calories, such as simple sugars, and interactions with genetic risk.33 The impact of the microbiome on host metabolism is beginning to be explored.34
Our results should be viewed in the context of existing studies. Studies restricted to more recent time periods suggest that the trends in obesity prevalence in U.S. adults may be stabilizing.5, 6 Our joinpoint analyses of BMI in women are consistent with these results. While this is encouraging, the prevalence of obesity remains unacceptably high.35 Trends in abdominal obesity could reflect in part a birth cohort effect.36 Some but not all previous studies on physical activity trends have reached conclusions similar to ours.37 The heterogeneity in results may be due in part to diversity in surveys and study methods.
Our study has limitations. The NHANES surveys do not follow a cohort of individuals prospectively, so our reported associations with physical activity must be interpreted with caution. While height, weight and waist circumference are measured, caloric intake and physical activity are self-reported, and we analyzed caloric intake on 24-hour recall. Caloric intake may be under-reported and physical activity overestimated, 38 but this cannot explain the high rates of no leisure-time physical activity in our study. Changes in survey methodology over time could have affected physical activity estimates. We used cycle midpoints as a continuous variable.
Societal considerations merit discussion. Obesity is a public health problem across racial, ethnic, and socioeconomic groups,39 but African Americans, Hispanics, those with lesser education, older persons, and some states are affected disproportionally.40 Despite the trends in overweight and obesity, the rates of self-diagnosis, clinical diagnosis, and weight counseling in primary care have declined.41, 42 Societal realities, including divergent views about the roles of individuals and government, compound the challenges encountered in the medical setting.39 The first goal related to physical activity environments proposed by the IOM is to make physical activity an integral and routine part of life.1 The IOM also recommends transforming messages about physical activity and nutrition, stressing the roles of health care providers, insurers, employers and schools in promoting health, with physical activity as a major focus.1
In conclusion, average BMI and waist circumference both increased among U.S. adults from 1998-2010. Abdominal obesity, an independent predictor of mortality, has become more prevalent among normal weight women and overweight women and men. At the population level, we found associations between the reported level of leisure-time physical activity and obesity, but even among adults reporting an ideal level of leisure-time physical activity, obesity prevalence has increased. Although it is encouraging that obesity rates may be stabilizing, our results lend support to the emphasis placed on physical activity in the IOM report on obesity.
Appendix
Appendix Figure 1. Trends in prevalence of obesity in U.S. adult women (A) and men (B), by racial/ethnic group.
Appendix Figure 2. Trends in prevalence of abdominal obesity in U.S. adult women (A) and men (B), by racial/ethnic group.
Appendix Table 1: Trends in average body-mass index, waist circumference, and prevalence of obesity and abdominal obesity, U.S. adults stratified by race/ethnicity, 1988-2010
Appendix Table 2: Annual changes in prevalence of abdominal obesity, stratified by obesity category based on body-mass index, U.S. adults, 1988-2010
Appendix Table 3: Trends in reported levels of leisure-time physical activity and daily caloric intake, U.S. adults, stratified by race/ethnicity, 1988-2010
Appendix Table 4: Annual changes in mean body-mass index, mean waist circumference and daily caloric intake, stratified by reported level of leisure-time physical activity, U.S. adults, 1988-2010
Appendix Table 5: Relative increase in body-mass index and waist circumference in “Intermediate” and “No reported” groups compared to “Ideal” reported leisure time physical activity in U.S. adults, 1988-2010.
Appendix Table 6: Annual changes in daily intake of fat, carbohydrate and protein, stratified by reported level of leisure-time physical activity, U.S. adults, 1988-2010.
Clinical Significance.
Average body-mass index (BMI) and waist circumference, obesity and abdominal obesity prevalence, and the population fraction reporting no leisure-time physical activity increased substantially in U.S. adults from 1998-2010. BMI and waist circumference trends were associated with physical activity level, but not daily caloric intake.
Although U.S. obesity rates may be stabilizing, our results lend support to the emphasis placed on physical activity in the Institute of Medicine report on obesity.
Acknowledgments
Grant Support: NIH T32 Training Grant T32DK007056 Awarded to Dr. Parvathi A. Myer. The sponsor had no design and conduct of the study; collection, management, analysis, and interpretation of the data; and preparation, review, or approval of the manuscript; and decision to submit the manuscript for publication
Footnotes
Disclosures: Uri Ladabaum has served as a consultant for Endosphere. No other potential conflicts of interest exist
Author Contributions: Conception and design: UL, AM, PM, GS; Acquisition of data: AM, GS; Analysis and interpretation of Data: UL, AM, GS; Drafting of manuscript: UL, PM, GS; Critical revision of manuscript for important intellectual content: UL, AM, PM, GS; Statistical analysis: UL, AM, GS; Obtained funding: UL; Study supervision: UL, GS
Publisher's Disclaimer: This is a PDF file of an unedited manuscript that has been accepted for publication. As a service to our customers we are providing this early version of the manuscript. The manuscript will undergo copyediting, typesetting, and review of the resulting proof before it is published in its final citable form. Please note that during the production process errors may be discovered which could affect the content, and all legal disclaimers that apply to the journal pertain.
References
- 1.Accelerating Progress in Obesity Prevention: Solving the Weight of the Nation. Washington, DC: IOM (Institute of Medicine); 2012. [DOI] [PMC free article] [PubMed] [Google Scholar]
- 2.Flegal KM, Kit BK, Orpana H, Graubard BI. Association of all-cause mortality with overweight and obesity using standard body mass index categories: a systematic review and meta-analysis. JAMA. 2013;309(1):71–82. doi: 10.1001/jama.2012.113905. [DOI] [PMC free article] [PubMed] [Google Scholar]
- 3.Adams KF, Schatzkin A, Harris TB, et al. Overweight, obesity, and mortality in a large prospective cohort of persons 50 to 71 years old. N Engl J Med. 2006;355(8):763–78. doi: 10.1056/NEJMoa055643. [DOI] [PubMed] [Google Scholar]
- 4.Berrington de Gonzalez A, Hartge P, Cerhan JR, et al. Body-mass index and mortality among 1.46 million white adults. N Engl J Med. 2010;363(23):2211–9. doi: 10.1056/NEJMoa1000367. [DOI] [PMC free article] [PubMed] [Google Scholar]
- 5.Flegal KM, Carroll MD, Ogden CL, Curtin LR. Prevalence and trends in obesity among US adults, 1999-2008. JAMA. 2010;303(3):235–41. doi: 10.1001/jama.2009.2014. [DOI] [PubMed] [Google Scholar]
- 6.Flegal KM, Carroll MD, Kit BK, Ogden CL. Prevalence of obesity and trends in the distribution of body mass index among US adults, 1999-2010. JAMA. 2012;307(5):491–7. doi: 10.1001/jama.2012.39. [DOI] [PubMed] [Google Scholar]
- 7.Olshansky SJ, Passaro DJ, Hershow RC, et al. A potential decline in life expectancy in the United States in the 21st century. N Engl J Med. 2005;352(11):1138–45. doi: 10.1056/NEJMsr043743. [DOI] [PubMed] [Google Scholar]
- 8.Clinical guidelines on the identification, evaluation, and treatment of overweight and obesity in adults: The evidence report. Washington, DC: National Heart, Lung and Blood Institutes, National Institutes of Health; 1998. [Google Scholar]
- 9.Pischon T, Boeing H, Hoffmann K, et al. General and abdominal adiposity and risk of death in Europe. N Engl J Med. 2008;359(20):2105–20. doi: 10.1056/NEJMoa0801891. [DOI] [PubMed] [Google Scholar]
- 10.Koster A, Leitzmann MF, Schatzkin A, et al. Waist circumference and mortality. Am J Epidemiol. 2008;167(12):1465–75. doi: 10.1093/aje/kwn079. [DOI] [PubMed] [Google Scholar]
- 11.Jacobs EJ, Newton CC, Wang Y, et al. Waist circumference and all-cause mortality in a large US cohort. Arch Intern Med. 2010;170(15):1293–301. doi: 10.1001/archinternmed.2010.201. [DOI] [PubMed] [Google Scholar]
- 12.The Practical Guide Identification, Evaluation, and Treatment of Overweight and Obesity in Adults. Washington, DC: National Heart, Lung and Blood Institutes, National Institutes of Health; 2000. [Google Scholar]
- 13.Mozaffarian D, Hao T, Rimm EB, et al. Changes in diet and lifestyle and long-term weight gain in women and men. N Engl J Med. 2011;364(25):2392–404. doi: 10.1056/NEJMoa1014296. [DOI] [PMC free article] [PubMed] [Google Scholar]
- 14.Centers for Disease Control and Prevention (CDC). National Center for Health Statistics (NCHS) National Health and Nutrition Examination Survey Data. Hyattsville, MD: [Accessed April 17, 2013]. http://www.cdc.gov/nchs/nhanes/nhanes_questionnaires.htm. [Google Scholar]
- 15.National Center for Health Statistics. The Third National Health and Nutrition Examination Survey, 1988–1994. Hyattsville, MD: 1996. [Accessed April 17, 2013]. Analytical and Reporting Guidelines. at http://www.cdc.gov/nchs/data/nhanes/nhanes3/nh3gui.pdf. [Google Scholar]
- 16.National Center for Health Statistics. The National Health and Nutrition Examination Survey (NHANES) Hyattsville, MD: 2005. [Accessed April 17, 2013]. Analytical and Reporting Guidelines. at http://www.cdc.gov/nchs/data/nhanes/nhanes_03_04/nhanes_analytic_guidelines_dec_2005.pdf. [Google Scholar]
- 17.Lean ME, Han TS, Morrison CE. Waist circumference as a measure for indicating need for weight management. BMJ. 1995;311(6998):158–61. doi: 10.1136/bmj.311.6998.158. [DOI] [PMC free article] [PubMed] [Google Scholar]
- 18.Kim HJ, Fay MP, Feuer EJ, Midthune DN. Permutation tests for joinpoint regression with applications to cancer rates. Stat Med. 2000;19(3):335–51. doi: 10.1002/(sici)1097-0258(20000215)19:3<335::aid-sim336>3.0.co;2-z. [DOI] [PubMed] [Google Scholar]
- 19.Day Jennifer Cheeseman. U S Bureau of the Census, Current Population Reports. U.S. Government Printing Office; Washington, DC: 1996. [Accessed April 17, 2013]. Population Projections of the United States by Age, Sex, Race, and Hispanic Origin: 1995 to 2050; pp. 25–1130. at http://www.census.gov/prod/1/pop/p25-1130/p251130.pdf. [Google Scholar]
- 20.Okosun IS, Chandra KM, Boev A, et al. Abdominal adiposity in U.S. adults: prevalence and trends, 1960-2000. Prev Med. 2004;39(1):197–206. doi: 10.1016/j.ypmed.2004.01.023. [DOI] [PubMed] [Google Scholar]
- 21.Li C, Ford ES, McGuire LC, Mokdad AH. Increasing trends in waist circumference and abdominal obesity among US adults. Obesity (Silver Spring, Md) 2007;15(1):216–24. doi: 10.1038/oby.2007.505. [DOI] [PubMed] [Google Scholar]
- 22.Ogden CL, Carroll MD, Kit BK, Flegal KM. Prevalence of obesity and trends in body mass index among US children and adolescents, 1999-2010. JAMA. 2012;307(5):483–90. doi: 10.1001/jama.2012.40. [DOI] [PMC free article] [PubMed] [Google Scholar]
- 23.Casazza K, Fontaine KR, Astrup A, et al. Myths, presumptions, and facts about obesity. N Engl J Med. 2013;368(5):446–54. doi: 10.1056/NEJMsa1208051. [DOI] [PMC free article] [PubMed] [Google Scholar]
- 24.Austin GL, Ogden LG, Hill JO. Trends in carbohydrate, fat, and protein intakes and association with energy intake in normal-weight, overweight, and obese individuals: 1971-2006. The American journal of clinical nutrition. 2011;93(4):836–43. doi: 10.3945/ajcn.110.000141. [DOI] [PubMed] [Google Scholar]
- 25.Ford ES, Dietz WH. Trends in energy intake among adults in the United States: findings from NHANES. The American journal of clinical nutrition. 2013;97(4):848–53. doi: 10.3945/ajcn.112.052662. [DOI] [PMC free article] [PubMed] [Google Scholar]
- 26.Qi Q, Li Y, Chomistek AK, et al. Television watching, leisure time physical activity, and the genetic predisposition in relation to body mass index in women and men. Circulation. 2012;126(15):1821–7. doi: 10.1161/CIRCULATIONAHA.112.098061. [DOI] [PMC free article] [PubMed] [Google Scholar]
- 27.Weinsier RL, Hunter GR, Heini AF, et al. The etiology of obesity: relative contribution of metabolic factors, diet, and physical activity. Am J Med. 1998;105(2):145–50. doi: 10.1016/s0002-9343(98)00190-9. [DOI] [PubMed] [Google Scholar]
- 28.Hu FB, Willett WC, Li T, et al. Adiposity as compared with physical activity in predicting mortality among women. N Engl J Med. 2004;351(26):2694–703. doi: 10.1056/NEJMoa042135. [DOI] [PubMed] [Google Scholar]
- 29.Hankinson AL, Daviglus ML, Bouchard C, et al. Maintaining a high physical activity level over 20 years and weight gain. JAMA. 2010;304(23):2603–10. doi: 10.1001/jama.2010.1843. [DOI] [PMC free article] [PubMed] [Google Scholar]
- 30.Koster A, Harris TB, Moore SC, et al. Joint associations of adiposity and physical activity with mortality: the National Institutes of Health-AARP Diet and Health Study. Am J Epidemiol. 2009;169(11):1344–51. doi: 10.1093/aje/kwp053. [DOI] [PMC free article] [PubMed] [Google Scholar]
- 31.Sui X, LaMonte MJ, Laditka JN, et al. Cardiorespiratory fitness and adiposity as mortality predictors in older adults. JAMA. 2007;298(21):2507–16. doi: 10.1001/jama.298.21.2507. [DOI] [PMC free article] [PubMed] [Google Scholar]
- 32.Kant AK, Graubard BI. Secular trends in patterns of self-reported food consumption of adult Americans: NHANES 1971-1975 to NHANES 1999-2002. The American journal of clinical nutrition. 2006;84(5):1215–23. doi: 10.1093/ajcn/84.5.1215. [DOI] [PMC free article] [PubMed] [Google Scholar]
- 33.Qi Q, Chu AY, Kang JH, et al. Sugar-sweetened beverages and genetic risk of obesity. N Engl J Med. 2012;367(15):1387–96. doi: 10.1056/NEJMoa1203039. [DOI] [PMC free article] [PubMed] [Google Scholar]
- 34.Tremaroli V, Backhed F. Functional interactions between the gut microbiota and host metabolism. Nature. 2012;489(7415):242–9. doi: 10.1038/nature11552. [DOI] [PubMed] [Google Scholar]
- 35.Yanovski SZ, Yanovski JA. Obesity prevalence in the United States--up, down, or sideways? N Engl J Med. 2011;364(11):987–9. doi: 10.1056/NEJMp1009229. [DOI] [PMC free article] [PubMed] [Google Scholar]
- 36.Robinson WR, Utz RL, Keyes KM, et al. Birth cohort effects on abdominal obesity in the United States: the Silent Generation, Baby Boomers and Generation X. International journal of obesity (2005) 2012 doi: 10.1038/ijo.2012.198. [DOI] [PMC free article] [PubMed] [Google Scholar]
- 37.Pleis JR, Lucas JW. Summary health statistics for U.S. adults: National Health Interview Survey, 2007. Vital and health statistics Series 10, Data from the National Health Survey. 2009;(240):1–159. [PubMed] [Google Scholar]
- 38.Tucker JM, Welk GJ, Beyler NK. Physical activity in U.S.: adults compliance with the Physical Activity Guidelines for Americans. Am J Prev Med. 2011;40(4):454–61. doi: 10.1016/j.amepre.2010.12.016. [DOI] [PubMed] [Google Scholar]
- 39.Barry CL, Gollust SE, Niederdeppe J. Are Americans ready to solve the weight of the nation? N Engl J Med. 2012;367(5):389–91. doi: 10.1056/NEJMp1206519. [DOI] [PubMed] [Google Scholar]
- 40.Vital signs: state-specific obesity prevalence among adults --- United States, 2009. MMWR Morb Mortal Wkly Rep. 2010;59(30):951–5. [PubMed] [Google Scholar]
- 41.Kraschnewski JL, Sciamanna CN, Stuckey HL, et al. A silent response to the obesity epidemic: decline in US physician weight counseling. Med Care. 2013;51(2):186–92. doi: 10.1097/MLR.0b013e3182726c33. [DOI] [PubMed] [Google Scholar]
- 42.Yates EA, Macpherson AK, Kuk JL. Secular trends in the diagnosis and treatment of obesity among US adults in the primary care setting. Obesity (Silver Spring, Md) 2012;20(9):1909–14. doi: 10.1038/oby.2011.271. [DOI] [PubMed] [Google Scholar]
Associated Data
This section collects any data citations, data availability statements, or supplementary materials included in this article.
Supplementary Materials
Appendix Figure 1. Trends in prevalence of obesity in U.S. adult women (A) and men (B), by racial/ethnic group.
Appendix Figure 2. Trends in prevalence of abdominal obesity in U.S. adult women (A) and men (B), by racial/ethnic group.
Appendix Table 1: Trends in average body-mass index, waist circumference, and prevalence of obesity and abdominal obesity, U.S. adults stratified by race/ethnicity, 1988-2010
Appendix Table 2: Annual changes in prevalence of abdominal obesity, stratified by obesity category based on body-mass index, U.S. adults, 1988-2010
Appendix Table 3: Trends in reported levels of leisure-time physical activity and daily caloric intake, U.S. adults, stratified by race/ethnicity, 1988-2010
Appendix Table 4: Annual changes in mean body-mass index, mean waist circumference and daily caloric intake, stratified by reported level of leisure-time physical activity, U.S. adults, 1988-2010
Appendix Table 5: Relative increase in body-mass index and waist circumference in “Intermediate” and “No reported” groups compared to “Ideal” reported leisure time physical activity in U.S. adults, 1988-2010.
Appendix Table 6: Annual changes in daily intake of fat, carbohydrate and protein, stratified by reported level of leisure-time physical activity, U.S. adults, 1988-2010.