

Abstract
Context:
Dosages of vitamin D necessary to prevent or treat vitamin D deficiency in children remain to be clarified.
Objective:
To determine the effects of vitamin D3 1000 IU/d on serum 25-hydroxyvitamin D [25(OH)D], PTH, and markers of bone turnover (osteocalcin and collagen type 1 cross-linked C-telopeptide) in black children and white children, and to explore whether there is a threshold level of 25(OH)D associated with maximal suppression of serum PTH concentration.
Design:
Healthy 8- to 14-year-old Pittsburgh-area black (n = 84) and white (n = 73) children not receiving vitamin supplements, enrolled from October through March from 2008 through 2011, were randomized to vitamin D3 1000 IU or placebo daily for 6 months.
Results:
The mean baseline concentration of 25(OH)D was <20 ng/mL in both the vitamin D-supplemented group and the placebo group (19.8 ± 7.6 and 18.8 ± 6.9 ng/mL, respectively). The mean concentration was higher in the supplemented group than in the placebo group at 2 months (26.4 ± 8.1 vs 18.9 ± 8.1 ng/mL; P < .0001) and also at 6 months (26.7 ± 7.6 vs 22.4 ± 7.3; P = .003), after adjusting for baseline 25(OH)D, race, gender, pubertal status, dietary vitamin D intake, body mass index, and sunlight exposure. Increases were only significant in black children, when examined by race. The association between 25(OH)D and PTH concentrations was inverse and linear, without evidence of a plateau. Overall, vitamin D supplementation had no effect on PTH and bone turnover.
Conclusions:
Vitamin D3 supplementation with 1000 IU/d in children with mean baseline 25(OH)D concentration <20 ng/mL effectively raised their mean 25(OH)D concentration to ≥20 ng/mL but failed to reach 30 ng/mL. Vitamin D supplementation had no effect on PTH concentrations.
Maintaining adequate vitamin D status is essential for calcium homeostasis and skeletal health. However, hypovitaminosis D is common in healthy children living in the northeastern United States, and its prevalence and severity are greater in black than in white children (1). Circulating concentration of 25-hydroxyvitamin D [25(OH)D] is the recognized biomarker of vitamin D status. Definition of a 25(OH)D cutoff level for optimal skeletal health lacks consensus. The Institute of Medicine (IOM) recommends concentrations of 25(OH)D ≥20 ng/mL as optimal for skeletal health and defines vitamin D deficiency as a concentration <12 ng/mL and vitamin D insufficiency as concentrations 12 to 20 ng/mL (2). The IOM estimates that concentrations of ≥16 ng/mL and ≥20 ng/mL would be adequate for ensuring the skeletal health needs of 50 and 97.5%, respectively, of US children. The Endocrine Society and other experts in the field have suggested a target level ≥30 ng/mL for optimal skeletal health (3, 4).
Concentrations of 25(OH)D associated with maximal suppression of serum PTH concentration, indicated by a plateauing of the PTH concentration, have been used for defining vitamin D sufficiency in adults. Such data in children are limited and varied. Hill et al (5) found no inflection point in the inverse association between 25(OH)D and PTH in a cross-sectional study of 7- to 18-year-old children. Although Maguire et al (6) demonstrated plateauing of PTH at a 25(OH)D concentration of 42.8 ng/mL in a cross-sectional study of 1- to 6-year-old children, vitamin D supplementation (0, 400, 1000, 2000, and 4000 IU/d for 12 wk) in 9- to 13-year-old children had no effect on PTH concentrations despite dose-dependent increases in 25(OH)D concentrations (7).
Confounding effects of sun exposure and other determinants of vitamin D photoproduction pose challenges for estimating the amount of dietary vitamin D needed to achieve and maintain a defined 25(OH)D level (2). Those considerations notwithstanding, the IOM's dietary reference intakes for vitamin D were calculated without regard for variations in skin color, race, or sunlight exposure. Delineating the racial differences in response to vitamin D supplementation and exploring levels of 25(OH)D associated with vitamin D sufficiency is relevant for formulating dietary guidelines. In addition, data regarding the effect of vitamin D supplementation on bone turnover are limited. Therefore, we initiated a pharmacological challenge with 1000 IU of vitamin D3 daily (five times the prevailing adequate intake for vitamin D) (8) in black children and white children to examine the responsive changes in 25(OH)D, PTH, and bone turnover. The objective of this study was to determine the effects of supplementation with 1000 IU of vitamin D3 on serum concentrations of 25(OH)D, PTH, and markers of bone turnover in black children and white children. We utilized the longitudinal design of our study to determine whether there was a threshold level of 25(OH)D associated with maximal suppression of serum PTH concentration.
Subjects and Methods
Study design and participants
We enrolled healthy 8- to 14-year-old children from Pittsburgh and Kittanning, Pennsylvania (latitude/longitude: 40.4° N/80°W and 40.8° N/79.5°W, respectively) in a randomized, double-blind, placebo-controlled trial of vitamin D3 1000 IU daily (Clinicaltrials.gov identifier: NCT00732758). The children were enrolled October through March of 2008 through 2011. Children receiving vitamin preparations underwent a 1-month washout before enrollment.
Subjects were recruited from the Primary Care Center of the Children's Hospital of Pittsburgh of the University of Pittsburgh Medical Center (UPMC) and the Children's Community Pediatrics-Armstrong practice in Kittanning, and through advertisements posted in the offices of the Children's Hospital-affiliated Pediatric PittNet, a practice-based pediatric research network. Study procedures subsequent to enrollment were conducted either at the UPMC Montefiore Clinical and Translational Research Center or at the Children's Community Pediatrics-Armstrong practice. The study was approved by the University of Pittsburgh Institutional Review Board. Signed informed parental consent and subjects' assent were obtained before research participation. The race of subjects was specified by their parents.
Randomization and intervention
Randomization was stratified by race using a 1:1 allocation ratio and a permuted block scheme with block size of 4. Children received either vitamin D3 1000 IU or placebo in a single tablet once daily. The allocation scheme was generated by a study statistician using R version 2.7.0. The vitamin D3 and placebo tablets were manufactured by Douglas Laboratories, were similar in color, and were dispensed in identical containers labeled either A or B. A sealed envelope system was used for the assignments. Children, parents, and the investigative team were blinded to the treatment assignment until the study was completed. Study medications were made in two batches. The average vitamin D3 content of the vitamin D3 tablet, measured as previously described (9), in the first batch around the midpoint of its shelf-life was approximately 1129 IU; in the second batch at the end of the trial, it was approximately 1140 IU.
Compliance
Compliance was assessed by pill count at the 2- and 6-month follow-up visits and was validated in a subset of 90 subjects by an electronic medication event monitoring system (MEMs 6 Track Cap; AARDEX).
Study measurements
Anthropometry, sun exposure, skin color, dietary intake, and pubertal status
We measured height and weight and calculated body mass index (BMI) at study entry and at the 6-month follow-up visit. At study entry and exit, we assessed: summertime sunlight exposure characteristics; melanin index from the forehead, back of the hand, and inner arm using a handheld dermatospectrophotometer (DSM II Colormeter; Cortex Technology); and dietary intake of vitamin D and calcium using a validated Youth and Adolescent Food Frequency Questionnaire (10, 11). We estimated Tanner stage by physical examination (12, 13) and ascertained the parent-reported Fitzpatrick sunreactive skin type (14–16) at study entry.
Biochemical assessments
We collected blood samples by venipuncture in a nonfasting state throughout the day. We measured serum calcium, phosphorus, albumin, 25(OH)D, PTH, osteocalcin (OC; marker of bone formation), and collagen type 1 cross-linked C-telopeptide (CTx; a marker of bone resorption) concentrations at baseline and at 2- and 6-month follow-up visits. Calcium, phosphorus, and albumin concentrations were measured at the UPMC Clinical Chemistry laboratory. Serum 25(OH)D, PTH, OC, and CTx concentrations were measured at the Vitamin D, Skin, and Bone Research Laboratory at Boston University Medical Center. Serum 25(OH)D concentrations were measured using liquid chromatography-tandem mass spectrometry (17). The intra-assay and interassay coefficients of variation (CVs) were 6% and 10%, respectively. The 25(OH)D assay is Center for Disease Control certified, and National Institutes of Standards and Technology standards were used for confirmation of the standard curves. Serum 3-epi-25(OH)D is excluded in the reported levels. Serum PTH concentrations were assayed using a Human Bioactive PTH 1–84 Elisa kit (Immutopics, Inc); intra-assay and interassay CVs were 7 and 9%, respectively. Serum OC concentrations were measured by Micro Vue OC enzyme immunoassay kit (Quidel); intra-assay and interassay CVs were 5 and 10%, respectively. Serum CTx concentrations were measured by Serum CrossLaps ELISA kit (Immunodiagnostic Systems); intra-assay and interassay CVs were 1.8–3% and 8.0–10.9%, respectively.
Statistical analysis
We based parameter estimates for sample-size analyses on our earlier study of changes in PTH concentration in response to vitamin D3 supplementation (18). Assuming that the concentration of 25(OH)D would reach >20 ng/mL in the supplemented group and would remain ≤20 ng/mL in the placebo group and with two-sided α = 0.05, we estimated that 160 children would be needed to detect effect sizes in serum 25(OH)D and PTH concentrations of approximately 0.5, with power of 81 to 88%. Assuming that 50% of the children were black and 50% white, we had 79% power to detect a correlation of at least −0.3 between PTH and 25(OH)D concentrations within each race group (α = 0.05). We anticipated an attrition rate of 5% and planned to enroll a total of 168 children.
We used intention-to-treat analyses when testing the effects of vitamin D supplementation relative to placebo. We tested for treatment group or racial differences in categorical measures using χ2 or Fisher's exact tests and in continuous measures using t tests. Concentrations of 25(OH)D, the primary study outcome, did not require transformation. We compared mean 25(OH)D concentrations using analysis of covariance, controlling for baseline 25(OH)D, race, gender, pubertal status, BMI, dietary intake of vitamin D, and sunlight exposure.
To explore threshold effects of 25(OH)D on PTH concentrations, we conducted analyses similar to those described by Hill et al (5) and Maguire et al (6) using linear and cubic spline regressions. Scatterplots were constructed superimposed with both fitted lines and Lowess (locally weighted scatterplot smoothing) curves to visually examine nonlinearity. We used mixed-effects modeling to examine the associations between PTH and 25(OH)D concentrations. This allowed us to account for repeated measures within children across time and adjust for the baseline covariates of BMI, race, and calcium intake and for the time-varying covariates of 25(OH)D and season. In the models, season was based on the date of visit and categorized as fall/winter/early- to midspring (October through May), and late spring/summer (June through September). We assessed cross-sectional between-child associations using baseline measures and within-child associations using changes from baseline.
Results
Of 304 eligible children, 157 were enrolled (Figure 1), 141 in Pittsburgh and 16 in Kittanning. Eighty-four of the children were black and 73 were white. The vitamin D3-supplemented and placebo groups were similar at baseline (Table 1). Baseline characteristics between vitamin D and placebo groups, when examined within each race group, were also balanced except for hand melanin index in black children (Table 1). However, hand melanin index measurements were missing in 12 black children.
Figure 1.
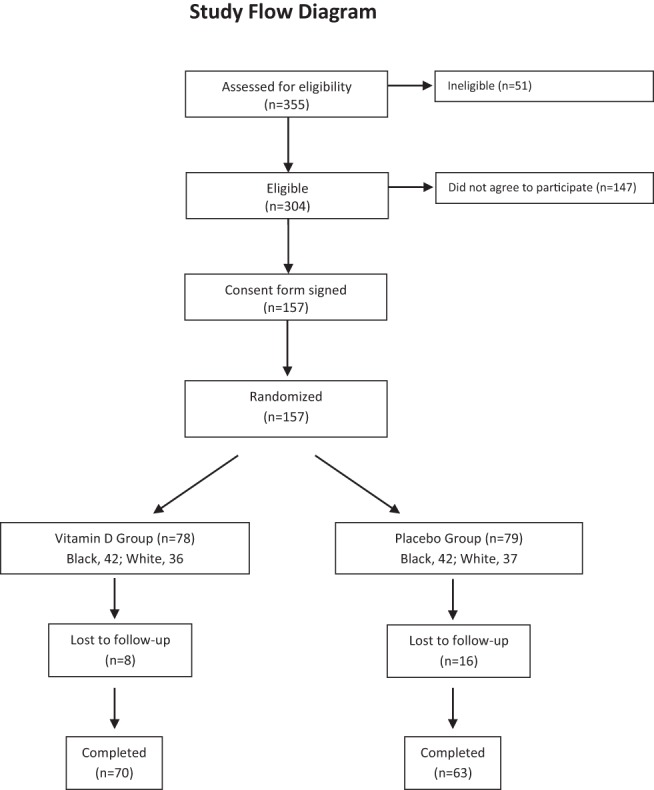
Enrollment, randomization, and follow-up of study participants
Table 1.
Baseline Characteristics of Enrolled Children
| All Children |
Black Children |
White Children |
|||||||
|---|---|---|---|---|---|---|---|---|---|
| Vitamin D Group | Placebo Group | P Value | Vitamin D Group | Placebo Group | P Value | Vitamin D Group | Placebo Group | P Value | |
| n | 78 | 79 | 42 | 42 | 36 | 37 | |||
| Demographic | |||||||||
| Male | 33 (42.3) | 45 (57.0) | .07 | 18 (42.9) | 23 (54.8) | .38 | 15 (41.7) | 22 (59.5) | .16 |
| Black | 42 (53.8) | 42 (53.2) | .93 | ||||||
| Ethnicity | |||||||||
| Hispanic | 1 (1.3) | 1 (1.3) | .42 | 1 (2.4) | 1 (2.4) | .80 | 0 | .36 | |
| Non-Hispanic | 68 (87.2) | 63 (79.7) | 33 (78.6) | 30 (71.4) | 35 (97.2) | 33 (89.2) | |||
| Not reported | 9 (11.5) | 15 (19.0) | 8 (19.1) | 11 (26.2) | 1 (2.8) | 4 (10.8) | |||
| Age, y | 11.2 ± 1.9 | 11.4 ± 2.0 | .48 | 11.1 ± 1.9 | 11.8 ± 2.0 | .08 | 11.3 ± 1.9 | 10.9 ± 1.8 | .35 |
| Weight, kg | 48.4 ± 18.0 | 49.2 ± 19.6 | .80 | 49.7 ± 18.2 | 54.8 ± 23.3 | .27 | 46.9 ± 18.0 | 42.8 ± 11.7 | .25 |
| Height, cm | 148.1 ± 13.4 | 149.3 ± 13.1 | .59 | 147.8 ± 12.4 | 153.2 ± 13.8 | .06 | 148.5 ± 14.6 | 144.9 ± 10.8 | .22 |
| BMI, kg/m2 | 21.6 ± 5.5 | 21.6 ± 6.2 | .97 | 22.3 ± 6.1 | 22.8 ± 7.5 | .75 | 20.7 ± 4.7 | 20.1 ± 3.8 | .56 |
| Weight classification | |||||||||
| Normal weight (BMI <85th %tile) | 44 (56.4) | 49 (62.0) | .72 | 20 (47.6) | 25 (59.5) | .48 | 24 (66.7) | 24 (64.9) | 1.00 |
| Overweight (BMI 85th to <95th %tiles) | 14 (17.9) | 11 (13.9) | 8 (19.1) | 5 (11.9) | 6 (16.7) | 6 (16.2) | |||
| Obese (BMI ≥95th %tile) | 20 (25.6) | 19 (24.1) | 14 (33.3) | 12 (28.6) | 6 (16.7) | 7 (18.9) | |||
| Tanner stage | |||||||||
| I | 30 (38.5) | 31 (39.2) | .99 | 14 (33.3) | 13 (31.0) | .43 | 16 (44.4) | 18 (48.7) | .25 |
| II | 20 (25.6) | 19 (24.1) | 12 (28.6) | 6 (14.3) | 8 (22.2) | 13 (35.1) | |||
| III | 12 (15.4) | 14 (17.7) | 6 (14.3) | 10 (23.8) | 6 (16.7) | 4 (10.8) | |||
| IV | 8 (10.3) | 8 (10.1) | 6 (14.3) | 6 (14.3) | 2 (5.6) | 2 (5.4) | |||
| V | 8 (10.3) | 7 (8.9) | 4 (9.5) | 7 (16.7) | 4 (11.1) | 0 (0) | |||
| Skin type | |||||||||
| I (easy burn, no tan) | 4 (5.3) | 6 (7.7) | .26 | 0 (0) | 0 (0) | .06 | 4 (11.4) | 6 (16.2) | .91 |
| II (easy burn, slight tan) | 14 (18.4) | 13 (16.7) | 0 (0) | 1 (2.4) | 14 (40.0) | 12 (32.4) | |||
| III (burn, then tan) | 15 (19.7) | 16 (20.5) | 4 (9.8) | 4 (9.8) | 11 (31.4) | 12 (32.4) | |||
| IV (no burn, good tan) | 36 (47.4) | 27 (34.6) | 30 (73.2) | 20 (48.8) | 6 (17.1) | 7 (18.9) | |||
| V (never burn, marked tan) | 7 (9.2) | 16 (20.5) | 7 (17.1) | 16 (39.0) | 0 (0) | 0 (0) | |||
| Melanin indexa | |||||||||
| Forehead | 51.9 ± 18.2 | 54.6 ± 19.8 | .40 | 66.9 ± 13.5 | 71.9 ± 11.4 | .09 | 37.0 ± 5.4 | 37.3 ± 7.1 | .83 |
| Hand | 54.2 ± 18.1 | 57.5 ± 20.0 | .28 | 69.0 ± 13.5 | 75.6 ± 10.7 | .02 | 39.3 ± 5.3 | 39.6 ± 5.8 | .81 |
| Underarm | 51.2 ± 16.8 | 53.1 ± 18.5 | .52 | 64.6 ± 13.7 | 69.2 ± 12.2 | .14 | 37.8 ± 4.1 | 37.5 ± 5.6 | .75 |
| Summertime sunlight exposure | |||||||||
| Duration > 2 h | 63 (85.1) | 60 (78.9) | .32 | 33 (84.6) | 35 (87.5) | .76 | 30 (85.7) | 25 (69.4) | .16 |
| Sunscreen use, yes | 28 (37.8) | 36 (46.8) | .27 | 6 (15.4) | 13 (31.7) | .12 | 22 (62.9) | 23 (63.9) | 1.00 |
| Sunscreen use frequency | |||||||||
| Often | 13 (54.2) | 22 (68.8) | .32 | 1 (20) | 4 (40) | .44 | 12 (63.2) | 18 (81.8) | .29 |
| Sometimes | 11 (45.8) | 8 (25.0) | 4 (80) | 4 (40) | 7 (36.8) | 4 (18.2) | |||
| Seldom | 0 (0.0) | 2 (6.3) | 0 (0) | 2 (20) | 0 (0) | 0 (0) | |||
| Vacation travel to sunny location, yes | 14 (18.9) | 22 (28.6) | .16 | 3 (7.7) | 9 (22.0) | .12 | 11 (31.4) | 13 (36.1) | .80 |
| Laboratory data | |||||||||
| Calcium, mg/dL | 9.7 ± 0.4 | 9.6 ± 0.4 | .43 | 9.8 ± 0.38 | 9.7 ± 0.39 | .21 | 9.5 ± 0.35 | 9.5 ± 0.40 | .83 |
| Phosphorus, mg/dL | 5.0 ± 0.5 | 5.1 ± 0.6 | .14 | 4.9 ± 0.49 | 5.1 ± 0.58 | .31 | 5.0 ± 0.42 | 5.1 ± 0.58 | .28 |
| Albumin, g/dL | 4.2 ± 0.3 | 4.2 ± 0.3 | .64 | 4.3 ± 0.33 | 4.2 ± 0.34 | .48 | 4.2 ± 0.22 | 4.2 ± 0.23 | .79 |
| 25(OH)D, ng/mL | 19.8 ± 7.6 | 18.8 ± 6.9 | .38 | 16.6 ± 7.4 | 16.3 ± 6.7 | .81 | 23.5 ± 6.0 | 21.6 ± 6.1 | .19 |
| PTH, pg/mL | 36.9 ± 19.6 | 37.6 ± 19.0 | .83 | 43.4 ± 20.8 | 42.3 ± 21.0 | .80 | 29.4 ± 15.1 | 32.3 ± 15.2 | .41 |
| OC, ng/mL | 94.2 ± 44.9 | 104.5 ± 48.4 | .18 | 88.0 ± 41.9 | 93.4 ± 54.5 | .62 | 101.3 ± 47.6 | 116.4 ± 38.0 | .14 |
| CTx, ng/mL | 1.7 ± 0.9 | 1.8 ± 0.9 | .82 | 2.1 ± 1.0 | 2.0 ± 1.0 | .74 | 1.3 ± 0.6 | 1.4 ± 0.7 | .30 |
| Dietary intake | |||||||||
| Calcium, mg/d | 1164.3 ± 602.2 | 1200.6 ± 599.3 | .71 | 1157.0 ± 600.9 | 1178.7 ± 695.5 | .88 | 1172.8 ± 612.1 | 1226.1 ± 471.5 | .68 |
| Vitamin D, IU/d | 253.6 ± 141.0 | 283.9 ± 175.0 | .23 | 239.4 ± 132.1 | 262.2 ± 166.9 | .49 | 270.2 ± 150.9 | 309.3 ± 182.9 | .33 |
| Vitamin D-deficient | |||||||||
| 25(OH)D < 20 ng/mL | 42 (54) | 45 (57) | .69 | 30 (71) | 29 (69) | .81 | 12 (33) | 16 (43) | .38 |
Data are expressed as number (percentage) or mean ± SD, unless stated otherwise.
Melanin index from forehead and hand was not obtained in 11 black children (vitamin D group, n = 6; placebo group, n = 5), and melanin index from underarm was not obtained in 12 black children (vitamin D group, n = 6; placebo group, n = 6).
Effects of Vitamin D3 supplementation
Effects on mean 25(OH)D concentrations
Baseline 25(OH)D concentrations were not different between the vitamin D3-supplemented and placebo groups, and both were <20 ng/mL (Table 2). At the 2- and 6-month follow-up visits, concentrations were higher in supplemented children, and in black supplemented children considered as a separate subgroup. The increase in 25(OH)D concentration in supplemented children was greater in black than in white children at 2 months but not at 6 months. Mean 25(OH)D concentrations were lower generally in black children than in white children. Analysis of covariance parameter estimates for the 25(OH)D differences at 2 and 6 months are shown in Supplemental Table 1.
Table 2.
25(OH)D and PTH Concentrations by Treatment Group and Racea
| Total Sample (n = 157) |
Black (n = 84) |
White (n = 73) |
|||||||
|---|---|---|---|---|---|---|---|---|---|
| Vitamin D Group | Placebo Group | P Value | Vitamin D Group | Placebo Group | P Value | Vitamin D Group | Placebo Group | P Value | |
| Mean 25(OH)D concentrations, ng/mL | |||||||||
| Baseline | 19.8 ± 7.6 (78) | 18.8 ± 6.9 (79) | .38 | 16.6 ± 7.4 (42)b | 16.3 ± 6.7 (42)c | .81 | 23.5 ± 6.0 (36) | 21.6 ± 6.1 (37) | .19 |
| 2-mo f/u | 26.4 ± 8.1 (72) | 18.9 ± 8.1 (64) | <.0001 | 25.2 ± 6.9 (37) | 14.9 ± 6.0 (31)d | <.0001 | 27.6 ± 9.2 (35) | 22.7 ± 8.1 (33) | .15 |
| 6-mo f/u | 26.7 ± 7.6 (70) | 22.4 ± 7.3 (63) | .003 | 24.2 ± 7.4 (35) | 18.9 ± 6.8 (29) | .012 | 29.2 ± 7.0 (35) | 25.4 ± 6.5 (34) | .08 |
| 2 mo − baseline Δ | 6.1 ± 7.6 | 0.17 ± 7.0 | <.0001 | 8.2 ± 8.1e | −0.56 ± 7.8 | <.0001 | 3.9 ± 6.5 | 0.87 ± 6.2 | .05 |
| 6 mo − baseline Δ | 6.5 ± 7.4 | 3.4 ± 6.7 | .01 | 7.5 ± 9.0 | 3.2 ± 8.5 | .06 | 5.5 ± 5.3 | 3.5 ± 4.8 | .11 |
| Mean PTH concentrations, pg/mL | |||||||||
| Baseline | 36.9 ± 19.6 (78) | 37.6 ± 19.0 (79) | .83 | 43.4 ± 20.8 (42)d | 42.3 ± 21.0 (42)e | .81 | 29.4 ± 15.1 (36) | 32.3 ± 15.2 (37) | .41 |
| 2-mo f/u | 35.1 ± 17.6 (72) | 32.7 ± 13.6 (64) | .37 | 39.3 ± 18.7 (37)e | 36.1 ± 11.6 (31) | .40 | 30.7 ± 15.5 (35) | 29.5 ± 14.7 (33) | .74 |
| 6-mo f/u | 35.5 ± 16.3 (69) | 33.5 ± 17.0 (62) | .51 | 42.0 ± 16.6 (35)c | 38.9 ± 17.4 (28)e | .48 | 28.8 ± 13.2 (34) | 29.1 ± 15.7 (34) | .92 |
| 2 mo − baseline Δ | −1.8 ± 15.4 | −4.7 ± 16.2 | .29 | −5.2 ± 18.3 | −6.1 ± 16.0 | .82 | 1.7 ± 10.9 | −3.4 ± 16.5 | .14 |
| 6 mo − baseline Δ | −1.5 ± 13.9 | −3.4 ± 20.0 | .52 | −2.2 ± 16.0 | −2.7 ± 20.6 | .91 | −0.7 ± 11.5 | −4.0 ± 19.7 | .40 |
Abbreviation: f/u, follow-up. Data are shown as mean ± SD (number).
P values of 25(OH)D group differences at 2- and 6-month follow-up are adjusted for baseline 25(OH)D, race, BMI, diet vitamin D, gender, pubertal status, and sunlight exposure; P values of PTH group differences are unadjusted; P values of 25(OH)D Δ and PTH Δ group differences are unadjusted.
P < .0001 for the difference between black children and white children in the corresponding treatment group.
P < .001 for the difference between black children and white children in the corresponding treatment group.
P < .01 for the difference between black children and white children in the corresponding treatment group.
P < .05 for the difference between black children and white children in the corresponding treatment group.
Children with baseline 25(OH)D concentrations <20 ng/mL
Of this subgroup of children who received vitamin D3 supplementation, concentrations at 2 months were between 20 and 30 ng/mL in 65% (24 of 37) and ≥30 ng/mL in 3% (one of 37). Corresponding proportions in the children who received placebo were 14% (five of 36) and 6% (two of 36), respectively. At 6 months, concentrations in supplemented children were between 20 and 30 ng/mL in 47% (17 of 36) and ≥30 ng/mL in 14% (five of 36). Corresponding proportions in the children who received placebo were 53% (18 of 34) and 0% (0 of 34), respectively. The proportions in black children and white children were similar.
Magnitude of changes in 25(OH)D concentration in relation to baseline concentration
Lower baseline 25(OH)D concentration was associated with greater change in 25(OH)D concentration at 2 months overall (r = −0.32; P < .001) and in black children (r = −0.49; P < .001), but not in white children (r = −0.0005; P = 1.0). The associations were similar for 6-month changes overall (r = −0.44; P < .001), and both in black children (r = −0.58; P < .001) and white children (r = −0.24; P = .048).
Changes in 25(OH)D concentrations in relation to dietary intake of vitamin D and sun exposure
Baseline dietary intake of vitamin D was not correlated with changes in 25(OH)D concentrations at 2 and 6 months. The change in 25(OH)D concentrations was higher in children with >2 hours vs ≤2 hours of sunlight exposure (2 months: 3.6 ± 8.2 ng/mL vs 0.9 ± 6.0 ng/mL, P = .16; 6 months: 5.3 ± 7.4 vs 2.6 ± 4.6 ng/mL, P = .035). This association varied by race and skin pigmentation at 2 months but not at 6 months (Supplemental Table 2). The direction of the association was the same and was significant among white children and in children classified as light-skinned (skin type I–III) but not in black children and dark-skinned children (skin type IV–V), respectively.
Effects on PTH concentrations
Vitamin D supplementation did not have an impact on mean PTH concentrations at 2 and 6 months (Table 2). At baseline, mean PTH concentrations were higher in black children than in white children in each of the two treatment groups and remained so throughout the duration of the study.
25(OH)D-PTH associations
In unadjusted analyses, both the between-children association and the within-child association were negative in all children (standardized coefficients, −0.89 [P < .001] and −0.24 [P = .03], respectively); the between-children association was stronger than the within-child association (P < .001). Calcium intake did not modify these associations. Adjusting for season, BMI, calcium intake, and race attenuated the strength of both associations (standardized coefficients, −0.64 [P = .013] and −0.14 [P = .23], respectively).
The 25(OH)D and PTH association, by race, was significant only in black children (between-children: black, standardized coefficient, −0.92 [P < .001]; white, −0.38 [P = .10]; within-child: black, −0.30 [P = .038]; white, −0.13 [P= .39]). In black children, the between-children association was stronger than the within-child association (P = .011). Calcium intake did not modify these associations. Adjusting for season, BMI, and calcium intake attenuated the strength of both associations (standardized coefficients, −0.89 [P < .001] and −0.24 [P = .13], respectively).
We had limited power to detect a threshold concentration of 25(OH)D associated with maximal suppression of PTH. This was largely because few of the 25(OH)D data points were above 40 ng/mL relative to other studies that have explored this association (5, 6, 19). The Lowess curves (Figure 2, A–C) of the between-children associations in all children and in the race subgroups were linear, without evidence of plateauing. Visually suggestive plateauing of PTH concentrations around 30 ng/mL in black children and 40 ng/mL in white children were not significant for nonlinearity (P = .27 and P = .67, respectively).
Figure 2.

25(OH)D-PTH associations. A, Scatter plot shows combined cross-sectional, between-children data concerning the association between 25(OH)D and PTH concentrations across all time points in all subjects. The solid line constitutes the linear regression line, and the dotted lines indicate its 95% confidence interval (CI). The bold solid line depicts the Lowess (locally weighted scatterplot smoothing) curve. B, Scatter plot of the between-children association between 25(OH)D and PTH in black children with the liner regression line and the fitted Lowess smoother line. C, Scatter plot of the between-children association between 25(OH)D and PTH in white children with the liner regression line and the fitted Lowess smoother line.
Effects on OC and CTx concentrations (Table 3)
Table 3.
OC and CTx Concentrations by Treatment Group and Racea
| Total Sample (n = 157) |
Black (n = 84) |
White (n = 73) |
|||||||
|---|---|---|---|---|---|---|---|---|---|
| Vitamin D Group | Placebo Group | P Value | Vitamin D Group | Placebo Group | P Value | Vitamin D Group | Placebo Group | P Value | |
| Mean OC concentrations, ng/mL | |||||||||
| Baseline | 94.2 ± 44.9 (77) | 104.5 ± 48.4 (77) | .18 | 88.0 ± 41.9 (41) | 93.4 ± 54.5 (40)b | .62 | 101.3 ± 47.6 (36) | 116.4 ± 38.1 (37) | .14 |
| 2-mo f/u | 97.3 ± 45.6 (71) | 101.5 ± 45.8 (64) | .60 | 98.0 ± 44.4 (36) | 83.6 ± 47.9 (31)c | .21 | 96.6 ± 47.4 (35) | 118.2 ± 37.2 (33) | .041 |
| 6-mo f/u | 101.1 ± 48.3 (70) | 104.8 ± 48.7 (61) | .66 | 105.8 ± 53.0 (35) | 78.6 ± 43.6 (29)d | .031 | 96.3 ± 43.4 (35) | 128.6 ± 40.5 (32) | .003 |
| 2 mo − baseline Δ | 1.0 ± 25.9 | −0.7 ± 21.7 | .67 | 5.6 ± 32.0 | 0.4 ± 11.7 | .38 | −3.7 ± 16.8 | −1.8 ± 28.0 | .74 |
| 6 mo − baseline Δ | 4.7 ± 33.6 | 5.9 ± 32.8 | .84 | 13.4 ± 37.2b | −2.0 ± 34.6 | .10 | −4.0 ± 27.5 | 12.7 ± 30.1 | .02 |
| Mean CTx concentrations, ng/mL | |||||||||
| Baseline | 1.7 ± 0.9 (78) | 1.8 ± 0.9 (79) | .83 | 2.1 ± 1.0 (42)d | 2.0 ± 1.0 (42)c | .74 | 1.3 ± 0.6 (36) | 1.4 ± 0.7 (37) | .31 |
| 2-mo f/u | 1.6 ± 0.8 (72) | 1.7 ± 1.2 (64) | .44 | 1.9 ± 0.8 (37)c | 1.8 ± 1.4 (31) | .70 | 1.3 ± 0.6 (35) | 1.7 ± 0.9 (33) | .041 |
| 6-mo f/u | 1.4 ± 0.9 (69) | 1.6 ± 0.9 (63) | .35 | 1.6 ± 1.1 (35) | 1.4 ± 1.0 (29) | .63 | 1.2 ± 0.6 (34) | 1.7 ± 0.9 (34) | .021 |
| 2 mo − baseline Δ | −0.13 ± 0.7 | −0.01 ± 1.0 | .43 | −0.3 ± 0.8b | −0.27 ± 1.0b | .88 | 0.05 ± 0.63 | 0.23 ± 0.85 | .32 |
| 6 mo − baseline Δ | −0.29 ± 1.0 | −0.16 ± 1.1 | .49 | −0.6 ± 1.2b | −0.6 ± 1.3c | .93 | 0.02 ± 0.63 | 0.19 ± 0.85 | .37 |
Abbreviation: f/u, follow-up. Data are shown as mean ± SD (number).
P values of the OC and CTx group differences are unadjusted.
P < .05 for the difference between black children and white children in the corresponding treatment group.
P < .01 for the difference between black children and white children in the corresponding treatment group.
P < .0001 for the difference between black children and white children in the corresponding treatment group.
Overall, vitamin D3 supplementation had no effect on mean concentrations of OC and CTx. Black children had lower mean concentration of OC and higher mean concentration of CTx than white children at baseline; and in the placebo group, their mean OC concentrations remained significantly lower than white children at 2 and 6 months.
The effect of treatment varied by race for changes in OC at 6 months (race-by-treatment interaction term, P < .001). In vitamin D-supplemented black children, mean OC concentration was significantly higher than the placebo group at 6 months. There was no effect on CTx in black children. In white children, however, mean OC and CTx concentrations were both lower in the vitamin D-supplemented group than the placebo group at 2 and 6 months.
25(OH)D and bone turnover relationships (Table 4)
Table 4.
25(OH)D and Bone Turnover Relationships
| No. of Patients | r |
P Value |
|||
|---|---|---|---|---|---|
| Unadjusted | Adjusteda | Adjusted | |||
| Baseline associations | |||||
| Total sample | |||||
| 25(OH)D and log OC | 154 | 0.12 | .13 | .77 | |
| 25(OH)D and log CTx | 154 | 0.13 | .69 | .20 | |
| Black | |||||
| 25(OH)D and log OC | 81 | 0.23 | .038 | .17 | |
| 25(OH)D and log CTx | 84 | 0.21 | .046 | .72 | |
| White | |||||
| 25(OH)D and log OC | 73 | −0.27 | .02 | .13 | |
| 25(OH)D and log CTx | 73 | 0.17 | .15 | .06 | |
| Change over 2 mo | a | b | |||
| Total sample | |||||
| Δ25(OH)D and Δlog OC | 134 | 0.25 | .004 | .004 | .019 |
| Δ25(OH)D and Δlog CTx | 136 | −0.08 | .37 | .48 | .34 |
| Black | |||||
| Δ25(OH)D and Δlog OC | 66 | 0.18 | .14 | .17 | .71 |
| Δ25(OH)D and Δlog CTx | 68 | −0.01 | .92 | .30 | .22 |
| White | |||||
| Δ25(OH)D and Δlog OC | 68 | 0.33 | .006 | .006 | .006 |
| Δ25(OH)D and Δlog CTx | 68 | −0.12 | .34 | .42 | .40 |
| Change over 6 mo | a | b | |||
| Total sample | |||||
| Δ25(OH)D and Δlog OC | 130 | 0.17 | .052 | .014 | .02 |
| Δ25(OH)D and Δlog CTx | 132 | −0.014 | .87 | .87 | .54 |
| Black | |||||
| Δ25(OH)D and Δlog OC | 63 | 0.19 | .14 | .17 | .36 |
| Δ25(OH)D and Δlog CTx | 64 | 0.01 | .93 | .88 | .45 |
| White | |||||
| Δ25(OH)D and Δlog OC | 67 | 0.13 | .28 | .062 | .03 |
| Δ25(OH)D and Δlog CTx | 68 | 0.014 | .91 | .63 | .62 |
P values <.05 are shown in bold.
Total sample adjusted for intervention, Tanner stage, sex, and race; black or white children adjusted for intervention, Tanner stage, and sex.
Total sample adjusted for intervention, Tanner stage, sex, race, and baseline 25(OH)D; black or white children adjusted for intervention, Tanner stage, sex, and baseline 25(OH)D.
At baseline, neither OC nor CTx was associated with 25(OH)D in all children, and in black children and white children when adjusted for intervention, pubertal status, sex, and race. At 2 and 6 months, change (Δ) in 25(OH)D was positively associated with the Δ OC overall and in white children when adjusted for intervention, pubertal status, race, sex, and baseline 25(OH)D.
Compliance
Three children, all in the placebo group, discontinued study medication; one was started on vitamin D supplementation by the treating physician, and the other two experienced unrelated events. By pill count, more than 80% of prescribed doses were taken by children in both the vitamin D and placebo groups. Proportions of prescribed doses taken did not differ between the two treatment arms and were confirmed by the validation procedure. Compliance did not vary by race.
Adverse effects
No child developed hypercalcemia.
Discussion
We have shown that vitamin D3 supplementation of 1000 IU/d during fall and winter in children with baseline mean 25(OH)D concentrations <20 ng/mL was safe and effective to raise their mean concentrations of 25(OH)D to 20–30 ng/mL but not to ≥30 ng/mL. Of the supplemented children with baseline 25(OH)D concentrations <20 ng/mL, only 14% reached concentrations ≥30 ng/mL at the 6-month follow-up visit. The effect of vitamin D3 supplementation varied by race and was more effective and significant only in black children.
Our observations affirm the previously observed association between baseline 25(OH)D concentration and the changes that occur in response to vitamin D supplementation (20, 21). There was a greater 2-month increase in 25(OH)D concentration with vitamin D supplementation and a strong negative association between change in 25(OH)D concentration and baseline 25(OH)D concentration in black children compared to white children. Both observations are likely functions of the black children's lower baseline 25(OH)D concentrations.
Black children had consistently higher concentrations of PTH than white children. Our findings of lower 25(OH)D and higher PTH concentrations at baseline in black than in white children is similar to the observations of Warden et al (22). In their cross-sectional study of 10- to 13-year-old early pubertal black children and white children, PTH was positively associated with bone strength at the tibial diaphysis in black but not in white children, primarily due to greater bone cross-sectional area with higher PTH concentrations. This finding calls into question the benefits of maximal PTH suppression in children.
We found that the negative association between 25(OH)D and PTH was linear without evidence of plateauing, thereby calling into question the appropriateness of using 25(OH)D-PTH dynamics as a surrogate indicator for defining optimal vitamin D status in children. This finding is in agreement with the report by Hill et al (5) and affirms their conclusion that 25(OH)D-PTH association in children is linear and lacks a threshold indicative of maximal suppression of PTH. However, our failure to find an inflection in the response curve could be attributed to insufficient range of 25(OH)D concentrations, mainly the number of 25(OH)D data points above 40 ng/mL. Whether PTH levels would plateau at higher concentrations of 25(OH)D, as reported in adults (23, 24), remains uncertain. Most importantly, our longitudinal design enabled us to examine whether the 25(OH)D-PTH within-child association over time was as strong as the cross-sectional association. We found the strength of within-child association was far less. This finding implies that any 25(OH)D-PTH associations found through cross-sectional studies are largely due to unmeasured confounding and are overly biased estimates of the causal effects of vitamin D on PTH.
In our study, overall increase in serum 25(OH)D concentration after vitamin D supplementation had no effect on PTH and bone turnover. In a total of 323 9- to 13-year-old black and white American children living at 34°N (Athens, Georgia) and 40°N (West Lafayette and Indianapolis, Indiana) with baseline mean 25(OH)D concentration of 28 ng/mL, dose-dependent increases in 25(OH)D with vitamin D supplementation (0, 400, 1000, 2000, and 4000 IU/d for 12 wk) had no effect on calcium absorption (7). In the same cohort, bone turnover markers were not associated with 25(OH)D at baseline or with change in 25(OH)D over 12 weeks (25). Therefore, raising 25(OH)D concentrations >30 ng/mL is unlikely to increase calcium absorption or have an impact on bone turnover in children. Well-designed clinical trials with longer duration of follow-up are warranted to examine the skeletal health benefits of enhancing the vitamin D status of otherwise healthy vitamin D-deficient children.
Our observed race-related differences in bone turnover and effect of vitamin D supplementation on bone turnover are in discordance with the findings of Hill et al (25). Differences in age and pubertal status of the cohorts may explain the discordance. In addition, there is a diurnal or circadian rhythm for bone turnover markers, and because markers were obtained throughout the day, we may have missed an association (26, 27). Race-related differences in the effect of vitamin D supplementation on bone turnover need further exploration.
Strengths of our study included enrollment of substantial numbers of black children, enrollment limited to periods of reduced solar ultraviolet-B radiation, and detailed characterization of determinants of vitamin D status. Limitations included reliance on a standard dose of vitamin D3, rather than multiple doses; lack of functional outcome measures such as calcium absorption and bone mineral density; and nonfasting PTH and bone turnover markers. Also, data regarding vitamin D-binding-protein (DBP) concentrations, DBP polymorphisms, and 1,25-dihydroxyvitamin D concentrations might have provided additional insight into the racial differences that we observed in PTH concentrations and into 25(OH)D-PTH dynamics. In a recent study, black adults had lower 25(OH)D and DBP concentrations than white adults but similar concentrations of estimated bioavailable 25(OH)D, both generally and within each quintile of PTH concentration (28).
In conclusion, vitamin D3 supplementation with 1000 IU/d in children with mean 25(OH)D concentration <20 ng/mL failed to raise their 25(OH)D concentration to 30 ng/mL. Of the supplemented children with baseline 25(OH)D concentrations <20 ng/mL, 39% continued to have concentrations <20 ng/mL at the 6-month follow-up visit. These findings suggest that currently recommended daily dietary allowance of vitamin D of 600 IU (2, 29) may be inadequate for preventing vitamin D deficiency in children. Overall, vitamin D supplementation had no effect on mean concentrations of PTH, OC, and CTx. Our findings of lack of effect of vitamin D supplementation on bone turnover markers may not reflect effects on skeletal health because single measurements of bone turnover markers do not correlate with bone density in children and young adults (30). We were unable to define a threshold concentration of 25(OH)D as an indicator of vitamin D sufficiency based on the relationship between 25(OH)D and PTH because we found no plateauing effect on PTH concentration with increasing concentrations of 25(OH)D. Further study is needed to examine the clinical importance of striving for higher 25(OH)D levels in children and to ascertain whether PTH levels would plateau at higher concentrations of 25(OH)D.
Acknowledgments
We thank the participants and their parents for their commitment to this project; the University of Pittsburgh's National Institutes of Health-funded Pediatric PittNet (practice-based research network) for enhancing our recruitment efforts in their affiliated pediatric offices in the greater Pittsburgh area and for facilitating study-related activities at the Children's Community Pediatrics-Armstrong practice in Kittanning, PA; and the MUH-Clinical and Translational Research Center nursing staff for their support. We also thank Jack L. Paradise, MD, for valuable editorial suggestions.
This work was supported by the following grants: National Institutes of Health Grants K23HD052550 (to K.R.), K24DK062895 (to S.L.G.), P30 AG024827 (to S.L.G.), R01HL112985 (to C.G.M.), and UL1 RR024153 (to the University of Pittsburgh Clinical and Translational Research Center and Pediatric PittNet); and a Children's Hospital of Pittsburgh Research Advisory Committee seed grant (to K.R.). The content is solely the responsibility of the authors and does not necessarily represent the official views of the National Institutes of Health.
Author Contributions: K.R. had full access to all of the data in this study and takes responsibility for the integrity and accuracy of this work as a whole from inception to publication. Other contributions of authors included: study concept and design, K.R., S.L.G., M.F.H., J.D.-J., A.N.; acquisition of data, K.R., F.O., M.A.H.; analysis and interpretation of data, K.R., C.G.M., J.Y., D.C., S.S., M.F.H., J.B., S.L.G.; drafting of the manuscript, K.R., C.G.M., J.Y., D.C.; critical revision of the manuscript, all authors; statistical analysis, C.G.M., J.Y., S.S.; securing of funding support, K.R.; and study supervision, K.R., M.A.H., S.L.G.
Disclosure Summary: The authors have no relevant financial relationships or conflicts of interest to disclose pertaining to this manuscript.
Footnotes
- BMI
- body mass index
- CTx
- collagen type 1 cross-linked C-telopeptide
- CV
- coefficient of variation
- DBP
- vitamin D-binding-protein
- OC
- osteocalcin
- 25(OH)D
- 25-hydroxyvitamin D
- Δ
- change.
References
- 1. Rajakumar K, de las Heras J, Chen TC, Lee S, Holick MF, Arslanian SA. Vitamin D status, adiposity, and lipids in black American and Caucasian children. J Clin Endocrinol Metab. 2011;96:1560–1567. [DOI] [PMC free article] [PubMed] [Google Scholar]
- 2. Institute of Medicine. Dietary reference intake for calcium and vitamin D. Washington, DC: National Academies Press; 2011. [Google Scholar]
- 3. Heaney RP, Holick MF. Why the IOM recommendations for vitamin D are deficient. J Bone Miner Res. 2011;26:455–457. [DOI] [PubMed] [Google Scholar]
- 4. Vieth R. Why the minimum desirable serum 25-hydroxyvitamin D level should be 75 nmol/L (30 ng/ml). Best Pract Res Clin Endocrinol Metab. 2011;25:681–691. [DOI] [PubMed] [Google Scholar]
- 5. Hill KM, McCabe GP, McCabe LD, Gordon CM, Abrams SA, Weaver CM. An inflection point of serum 25-hydroxyvitamin D for maximal suppression of parathyroid hormone is not evident from multi-site pooled data in children and adolescents. J Nutr. 2010;140:1983–1988. [DOI] [PMC free article] [PubMed] [Google Scholar]
- 6. Maguire JL, Birken C, Thorpe KE, Sochett EB, Parkin PC. Parathyroid hormone as a functional indicator of vitamin D sufficiency in children. JAMA Pediatr. 2014;168:383–385. [DOI] [PubMed] [Google Scholar]
- 7. Lewis RD, Laing EM, Hill Gallant KM, et al. A randomized trial of vitamin D3 supplementation in children: dose-response effects on vitamin D metabolites and calcium absorption. J Clin Endocrinol Metab. 2013;98:4816–4825. [DOI] [PMC free article] [PubMed] [Google Scholar]
- 8. Institute of Medicine. Dietary reference intakes for calcium, phosphorus, magnesium, vitamin D, and fluoride. Washington, DC: National Academies Press; 1997. [PubMed] [Google Scholar]
- 9. Chen TC, Turner AK, Holick MF. A method for the determination of the circulating concentration of vitamin D. J Nutr Biochem. 1990;1:272–276. [DOI] [PubMed] [Google Scholar]
- 10. Rockett HR, Breitenbach M, Frazier AL, et al. Validation of a youth/adolescent food frequency questionnaire. Prev Med. 1997;26:808–816. [DOI] [PubMed] [Google Scholar]
- 11. Rockett HR, Wolf AM, Colditz GA. Development and reproducibility of a food frequency questionnaire to assess diets of older children and adolescents. J Am Diet Assoc. 1995;95:336–340. [DOI] [PubMed] [Google Scholar]
- 12. Marshall WA, Tanner JM. Variations in pattern of pubertal changes in girls. Arch Dis Child. 1969;44:291–303. [DOI] [PMC free article] [PubMed] [Google Scholar]
- 13. Marshall WA, Tanner JM. Variations in the pattern of pubertal changes in boys. Arch Dis Child. 1970;45:13–23. [DOI] [PMC free article] [PubMed] [Google Scholar]
- 14. Jimbow K, Fitzpatrick TB, Wick MM. Biochemistry and physiology of melanin pigmentation. In: Goldsmith LA, ed. Physiology, Biochemistry, and Molecular Biology of the Skin. 2nd ed New York, NY: Oxford University Press; 1991:873–909. [Google Scholar]
- 15. Pathak M, Jimbow K, Szabo G, Fitzpatrick TB. Sunlight and melanin pigmentation. In: Smith K, ed. Photochemical and Photobiological Reviews. Vol 1 New York, NY: Plenum Press;1976:211–239. [Google Scholar]
- 16. Rajakumar K, Holick MF, Jeong K, et al. Impact of season and diet on vitamin D status of African American and Caucasian children. Clin Pediatr (Phila). 2011;50:493–502. [DOI] [PMC free article] [PubMed] [Google Scholar]
- 17. Holick MF, Siris ES, Binkley N, et al. Prevalence of vitamin D inadequacy among postmenopausal North American women receiving osteoporosis therapy. J Clin Endocrinol Metab. 2005;90:3215–3224. [DOI] [PubMed] [Google Scholar]
- 18. Rajakumar K, Fernstrom JD, Janosky JE, Greenspan SL. Vitamin D insufficiency in preadolescent African-American children. Clin Pediatr (Phila). 2005;44:683–692. [DOI] [PubMed] [Google Scholar]
- 19. Aloia JF, Talwar SA, Pollack S, Feuerman M, Yeh JK. Optimal vitamin D status and serum parathyroid hormone concentrations in African American women. Am J Clin Nutr. 2006;84:602–609. [DOI] [PMC free article] [PubMed] [Google Scholar]
- 20. Holick MF, Chen TC. Vitamin D deficiency: a worldwide problem with health consequences. Am J Clin Nutr. 2008;87:1080S–1086S. [DOI] [PubMed] [Google Scholar]
- 21. Ng K, Scott JB, Drake BF, et al. Dose response to vitamin D supplementation in African Americans: results of a 4-arm, randomized, placebo-controlled trial. Am J Clin Nutr. 2014;99:587–598. [DOI] [PMC free article] [PubMed] [Google Scholar]
- 22. Warden SJ, Hill KM, Ferira AJ, et al. Racial differences in cortical bone and their relationship to biochemical variables in black and white children in the early stages of puberty. Osteoporos Int. 2013;24:1869–1879. [DOI] [PMC free article] [PubMed] [Google Scholar]
- 23. Chapuy MC, Preziosi P, Maamer M, et al. Prevalence of vitamin D insufficiency in an adult normal population. Osteoporos Int. 1997;7:439–443. [DOI] [PubMed] [Google Scholar]
- 24. Malabanan A, Veronikis IE, Holick MF. Redefining vitamin D insufficiency. Lancet. 1998;351:805–806. [DOI] [PubMed] [Google Scholar]
- 25. Hill KM, Laing EM, Hausman DB, et al. Bone turnover is not influenced by serum 25-hydroxyvitamin D in pubertal healthy black and white children. Bone. 2012;51:795–799. [DOI] [PMC free article] [PubMed] [Google Scholar]
- 26. Chubb SA. Measurement of C-terminal telopeptide of type I collagen (CTX) in serum. Clin Biochem. 2012;45:928–935. [DOI] [PubMed] [Google Scholar]
- 27. Heuck C, Skjaerbaek C, Wolthers OD. Diurnal rhythm of serum osteocalcin in normal children. Acta Paediatr. 1998;87:930–932. [DOI] [PubMed] [Google Scholar]
- 28. Powe CE, Evans MK, Wenger J, et al. Vitamin D-binding protein and vitamin D status of black Americans and white Americans. N Engl J Med. 2013;369:1991–2000. [DOI] [PMC free article] [PubMed] [Google Scholar]
- 29. American Academy of Pediatrics. Statement of endorsement. Dietary reference intakes for calcium and vitamin D. Pediatrics. 2012;130:e1424. [Google Scholar]
- 30. van der Sluis IM, Hop WC, van Leeuwen JP, Pols HA, de Muinck Keizer-Schrama SM. A cross-sectional study on biochemical parameters of bone turnover and vitamin D metabolites in healthy Dutch children and young adults. Horm Res. 2002;57:170–179. [DOI] [PubMed] [Google Scholar]