

Abstract
Context:
Short sleep duration and poor sleep quality are associated with cardiovascular outcomes. One mechanism proposed to explain this association is altered diurnal cortisol secretion.
Objective:
The objective of the study was to examine the associations of sleep duration and sleep quality with diurnal salivary cortisol levels.
Design:
This was a cross-sectional analysis using data from examination 5 (2010–2012) of the Multi-Ethnic Study of Atherosclerosis. Actigraphy-based measures of sleep duration and efficiency were collected over 7 days, and salivary cortisol samples were collected over 2 days from participants aged 54–93 years (n = 600 with analyzable data).
Results:
Shorter average sleep duration (<6 h/night) was associated with less pronounced late decline in cortisol [2.2% difference in slope; 95% confidence interval (CI) 0.8–3.7; P ≤ .01] and less pronounced wake-to-bed slope (2.2% difference; 95% CI 1.0–3.4; P ≤ .001) compared with longer sleep duration (≥6 h/night). Lower sleep efficiency (<85%) was associated with less pronounced early decline in cortisol (29.0% difference in slope; 95% CI 4.1–59.7; P < .05) compared with higher sleep efficiency (≥85%). Subjects reporting insomnia had a flatter cortisol awakening response (−16.1% difference in slope; 95% CI −34.6 to −0.1; P < .05) compared with those not reporting insomnia.
Conclusions:
Shorter sleep duration, lower sleep efficiency, and insomnia are associated with alterations in diurnal cortisol levels consistent with changes in hypothalamic-pituitary-adrenal regulation.
The impact of sleep duration and sleep quality on health is widely recognized. Short sleep duration and poor sleep quality have been linked to coronary heart disease (1), cardiovascular disease (CVD) (2), and CVD risk factors (3). Short sleep duration has also been linked to higher risk of subclinical CVD (4). Insomnia is also associated with a higher risk of coronary heart disease (5) and CVD mortality (6).
One potential mechanistic link between sleep and health outcomes involves alteration of the function of the hypothalamic-pituitary-adrenal (HPA) axis with consequences for cortisol levels over the day. Diurnal cortisol exhibits a marked circadian pattern, with an early morning peak within the first 30 minutes after awakening termed the cortisol awakening response (CAR) (7). The CAR is followed by a steep decline during 2 hours after awakening (early decline) and then a slow decline over the rest of the day (evening decline) (8). Studies of the association between sleep duration and/or sleep quality and measures of diurnal cortisol have been inconsistent. Small experimental studies in healthy young volunteers found increased evening cortisol (9), decreased nighttime cortisol (10), or no CAR changes after sleep deprivation or disturbance (11). Observational studies have also been inconclusive. For example, short sleep duration was associated with increased CAR and shallower slope in cortisol (12), and poor sleep quality was associated with shallower slope in cortisol (12, 13). However, other observational studies found no association (14, 15). Dysregulation of the HPA has also been linked to diabetes (16), obesity (17), postpartum depression (18), and posttraumatic stress disorder (19).
Short sleep duration may also be associated with adverse cardiometabolic outcomes when accompanied by insomnia symptoms (20). For example, the joint presence of insomnia and short sleep duration has been linked to higher risk of hypertension (21). However, the relationship between insomnia and cortisol has been investigated in only a few small studies and the findings are inconsistent (22–25).
Limitations of prior studies include lack of objective measures of sleep duration and quality and limited sampling of cortisol levels across the day. We hypothesized that participants with short sleep duration or poor sleep quality would have less pronounced CAR and shallower cortisol decline during the day than those with longer sleep duration or good sleep quality. We further hypothesized that short sleep duration may be associated with cortisol alterations only when insomnia is present.
Materials and Methods
Participants
The Multi-Ethnic Study of Atherosclerosis (MESA) is a longitudinal study designed to investigate risk factors for subclinical CVD. In 2000–2002, MESA recruited 6814 men and women to MESA examination 1 (26). At recruitment, participants were 45–84 years old, free of clinical CVD, and included four racial/ethnic groups (white, African-Americans, Asians, and Hispanics) from six US communities. Recruitment used several population-based approaches, including lists of area of residents, area residents enrolled in a union health plan, random digit dialing, and lists from the Centers for Medicare and Medicaid Services (27). MESA was approved by the institutional review board at each field centers, and all participants gave written informed consent.
The MESA Stress ancillary study enrolled 1082 MESA participants at the New York, Los Angeles, and Baltimore field centers during MESA examination 5 (2010–2012). Trained staff instructed participants to collect eight saliva samples per day for 2 successive days (directly on waking; 30 min after waking; 1 h after finishing breakfast; 10:00 am; 12:00 pm or before lunch, whichever was earlier; 4:00 pm; 6:00 pm or before dinner, whichever was earlier; and at bedtime). Participants were instructed to record the exact time of sample collection. Salivary samples were stored at −20°C until analysis. Salivary cortisol level was determined using a commercially available chemiluminescence assay with high sensitivity (0.16 ng/mL) (IBL-Hamburg). Intra- and interassay coefficients of variation for the assay were less than 8%.
The MESA Sleep Study was a second ancillary study also conducted at examination 5. Exclusions were use of oral airways support devices, nocturnal oxygen or nightly continuous positive airway pressure. The protocol included 1-night home polysomnography, 7-day actigraphy (Actiwatch Spectrum; Philips Respironics) together with a sleep diary and a sleep questionnaire. The actigraph senses signals generated by movements of the wrist and translates them into activity counts, which are gathered continuously and stored into epochs of 1 minute. Actigraphic data during 30-second epochs were scored as sleep or wake by Actiware-Sleep version 5.59 analysis software (Mini Mitter Co, Inc). A validated algorithm (28) was used to yield the final activity count for each epoch. Intrascorer intraclass correlation coefficients for average sleep duration and sleep efficiency were 0.91 and 0.97.
At the three MESA Stress field centers, 622 subjects participated in the sleep study. Of these, 11 participants with less than 3 hours/night and 11 participants with 9 or more hours/night average sleep duration were excluded. Our final sample comprised 600 participants.
Outcome variables
The daily cortisol profile was characterized using up to 16 measures of cortisol per participant. The variables derived were cortisol awakening level, CAR, early decline, and late decline (Figure 1). Additionally, we used two standard summary measures of cortisol: the wake-to-bed slope and area under the curve (AUC) for a 16-hour day.
Figure 1.
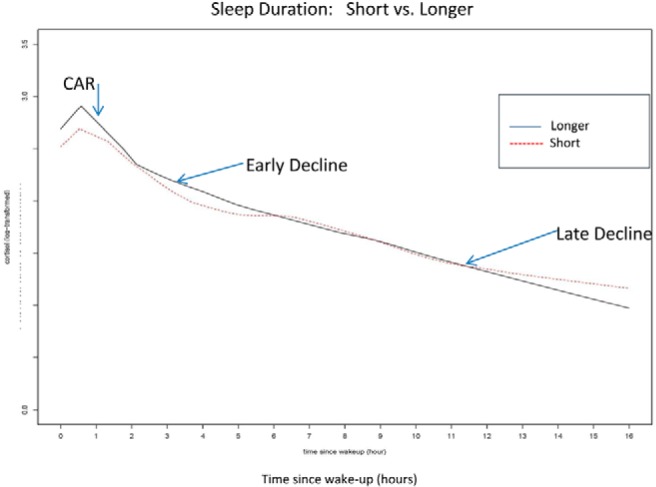
Short sleepers had lower cortisol at awakening and at 30 minutes after as well as slower decline later in the day and higher levels of cortisol at bedtime than longer sleepers.
Exposure variables
Sleep variables were averaged across all nights that the actigraph was worn. Sleep duration was defined as the average duration of sleep between sleep onset (sleep start time) and morning wakening (sleep end time) while in bed after lights off. Total sleep time was defined as the average duration in minutes of sleep time during in-bed intervals and calculated by taking the sum of all time asleep across the recording and dividing by the total number of main sleep periods. Sleep duration was estimated as a continuous variable (range 3 to <9 h); in addition, less than 6 hours was defined as short sleep. Sleep efficiency, an objective measure of sleep quality, was defined as the percentage of time in bed after lights off spent sleeping. Sleep efficiency was calculated by taking the sum of all sleep time divided by the sum of all in bedtime during main sleep intervals across the recording and multiplied by 100 to obtain a percentage. Sleep efficiency was analyzed as a continuous variable; in addition, less than 85% was defined as poor quality.
Insomnia, a subjective measure of sleep quality, was assessed based on self-report using the Women's Health Initiative Insomnia Rating Scale (WHIIRS), a five-item questionnaire designed to evaluate insomnia symptoms. The summary score ranged from 0 to 20. A score of 9 or more is considered clinically significant insomnia (29).
Covariates at MESA examination 5
Age, sex, race/ethnicity, awakening time, income-wealth index (27), smoking status, alcohol consumption, body mass index, and depression using the 20-item Center for Epidemiology Studies-Depression (CES-D) scale were examined. CES-D score range is 0–60, with a higher score indicating more symptoms (30). Depression was defined as CESD of 16 or greater (31). Other covariates were diabetes, hypertension and use of medications for sleep and/or mood, oral and inhaled steroids, and hormone replacement therapy. The apnea hypopnea index was derived from the polysomnography and was defined as all apneas plus hypopneas with a 3% or greater desaturation or an arousal.
Analysis
A total of 8985 salivary samples were included in the analysis after excluding samples with no time of collection, insufficient sample for assay, or unreliable cortisol value (0 or >100 nmol/L) (163 samples excluded). Differences in cortisol variables and covariates by categories of sleep duration and sleep efficiency were evaluated by an ANOVA, the Kruskall Wallis test, or χ2 test. Cortisol was transformed using the natural logarithm because of skewed distribution. We examined the shape of the diurnal cortisol profile (Figure 1) using locally estimated scatter plot smoothing.
Associations of sleep measures with features of the daily cortisol curve were examined using piecewise linear regression mixed models (32). We used linear regression splines with knots at 30 and 120 minutes after wake-up to capture the inflections of the diurnal cortisol profile. Analyses of sleep duration and sleep quality were performed using both categorical and continuous measures.
Model 1 included adjustment for time of wake-up, first vs second day of salivary collection, age, gender, race/ethnicity, and income-wealth index. Model 2 was additionally adjusted for body mass index, smoking, alcohol consumption, medications, and apnea hypopnea index. Model 3 additionally included hypertension, diabetes, and depression. Model 4 for sleep duration included covariates in model 3 plus sleep efficiency; for sleep efficiency as the predictor, model 4 included sleep duration as a covariate; and for insomnia as the predictor, model 4 included sleep efficiency as a covariate. All covariates were entered as main effects and also as two-way interaction terms with the three-spline pieces. Coefficients and their confidence intervals obtained from the models were exponentiated to be interpreted as percentage differences between categories of the predictor variable.
We also estimated the wake-to-bed slope, which is the slope of the decline of cortisol between wake-up and bedtime, and the AUC for a 16-hour day. Both measures were estimated within the mixed model.
We explored effect modification using stratified analyses to study the role of insomnia in the association of sleep duration with alterations in the diurnal cortisol level. A test for interaction between insomnia symptoms and sleep duration was used to test whether the association of sleep duration with cortisol differed between subjects with and without insomnia. We first examined whether the insomnia covariate was statistically significant with P < .2, and then we included in the model the main effect, two-way interactions with the three spline pieces, and three-way interactions (insomnia, sleep duration, each of the three spline pieces).
We performed secondary analyses in which we restricted our sample to participants younger than 75 years, to those without depression, to nonusers of antidepressants, to nonusers of oral/inhaled steroids, and to participants with an apnea hypopnea index of less than 15 (without moderate or severe sleep apnea). We also investigated alternative cut points for sleep duration and sleep efficiency.
Results
Table 1 shows summary characteristics for the 600 participants included in the analyses. Our overall sample consisted of 316 women (53%) and 284 men (47%) from three different race/ethnic backgrounds: Hispanic (40%), African-American (32%), and white (28%). Mean age was 69.2 ± 9 years.
Table 1.
Demographic and Clinical Characteristics of Participants (n = 600) by Sleep Duration and Sleep Efficiency, MESA Study (2010–2012)
| Sleep Duration (hours) |
Sleep Efficiency (%) |
|||||
|---|---|---|---|---|---|---|
| n (%) or Mean ± SD |
P Value* | n (%) or Mean ± SD |
P Value* | |||
| <6 h (n = 202) | ≥6 h (n = 398) | <85% (n = 60) | ≥85% (n = 540) | |||
| Demographics | ||||||
| Age, y | 68.6 ± 9.0 | 69.4 ± 9.0 | .31 | 70.3 ± 7.4 | 69.0 ± 9.2 | .21 |
| Male | 106 (53) | 178 (45) | .07 | 35 (58) | 249 (46) | .07 |
| Race/ethnicity | <.0001 | .17 | ||||
| White | 36 (18) | 130 (33) | 11 (18) | 155 (29) | ||
| Black | 92 (45) | 99 (25) | 24 (40) | 167 (31) | ||
| Hispanic | 74 (37) | 169 (42) | 25 (42) | 218 (40) | ||
| Income-wealth index | .14 | .03 | ||||
| 0–1 | 33 (18) | 41 (12) | 12 (21) | 62 (13) | ||
| 2–3 | 41 (22) | 83 (24) | 5 (9) | 119 (25) | ||
| 4–6 | 80 (43) | 142 (41) | 28 (49) | 194 (41) | ||
| 7–8 | 33 (18) | 83 (24) | 12 (21) | 104 (22) | ||
| Married | 98 (50) | 230 (59) | .05 | 35 (59) | 293 (56) | .57 |
| Lifestyle characteristics | ||||||
| Body mass index | 30.6 (5.7) | 28.9 (5.0) | <.001 | 30.7 (6.2) | 29.3 (5.2) | .05 |
| Smoking status | .05 | .28 | ||||
| Current | 23 (11) | 25 (6) | 4 (7) | 44 (8) | ||
| Former and quit >1 y ago | 66 (33) | 156 (39) | 28 (47) | 194 (36) | ||
| Never | 112 (56) | 215 (54) | 28 (47) | 299 (56) | ||
| Alcohol consumption | 75 (37) | 164 (41) | .36 | 23 (38) | 216 (40) | .79 |
| Hypertension | 127 (63) | 231 (58) | .25 | 37 (62) | 321 (59) | .74 |
| Diabetes | 83 (41) | 165 (42) | .91 | 30 (50) | 218 (41) | .16 |
| Depression CES-D >16 | 39 (20) | 58 (15) | .12 | 11 (19) | 86 (16) | .63 |
| Oral steroid users | 3 (2) | 5 (1) | .82 | 2 (3) | 6 (1) | .15 |
| Inhaled steroid users | 11 (6) | 4 (1) | <.001 | 2 (3) | 13 (2) | .66 |
| Antihypertensive users | 122 (60) | 218 (55) | .19 | 35 (58) | 305 (57) | .78 |
| HRT users | 4 (2) | 14 (4) | .30 | 0 (0) | 18 (3) | .15 |
| Antidepressant users | 17 (8) | 49 (12) | .15 | 6 (10) | 60 (11) | .79 |
Abbreviation: HRT, hormone replacement therapy.
Either χ2 or t test/ANOVA or Kruskall Wallis test for variables nonnormally distributed.
Sleep duration
Participant characteristics according to sleep duration less than 6 hours (n = 202) and 6 hours or longer (n = 398) are shown in Tables 1 and 2. The median (interquartiles: Q1–Q3) evening cortisol (at bedtime) was higher among short sleepers (3.6 nmol/L, 2.1–7.0) compared with longer sleepers (3.3 nmol/L, 1.9–5.3; P = .03). The normal median for the evening cortisol in this assay is approximately 2.0 nmol/L (10th percentile of 0.1 to 90th percentile of 6.0). Men, African-Americans, low-income participants, and participants who were obese, diabetic, used inhaled steroids, or had low sleep efficiency had lower average sleep duration than their counterparts (Supplemental Table 1). Figure 1 shows locally estimated scatter plot smoothing curves for the daily cortisol profile stratified by sleep duration.
Table 2.
Sleep Characteristics and Diurnal Cortisol Values of Participants (n = 600) by Sleep Duration and Sleep Efficiency, MESA Study (2010–2012)
| Sleep Variables | Sleep Duration, h |
Sleep Efficiency, % |
||||
|---|---|---|---|---|---|---|
| n (%) or Mean ± SD |
P Value* | n (%) or Mean ± SD |
P Value* | |||
| <6 h (n = 202) | ≥6 h (n = 398) | <85% (n = 60) | ≥85% (n = 540) | |||
| Any insomnia symptoma | 75 (38) | 134 (34) | .36 | 24 (41) | 185 (35) | .37 |
| Sleep efficiency, % | ||||||
| Low (<85%) | 32 (16) | 28 (7) | <.001 | NA | NA | |
| Sleep duration | ||||||
| Short (<6 h) | NA | NA | 28 (47) | 370 (69) | <.001 | |
| Apnea hypopnea index ≥15b | 109 (63) | 214 (58) | .34 | 39 (72) | 284 (58) | <.05 |
| Cortisol measures, median (Q1–Q3), nmol/L | ||||||
| Wake-up | 15.2 (10.0–20.5) | 16.5 (11.4–24.4) | .02 | 13.9 (7.1–19.8) | 16.2 (11.2–22.9) | .02 |
| 30 min later | 19.7 (12.0–29.4) | 23.7 (15.7–31.9) | .006 | 17.4 (11.3–29.0) | 22.9 (15.2–31.6) | .01 |
| 1 h after breakfast | 11.6 (8.0–16.5) | 11.4 (8.4–16.4) | .90 | 11.7 (8.6–15.0) | 11.4 (8.2–16.5) | .84 |
| 10:00 am | 8.8 (6.2–12.3) | 9.0 (6.6–13.1) | .21 | 8.9 (6.5–14.5) | 9.0 (6.5–12.5) | .74 |
| Noon | 7.7 (5.0–11.3) | 7.5 (5.3–10.5) | .62 | 7.0 (5.0–11.9) | 7.6 (5.2–10.6) | .95 |
| 4:00 pm | 5.6 (3.7–9.1) | 5.5 (3.6–8.2) | .83 | 5.7 (3.4–8.7) | 5.5 (3.7–8.3) | .90 |
| 6:00 pm | 4.2 (2.8–6.6) | 4.1 (2.6–6.6) | .77 | 4.3 (2.5–7.0) | 4.1 (2.7–6.4) | .86 |
| Bedtime | 3.6 (2.1–7.0) | 3.3 (1.9–5.3) | .03 | 3.1 (1.8–5.5) | 3.4 (2.0–5.8) | .64 |
Either χ2 or t test/ANOVA or Kruskall Wallis test for variables nonnormally distributed.
Assessed by WHIIRS score of 9 or greater is insomnia.
Apnea [all apneas and hypopnea per hour of the sleep with ≥3% desaturation − index (apnea hypopnea index)].
Table 3 (first column) shows percentage differences and 95% confidence intervals (CIs) between short and longer sleep duration in features of the daily cortisol curve and the wake-to-bed slope and AUC. Short sleep duration was associated with less pronounced late decline in all models (model 4, 2.2% difference in slope; 95% CI 0.8–3.7; P ≤ .01) and with less pronounced wake-to-bed slope in all models (model 4, 2.2% difference; 95% CI 1.0–3.4; P ≤ .001). Short sleep duration was not associated with AUC. Consistent patterns were observed when sleep duration was investigated as a continuous variable (Supplemental Table 2, first column).
Table 3.
Percentage Differences (95% CIs) in Features of the Daily Cortisol (Wake-Up, CAR, Early Decline, and Late Decline) and Summary Measures of Cortisol (Wake to Bed Slope and AUC) Associated With Sleep Duration and Sleep Efficiency
| Sleep Durationa (<6 h vs ≥6 to <9 h) | Sleep Efficiencyb (<85% vs ≥85%) | |
|---|---|---|
| Percentage difference in wake-up | ||
| Model 1c | −11.93 (−30.9, 4.3) | −33.73 (−81.5, 1.5) |
| Model 2d | −12.57 (−34.4, 5.7) | −37.91 (−93.8, 1.8) |
| Model 3e | −10.95 (−33.0, 7.4) | −39.44 (−97.4, 1.5) |
| Model 4f | −8.20 (−29.1, 9.3) | −36.98 (−93.5, 3.0) |
| Percentage difference in CAR | ||
| Model 1c | −8.70 (−25.2, 5.6) | −2.00 (−27.6, 18.47) |
| Model 2d | −8.16 (−26.6, 7.6) | 0.29 (−21.9, 28.7) |
| Model 3e | −9.40 (−28.5, 6.9) | 0.09 (−22.2, 28.8) |
| Model 4f | −9.57 (−27.9, 6.1) | 2.35 (−20.1, 31.0) |
| Percentage difference in early decline | ||
| Model 1c | 6.34 (−5.0, 19.0) | 22.12 (0.7, 48.2)g |
| Model 2d | 6.02 (−6.4, 20.0) | 25.97 (2.8, 54.4)g |
| Model 3e | 5.28 (−7.3, 19.6) | 27.65 (3.7, 57.2)g |
| Model 4f | 2.35 (−9.7, 15.9) | 28.96 (4.1, 59.7)g |
| Percentage difference in late decline | ||
| Model 1c | 1.86 (0.6, 3.1)h | −0.85 (−2.7, 1.0) |
| Model 2d | 2.02 (0.7, 3.4)h | −1.05 (−3.2, 1.0) |
| Model 3e | 2.05 (0.7, 3.5)h | −0.98 (−3.1, 1.1) |
| Model 4f | 2.23 (0.8, 3.7)h | −1.84 (−4.2, 0.4) |
| Summary measures of cortisol | ||
| Percentage difference in wake-to-bed slope | ||
| Model 1c | 2.15 (1.1, 3.2)i | 0.45 (−1.2, 2.1) |
| Model 2d | 2.33 (1.2, 3.5)i | 0.59 (−1.2, 2.4) |
| Model 3e | 2.27 (1.1, 3.5)i | 0.75 (−1.0, 2. 6) |
| Model 4f | 2.22 (1.0, 3.4)j | 0.06 (−1.8, 1.9) |
| Percentage difference in AUC | ||
| Model 1c | 0.34 (−10.6, 12.7) | −8.97 (−32.6, 10.5) |
| Model 2d | 0.77 (−11.4, 14.9) | −6.56 (−32.8, 14.5) |
| Model 3e | 0.28 (−12.1, 14.5) | −5.51 (−32.2, 15.8) |
| Model 4f | −0.15 (−14.6, 12.5) | −5.28 (−32.8, 16.6) |
Bold values indicate significance.
Sleep duration was estimated as dichotomized [short sleep duration (3 to <6 h)] vs longer (reference ≥6 h to <9 h).
Sleep efficiency was estimated as dichotomized [low sleep efficiency (<85%)] vs high (reference ≥85%).
Model 1: model adjusted for day of salivary collection, time of wake-up, gender, age, race/ethnicity, and income-wealth index.
Model 2: model 1 + body mass index, smoking, alcohol consumption, medications (oral and inhaled steroids, hormone replacement therapy, sleep medication, and antidepressants) and apnea hypopnea index.
Model 3: model 2 + hypertension, diabetes, and depression.
Model 4: model 3 + sleep efficiency (as continuous) or sleep duration (as continuous) in models for sleep duration and sleep efficiency, respectively.
P < .05.
P ≤ .01.
P ≤ .0001.
P ≤ .001.
Sleep efficiency
Sleep efficiency ranged from 71.6% to 97.0%. Tables 1 and 2 show participant characteristics classified according to sleep efficiency. There was no difference in the evening cortisol between those participants with low vs higher sleep efficiency.
Low sleep efficiency was associated with less pronounced early decline in all models (model 4, 29.0% difference in slope; 95% CI 4.1–59.7; P ≤ .05) (Table 3). Sleep efficiency was not associated with the wake-to-bed slope or AUC. Consistent patterns were observed when sleep efficiency was investigated as a continuous variable (Supplemental Table 2, second column).
Insomnia
In the analytical sample, 209 participants (35%) reported insomnia symptoms (Supplemental Table 3). This group was more likely to include women, to be in the lowest categories of the income-wealth index, and to report higher scores of depression symptoms and hostility compared with those without insomnia symptoms.
Table 4 shows the associations between insomnia and cortisol levels in the full sample and stratified by short vs longer sleep duration. Overall, insomnia was associated with less pronounced CAR in models 1, 2, and 4 (model 4, −16.1% difference; 95% CI −34.6 to −0.1; P < .05) (Table 4, first column). In the subsample of short sleepers, insomnia was associated with less pronounced CAR compared with those without insomnia in all models (model 4, −37.7% difference; 95% CI −79.4 to −5.7; P < .05) (Table 4, second column). In the subsample of longer sleepers, insomnia was associated with only a more pronounced late decline in cortisol compared with those without insomnia in all models (Table 4, third column).
Table 4.
Percentage Differences (95% CIs) in Features of the Daily Cortisol (Wake-Up, CAR, Early Decline, and Late Decline) and Summary Measures of Cortisol (Wake to Bed Slope and AUC) Associated With Insomnia and Stratified by Short and Longer Sleepers
| Insomnia vs Noninsomniaa |
|||
|---|---|---|---|
| Overall Sample (3 to <9 h) | Short Sleepers (<6 h) | Longer Sleepers (≥6 h) | |
| Percentage difference in wake-up | |||
| Model 1c | 8.28 (−5.9, 24.7) | 5.43 (−17.5, 34.8) | 11.17 (−6.6, 32.3) |
| Model 2d | 6.40 (−8.7, 24.0) | 9.40 (−17.5, 45.1) | 7.10 (−10.7, 28.5) |
| Model 3e | 5.70 (−9.5, 23.5) | 7.63 (−19.4, 43.8) | 7.85 (−10.1, 29.3) |
| Model 4f | 6.97 (−8.6, 25.2) | 10.86 (−16.9, 47.9) | 8.18 (−10.0, 30.0) |
| Percentage difference in CAR | |||
| Model 1c | −18.73 (−36.1, −3.5)g | −38.86 (−77.5, −8.6)g | −8.30 (−27.2, 7.8) |
| Model 2d | −16.43 (−35.0, −0.4)h | −33.40 (−76.17, −1.0)h | −7.12 (−27.2, 9.8) |
| Model 3e | −15.90 (−34.8, 0.3) | −36.53 (−80.5, −3.3)h | −5.90 (−25.2, 10.4) |
| Model 4f | −16.11 (−34.6, −0.1)h | −37.74 (−79.4, −5.7)h | −5.90 (−25.4, 10.6) |
| Percentage difference in early decline | |||
| Model 1c | 11.44 (0.7, 23.3)h | 15.85 (−4.6, 40.7) | 9.75 (−2.3, 23.3) |
| Model 2d | 9.87 (−1.17, 22.2) | 9.90 (−11.5, 36.4) | 9.76 (−2.7, 23.8) |
| Model 3e | 8.65 (−2.7, 21.3) | 9.31 (−12.5, 36.5) | 8.80 (−4.1, 21.8) |
| Model 4f | 7.52 (–3.5, 19.8) | 6.12 (-13.9, 30.9) | 7.80 (−4.3, 21.5) |
| Percentage difference in late decline | |||
| Model 1c | −1.05 (−2.3, 0.2) | 0.22 (−1.9, 2.4) | −2.02 (−3.4, −0.7)g |
| Model 2d | −1.06 (−2.4, 0.2) | 0.35 (−2.0, 2.7) | −2.01 (−3.5, −0.7)g |
| Model 3e | −1.12 (−2.5, 0.2) | 0.53 (−1.8, 2.9) | −2.19 (−3.7, −0.7)g |
| Model 4f | −1.09 (−2.4, 0.2) | 0.91 (−1.4, 3.3) | −2.27 (−3.7, −0.8)g |
| Summary measures of cortisol | |||
| Percentage difference in wake-to-bed slope | |||
| Model 1c | −0.60 (−1.6, 0.4) | 0.17 (−1.7, 2.1) | −1.20 (−2.5, −0.1)h |
| Model 2d | −0.67 (−1.8, 0.4) | −0.07 (−2.2, 2.0) | −1.20 (−2.3, −0.1)h |
| Model 3e | −0. 78 (−1.9, 0.3) | 0.07 (−2.0, 2.2) | −1.38 (−2.5, −0.3)g |
| Model 4f | −0.86 (−2.0, 0.3) | 0.14 (−2.0, 2.3) | −1.52 (−2.6, −0.4)g |
| Percentage difference in AUC | |||
| Model 1c | −0.38 (−11.4, 9.6) | −5.45 (−30.2, 14.6) | 3.40 (−8.0, 16.2) |
| Model 2d | −2.26 (−14.4, 8.6) | −4.31 (−30.9, 16.9) | 0.47 (−11.1, 13.6) |
| Model 3e | −4.43 (−17.3, 7.0) | −8.07 (−35.7, 13.9) | −0.60 (−14.3, 11.5) |
| Model 4f | −4.66 (−17.7, 6.9) | −7.77 (−35.5, 14.3) | −1.17 (−15.2, 11.2) |
Bold values indicate significance.
Insomnia symptoms WHIIRS [insomnia (score ≥9) vs noninsomnia (reference, score <9)].
Sleep efficiency at 85% cutoff [low sleep efficiency (<85%) vs higher sleep efficiency (reference, ≥85%)].
Model 1: model adjusted for day of salivary collection, time of wake-up, gender, age, race/ethnicity, and income-wealth index.
Model 2: model 1 + body mass index, smoking, alcohol consumption, and medications (oral and inhaled steroids, hormone replacement therapy, sleep medication, and antidepressants) and apneas and hypopneas index.
Model 3: model 2 + hypertension, diabetes, and depression.
Model 4 (for insomnia): model 3 + sleep efficiency.
P ≤ .01.
P < .05.
We also compared the association between sleep duration and salivary cortisol in participants with and without insomnia. In the group with insomnia (Table 5, first column), short sleep duration was associated with less pronounced CAR in models 3 and 4 and with less pronounced late decline in cortisol in all models (model 4, 3.6% difference in slope; 95% CI 1.2–6.0; P ≤ .01) compared with longer sleep duration. This was not observed in the group without insomnia (Table 5, second column). Both the groups with and without insomnia showed less steepness in the wake-to-bed cortisol slope in those with short vs longer sleep duration (Table 5). The statistical test for interaction between insomnia and sleep duration was of marginal significance (P for interaction = .1).
Table 5.
Percentage Differences (95% CIs) in Features of the Daily Cortisol (Wake-Up, CAR, Early Decline, and Late Decline) and Summary Measures of Cortisol (Wake to Bed Slope and AUC) Associated With Sleep Duration Stratified by Insomnia Symptomsa
| Sleep Duration, Dichotomizedb (Reference, ≥6 h of sleep) |
||
|---|---|---|
| With Insomnia (n = 209) | Without Insomnia (n = 382) | |
| Percentage difference in wake-up | ||
| Model 1c | −13.43 (−38.7, 7.2) | −10.65 (−37.6, 11.0) |
| Model 2d | −14.49 (−40.5, 6.7) | −15.93 (−48.1, 9.2) |
| Model 3e | −10.21 (−36.0, 10.7) | −14.34 (−46.9, 11.0) |
| Model 4f | −8.39 (−34.1, 12.4) | −10.71 (−41.5, 13.4) |
| Percentage difference in CAR | ||
| Model 1c | −28.43 (−68.4, 2.0) | 0.97 (−13.9, 18.4) |
| Model 2d | −26.65 (−71.7, 6.6) | 2.21 (−14.6, 22.4) |
| Model 3e | −36.89 (−85.5, −1.0)g | 2.98 (−13.9, 23.2) |
| Model 4f | −31.93 (−71.5, −1.5)g | 0.16 (−16.9, 20.8) |
| Percentage difference in early decline | ||
| Model 1c | 5.48 (−13.5, 28.7) | 3.89 (−9.1, 19.3) |
| Model 2d | 3.70 (−16.5, 28.8) | 6.12 (−9.0, 23.7) |
| Model 3e | 5.65 (−15.7, 32.5) | 5.12 (−9.7, 22.4) |
| Model 4f | 2.29 (−16.6, 25.5) | 3.11 (−11.8, 20.6) |
| Percentage difference in late decline | ||
| Model 1c | 3.39 (1.2, 5.6)h | 1.37 (−0.2, 2.9) |
| Model 2d | 3.53 (1.3, 5.8)i | 1.37 (−0.3, 3.1) |
| Model 3e | 3.68 (1.4, 6.0)i | 1.30 (−0.4, 3.0) |
| Model 4f | 3.55 (1.2, 6.0)i | 1.61 (−0.1, 3.4) |
| Summary measures of cortisol | ||
| Percentage difference in wake-to-bed slope | ||
| Model 1c | 2.93 (1.0, 4.9)i | 1.82 (0.5, 3.1)i |
| Model 2d | 2.98 (1.1, 4.9)h | 2.07 (0.7, 3.5)i |
| Model 3e | 3.05 (1.0, 5.1)i | 1.96 (0.6, 3.4)i |
| Model 4f | 2.85 (1.0, 5.0)i | 2.02 (0.6, 3.5)i |
| Percentage difference in AUC | ||
| Model 1c | −9.87 (−31.4, 8.1) | 4.54 (−10.4, 22.0) |
| Model 2d | −11.12 (−33.8, 7.7) | 4.00 (−12.5, 23.6) |
| Model 3e | −11.51 (−34.8, 7.7) | 4.43 (−12.2, 24.2) |
| Model 4f | −11.40 (−34.9, 8.0) | 4.10 (−13.0, 24.5) |
Bold values indicate significance.
Insomnia symptoms (WHIIRS), dichotomized as with insomnia (score ≥9) and without insomnia.
Sleep duration was dichotomized [short sleep duration (<6 h)] vs longer (reference, ≥6 h to <9 h).
Model 1: model adjusted for day of salivary collection, time of wake-up, gender, age, race/ethnicity, and income-wealth index.
Model 2: model 1 + body mass index, smoking, alcohol consumption, medications (oral and inhaled steroids, hormone replacement therapy, sleep medication, and antidepressants) and apnea hypopnea index.
Model 3: model 2 + hypertension, diabetes, and depression.
Model 4: model 3 + sleep efficiency (as continuous).
P < .05.
P ≤ .001
P ≤ .01.
Secondary analyses
Participants with depression represented 17% of our sample (n = 600). Only the second sample of salivary cortisol (taken 30 min after awake) was different among those who had CES-D of 16 or greater (median 18.9 nmol/L, Q1–Q3 = 12.8–28.9) compared with those with CES-D less than 16 (median 22.3 nmol/L, Q1–Q3 = 15.5–31.5) (Supplemental Table 4). Salivary cortisol level did not differ between participants with depression taking antidepressants compared with those who were not or between those with hypertension or diabetes compared with those without hypertension or diabetes.
Results of analyses restricted to participants younger than 75 years old, those without depression, nonusers of antidepressants, nonusers of oral/inhaled steroids, and participants without moderate sleep apnea were not materially different from the unrestricted analyses. Analyses using 7 hours (n = 399) as the cut point for short vs longer sleep duration did not differ materially from analyses using 6 hours as the cut point, but analyses using 5 hours (n = 69) as the cut point differed in that point estimates were lower than those using 6 hours as the cut point and did not reach statistical significance (Supplemental Table 5). For sleep efficiency, very few participants would have been categorized as poor sleeper for cut points lower than 85%. Finally, our results did not differ from the unrestricted sample when we excluded participants with sleep duration between 8 and 9 hours (n = 53) (Supplemental Table 6).
Discussion
In this population-based study of adults, using multiple measures of salivary cortisol and objective in-home sleep data, we found that sleep duration and sleep quality were associated with alterations of the diurnal cortisol patterns. Notably, short sleep duration was associated with less pronounced late decline in cortisol and less pronounced wake-to-bed slope. These associations remained significant after adjustment for sleep apnea, sleep efficiency, and other covariates and were robust to various sensitivity analyses. The flatter late cortisol decline associated with short sleep duration could be attributable to either low awaking cortisol level or high evening cortisol level. However, we found no association of short sleep duration with awakening cortisol level, suggesting that changes in wake-up level did not account for these slope differences. Poor sleep quality, measured objectively with actigraphy and characterized as sleep efficiency or assessed subjectively as insomnia, also were associated with less pronounced early cortisol decline. In stratified analyses, we found some evidence that associations of sleep duration with diurnal salivary cortisol were stronger among study participants who also reported insomnia symptoms than among those who did not. The test for interaction was of marginal statistical significance. We did not find associations of sleep characteristics with AUC, suggesting that this summary measure may be less sensitive to sleep-associated alterations in the diurnal cortisol profile than specific components examined using the piecewise linear mixed models.
Only a few population-based studies have examined associations of sleep with daily cortisol profile. These studies used self-reported measures of sleep duration and sleep efficiency. However, discrepancies between self-reported and objective measures of sleep have been described, especially in large, well-conducted community studies (33, 34). The Whitehall II Study (12), with 2751 participants, collected up to six salivary cortisol samples and self-reported sleep duration and quality. That study found that short sleep duration was associated with increased CAR and shallower slope in cortisol and that sleep disturbance was associated with shallower slope in cortisol. Our findings are consistent with the Whitehall findings in that short sleep duration was associated with less pronounced diurnal cortisol decline; however, we did not find an association between short sleep and increased CAR. The Whitehall study differed from our study in that the population was younger, healthier, and less racially diverse. A Danish study (13) of mostly young women (n = 4060) with salivary samples at two points in the day and self-reported sleep duration and quality did not find associations between sleep duration and cortisol but did find associations between sleep problems and lower morning cortisol. This study also found associations between poor sleep quality and less pronounced decline in cortisol in a subsample. We also found that poor sleep quality was associated with less pronounced early decline in cortisol. Other observational studies found no associations. Although these studies used objective measures of sleep duration and quality, they used different measures of cortisol. A study from China (14) examined 96 study participants using 3-day actigraphy with awakening salivary cortisol and found no association of salivary awakening cortisol with sleep duration or sleep efficiency. In the Osteoporotic Fractures in Men Study (15), actigraphy-based sleep duration and 24-hour free urinary cortisol were measured. No association between sleep duration and urinary cortisol was found in this cohort of older men.
We found that in contrast to short sleep duration, insomnia was associated with a reduced CAR in the full sample as well as in the sample of short sleepers. Insomnia, however, was associated with more pronounced decline in cortisol in the longer than the shorter sleepers. Other studies have reported that insomnia is associated with elevation of the evening cortisol (22, 23) or with lower awakening cortisol (24). Further investigation is warranted to address potential heterogeneity within individuals with insomnia in regards to HPA axis measures.
Our findings showing associations of shorter sleep and poorer sleep quality with a flatter cortisol decline over the day are significant because other work has documented that these types of alterations of the cortisol pattern are related to health outcomes. For example in the MESA study, lower CAR was associated with diabetes (16) and less pronounced cortisol decline with obesity (17), and in the Coronary Artery Risk Development in Young Adults study, a flattened diurnal cortisol pattern was associated with atherosclerosis (35). The largest study to examine the association of diurnal cortisol profile with cardiovascular disease-related mortality found that the slope in cortisol across the day and bedtime cortisol predicted cardiovascular-related mortality (36).
Our study has several limitations. First, our data are cross-sectional. We approached the analysis a priori by defining sleep duration and quality as the independent variables and HPA axis measures as the dependent variables. Second, the sleep and cortisol data were collected from each subject at a single point in time, and intraindividual variability over time was not captured. In the Coronary Artery Risk Development in Young Adults study, sleep duration and efficiency measured by actigraphy were relatively stable from year to year (37). The daily cortisol profile also varies from day to day. The use of 2 consecutive days is therefore an advantage over single-day studies. In MESA, long-term stability over 6 years is moderate (intraclass correlation 0.25 for the early decline and 0.42 for the late decline) (38). Variability in both sleep and cortisol over time may have attenuated the estimates of the true associations. Third, insomnia, a common clinically recognized entity, may represent several subphenotypes, with variable associations with depression, anxiety, and other conditions. Further refinement of this clinical entity could help clarify the associations between insomnia and the HPA axis. The mean age of our sample at MESA examination 5 was 69.2 years. Studies suggest that age is associated with elevated salivary cortisol in the evening (39, 40), and we therefore adjusted all models for age. Finally, power to assess associations with low sleep efficiency was limited because only 10% of our sample had sleep efficiency less than 85%.
A strength of our study is the availability of high-quality data for a variety of covariates including sleep apnea. Except for one study (15), the studies mentioned above did not adjust for this variable. A second strength is that we used objectively measured assessments of sleep duration and efficiency recorded over several nights. A third strength is that we had up to 16 salivary samples over 2 days, allowing us to model the diurnal cortisol profile. A fourth strength is a large, diverse, population-based sample.
In summary, we found associations of shorter sleep duration and worse sleep quality with alterations in features of the diurnal cortisol profile. Whereas the alterations in diurnal cortisol pattern that we observed in association with sleep duration and quality are modest in magnitude, when sustained over a long time period, these alterations may contribute to the increased risk of cardiovascular disease that has been found in association with sleep disturbances.
Acknowledgments
We thank the other investigators, the staff, and the participants of the MESA study for their valuable contributions.
A full list of participating MESA investigators and institutions can be found at http://www.mesa-nhlbi.org.
This work was supported by Grants R01 HL076831 (principal investigator Ana V. Diez Roux) and R01 HL098433 (principal investigator Susan Redline), MESA Contracts N01-HC-95159, N01-HC-95160, N01-HC-95161, N01-HC-95162, N01-HC-95163, N01-HC-95164, N01-HC-95165, N01-HC-95166, N01-HC-95167, N01-HC-95168, and N01-HC-95169 from the National Heart, Lung, and Blood Institute and by Grants UL1-TR-000040 and UL1-TR-001079 from the National Center for Research Resources.
Disclosure Summary: The authors have no disclosures.
Footnotes
- AUC
- area under the curve
- CAR
- cortisol awakening response
- CES-D
- Center for Epidemiology Studies-Depression
- CI
- confidence interval
- CVD
- cardiovascular disease
- HPA
- hypothalamic-pituitary-adrenal
- MESA
- Multi-Ethnic Study of Atherosclerosis
- WHIIRS
- Women's Health Initiative Insomnia Rating Scale.
References
- 1. Hoevenaar-Blom MP, Spijkerman AM, Kromhout D, et al. Sleep duration and sleep quality in relation to 12-year cardiovascular disease incidence: the MORGEN study. Sleep. 2011;34(11):1487–1492. [DOI] [PMC free article] [PubMed] [Google Scholar]
- 2. Ayas NT, White DP, Manson JE, et al. A prospective study of sleep duration and coronary heart disease in women. Arch Intern Med. 2003;163(2):205–209. [DOI] [PubMed] [Google Scholar]
- 3. Gottlieb DJ, Redline S, Nieto FJ, et al. Association of usual sleep duration with hypertension: the Sleep Heart Health Study. Sleep. 2006;29(8):1009–1014. [DOI] [PubMed] [Google Scholar]
- 4. King CR, Knutson KL, Rathouz PJ, et al. Short sleep duration and incident coronary artery calcification. JAMA. 2008;300(24):2859–2866. [DOI] [PMC free article] [PubMed] [Google Scholar]
- 5. Laugsand LE, Vatten LJ, Platou C, Janszky I. Insomnia and the risk of acute myocardial infarction: a population study. Circulation. 2011;124(19):2073–2081. [DOI] [PubMed] [Google Scholar]
- 6. Li Y, Zhang X, Winkelman JW, et al. Association between insomnia symptoms and mortality: a prospective study of US men. Circulation. 2014;129(7):737–746. [DOI] [PMC free article] [PubMed] [Google Scholar]
- 7. Pruessner JC, Wolf OT, Hellhammer DH, et al. Free cortisol levels after awakening: a reliable biological marker for the assessment of adrenocortical activity. Life Sci. 1997;61(26):2539–2549. [DOI] [PubMed] [Google Scholar]
- 8. Edwards S, Clow A, Evans P, Hucklebridge F. Exploration of the awakening cortisol response in relation to diurnal cortisol secretory activity. Life Sci. 2001;68(18):2093–2103. [DOI] [PubMed] [Google Scholar]
- 9. Leproult R, Copinschi G, Buxton O, Van Cauter E. Sleep loss results in an elevation of cortisol levels the next evening. Sleep. 1997;20(10):865–870. [PubMed] [Google Scholar]
- 10. Vgontzas AN, Mastorakos G, Bixler EO, et al. Sleep deprivation effects on the activity of the hypothalamic-pituitary-adrenal and growth axes: potential clinical implications. Clin Endocrinol (Oxf). 1999;51(2):205–215. [DOI] [PubMed] [Google Scholar]
- 11. Dettenborn L, Rosenloecher F, Kirschbaum C. No effects of repeated forced wakings during three consecutive nights on morning cortisol awakening responses (CAR): a preliminary study. Psychoneuroendocrinology. 2007;32(8–10):915–921. [DOI] [PubMed] [Google Scholar]
- 12. Kumari M, Badrick E, Ferrie J, et al. Self-reported sleep duration and sleep disturbance are independently associated with cortisol secretion in the Whitehall II study. J Clin Endocrinol Metab. 2009;94(12):4801–4809. [DOI] [PMC free article] [PubMed] [Google Scholar]
- 13. Hansen AM, Thomsen JF, Kaergaard A, et al. Salivary cortisol and sleep problems among civil servants. Psychoneuroendocrinology. 2012;37(7):1086–1095. [DOI] [PubMed] [Google Scholar]
- 14. Zhang J, Ma RC, Kong AP, et al. Relationship of sleep quantity and quality with 24-hour urinary catecholamines and salivary awakening cortisol in healthy middle-aged adults. Sleep. 2011;34(2):225–233. [DOI] [PMC free article] [PubMed] [Google Scholar]
- 15. Rao MN, Blackwell T, Redline S, et al. Association between sleep duration and 24-hour urine free cortisol in the MrOS sleep study. Plos One. 2013;8(9):e75205. [DOI] [PMC free article] [PubMed] [Google Scholar]
- 16. Champaneri S, Xu X, Carnethon MR, et al. Diurnal salivary cortisol and urinary catecholamines are associated with diabetes mellitus: the Multi-Ethnic Study of Atherosclerosis. Metabolism. 2012;61(7):986–995. [DOI] [PMC free article] [PubMed] [Google Scholar]
- 17. Champaneri S, Xu X, Carnethon MR, et al. Diurnal salivary cortisol is associated with body mass index and waist circumference: the Multiethnic Study of Atherosclerosis. Obesity. 2013;21(1):E56–E63. [DOI] [PMC free article] [PubMed] [Google Scholar]
- 18. Taylor A, Glover V, Marks M, Kammerer M. Diurnal pattern of cortisol output in postnatal depression. Psychoneuroendocrinology. 2009;34(8):1184–1188. [DOI] [PubMed] [Google Scholar]
- 19. Wessa M, Rohleder N, Kirschbaum C, Flor H. Altered cortisol awakening response in posttraumatic stress disorder. Psychoneuroendocrinology. 2006;31(2):209–215. [DOI] [PubMed] [Google Scholar]
- 20. Vgontzas AN, Fernandez-Mendoza J, Liao D, Bixler EO. Insomnia with objective short sleep duration: the most biologically severe phenotype of the disorder. Sleep Med Rev. 2013;17(4):241–254. [DOI] [PMC free article] [PubMed] [Google Scholar]
- 21. Vgontzas AN, Liao D, Bixler EO, et al. Insomnia with objective short sleep duration is associated with a high risk for hypertension. Sleep. 2009;32(4):491–497. [DOI] [PMC free article] [PubMed] [Google Scholar]
- 22. Vgontzas AN, Bixler EO, Lin HM, et al. Chronic insomnia is associated with nyctohemeral activation of the hypothalamic-pituitary-adrenal axis: clinical implications. J Clin Endocrinol Metab. 2001;86(8):3787–3794. [DOI] [PubMed] [Google Scholar]
- 23. Rodenbeck A, Huether G, Rüther E, Hajak G. Interactions between evening and nocturnal cortisol secretion and sleep parameters in patients with severe chronic primary insomnia. Neurosci Lett. 2002;324(2):159–163. [DOI] [PubMed] [Google Scholar]
- 24. Backhaus J, Junghanns K, Hohagen F. Sleep disturbances are correlated with decreased morning awakening salivary cortisol. Psychoneuroendocrinology. 2004;29(9):1184–1191. [DOI] [PubMed] [Google Scholar]
- 25. Riemann D, Klein T, Rodenbeck A, et al. Nocturnal cortisol and melatonin secretion in primary insomnia. Psychiatry Res. 2002;113(1–2):17–27. [DOI] [PubMed] [Google Scholar]
- 26. Bild DE, Bluemke DA, Burke GL, et al. Multi-Ethnic Study of Atherosclerosis: objectives and design. Am J Epidemiol. 2002;156(9):871–881. [DOI] [PubMed] [Google Scholar]
- 27. Hajat A, Diez-Roux A, Franklin TG, et al. Socioeconomic and race/ethnic differences in daily salivary cortisol profiles: the multi-ethnic study of atherosclerosis. Psychoneuroendocrinology. 2010;35(6):932–943. [DOI] [PMC free article] [PubMed] [Google Scholar]
- 28. Oakley NR. Validation with polysomnography of the Sleepwatch sleep/wake scoring algorithm used by the Actiwatch activity monitoring system. Bend: Mini Mitter, Cambridge Neurotechnology; 1997. [Google Scholar]
- 29. Levine DW, Dailey ME, Rockhill B, et al. Validation of the Women's Health Initiative Insomnia Rating Scale in a multicenter controlled clinical trial. Psychosom Med. 2005;67(1):98–104. [DOI] [PubMed] [Google Scholar]
- 30. Radloff LS. The CES-D Scale: a self-report depression scale for research in the general population. Appl Psychol Measure. 1977;1:385–401. [Google Scholar]
- 31. Diez Roux AV, Ranjit N, Powell L, et al. Psychosocial factors and coronary calcium in adults without clinical cardiovascular disease. Ann Intern Med. 2006;144(11):822–831. [DOI] [PubMed] [Google Scholar]
- 32. Ranjit N, Diez-Roux AV, Sanchez B, et al. Association of salivary cortisol circadian pattern with cynical hostility: multi-ethnic study of atherosclerosis. Psychosom Med. 2009;71(7):748–755. [DOI] [PMC free article] [PubMed] [Google Scholar]
- 33. Silva GE, Goodwin JL, Sherrill DL, et al. Relationship between reported and measured sleep times: the sleep heart health study (SHHS). J Clin Sleep Med. 2007;3(6):622–630. [PMC free article] [PubMed] [Google Scholar]
- 34. Jackowska M, Dockray S, Hendrickx H, Steptoe A. Psychosocial factors and sleep efficiency: discrepancies between subjective and objective evaluations of sleep. Psychosom Med. 2011;73(9):810–816. [DOI] [PubMed] [Google Scholar]
- 35. Matthews K, Schwartz J, Cohen S, Seeman T. Diurnal cortisol decline is related to coronary calcification: CARDIA study. Psychosom Med. 2006;68(5):657–661. [DOI] [PubMed] [Google Scholar]
- 36. Kumari M, Shipley M, Stafford M, Kivimaki M. Association of diurnal patterns in salivary cortisol with all-cause and cardiovascular mortality: findings from the Whitehall II study. J Clin Endocrinol Metab. 2011;96(5):1478–1485. [DOI] [PMC free article] [PubMed] [Google Scholar]
- 37. Knutson KL, Rathouz PJ, Yan LL, et al. Intra-individual daily and yearly variability in actigraphically recorded sleep measures: the CARDIA study. Sleep. 2007;30(6):793–796. [DOI] [PMC free article] [PubMed] [Google Scholar]
- 38. Wang X, Sánchez B, Golden S, et al. Stability and predictors of change in salivary cortisol measures over six years: the Multi-Ethnic Study of Atherosclerosis. Psychoneuroendocrinology. 2014;49:310–320. [DOI] [PMC free article] [PubMed] [Google Scholar]
- 39. Raff H, Raff JL, Duthie EH, et al. Elevated salivary cortisol in the evening in healthy elderly men and women: correlation with bone mineral density. J Gerontol Series A Biol Sci Med Sci. 1999;54(9):M479–M483. [DOI] [PubMed] [Google Scholar]
- 40. Deuschle M, Gotthardt U, Schweiger U, et al. With aging in humans the activity of the hypothalamus-pituitary-adrenal system increases and its diurnal amplitude flattens. Life Sci. 1997;61(22):2239–2246. [DOI] [PubMed] [Google Scholar]