

Abstract
Context:
Little is known about renin-angiotensin-aldosterone system (RAAS) activation in relationship to visceral adipose tissue (VAT) accumulation in HIV-infected patients, a population at significant risk for insulin resistance and other metabolic disease.
Design:
Twenty HIV and 10 non-HIV-infected subjects consumed a standardized low sodium or liberal sodium diet to stimulate or suppress the RAAS, respectively. RAAS parameters were evaluated in response to each diet and a graded angiotensin II infusion. Further analyses were performed after groups were substratified by median VAT measured by magnetic resonance imaging.
Results:
Aldosterone concentrations during the low-sodium diet were higher in HIV than non-HIV-infected subjects [13.8 (9.7, 30.9) vs 9.2 (7.6, 13.6) ng/dL, P = .03] and increased across groups stratified by visceral adipose tissue (VAT) [8.5 (7.1, 12.8), 9.2 (8.1, 21.5), 11.4 (9.4, 13.8), and 27.2 (13.0, 36.9) ng/dL in non-HIV-infected without increased VAT, non-HIV-infected with increased VAT, HIV-infected without increased VAT, HIV-infected with increased VAT, respectively, overall trend P = .02]. Under this condition, plasma renin activity [3.50 (2.58, 4.65) vs 1.45 (0.58, 2.33) ng/mL · h, P = .002] was higher among the HIV-infected subjects with vs without increased VAT. Differences in the suppressibility of plasma renin activity by graded angiotensin infusion were seen stratifying by VAT among the HIV-infected group (P < .02 at each dose). In addition, aldosterone (P = .007) was an independent predictor of insulin resistance in multivariate modeling, controlling for VAT and adiponectin.
Conclusion:
These data suggest excess RAAS activation in relationship to visceral adiposity in HIV-infected patients that may independently contribute to insulin resistance. Mineralocorticoid blockade may have therapeutic potential to reduce metabolic complications in HIV-infected patients with increased visceral adiposity.
The renin-angiotensin-aldosterone system (RAAS) is critical to the regulation of blood volume and sodium balance. Novel preclinical data suggest there is role for aldosterone in adipose tissue, such that the visceral fat compartment may be linked to RAAS activation (1). Indeed, aldosterone is increased in overweight individuals (2) and is a predictor of insulin resistance (3); however, data linking RAAS activation to the visceral depot in humans are limited.
The HIV-infected population is at particular risk for fat redistribution and subsequent metabolic complications, including increased inflammation, alterations in glucose and lipid homeostasis, and an accelerated risk of subclinical atherosclerosis. RAAS activation in relationship to excess visceral adiposity might provide a plausible mechanism for metabolic abnormalities in this population, but few studies of the RAAS have been performed among the HIV-infected population. Preliminary data from our group, not performed under rigorous dietary conditions, demonstrate some evidence of RAAS activation in relationship to visceral adipose tissue (VAT) accumulation and glucose parameters (4).
To our knowledge, no studies have comprehensively explored RAAS physiology using detailed suppression and stimulation algorithms with dietary sodium manipulation to understand differences in aldosterone dysregulation in HIV or investigated the relationship to visceral adiposity and other body composition parameters. The goal of this study was to determine the degree of RAAS activation in antiretroviral therapy (ART)-treated HIV infection and the association with VAT accumulation and insulin resistance. Treatment strategies for metabolic risks in HIV are critically needed, and understanding the pathophysiology of RAAS activation in this population may provide insight into new treatment options.
Materials and Methods
Study participants
Twenty HIV-infected subjects were recruited from community health centers in the Boston area. Ten non-HIV-infected subjects were recruited from the same communities to ensure similar demographics. Groups were similar based on age, gender, and waist circumference. With the exception of HIV infection, inclusion and exclusion criteria were identical among both groups. Subjects were between 18 and 65 years. The HIV-infected group was on stable ART for 3 months or longer. Subjects were excluded for history of cardiovascular disease, including hypertension, peripheral vascular disease, coronary artery disease, stroke, congestive heart failure, or significant electrocardiogram abnormalities; history of diabetes mellitus; current infection other than HIV; current tobacco use (which might affect assessment of the RAAS); use of hormone replacement, including estrogen, progesterone, GH or GH-releasing analogs; current steroid use within the past 2 months; or pregnancy. T replacement was allowed if subjects were on a stable dose for 3 months or longer (only one subject was receiving T in the study). Laboratory exclusions included creatinine of greater than 1.5 mg/dL and urine protein of greater than 1 g, potassium of greater than 5.5 mEq/L, hemoglobin of less than 11.0 mg/dL, alanine aminotransferase of greater than 2.5 times the upper limit of normal, and abnormal TSH. All participants provided informed consent to participate. This study was approved by the Partners Institutional Review Board.
Assessment of body composition
Waist to hip ratio was determined from the circumferential measurements of the waist at the level of the top of the iliac crest and the hips at the level of maximum extension of the buttock in an upright standing position. Magnetic resonance images were acquired using an axial T1-weighted fat suppressed pulse sequence obtained at the level of L4 vertebral body. Abdominal visceral and subcutaneous fat areas were determined based on offline analysis of tracings obtained utilizing commercial software (Vitrak; Merge e/Film).
Standardization of dietary sodium intake
To insure standardized dietary sodium intake, subjects were placed on a low-sodium diet to assess RAAS activation and a liberalized sodium diet to assess RAAS suppressibility. The metabolic phenotyping core at the Brigham and Women's Hospital Center for Clinical Investigation prepared a standardized 6-day diet. For the 6-day low-sodium diet, subjects were asked not to consume anything outside the prescribed diet, which was composed of 10 ± 2 mEq Na+, 100 ± 2 mEq K+, and 1000 ± 50 mg Ca2+. For the 6-day liberalized sodium diet, subjects were asked to consume 3 broth packets daily (47.8 mEq Na+ per packet) in addition to their usual diet with the goal of achieving a dietary sodium intake of greater than 200 mEq Na+. Diets were supplemented with K+(100 ± 2 mEq) and Ca2+ (1000 ± 50 mg). On the evening of day 6 of each diet, a urine aliquot was obtained to confirm appropriate sodium balance: spot urine sodium less than 50 mmol or greater than 150 mmol for the low-sodium and liberal sodium visits, respectively. Study procedures were rescheduled if sodium balance was not achieved. Sodium balance was formally assessed with 24-hour urine collections starting on day 6 of each diet. Both HIV-infected and non-HIV-infected subjects achieved appropriate sodium balance because 24-hour urinary sodium did not differ in HIV vs non-HIV-infected subjects after 6 days of low-sodium (23.8 ± 4.5 vs 18.2 ± 2.3 mmol, P = .28) or liberal sodium diets (275.5 ± 23.5 vs 363.6 ± 81.8 mmol, P = .32).
Posture study
On the morning of day 6 of the low-sodium diet after having fasted overnight for 12 hours, subjects presented to the Brigham and Women's Hospital Center for Clinical Investigation. Subjects stood upright for 45 minutes after which blood samples were collected. The posture study was performed to determine whether volume status may account for differences in RAAS activation. As noted above, sodium balance was subsequently evaluated on the evening of day 6, and posture study data were not included unless subjects were confirmed to achieve sodium balance through 24-hour urine studies.
Angiotensin II infusion
Angiotensin II (Ang II; Bachem) was infused iv for 30-minute sequential intervals at the following doses: 0.3, 1.0, and 3.0 ng/kg · min. Ang II infusions were performed on the morning of day 7 after 6 days of the low-sodium or liberal sodium diet. Subjects were supine overnight for 10 hours and fasted for 12 hours. Blood pressure (BP) was taken every 2 minutes using a Dinamap (Critikin). Three consecutive BP measurements were averaged just prior to the dose escalation. Blood samples were obtained at baseline and at the completion of each infusion dose.
ACTH stimulation test
One hour after the completion of the Ang II infusion, subjects received an iv bolus of 0.25 mg cosyntropin (Sandoz). Blood samples were obtained at 0 and 60 minutes.
Biochemical, metabolic, and inflammatory parameters
Serum and urine aldosterone (sensitivity 2.5 ng/dL, precision 4%–10%) and cortisol were measured by solid-phase RIA by the Coat-A-Count method (Diagnostics Products Corp). Plasma renin activity (PRA) was obtained using the γCoat [125I] RIA kit (sensitivity 0.01 ng/ml · h, precision < 10%; DiaSorin). Insulin was assayed using the Access immunoassay system (Beckman Coulter). Insulin resistance was calculated using the homeostatic model assessment [HOMA-IR = (fasting glucose [milligrams per deciliter] × fasting insulin [milliunits per liter])/405]. CD4+ T cell counts were assessed by flow cytometry. HIV viral load was determined by an ultrasensitive RT-PCR (Roche; COBAS amplicor). HIV testing was performed by an ELISA and confirmed by Western blot. High-sensitivity C-reactive protein (hsCRP; Labcorp), TNF-α (R&D Systems), IL-6, (Beckman Coulter), and adiponectin (ALPCO) were measured according to the manufacturer's protocol.
Statistical analysis
Normality of distribution was determined using the Shapiro-Wilk test. Data are presented as mean ± SEM or median (interquartile range), depending on normality of the distribution. Categorical variables are reported as proportions. Comparisons were made between HIV-infected and non-HIV-infected subjects using the Student's t test for normally distributed continuous variables, the Wilcoxon rank sum test for nonnormally distributed data, and the χ2 test for categorical variables. Nonnormally distributed variables were log transformed to establish a normal distribution. For purposes of representing the data in a clinically relevant manner, nonnormally distributed variables are reported as values prior to log transformation, but the P value reported is based on the appropriate statistical test applied to the log transformed values. Linear regression was performed using the Pearson's correlation coefficient among all subjects and within the HIV- and non-HIV-infected groups separately. As per the primary goal of the study, analyses were repeated after cohorts were substratified by median VAT into those with and without excess VAT based on the median VAT within each group, HIV and non-HIV. A four-group comparison was made using an ANOVA for normally distributed variables, after appropriate log transformation, to assess independent effects of HIV and VAT on RAAS activation. Determinants of aldosterone stimulation and insulin resistance were evaluated in multivariate regression modeling performed in the HIV- and non-HIV-infected groups. Statistical significance was defined as P < .05. All statistical analyses were performed using SAS JMP (version 9.0).
Results
Baseline demographic and clinical characteristics
HIV- and non-HIV-infected subjects were well-matched with respect to age, gender, and race. Metabolic parameters were not significantly different between groups. In addition, both groups had similar renal function and potassium levels. There was no significant difference in body composition. Median (interquartile range) VAT for HIV- and non-HIV-infected subjects was 134 (56, 188) cm2 and 140 (84, 184) cm2 (P = .98), respectively. The median VAT did not statistically differ between groups but was relatively increased in each group (5). HIV-infected subjects had a long duration of diagnosis (18 ± 1 y) and ART use (11 ± 1 y). HIV-infected subjects displayed stable immunological control with a CD4+ count of 571 ± 73 cells/μL (Table 1). The percentage of subjects currently using statins did not differ among HIV- and non-HIV-infected groups (30 vs 10%, P = .22).
Table 1.
Baseline Demographic and Clinical Characteristics of Non-HIV and HIV-Infected Subjects
| Non-HIV-infected (n = 10) | HIV-infected (n = 20) | P Value | |
|---|---|---|---|
| Demographics | |||
| Age, y | 52 ± 2 | 49 ± 2 | .34 |
| Race, % | .27 | ||
| Caucasian | 80 | 45 | |
| African American | 20 | 35 | |
| Other | 0 | 20 | |
| Gender, % | .78 | ||
| Male | 70 | 65 | |
| HIV parameters | |||
| CD4+ T-cell count, cells/μL | N/A | 571 ± 73 | |
| Log HIV RNA viral load, copies/mL | N/A | 1.77 ± 0.19 | |
| Duration HIV, y | N/A | 18 ± 1 | |
| Duration ART use, y | N/A | 11 ± 1 | |
| Current PI use, % | N/A | 60 | |
| Current NRTI use, % | N/A | 90 | |
| Current NNRTI use, % | N/A | 25 | |
| History of HCV infection, % | 0 | 20 | .13 |
| Metabolic parameters | |||
| Waist circumference, cm | 89 ± 4 | 94 ± 3 | .40 |
| WHR | 0.90 ± 0.02 | 0.94 ± 0.02 | .15 |
| BMI, kg/m2 | 25 ± 1 | 26 ± 1 | .50 |
| VAT area, cm2 | 140 [84, 184] | 134 [56, 188] | .98 |
| SAT area, cm2 | 213 [122, 269] | 209 [107, 342] | .91 |
| SBP, mm Hg | 119 ± 3 | 115 ± 3 | .39 |
| DBP, mm Hg | 74 ± 3 | 73 ± 2 | .73 |
| Triglycerides, mg/dL | 88 [66, 155] | 105 [83, 149] | .45 |
| HDL cholesterol, mg/dL | 59 ± 6 | 52 ± 4 | .38 |
| Fasting glucose, mg/dL | 87 ± 1 | 84 ± 1 | .08 |
| Hemoglobin A1c, % | 5.5 [5.3, 5.7] | 5.4 [5.2, 5.6] | .23 |
| HOMA-IR | 0.59 [0.35, 1.59] | 0.98 [0.58, 1.85] | .21 |
| Creatinine, mg/dL | 0.79 ± 0.04 | 0.85 ± 0.03 | .27 |
| Potassium, mmol/L | 4.2 ± 0.1 | 4.1 ± 0.0 | .21 |
Abbreviations: DBP, diastolic BP; HCV, hepatitis C virus; HDL, high-density lipoprotein; N/A, not applicable; NNRTI, non-nucleoside reverse transcriptase inhibitors; NRTI, nucleoside/nucleotide reverse transcriptase inhibitors; PI, protease inhibitor; SBP, systolic BP; WHR, waist to hip ratio. Data are reported as mean ± SEM, percentage, or median [interquartile range].
Assessment of RAAS activation
During equivalent stimulatory conditions of low sodium intake in both groups, serum aldosterone was significantly increased among HIV-infected subjects compared with non-HIV-infected subjects [13.8 (9.7, 30.9) vs 9.2 (7.6, 13.6) ng/dL, P = .03]. PRA, Ang II, and 24-hour urinary aldosterone excretion did not differ between groups (Table 2). PRA and aldosterone did not differ by gender, race, or hepatitis C virus status among the HIV-infected population.
Table 2.
Assessment of RAAS Activation
| Non-HIV-infected (n = 10) | HIV-infected (n = 20) | P Value | |
|---|---|---|---|
| Metabolic parameters | |||
| MAP, mm Hg | 85 ± 2 | 84 ± 1 | .86 |
| Sodium, mmol/L | 137 ± 1 | 137 ± 0 | .72 |
| Creatinine, mg/dL | 0.89 ± 0.06 | 0.92 ± 0.03 | .58 |
| Potassium, mmol/L | 4.1 ± 0.1 | 4.1 ± 0.1 | .56 |
| Urine studies | |||
| Urine sodium, mmol per 24 h | 18.2 ± 2.3 | 23.8 ± 4.5 | .28 |
| Urine potassium, mmol per 24 h | 69.2 ± 6.5 | 68.4 ± 4.4 | .92 |
| Urine creatinine, mg per 24 h | 1399 ± 122 | 1195 ± 71 | .17 |
| Urine cortisol, μg per 24 h | 34.8 [17.2, 58.5] | 30.4 [20.2, 42.2] | .52 |
| RAAS parameters | |||
| PRA, ng/mL · h | 1.80 [1.05, 3.18] | 2.45 [1.43, 3.50] | .98 |
| Ang II, pg/mL | 30.0 [26.2, 36.3] | 33.0 [26.1, 40.7] | .82 |
| Serum aldosterone, ng/dL | 9.2 [7.6, 13.6] | 13.8 [9.7, 30.9] | .03 |
| Urinary aldosterone excretion, ng per 24 h | 34.1 [16.3, 42.0] | 26.1 [18.4, 37.9] | .92 |
Data are reported as mean ± SEM or median [interquartile range]. Determinations were performed under conditions of equivalent low-sodium intake for both groups as described in the text.
Determinants of RAAS activation
Within the HIV-infected group, serum aldosterone was strongly associated with PRA (r = 0.81, P < .0001) and Ang II (r = 0.67, P = .001) during the low-sodium condition (Supplemental Table 1). Multivariate modeling demonstrated that PRA remained strongly associated with serum aldosterone (β = 6.22, P = .02), controlling for Ang II, potassium, and BP among the HIV-infected group (Supplemental Table 2).
Relationship of inflammatory parameters to RAAS activation
Of note, hsCRP and IL-6 were significantly increased and adiponectin significantly decreased in the low-sodium, RAAS-activated state vs the liberalized sodium state in HIV- but not in non-HIV-infected subjects (Supplemental Table 3B and Supplemental Figure 1). In the low-sodium condition among HIV-infected patients, adiponectin, but not other inflammatory markers, significantly related to PRA (r = −0.51, P = .02). There was also an inverse relationship of adiponectin to serum aldosterone (r = −0.41, P = .08) in the HIV-infected group, but this relationship was not statistically significant (Supplemental Table 4).
Independent effects of HIV status and VAT on RAAS activation
RAAS activation parameters were highly related to VAT in the HIV-infected group but not in the non-HIV-infected group (Table 3). In contrast, no significant relationships were seen in relation to overall body mass index (BMI) or sc adipose tissue (SAT) (Table 3). Subjects were stratified by HIV and VAT (above and below median within each group). No differences in demographic variables such as age and gender were seen among groups. Metabolic variables differed as expected in low- and high-VAT groups (Supplemental Table 5). Within the HIV-infected group, PRA [3.50 (2.58, 4.65) vs 1.45 (0.58, 2.33) ng/mL · h, P = .002], serum aldosterone [27.2 (13.0, 36.9) vs 11.4 (9.4, 13.8) ng/dL, P = .03] and urinary aldosterone [32.9 (26.5, 48.6) vs 19.1 (13.3, 27.9) ng per 24 h, P = .02] were significantly higher in the HIV-infected subjects with higher VAT vs lower VAT during stimulatory conditions of RAAS activation on the low-sodium diet (Table 4 and Figure 1). In contrast, no differences in RAAS activation were demonstrated between non-HIV-infected subjects with and without excess VAT during identical stimulatory conditions.
Table 3.
Univariate Correlations With Body Composition Parameters
| All Subjects (n = 30) |
Non-HIV-infected (n = 10) |
HIV-infected (n = 20) |
||||
|---|---|---|---|---|---|---|
| r | P Value | r | P Value | r | P Value | |
| VAT | ||||||
| PRA, ng/mL · h | 0.24 | .21 | 0.17 | .64 | 0.66 | .002 |
| Ang II, pg/mL | 0.46 | .01 | 0.01 | .98 | 0.58 | .008 |
| Serum aldosterone, ng/dL | 0.34 | .07 | 0.12 | .74 | 0.42 | .07 |
| Urinary aldosterone excretion, ng per 24 h | 0.30 | .11 | −0.06 | .86 | 0.45 | .04 |
| SAT | ||||||
| PRA, ng/mL · h | 0.31 | .10 | 0.79 | .007 | 0.16 | .51 |
| Ang II, pg/mL | −0.15 | .43 | −0.09 | .80 | −0.17 | .47 |
| Serum aldosterone, ng/dL | −0.01 | .96 | −0.18 | .62 | −0.01 | .98 |
| Urinary aldosterone excretion, ng per 24 h | −0.003 | .99 | −0.18 | .61 | 0.07 | .76 |
| BMI | ||||||
| PRA, ng/mL · h | 0.08 | .67 | 0.29 | .42 | −0.004 | .99 |
| Ang II, pg/mL | −0.04 | .85 | 0.04 | .92 | −0.06 | .80 |
| Serum aldosterone, ng/dL | 0.13 | .50 | −0.22 | .55 | 0.14 | .56 |
| Urinary aldosterone excretion, ng per 24 h | 0.21 | .27 | −0.02 | .95 | 0.29 | .21 |
Relationships were assessed by Pearson's correlation coefficient. Determinations were performed under conditions of equivalent low-sodium intake for both groups as described in the text.
Table 4.
Assessment of RAAS Activation Stratified by HIV Status and VAT
| Non-HIV-infected |
HIV-infected |
Independent Effects P Value by ANOVAc |
|||||||
|---|---|---|---|---|---|---|---|---|---|
| VAT < Median (n = 5) | VAT > Median (n = 5) | P Valuea | VAT < Median (n = 10) | VAT > Median (n = 10) | P Valueb | HIV-Positive Status | VAT > Median | HIV-Positive Status * VAT > Median | |
| Metabolic parameters | |||||||||
| MAP, mm Hg | 87 ± 4 | 83 ± 3 | .38 | 84 ± 2 | 85 ± 2 | .62 | |||
| Sodium, mmol/L | 138 ± 1 | 136 ± 2 | .30 | 137 ± 1 | 137 ± 1 | .83 | |||
| Creatinine, mg/dL | 0.90 ± 0.06 | 0.87 ± 0.10 | .79 | 0.91 ± 0.04 | 0.93 ± 0.05 | .74 | |||
| Potassium, mmol/L | 4.1 ± 0.1 | 4.0 ± 0.2 | .48 | 4.2 ± 0.1 | 4.1 ± 0.1 | .48 | |||
| Urine studies | |||||||||
| Urine sodium, mmol per 24 h | 19.0 ± 3.4 | 17.4 ± 3.4 | .76 | 28.5 ± 7.9 | 19.2 ± 4.4 | .32 | |||
| Urine potassium, mmol per 24 h | 70.1 ± 9.4 | 68.3 ± 10.0 | .90 | 63.7 ± 5.2 | 73.1 ± 7.0 | .29 | |||
| Urine cortisol, μg per 24 h | 54.8 [14.6, 72.5] | 33.2 [23.8, 39.0] | .68 | 28.4 [18.7, 41.5] | 34.5 [22.6, 45.9] | .57 | |||
| RAAS parameters | |||||||||
| PRA, ng/mL · h | 1.30 [1.00, 3.75] | 2.30 [0.85, 16.90] | .64 | 1.45 [0.58, 2.33] | 3.50 [2.58, 4.65] | .002 | .98 | .04 | .33 |
| Ang II, pg/mL | 28.3 [26.5, 42.6] | 31.7 [25.2, 36.4] | .75 | 29.6 [23.6, 33.9] | 36.3 [26.6, 47.1] | .09 | .84 | .36 | .19 |
| Serum aldosterone, ng/dL | 8.5 [7.1, 12.8] | 9.2 [8.1, 21.5] | .38 | 11.4 [9.4, 13.8] | 27.2 [13.0, 36.9] | .03 | .03 | .045 | .42 |
| Urinary aldosterone excretion, ng per 24 h | 33.5 [13.0, 58.5] | 34.7 [16.2, 40.4] | .96 | 19.1 [13.3, 27.9] | 32.9 [26.5, 48.6] | .02 | .91 | .20 | .17 |
Data are reported as mean ± SEM, percentage, or median [interquartile range]. Determinations were performed under conditions of equivalent low-sodium intake for both groups as described in the text.
Non-HIV low VAT vs non-HIV high VAT.
HIV low VAT vs HIV high VAT.
Model to assess interaction between HIV status and VAT among the entire cohort. Crossing of two variables in statistical modeling to determine the interaction between those specific variables.
Figure 1.
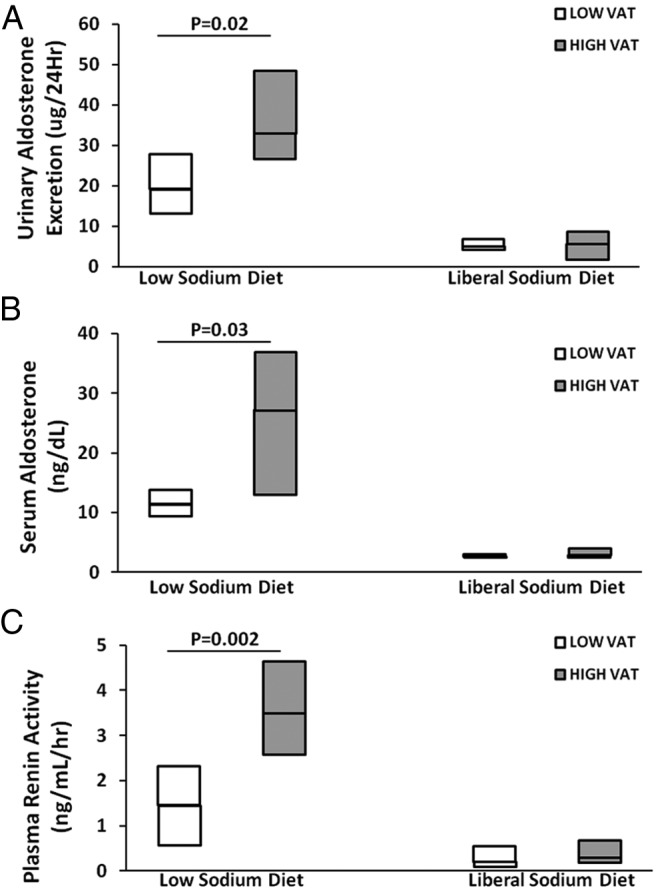
Comparison of RAAS parameters urinary aldosterone excretion (micrograms per 24 h) (A), serum aldosterone (nanograms per deciliter) (B), and PRA (nanograms per milliliter per hour) (C) during the low-sodium and liberal sodium diets in HIV-infected patients with low VAT vs high VAT.
In an ANOVA analysis, simultaneously controlling for HIV status and VAT among all subjects, both HIV status and VAT were independently associated with aldosterone, and there was no interaction between these variables (Table 4). Aldosterone concentrations increased significantly across groups, being lowest in non-HIV-infected subjects without increased VAT and highest in the HIV-infected subjects with increased VAT [8.5 (7.1, 12.8), 9.2[8.1, 21.5), 11.4[9.4, 13.8), 27.2[13.0, 36.9) ng/dL in non-HIV-infected without increased VAT, non-HIV-infected with increased VAT, HIV-infected without increased VAT, HIV-infected with increased VAT, respectively (overall trend across groups, P = .02)]. Similarly, PRA levels tended to increase across the groups, and ANOVA confirmed an effect of VAT, controlling for HIV on PRA as well, although independent effects of HIV were not seen in modeling, simultaneously controlling for both HIV and VAT (Table 4). Urine cortisol did not differ by HIV and VAT stratification (Tables 2 and 4) and did not relate to RAAS activation (data not shown).
Response to angiotensin II, ACTH, and posture
No overall differences were observed between HIV- and non-HIV-infected subjects in response to Ang II, ACTH, and posture during the low-sodium stimulatory condition (Supplemental Table 6A). However, comparing between groups and stratifying by VAT status, Ang II-stimulated PRA levels were suppressed in a dose-dependent manner but remained significantly higher in the HIV-infected subjects with excess VAT compared with those without excess VAT (Figure 2). Ang II-stimulated aldosterone levels during the low-sodium diet tended to be higher in the HIV-infected group with higher VAT vs lower VAT but were not statistically different (Supplemental Figure 2).
Figure 2.

Ang II-stimulated PRA during the low-sodium diet (A) and liberal sodium diet (B) in HIV-infected patients with low and high VAT. *, P < .05 for HIV-infected patients with low VAT vs high VAT.
Association of RAAS activation with insulin resistance and inflammation in HIV
Among HIV-infected patients, PRA (r = 0.75, P = .0001), Ang II (r = 0.80, P < .0001) and serum aldosterone (r = 0.59, P = .006) highly correlated with HOMA-IR during RAAS activation, whereas only modest relationships were seen among the non-HIV-infected group under similar conditions (Supplemental Table 7). Multivariate modeling among the HIV-infected group demonstrated that serum aldosterone (β = .05, P = .04) remained a significant independent predictor of insulin resistance controlling for age, gender, VAT, and current use of protease inhibitor, nonnucleoside reverse transcriptase inhibitor and nucleoside/nucleotide reverse transcriptase inhibitor therapy (overall model R2 = 0.77, P = .004) (Supplemental Table 8A). Adiponectin was lower among those HIV-infected patients with excess VAT compared with those with less VAT [2.71 (2.24, 4.01) vs 6.37 (4.54, 13.44) μg/dL] during RAAS activation, whereas hsCRP, TNF-α, and IL-6 did not differ by VAT status. Among all HIV-infected patients, adiponectin was negatively correlated with VAT (r = −0.73, P = .0003) and HOMA-IR (r = −0.55, P = .01) (Supplemental Table 4). Aldosterone remained a significant independent predictor of insulin resistance controlling for adiponectin (Supplemental Table 8B).
Assessment of RAAS suppressibility during the liberal sodium diet
No differences in RAAS suppressibility were seen in response to the standardized liberal sodium condition by either HIV status (Supplemental Table 6B) or VAT (Figure 2 and Supplemental Figure 2).
Discussion
These data suggest differences in RAAS activation among HIV-infected subjects compared with non-HIV-infected subjects during carefully controlled dietary conditions. Furthermore, both HIV status and increased VAT were shown to contribute independently to RAAS activation, such that HIV-infected subjects with excess VAT demonstrate markedly increased RAAS activation compared with those HIV-infected subjects without excess VAT. Moreover, this study in a small number of subjects suggests that RAAS activation may contribute independently to insulin resistance in the HIV-infected population.
Aldosterone modulates changes in blood volume and sodium balance through mineralocorticoid receptor (MR) activation. Traditionally the RAAS works through the adrenal glands and kidney, but recent data suggest that RAAS elements are expressed in adipose tissue. Animal and human studies demonstrate that adipose tissue can synthesize and secrete renin, angiotensinogen (Agt), angiotensin-converting enzyme, Ang II, the angiotensin receptor, and aldosterone (6–9). These substrates may have local autocrine/paracrine or systemic effects. In the visceral compartment, the RAAS is postulated to stimulate local macrophage activation to promote inflammation, influence adipocyte differentiation, or regulate adipokines (10), all of which may modulate cardiometabolic disease. Indeed, HIV-infected patients are at risk for acquired lipodystrophy, including abdominal visceral fat accumulation and sc fat loss. Because excess VAT is associated with non-AIDS-related morbidity and mortality (11–17), our data linking RAAS activation and VAT may be a potential mechanism predisposing HIV-infected patients to increased metabolic risks.
Limited human studies suggest a relationship between ectopic fat accumulation and RAAS activation (18). The findings from this study significantly extend the data from our initial study linking VAT and aldosterone in HIV (4). In the current study, we used standardized dietary sodium manipulation as a physiological paradigm to simulate states of RAAS activation and suppression. HIV-infected subjects demonstrate increased RAAS activation during equivalent conditions of low sodium intake compared with non-HIV-infected subjects. When HIV-infected subjects were further stratified by VAT during these conditions, subjects with excess VAT demonstrated higher PRA and aldosterone compared with those subjects without excess VAT. These relationships seen between VAT and RAAS activation were not present with respect to other metrics of body composition, including BMI and SAT, suggesting that the visceral depot is uniquely linked to aldosterone dysregulation. Furthermore, HIV status and VAT accumulation may have additive and independent effects on RAAS activation because those HIV-infected subjects with the highest VAT demonstrated the most significant increases in RAAS activation.
What could be the potential mechanism for increased aldosterone production in HIV-infected subjects with VAT accumulation? To answer this question, we investigated the link to PRA, potassium, Ang II, and ACTH. We initially hypothesized that autonomous aldosterone production may be present in HIV-infected patients with excess VAT, similar to a model of primary hyperaldosteronism. Indeed, primary hyperaldosteronism has been associated with metabolic dysregulation (19, 20). However, we observed a simultaneous increase in PRA stimulation during low-sodium conditions in the HIV-infected subjects with increased VAT vs low VAT. Aldosterone and PRA were tightly correlated, suggesting that the increase in aldosterone was likely a renin-dependent process. In addition, during the Ang II infusion performed on a low-sodium diet, PRA levels remained detectable, not completely suppressible, and significantly higher in the HIV-infected group with excess VAT compared with those without excess VAT during the Ang II infusion. Potassium levels did not differ between groups. PRA was independently related to aldosterone after controlling for BP, potassium, and Ang II. Aldosterone stimulation in response to ACTH or Ang II was similar between the HIV- and non-HIV-infected groups.
Taken together, these data do suggest a potential mechanism in the HIV-infected population, whereby RAAS activation associated with excess visceral adiposity contributes to metabolic dysregulation. Data from prior studies support the possibility of PRA activation in visceral fat. Increased β-adrenergic receptor activity has been demonstrated in VAT vs SAT (21–23). Moreover, adrenergic stimulation can lead to insulin resistance (24) and increased monocyte dysfunction in obese insulin-resistant subjects (25). Preclinical data suggest that renin can be expressed in adipose tissue (26), but further human studies should explore the potential source of renin, whether it is systemically secreted by the kidney and/or locally produced in the fat depots.
Prior studies suggest a potential benefit of mineralocorticoid blockade in animal models of obesity. Increased TNF-α, monocyte chemotactic protein-1, and CD68 mRNAs were present in retroperitoneal adipose tissue of obese diabetic db/db mice, and these inflammatory indices and the presence of macrophages were attenuated after treatment with eplerenone (1). Whereas the MR is typically found in epithelial tissues, the presence of the MR has been demonstrated in the visceral depot (1). MR mRNA expression was shown to be higher in white adipose tissue of obese ob/ob mice vs lean mice, and after 3 weeks of eplerenone treatment, HOMA-IR and triglycerides were significantly reduced in the obese mice (27). These preclinical studies demonstrate that MR blockade has glucose-regulating and antiinflammatory properties, which may have relevance to HIV-infected patients with visceral fat accumulation.
In this study, we hypothesized that RAAS activation related to excess visceral adiposity may contribute to insulin resistance in HIV. Whereas urinary aldosterone excretion has been linked to insulin resistance among non-HIV-infected subjects with overweight BMI (2), the relationship to detailed body composition parameters has not been thoroughly assessed. Several potential mechanisms linking RAAS activation and insulin resistance exist. For example, aldosterone may inhibit insulin signaling through the release of cytokines and reactive oxygen species (28, 29). Ang II may increase phosphorylation at the insulin receptor (30). In addition, MR activation may decrease glucose transporter-4 translocation (31), decrease adiponectin and peroxisomal proliferator-activated receptor-γ expression, and promote differentiation of preadipocytes into adipocytes (1). Animal models have shed light on the contribution of RAAS activation to insulin resistance. Mice overexpressing adipose Agt had a 30% increase in systemic Agt levels in association with insulin resistance. In contrast, adipose-specific Agt knockout mice had a reduction in circulating Agt levels and metabolic risks (32).
We demonstrated a relationship of reduced adiponectin, a marker of insulin sensitivity, to RAAS activation and increased VAT and HOMA-IR among the HIV-infected group. These human data complement those animal data, suggesting that the protective effects of adiponectin on metabolic indices and inflammation may be attenuated by RAAS activation. Moreover, these findings of increased RAAS activation and inflammation were seen in an ART-treated, HIV-infected population with good immune function. We did not see a direct association of RAAS activation with other proinflammatory markers, which may have been limited by the small size of this study.
Limited therapies for HIV-infected patients with excess visceral adiposity exist. Lifestyle modification has equivocal effects on VAT reduction and improvement in metabolic indices in HIV (33). Tesamorelin, a GHRH analog, is the only Food and Drug Administration-approved medication for VAT reduction in HIV. In short-term trials, there was a reduction in VAT by 15% (34). However, limitations of tesamorelin use include aggravation of insulin resistance in the short term and its neutral effects on glucose homeostasis more long term. Thus, it is imperative to develop a comprehensive therapeutic strategy that can target ectopic fat deposition, metabolic complications, and inflammation. MR antagonists have an established safety profile and are generally well tolerated in patients with heart and liver disease. Our data suggest the need to investigate MR blockade in HIV-infected patients with increased VAT and insulin resistance. Angiotensin receptor blockers have been studied in HIV-infected patients and reduce generalized adipose tissue volume but were not shown to specifically target the visceral depot (35). Based on preclinical data and data from the current study, we anticipate that MR blockade will have better efficacy in targeting metabolic dysregulation associated with excess visceral adiposity. In addition, MR antagonists may be preferred to angiotensin receptor blocker use to avoid aldosterone escape and increased renin production through the loss of negative feedback from Ang II and to specifically target the MR, regardless of other MR activators including renin or Ang II. This is important because we have also demonstrated a strong relationship between renin and VAT.
In addition to suggesting a potential therapeutic strategy for RAAS activation, these data add to the literature highlighting potential adverse cardiometabolic outcomes and increased mortality in patients consuming a diet low in sodium vs those consuming a higher-sodium diet (36–38). Indeed, we show for the first time in HIV that markers of inflammation hsCRP, IL-6, and adiponectin are adversely affected by low sodium. As such, identifying a group of individuals with inappropriately high aldosterone levels, insulin resistance, and inflammation on a low-sodium diet could begin to provide an understanding of why sodium restriction could be harmful, at least in some patients with increased visceral adiposity. Moreover, the low-sodium condition was a useful probe to discern abnormalities in RAAS activation that may be masked during high sodium intake.
This study has some limitations but a number of strengths. This study had a small sample size and was cross-sectional; therefore, causality cannot be determined. With a larger sample size, it may have been possible to detect a greater difference in VAT between groups, which may have resulted in more significant effects of aldosterone dysregulation, and we may have been able to detect a difference in RAAS activation between those non-HIV-infected subjects with and without excess VAT. To properly assess RAAS activation, we used strict protocols to control for diet, timing of the day, and posture. Appropriate sodium balance was achieved among all subjects, and there was no significant difference in urinary sodium between HIV- and non-HIV-infected subjects at each respective visit, suggesting uniform protocol conditions. In addition, we controlled for other factors in our multivariate models known to affect aldosterone and PRA levels, including BP, sodium balance, potassium, and Ang II, and groups were otherwise well matched for basic demographics. Our data demonstrate a unique interrelationship between aldosterone, PRA, VAT, and insulin resistance in HIV-infected patients, controlling for relevant covariates.
In summary, these studies using HIV as a model of acquired RAAS dysregulation suggest that RAAS activation, uniquely related to VAT accumulation, may contribute to metabolic dysregulation and inflammation and serve as a novel target for potential manipulation in this population. No studies to date using MR antagonists have been performed in HIV to investigate the extent of its therapeutic benefit on VAT accumulation and related inflammatory and cardiovascular indices. Future investigations of MR blockade could have important implications for reducing cardiometabolic morbidity and mortality in the HIV-infected population as well as other populations predisposed to fat redistribution.
Acknowledgments
We thank the nursing staff on the Massachusetts General Hospital Clinical Research Center and Brigham and Women's Hospital Center for Clinical Investigation for their dedicated patient care as well as the volunteers who participated in this study.
The study had the clinical trial registration identifier of NCT01407237.
This work was supported by National Institutes of Health (NIH) Grant R01DK49302 (to S.K.G.); NIH Grant K24 HL103845 (to G.K.A.); NIH Grants M01RR01066, UL1 RR025758, and UL1 TR001102 (to the Harvard Catalyst/Harvard Clinical and Translational Science Center from the National Center for Research Resources and the National Center for Advancing Translational Sciences); and NIH/National Institute of Diabetes and Digestive and Kidney Diseases Grant P30DK40561, a Pilot and Feasibility Grant, Nutrition and Obesity Research Center at Harvard.
Disclosure Summary: G.K.A. has been a consultant for Pfizer, and S.K.G. has received research funding from Bristol-Myers Squibb, Immunex, Gilead, and Theratechnologies and served as a consultant for Navidea Inc, Merck, Theratechnologies, Bristol-Myers Squibb, Gilead, and NovoNordisk, all unrelated to this manuscript. S.S., K.V.F., K.W., M.T., T.S., J.L., and C.M. have nothing to disclose.
Footnotes
- Agt
- angiotensinogen
- Ang II
- angiotensin II
- ART
- antiretroviral therapy
- BMI
- body mass index
- BP
- blood pressure
- HOMA-IR
- homeostatic model assessment for insulin resistance
- hsCRP
- high-sensitivity C-reactive protein
- MAP
- mean arterial pressure
- MR
- mineralocorticoid receptor
- PRA
- plasma renin activity
- RAAS
- renin-angiotensin-aldosterone system
- SAT
- sc adipose tissue
- VAT
- visceral adipose tissue.
References
- 1. Guo C, Ricchiuti V, Lian BQ, et al. Mineralocorticoid receptor blockade reverses obesity-related changes in expression of adiponectin, peroxisome proliferator-activated receptor-γ, and proinflammatory adipokines. Circulation. 2008;117:2253–2261. [DOI] [PMC free article] [PubMed] [Google Scholar]
- 2. Bentley-Lewis R, Adler GK, Perlstein T, et al. Body mass index predicts aldosterone production in normotensive adults on a high-salt diet. J Clin Endocrinol Metab. 2007;92:4472–4475. [DOI] [PMC free article] [PubMed] [Google Scholar]
- 3. Garg R, Hurwitz S, Williams GH, Hopkins PN, Adler GK. Aldosterone production and insulin resistance in healthy adults. J Clin Endocrinol Metab. 2010;95:1986–1990. [DOI] [PMC free article] [PubMed] [Google Scholar]
- 4. Lo J, Looby SE, Wei J, Adler GK, Grinspoon SK. Increased aldosterone among HIV-infected women with visceral fat accumulation. AIDS. 2009;23:2366–2370. [DOI] [PMC free article] [PubMed] [Google Scholar]
- 5. Kuk JL, Katzmarzyk PT, Nichaman MZ, Church TS, Blair SN, Ross R. Visceral fat is an independent predictor of all-cause mortality in men. Obesity (Silver Spring). 2006;14:336–341. [DOI] [PubMed] [Google Scholar]
- 6. Rondinone CM, Rodbard D, Baker ME. Aldosterone stimulated differentiation of mouse 3T3-L1 cells into adipocytes. Endocrinology. 1993;132:2421–2426. [DOI] [PubMed] [Google Scholar]
- 7. Saye JA, Cassis LA, Sturgill TW, Lynch KR, Peach MJ. Angiotensinogen gene expression in 3T3-L1 cells. Am J Physiol. 1989;256:C448–C451. [DOI] [PubMed] [Google Scholar]
- 8. Karlsson C, Lindell K, Ottosson M, Sjostrom L, Carlsson B, Carlsson LM. Human adipose tissue expresses angiotensinogen and enzymes required for its conversion to angiotensin II. J Clin Endocrinol Metab. 1998;83:3925–3929. [DOI] [PubMed] [Google Scholar]
- 9. Briones AM, Nguyen Dinh Cat A, Callera GE, et al. Adipocytes produce aldosterone through calcineurin-dependent signaling pathways: implications in diabetes mellitus-associated obesity and vascular dysfunction. Hypertension. 2012;59:1069–1078. [DOI] [PubMed] [Google Scholar]
- 10. Cassis LA, Police SB, Yiannikouris F, Thatcher SE. Local adipose tissue renin-angiotensin system. Curr Hypertens Rep. 2008;10:93–98. [DOI] [PMC free article] [PubMed] [Google Scholar]
- 11. Hadigan C, Meigs JB, Corcoran C, et al. Metabolic abnormalities and cardiovascular disease risk factors in adults with human immunodeficiency virus infection and lipodystrophy. Clin Infect Dis. 2001;32:130–139. [DOI] [PubMed] [Google Scholar]
- 12. Joy T, Keogh HM, Hadigan C, et al. Relation of body composition to body mass index in HIV-infected patients with metabolic abnormalities. J Acquir Immune Defic Syndr. 2008;47:174–184. [DOI] [PMC free article] [PubMed] [Google Scholar]
- 13. Grunfeld C, Rimland D, Gibert CL, et al. Association of upper trunk and visceral adipose tissue volume with insulin resistance in control and HIV-infected subjects in the FRAM study. J Acquir Immune Defic Syndr. 2007;46:283–290. [DOI] [PMC free article] [PubMed] [Google Scholar]
- 14. He Q, Engelson ES, Ionescu G, Glesby MJ, Albu JB, Kotler DP. Insulin resistance, hepatic lipid and adipose tissue distribution in HIV-infected men. Antivir Ther. 2008;13:423–428. [PMC free article] [PubMed] [Google Scholar]
- 15. Wohl D, Scherzer R, Heymsfield S, et al. The associations of regional adipose tissue with lipid and lipoprotein levels in HIV-infected men. J Acquir Immune Defic Syndr. 2008;48:44–52. [DOI] [PMC free article] [PubMed] [Google Scholar]
- 16. Guaraldi G, Stentarelli C, Zona S, et al. Lipodystrophy and anti-retroviral therapy as predictors of sub-clinical atherosclerosis in human immunodeficiency virus infected subjects. Atherosclerosis. 2010;208:222–227. [DOI] [PubMed] [Google Scholar]
- 17. Troseid M, Ditlevsen S, Hvid T, et al. Reduced trunk fat and triglycerides after strength training are associated with reduced LPS levels in HIV-infected individuals. J Acquir Immune Defic Syndr. 2014;66:e52–e54. [DOI] [PubMed] [Google Scholar]
- 18. Goodfriend TL, Kelley DE, Goodpaster BH, Winters SJ. Visceral obesity and insulin resistance are associated with plasma aldosterone levels in women. Obes Res. 1999;7:355–362. [DOI] [PubMed] [Google Scholar]
- 19. Fallo F, Della Mea P, Sonino N, et al. Adiponectin and insulin sensitivity in primary aldosteronism. Am J Hypertens. 2007;20:855–861. [DOI] [PubMed] [Google Scholar]
- 20. Fallo F, Dalla Pozza A, Tecchio M, et al. Nonalcoholic fatty liver disease in primary aldosteronism: a pilot study. Am J Hypertens. 2010;23:2–5. [DOI] [PubMed] [Google Scholar]
- 21. Hoffstedt J, Poirier O, Thorne A, et al. Polymorphism of the human β3-adrenoceptor gene forms a well-conserved haplotype that is associated with moderate obesity and altered receptor function. Diabetes. 1999;48:203–205. [DOI] [PubMed] [Google Scholar]
- 22. Lonnqvist F, Thome A, Nilsell K, Hoffstedt J, Arner P. A pathogenic role of visceral fat β3-adrenoceptors in obesity. J Clin Invest. 1995;95:1109–1116. [DOI] [PMC free article] [PubMed] [Google Scholar]
- 23. Mauriege P, Galitzky J, Berlan M, Lafontan M. Heterogeneous distribution of β and α-2 adrenoceptor binding sites in human fat cells from various fat deposits: functional consequences. Eur J Clin Invest. 1987;17:156–165. [DOI] [PubMed] [Google Scholar]
- 24. Khoury N, McGill JB. Reduction in insulin sensitivity following administration of the clinically used low-dose pressor, norepinephrine. Diabetes Metab Res Rev. 2011;27:604–608. [DOI] [PMC free article] [PubMed] [Google Scholar]
- 25. Sarigianni M, Bekiari E, Tsapas A, et al. Effect of epinephrine and insulin resistance on human monocytes obtained from lean and obese healthy participants: a pilot study. Angiology. 2011;62:38–45. [DOI] [PubMed] [Google Scholar]
- 26. Sigmund CD, Jones CA, Kane CM, Wu C, Lang JA, Gross KW. Regulated tissue- and cell-specific expression of the human renin gene in transgenic mice. Circ Res. 1992;70:1070–1079. [DOI] [PubMed] [Google Scholar]
- 27. Hirata A, Maeda N, Hiuge A, et al. Blockade of mineralocorticoid receptor reverses adipocyte dysfunction and insulin resistance in obese mice. Cardiovasc Res. 2009;84:164–172. [DOI] [PubMed] [Google Scholar]
- 28. Hitomi H, Kiyomoto H, Nishiyama A, et al. Aldosterone suppresses insulin signaling via the downregulation of insulin receptor substrate-1 in vascular smooth muscle cells. Hypertension. 2007;50:750–755. [DOI] [PubMed] [Google Scholar]
- 29. Wada T, Ohshima S, Fujisawa E, Koya D, Tsuneki H, Sasaoka T. Aldosterone inhibits insulin-induced glucose uptake by degradation of insulin receptor substrate (IRS) 1 and IRS2 via a reactive oxygen species-mediated pathway in 3T3-L1 adipocytes. Endocrinology. 2009;150:1662–1669. [DOI] [PubMed] [Google Scholar]
- 30. Folli F, Saad MJ, Velloso L, et al. Cross talk between insulin and angiotensin II signalling systems. Exp Clin Endocrinol Diabetes. 1999;107:133–139. [DOI] [PubMed] [Google Scholar]
- 31. Selvaraj J, Muthusamy T, Srinivasan C, Balasubramanian K. Impact of excess aldosterone on glucose homeostasis in adult male rat. Clin Chim Acta. 2009;407:51–57. [DOI] [PubMed] [Google Scholar]
- 32. Kalupahana NS, Massiera F, Quignard-Boulange A, et al. Overproduction of angiotensinogen from adipose tissue induces adipose inflammation, glucose intolerance, and insulin resistance. Obesity (Silver Spring). 2012;20:48–56. [DOI] [PMC free article] [PubMed] [Google Scholar]
- 33. Dolan SE, Frontera W, Librizzi J, et al. Effects of a supervised home-based aerobic and progressive resistance training regimen in women infected with human immunodeficiency virus: a randomized trial. Arch Intern Med. 2006;166:1225–1231. [DOI] [PMC free article] [PubMed] [Google Scholar]
- 34. Falutz J, Allas S, Blot K, et al. Metabolic effects of a growth hormone-releasing factor in patients with HIV. N Engl J Med. 2007;357:2359–2370. [DOI] [PubMed] [Google Scholar]
- 35. Lake JE, Tseng CH, Currier JS. A pilot study of telmisartan for visceral adiposity in HIV infection: the Metabolic Abnormalities, Telmisartan, and HIV Infection (MATH) trial. PLoS One. 2013;8:e58135. [DOI] [PMC free article] [PubMed] [Google Scholar]
- 36. Alderman MH, Cohen H, Madhavan S. Dietary sodium intake and mortality: the National Health and Nutrition Examination Survey (NHANES I). Lancet. 1998;351:781–785. [DOI] [PubMed] [Google Scholar]
- 37. Cohen HW, Hailpern SM, Fang J, Alderman MH. Sodium intake and mortality in the NHANES II follow-up study. Am J Med. 2006;119:275 e277–e214. [DOI] [PubMed] [Google Scholar]
- 38. DiNicolantonio JJ, Niazi AK, Sadaf R, JH, OK, Lucan SC, Lavie CJ. Dietary sodium restriction: take it with a grain of salt. Am J Med. 2013;126:951–955. [DOI] [PubMed] [Google Scholar]