

Abstract
Purpose
Although the incidence and mortality of colon cancer in the United States has declined over the past two decades, blacks have worse outcomes than whites. Variations in treatment may contribute to mortality differentials.
Methods
Patients diagnosed with stage III colon cancer were randomly sampled from the SEER program from the years 1990, 1991, 1995, 2000, 2005, and 2010. Patients were categorized as non-Hispanic white (n = 835) or black (n = 384). Treatment data were obtained from a review of the medical records, and these data were verified through contact with the original treating physicians. Log-binomial regression models were used to estimate the association between race and receipt of adjuvant chemotherapy. Effect modification by insurance was assessed with use of single referent models.
Results
Receipt of adjuvant chemotherapy among both white and black patients increased from the period encompassing the years 1990 and 1991 (white, 58%; black, 45%) to the year 2005 (white, 72%; black, 71%) and then decreased in the year 2010 (white, 66%; black, 57%). There were marked racial disparities in the time period of 1990 to 1991 and again in 2010, with black patients less likely to receive adjuvant chemotherapy as compared with white patients (risk ratio [RR], .82; 95% CI, .72 to .93). For black patients, receipt of adjuvant chemotherapy did not differ across insurance categories (RR for private insurance, .80; 95% CI, .69 to .93; RR for Medicare, .84; 95% CI, .69 to 1.02; and RR for Medicaid, .84; 95% CI, .69 to 1.02), although a larger proportion had Medicaid in all years of the study as compared with white patients.
Conclusion
The chemotherapy differential narrowed after the time period of 1990 to 1991, but our findings suggest that the disparity reemerged in 2010. Recent decreases in chemotherapy use may be due, in part, to the economic downturn and an increase in Medicaid coverage.
INTRODUCTION
The incidence and mortality of colon cancer in the United States has declined over the past two decades, but this decline has been less for black patients than for white patients. Colon cancer disproportionately affects blacks, who experience continually higher incidence and mortality than whites. From 1975 to 2011, the average incidence rates were 39.7 and 46.4 per 100,000 for whites and blacks, respectively.1 Mortality rates during the same period were 21.8 per 100,000 for whites and 27.2 per 100,000 for blacks.1 Although mortality rates have decreased for each stage among both whites and blacks, the decreases have been smaller for blacks.2 For example, between 1985 and 2008, relative mortality decreased by 49% among whites with regional stage disease compared with a 34% decrease among blacks.3 Racial disparities in colon cancer outcomes are partly attributable to differences in risk factors,4–6 screening and early detection,7–9 follow-up of abnormalities,10 and tumor biology11–15; however, variations in treatment may also contribute to mortality differentials.
Adjuvant chemotherapy is recognized as standard guideline care for patients who have been newly diagnosed with stage III colon cancer. Early randomized trials showed significant reductions in the risk of cancer recurrence and mortality among patients with stage III disease treated with 5-fluorouracil (5-FU) and levamisole following surgery.16–18 These results, combined with the recommendations of the National Institutes of Health Consensus Development Conference on Adjuvant Therapy for Patients with Colon and Rectal Cancer,19 led to an increased use of adjuvant chemotherapy in the 1990s.20,21 Several chemotherapy regimens have since emerged as acceptable standards of care for patients with stage III colon cancer treated with surgery. Adjuvant 5-FU, leucovorin,22–24 and, more recently, oxaliplatin and capecitabine have been shown to provide additional survival benefits.25–29 Current guidelines recommend treatment regimens such as 5-FU and leucovorin combined or with the addition of oxaliplatin (FOLFOX), capecitabine combined with oxaliplatin (CapeOx), or single-agent capecitabine.30
Previous studies report racial disparities in the receipt of adjuvant chemotherapy among patients with stage III colon cancer, with black patients less likely than white patients to receive chemotherapy.31–33 The extent of this disparity over time and in different settings remains unknown. The purpose of this study was to examine patterns of adjuvant chemotherapy use among non-Hispanic whites and blacks in a population-based sample of patients with stage III colon cancer. We focused on treatment during 1990, 1991, 1995, 2000, 2005, and 2010, with the latter period marked by changes in health-care policy and economic downturn.
METHODS
Patients and Procedures
Patients diagnosed with stage III colon cancer were sampled from the National Cancer Institute's (NCI) population-based program of SEER cancer registries (n = 1,898). The SEER registries routinely collect information on demographics, diagnosis, tumor characteristics, and treatment for all persons diagnosed with cancer who reside in defined geographic regions, which include approximately 28% of the US population. Adjuvant therapy administered in the outpatient setting is often under-ascertained by the SEER registries; therefore, the NCI annually conducts patterns of care (POC) studies on a sample of persons with select cancers to assess the use of adjuvant therapies as initial treatment in community settings. Patients with stage III colon cancer in participating SEER registries were eligible for POC studies in 1990, 1991, 1995, 2000, 2005, and 2010. Stage III included any T1 to T4 tumors with regional lymph-node involvement. Patients were stratified by registry, sex, age, and race or ethnicity, and a random sample was taken from within each strata. There was oversampling by race in 1995, 2000, 2005, and 2010. Patients were ineligible if they were younger than 20 years, previously diagnosed with cancer (excluding nonmelanoma skin cancer), diagnosed at autopsy or on death certificate only, or diagnosed with a synchronous cancer.
Patient medical records were abstracted for chemotherapy agents and dates of treatment following diagnosis. Treating physicians were contacted and asked to verify specific chemotherapeutic agents received as part of initial therapy. Patients for whom chemotherapy was recommended or given were considered to have received adjuvant chemotherapy. Patients who refused chemotherapy (n = 32) were not considered to have received chemotherapy. We excluded patients who did not undergo cancer-directed surgery (n = 8), those with unknown or missing chemotherapy agents (n = 41), those with unknown or no health insurance (n = 95), or those who identified as a race or ethnicity other than non-Hispanic white or black (n = 535).
Covariates
Patient demographic (age, sex, marital status, and race) and diagnosis and tumor characteristics (date of diagnosis, stage, and anatomic location) were obtained from routinely collected SEER registry data. Race or ethnicity was categorized as non-Hispanic white (white) or non-Hispanic black (black). Patient comorbidities, tumor grade, and histology were abstracted from the medical record; comorbidity was assessed with use of the Charlson comorbidity index.34 Insurance reported on the medical record was classified into mutually exclusive groups of private insurance (including health maintenance organizations and military coverage), any Medicaid, or Medicare only (ie, patients with Medicare and private insurance were classified as having private insurance). Each registry identified hospital characteristics, including hospital type (private, government, or nonprofit), an approved residency training program, and total bed size. High-risk tumor features, including bowel obstruction (complete or partial), inadequately sampled lymph nodes (< 12) during resection of the primary tumor, and positive surgical margins, were abstracted from the medical record.
Data Analysis
Weighted proportions were used to examine trends in the receipt of adjuvant chemotherapy and the proportion of patients who received common chemotherapy agents and combination chemotherapy regimens. Sample weights were calculated as the inverse of the sampling proportion for each sampling stratum. Log-binomial regression models with stratum-specific sample weights were used to estimate the association of race and insurance with receipt of adjuvant chemotherapy in the total population as well as among a subset of patients considered optimal chemotherapy patients. Optimal chemotherapy patients were defined as patients younger than 75 years of age who have a comorbidity score of 1 or less. Models were adjusted for age at diagnosis, comorbidity, year of diagnosis, race (insurance model), and insurance (race model). Adjusted associations between race, insurance, and receipt of adjuvant chemotherapy are presented as risk ratios and 95% confidence intervals. We also report the marginal probability of receiving adjuvant chemotherapy by race and insurance groups.
We evaluated effect measure modification by insurance type with use of single referent models with indicator terms. White patients with private insurance served as the referent group. Cross-product terms of race with Medicare and race with Medicaid were included in a log-binomial regression model to determine whether the estimated association between race and receipt of chemotherapy differs among patients covered under Medicare or Medicaid. We compared model fit of the lower-order model with the product-term model using the quasi-likelihood under the independence model criterion for generalized estimating equations models.35 All analyses were conducted with use of SAS version 9.3 (SAS/STAT User's Guide, version 9.3, 2011; SAS Institute, Cary, NC) and SUDAAN version 11.0.1 (Research Triangle Institute, Research Triangle Park, NC).
RESULTS
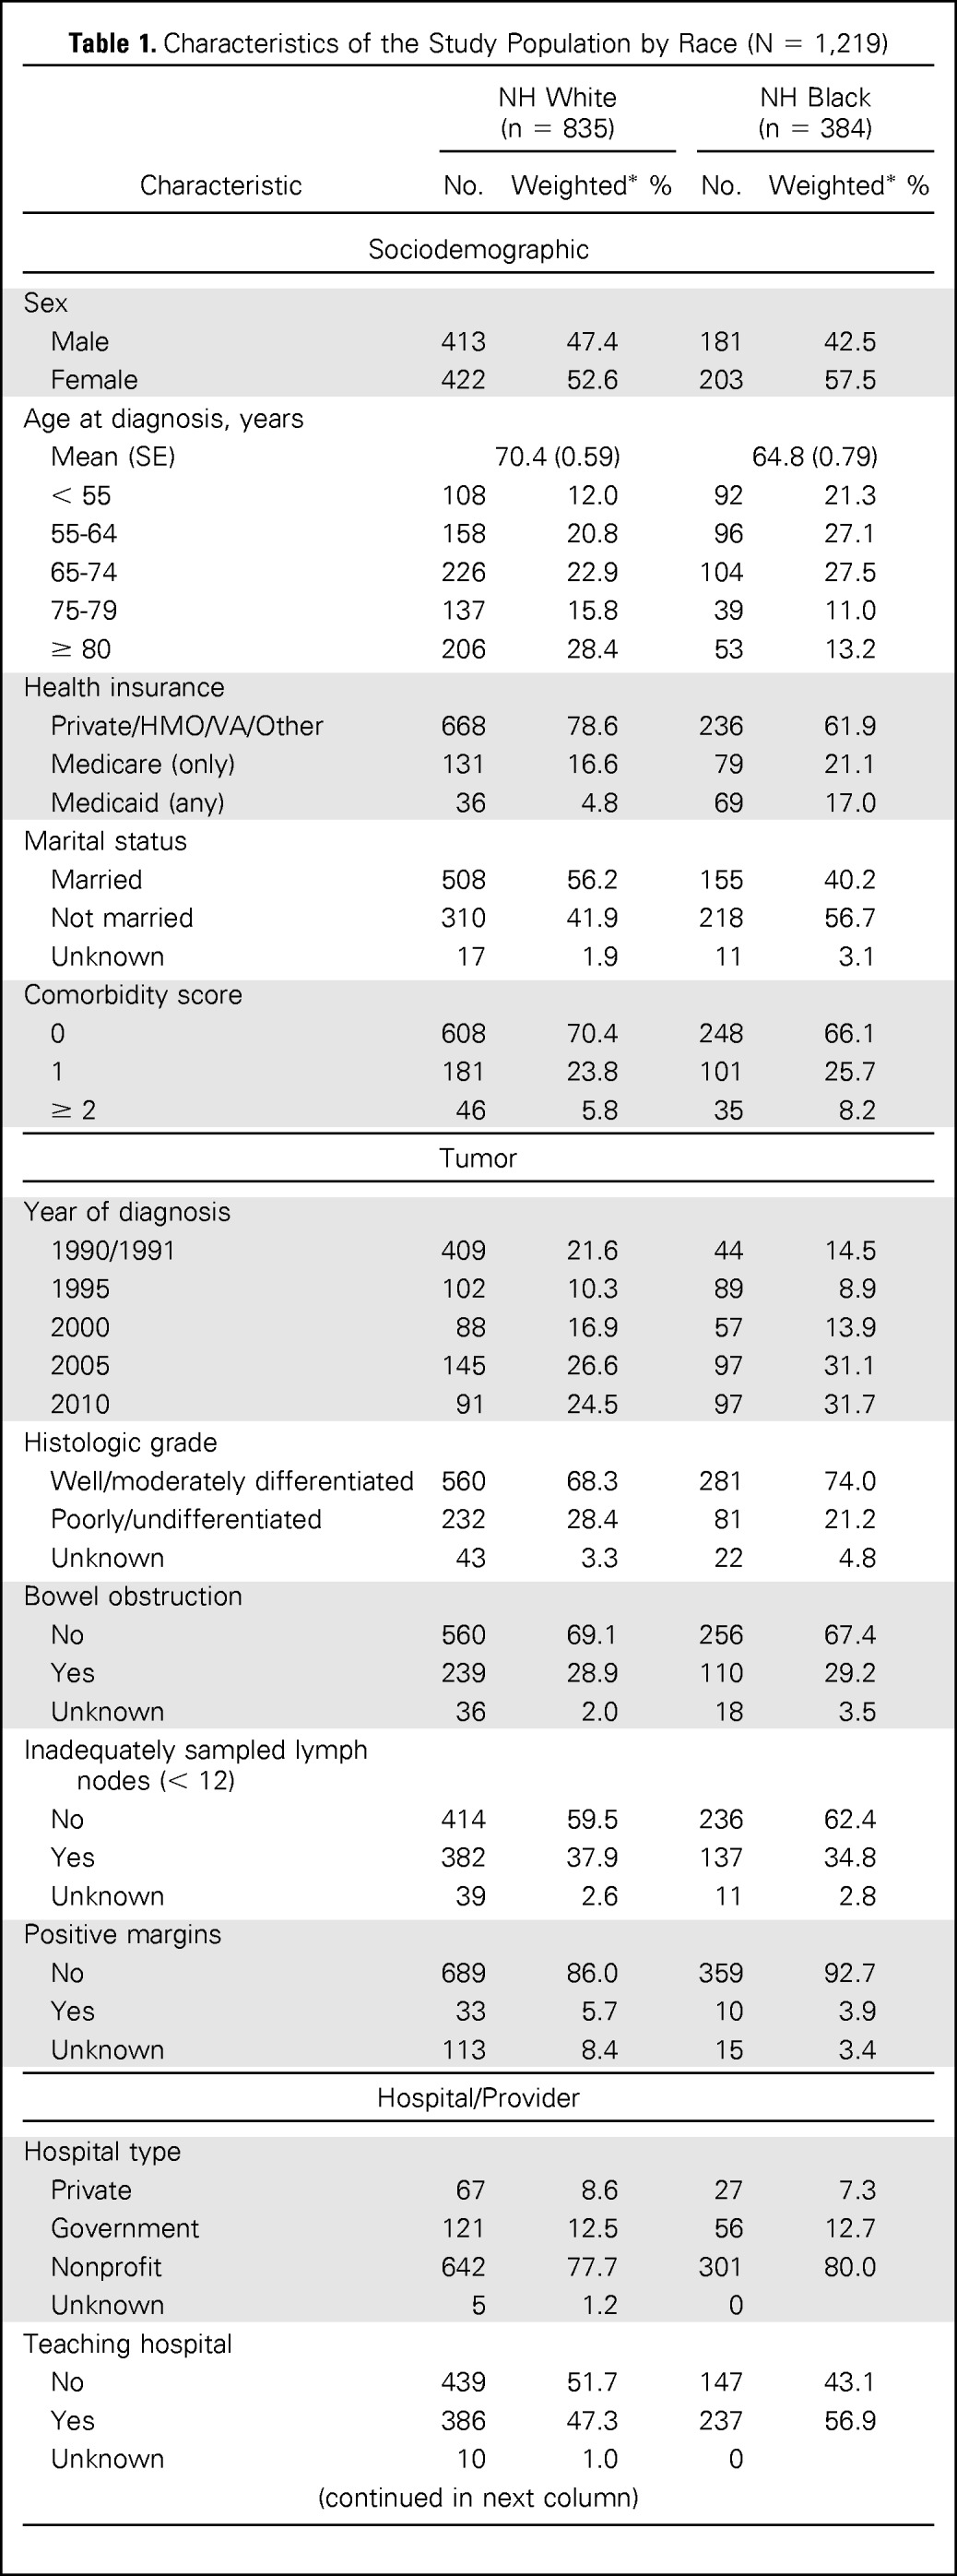
Characteristics of the study population (n = 1,219) by race are shown in Table 1. Overall, 64.6% of patients received adjuvant chemotherapy during the study period. Receipt of chemotherapy increased among white and black patients from the years 1990 and 1991 (white, 58.2%; black, 45.2%) to the year 2005 (white, 71.8%; black, 71.4%) and decreased in 2010 (white, 66.3%; black, 56.9%; Fig 1). There was no difference in the proportion of white and black patients who received adjuvant chemotherapy in 1995 (white, 58.3%; black, 57.9%), 2000 (white, 66.1%; black, 66.2%) and 2005, but there were marked disparities in the period encompassing 1990 and 1991 and in the year 2010. Among optimal chemotherapy patients (ie, patients younger than 75 years of age who had a comorbidity score of 1 or less), a smaller proportion of black patients received chemotherapy in all study years as compared with whites (Fig 2). Receipt of adjuvant chemotherapy in this subgroup increased for whites after 1995 (72.5%) and continued to increase through 2005 (92.1%) but decreased in 2010 (87.0%). The proportion of optimal chemotherapy black patients who received adjuvant chemotherapy increased from the time period of 1990 and 1991 (57.9%) to the year 2005 (84.1%) and decreased in 2010 (67.2%).
Table 1.
Characteristics of the Study Population by Race (N = 1,219)
| Characteristic | NH White (n = 835) |
NH Black (n = 384) |
||
|---|---|---|---|---|
| No. | Weighted* % | No. | Weighted* % | |
| Sociodemographic | ||||
| Sex | ||||
| Male | 413 | 47.4 | 181 | 42.5 |
| Female | 422 | 52.6 | 203 | 57.5 |
| Age at diagnosis, years | ||||
| Mean (SE) | 70.4 (0.59) | 64.8 (0.79) | ||
| < 55 | 108 | 12.0 | 92 | 21.3 |
| 55-64 | 158 | 20.8 | 96 | 27.1 |
| 65-74 | 226 | 22.9 | 104 | 27.5 |
| 75-79 | 137 | 15.8 | 39 | 11.0 |
| ≥ 80 | 206 | 28.4 | 53 | 13.2 |
| Health insurance | ||||
| Private/HMO/VA/Other | 668 | 78.6 | 236 | 61.9 |
| Medicare (only) | 131 | 16.6 | 79 | 21.1 |
| Medicaid (any) | 36 | 4.8 | 69 | 17.0 |
| Marital status | ||||
| Married | 508 | 56.2 | 155 | 40.2 |
| Not married | 310 | 41.9 | 218 | 56.7 |
| Unknown | 17 | 1.9 | 11 | 3.1 |
| Comorbidity score | ||||
| 0 | 608 | 70.4 | 248 | 66.1 |
| 1 | 181 | 23.8 | 101 | 25.7 |
| ≥ 2 | 46 | 5.8 | 35 | 8.2 |
| Tumor | ||||
| Year of diagnosis | ||||
| 1990/1991 | 409 | 21.6 | 44 | 14.5 |
| 1995 | 102 | 10.3 | 89 | 8.9 |
| 2000 | 88 | 16.9 | 57 | 13.9 |
| 2005 | 145 | 26.6 | 97 | 31.1 |
| 2010 | 91 | 24.5 | 97 | 31.7 |
| Histologic grade | ||||
| Well/moderately differentiated | 560 | 68.3 | 281 | 74.0 |
| Poorly/undifferentiated | 232 | 28.4 | 81 | 21.2 |
| Unknown | 43 | 3.3 | 22 | 4.8 |
| Bowel obstruction | ||||
| No | 560 | 69.1 | 256 | 67.4 |
| Yes | 239 | 28.9 | 110 | 29.2 |
| Unknown | 36 | 2.0 | 18 | 3.5 |
| Inadequately sampled lymph nodes (< 12) | ||||
| No | 414 | 59.5 | 236 | 62.4 |
| Yes | 382 | 37.9 | 137 | 34.8 |
| Unknown | 39 | 2.6 | 11 | 2.8 |
| Positive margins | ||||
| No | 689 | 86.0 | 359 | 92.7 |
| Yes | 33 | 5.7 | 10 | 3.9 |
| Unknown | 113 | 8.4 | 15 | 3.4 |
| Hospital/Provider | ||||
| Hospital type | ||||
| Private | 67 | 8.6 | 27 | 7.3 |
| Government | 121 | 12.5 | 56 | 12.7 |
| Nonprofit | 642 | 77.7 | 301 | 80.0 |
| Unknown | 5 | 1.2 | 0 | |
| Teaching hospital | ||||
| No | 439 | 51.7 | 147 | 43.1 |
| Yes | 386 | 47.3 | 237 | 56.9 |
| Unknown | 10 | 1.0 | 0 | |
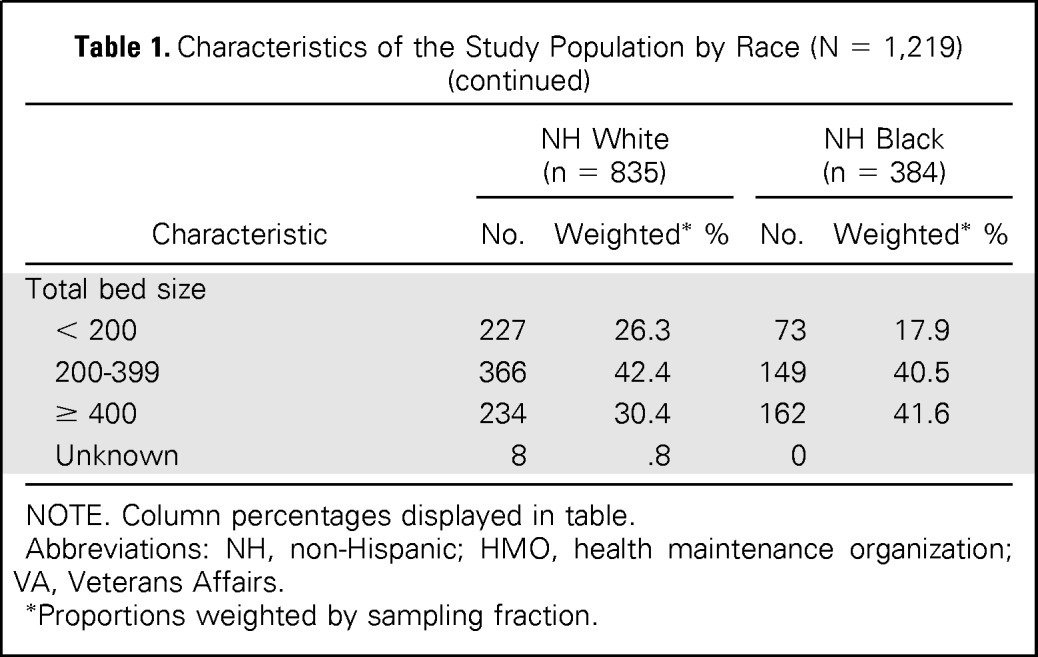
| Total bed size | ||||
| < 200 | 227 | 26.3 | 73 | 17.9 |
| 200-399 | 366 | 42.4 | 149 | 40.5 |
| ≥ 400 | 234 | 30.4 | 162 | 41.6 |
| Unknown | 8 | .8 | 0 | |
NOTE. Column percentages displayed in table.
Abbreviations: NH, non-Hispanic; HMO, health maintenance organization; VA, Veterans Affairs.
Proportions weighted by sampling fraction.
Fig 1.
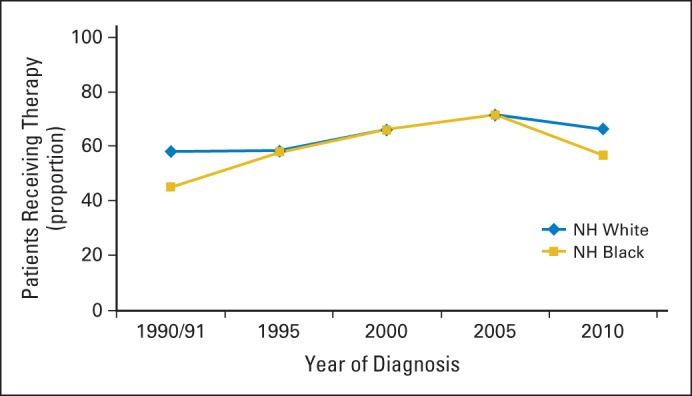
Proportion of patients with stage III colon cancer who received adjuvant chemotherapy by year of diagnosis and race (N = 1,219). NH, non-Hispanic.
Fig 2.
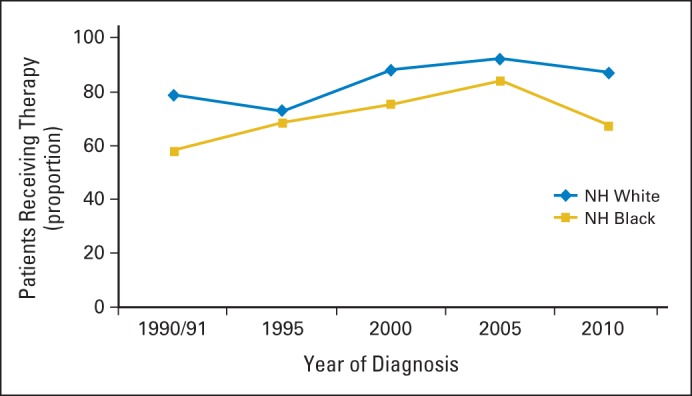
Proportion of optimal chemotherapy patients with stage III colon cancer who received adjuvant chemotherapy by year of diagnosis and race (n = 739). NH, non-Hispanic.
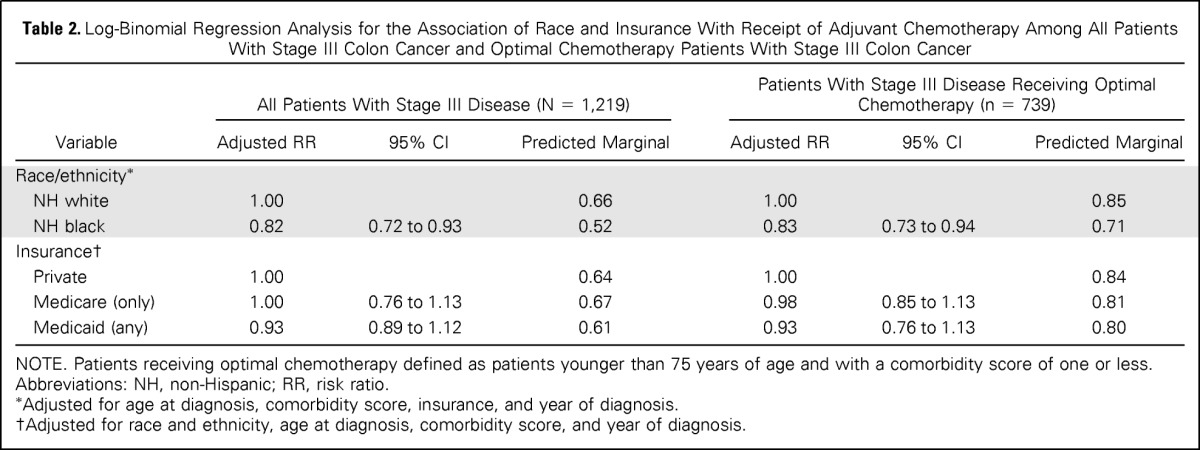
In the log-binomial regression models, black race was associated with lower receipt of adjuvant chemotherapy (RR, .82; 95% CI, .72 to .93) after adjusting for age, comorbidity, insurance, and year of diagnosis (Table 2). The relative risk was similar (RR, .84; 95% CI, .75 to .95) in the analysis limited to optimal chemotherapy patients. There was no association of insurance with receipt of chemotherapy in the overall analysis or the analysis of optimal chemotherapy patients.
Table 2.
Log-Binomial Regression Analysis for the Association of Race and Insurance With Receipt of Adjuvant Chemotherapy Among All Patients With Stage III Colon Cancer and Optimal Chemotherapy Patients With Stage III Colon Cancer
| Variable | All Patients With Stage III Disease (N = 1,219) |
Patients With Stage III Disease Receiving Optimal Chemotherapy (n = 739) |
||||
|---|---|---|---|---|---|---|
| Adjusted RR | 95% CI | Predicted Marginal | Adjusted RR | 95% CI | Predicted Marginal | |
| Race/ethnicity* | ||||||
| NH white | 1.00 | 0.66 | 1.00 | 0.85 | ||
| NH black | 0.82 | 0.72 to 0.93 | 0.52 | 0.83 | 0.73 to 0.94 | 0.71 |
| Insurance† | ||||||
| Private | 1.00 | 0.64 | 1.00 | 0.84 | ||
| Medicare (only) | 1.00 | 0.76 to 1.13 | 0.67 | 0.98 | 0.85 to 1.13 | 0.81 |
| Medicaid (any) | 0.93 | 0.89 to 1.12 | 0.61 | 0.93 | 0.76 to 1.13 | 0.80 |
NOTE. Patients receiving optimal chemotherapy defined as patients younger than 75 years of age and with a comorbidity score of one or less.
Abbreviations: NH, non-Hispanic; RR, risk ratio.
Adjusted for age at diagnosis, comorbidity score, insurance, and year of diagnosis.
Adjusted for race and ethnicity, age at diagnosis, comorbidity score, and year of diagnosis.
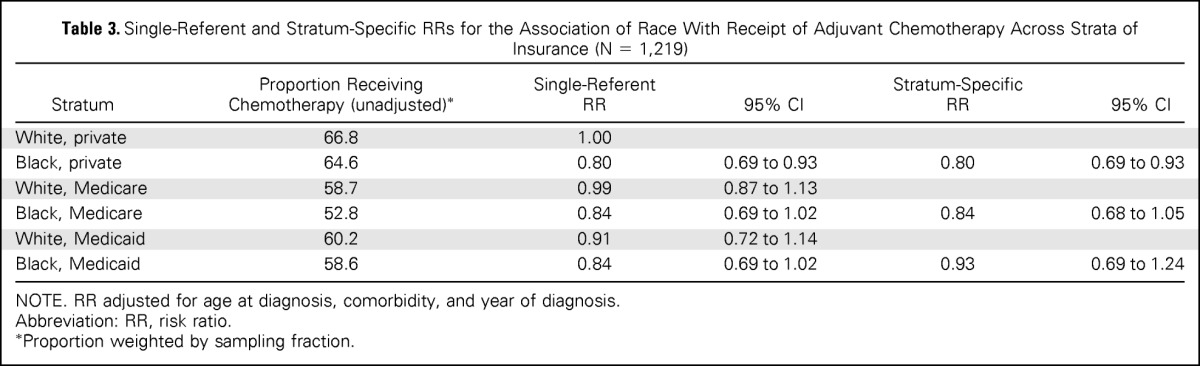
Insurance did not modify the effect of race on receipt of adjuvant chemotherapy (Table 3). In the single referent models, risk ratios for the receipt of chemotherapy were similar for black patients across all strata of insurance (RR for private insurance, .80; 95% CI, .69 to .93; RR for Medicare, .84; 95% CI, .69 to 1.02; RR for Medicaid, .84; 95% CI, .69 to 1.02) compared with white patients with private insurance. Stratum-specific risk ratios for the association of race and receipt of adjuvant chemotherapy were similar (RR for private insurance, .80; 95% CI, .69 to .93; RR for Medicare, .84; 95% CI, .68 to 1.05; RR for Medicaid, .93; 95% CI, .69 to 1.24). Model fit statistics indicated the lower-order term model (ie, main effects model) fit the data better than the model with cross-product terms (quasi-likelihood under the independence model criterion 12087.8 v 12100.9). Similar results were observed among optimal chemotherapy patients (data not shown).
Table 3.
Single-Referent and Stratum-Specific RRs for the Association of Race With Receipt of Adjuvant Chemotherapy Across Strata of Insurance (N = 1,219)
| Stratum | Proportion Receiving Chemotherapy (unadjusted)* | Single-Referent RR | 95% CI | Stratum-Specific RR | 95% CI |
|---|---|---|---|---|---|
| White, private | 66.8 | 1.00 | |||
| Black, private | 64.6 | 0.80 | 0.69 to 0.93 | 0.80 | 0.69 to 0.93 |
| White, Medicare | 58.7 | 0.99 | 0.87 to 1.13 | ||
| Black, Medicare | 52.8 | 0.84 | 0.69 to 1.02 | 0.84 | 0.68 to 1.05 |
| White, Medicaid | 60.2 | 0.91 | 0.72 to 1.14 | ||
| Black, Medicaid | 58.6 | 0.84 | 0.69 to 1.02 | 0.93 | 0.69 to 1.24 |
NOTE. RR adjusted for age at diagnosis, comorbidity, and year of diagnosis.
Abbreviation: RR, risk ratio.
Proportion weighted by sampling fraction.
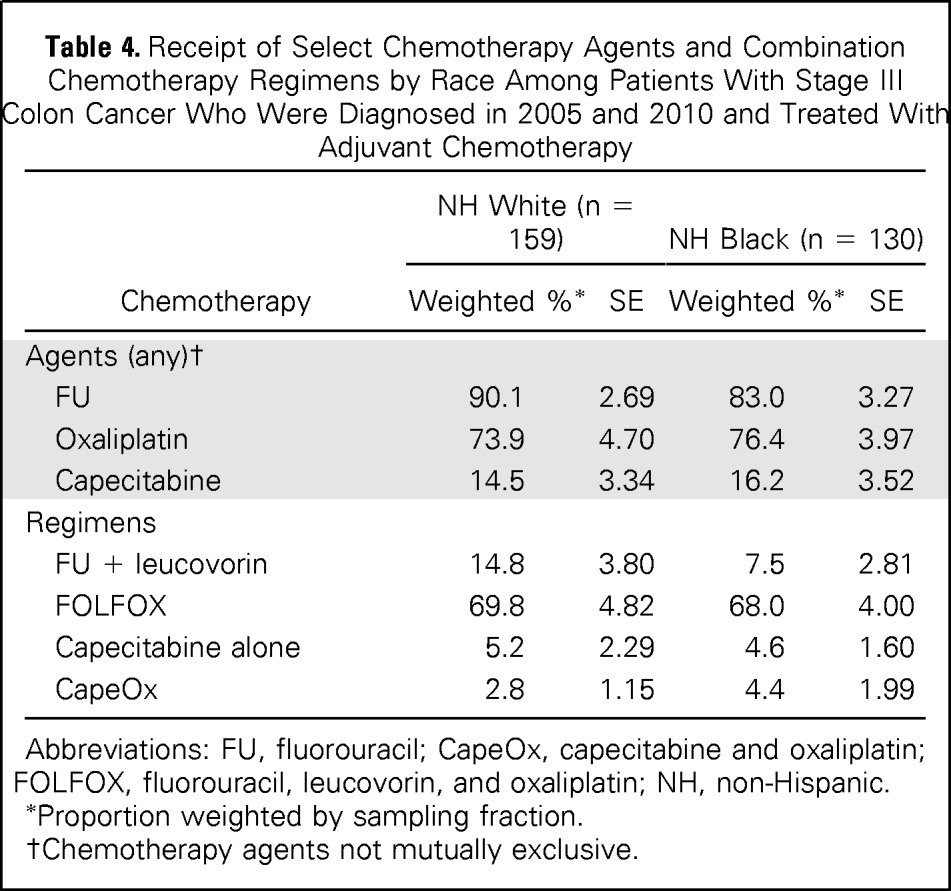
White and black patients who had been diagnosed in 2005 and 2010 and were treated with chemotherapy received similar chemotherapy agents (Table 4). There were no significant differences in the proportion of chemotherapy-treated patients who received any 5-FU (white, 90.1%; black, 83.0%), oxaliplatin (white, 73.9%; black, 76.4%), or capecitabine (white, 14.5%; black, 16.2%). The majority of patients received FOLFOX (white, 69.8%; black, 68.0%), and a growing number of patients received capecitabine, either alone (white, 5.2%; black, 4.6%) or in combination with oxaliplatin (white, 2.8%; black, 4.4%).
Table 4.
Receipt of Select Chemotherapy Agents and Combination Chemotherapy Regimens by Race Among Patients With Stage III Colon Cancer Who Were Diagnosed in 2005 and 2010 and Treated With Adjuvant Chemotherapy
| Chemotherapy | NH White (n = 159) |
NH Black (n = 130) |
||
|---|---|---|---|---|
| Weighted %* | SE | Weighted %* | SE | |
| Agents (any)† | ||||
| FU | 90.1 | 2.69 | 83.0 | 3.27 |
| Oxaliplatin | 73.9 | 4.70 | 76.4 | 3.97 |
| Capecitabine | 14.5 | 3.34 | 16.2 | 3.52 |
| Regimens | ||||
| FU + leucovorin | 14.8 | 3.80 | 7.5 | 2.81 |
| FOLFOX | 69.8 | 4.82 | 68.0 | 4.00 |
| Capecitabine alone | 5.2 | 2.29 | 4.6 | 1.60 |
| CapeOx | 2.8 | 1.15 | 4.4 | 1.99 |
Abbreviations: FU, fluorouracil; CapeOx, capecitabine and oxaliplatin; FOLFOX, fluorouracil, leucovorin, and oxaliplatin; NH, non-Hispanic.
Proportion weighted by sampling fraction.
Chemotherapy agents not mutually exclusive.
DISCUSSION
Our results demonstrate significant racial differences in the receipt of adjuvant chemotherapy among patients with stage III colon cancer over a 20-year time period. Although the gap in the proportion of white and black patients who received chemotherapy narrowed after the period encompassing 1990 and 1991, the disparity reemerged in 2010. Chemotherapy use decreased among all patients who had been diagnosed in 2010, but the decrease was more substantial in blacks (57%) compared with whites (66%). Black patients in this study were younger than white patients (mean age, 65 v 70 years), and both groups had similar high-risk tumor features (eg, histologic grade, and inadequately sampled lymph nodes). Yet, a smaller proportion of blacks received chemotherapy. There were even larger differences in the proportion of black and white patients who received chemotherapy among the subgroup of optimal chemotherapy patients who were younger and had a low or no comorbidity score. In this subgroup, 87% of white patients received chemotherapy in 2010 as compared with only 67% of blacks.
These findings suggest that differences in chemotherapy receipt are likely not the result of differences in patient or tumor characteristics. Rather, the racial disparity in chemotherapy receipt in 2010 may reflect differences in the ability to pay for cancer treatment during the economic downturn that followed the 2008 financial crisis. National expenditures for colorectal cancer in the year following diagnosis were among the highest of all major cancer sites in 2010.36 As the costs of cancer care have continued to increase rapidly, an emerging body of literature reports that a growing number of patients with cancer and cancer survivors are experiencing economic problems (eg, high insurance copayments, out-of-pocket costs, and bankruptcy) related to cancer treatment.37–42 Black Americans were disproportionately affected by the 2008 recession, and 28% reported losing a job as a result.43 Unemployment remained high in 2010, with 16.0% and 8.7% unemployment rates among blacks and whites, respectively.44 In a recent study of adult patients with cancer and cancer survivors from the 2010 National Health Interview Survey, one-third of all participants — and nearly half of non-Hispanic blacks — reported cancer-related financial problems.39 Other studies show that minority patients with breast, prostate, and lung cancers45–47 experience higher treatment costs as compared with whites.48 Increased unemployment and income loss during and shortly after the recession may have exacerbated the impact of cancer-treatment costs on the financial burden of patients. The inequitable economic impact of the recession among black patients may have contributed to the lower receipt of chemotherapy that we observed in 2010.
The introduction of oxaliplatin and capecitabine may also have resulted in some patients forgoing chemotherapy in 2010. The cost of cancer therapy plays an important role in treatment decisions, and cancer patients with an increased financial burden are more likely to delay or forgo medical care.39,48 On average, the wholesale price of chemotherapy regimens containing 5-FU and leucovorin (monthly, weekly, or biweekly) ranges from $60 to $300,49 while total costs of 5-FU and oxaliplatin can cost upward of $25,000.50 The average wholesale price of one cycle of capecitabine ranges from $2,600 to $3,500.51 The increased out-of-pocket cost of these regimens may have pushed some eligible patients to decline further treatment with chemotherapy after surgery.
Although the cost of oxaliplatin may have led some patients to forgo treatment, among patients in our study who did receive chemotherapy, more than 80% were treated with oxaliplatin in 2010. The proportion of white and black patients who received oxaliplatin was similar, although white patients were, on average, older than black patients. The racial differences in age are important because current guidelines recommend against treatment with oxaliplatin for patients older than 70 years.30 If physicians follow practice guidelines, a higher proportion of black patients are eligible for oxaliplatin and may face treatment decisions related to the costs of oxaliplatin, potentially increasing the disparity in chemotherapy use. It is important to monitor the extent to which disparities have persisted since 2010 as the types of agents and their costs continue to change.52
The role of insurance in the receipt of adjuvant chemotherapy is less clear. We expected differences in chemotherapy receipt to dissipate when comparing white and black patients with the same type of insurance, but the modification analysis showed that disparities existed similarly in all levels of insurance coverage (private insurance, Medicare, and Medicaid) over the entire study period. Racial disparities within insurance categories may be the result of differences by race in the underlying health status of patients, provider recommendations or patient preferences regarding treatment, or variability in the burden of cost-sharing from premium and deductible expenses. We also observed that a smaller proportion of white and black patients who had Medicaid insurance received chemotherapy in 2010 than did white patients with private insurance. Medicaid enrollment rose by nearly 6 million per month53 during the recession, and approximately 27% of blacks and 11% of whites were covered under Medicaid (including children) across the country.43 In our study, a greater proportion of black patients than white patients had Medicaid insurance in all study years, and, in 2010, 21% of blacks had Medicaid insurance as compared with just 5% of whites (Appendix Fig A1, online only). The greater pressure put on Medicaid during the recession may have led to increased coverage denials that negatively affected receipt of standard care. In a study of financial hardships faced by patients with colorectal cancer, the proportion of patients who experienced coverage denials was highest among Medicaid enrollees. Denials for chemotherapy, most often capecitabine, accounted for almost half of all insurance denials reported.54 We did not have sufficient power to examine the effect of race within each insurance category by year, but the disproportionate number of black patients who enrolled in Medicaid also may have contributed to the disparity in 2010.
Our findings are consistent with early studies of SEER-Medicare data, which showed black patients with colon cancer were less likely to receive chemotherapy as compared with white patients.31–33 In a study of patients with stage III colon cancer diagnosed within the time frame of 1992 to 1996, although black and white patients were equally likely to consult with a medical oncologist, black patients less often received chemotherapy.31 Only half of this disparity was explained by differences in patient sociodemographics, severity of illness, and tumor characteristics. A similar study found that a smaller proportion of black patients received chemotherapy as compared with whites, even among patients with no comorbidities.32 There is varying evidence concerning whether treatment disparities have diminished in later time periods. Our finding that chemotherapy receipt was similar for black and white patients in 1995, 2000, and 2005 is consistent with prior research that suggests that the treatment disparity noted in the early 1990s decreased over time.33,55,56 Others have found a persistent disparity through the mid-2000s.57–59 Differences in our results and those of others may be because of differences in study populations (eg, patient age or insurance type).
Limitations of our study include our inability to collect information on patient and physician preferences, which may further explain patterns in chemotherapy use during the study period. Patients with no insurance were excluded from the study and may have experienced worse outcomes; however, as there were few uninsured patients, the results would not be likely to change appreciably. A strength of our study is the complex sampling scheme that resulted in comparable characteristics of white and black patients included in the analysis. Many previous studies have been limited by inherent differences in the study population. Patients included in our study all had stage III disease and were sampled by sex, age, and registry and then oversampled by race to obtain more stable estimates. Specific chemotherapy agents and treatment dates were abstracted from patient medical records and verified by treating physicians, which limits the possibility that we overestimated the proportion of patients who received chemotherapy.
As insurance coverage and health policy continue to change with the introduction of the Affordable Care Act, it is important to understand the degree to which disparities in the receipt of cancer treatment will remain. Although health care reform will allow for universal insurance coverage, there will be differences in the level of benefits and out-of-pocket costs. Differences in reimbursement rates to providers may affect the number of physicians who are willing to accept and treat patients with certain health insurance policies, such as Medicaid. On average, Medicaid pays 25% less to physicians than Medicare pays.60 Acceptance of new patients enrolled in Medicaid is less in states with lower Medicaid fees as compared with Medicare reimbursement than it is in states with higher Medicaid fees,61 and a substantially smaller proportion of physicians in low-fee states treat new patients enrolled in Medicaid as compared with the proportion of physicians in high fee-states. With a limited number of oncologists and an increasing number of patients with cancer, the ability of patients to find a physician willing to accept a particular type of insurance may continue to influence receipt of chemotherapy. Such changes may ultimately result in financial resources playing as important a role as clinical recommendations in treatment decisions and access to care.
Appendix
Fig A1.
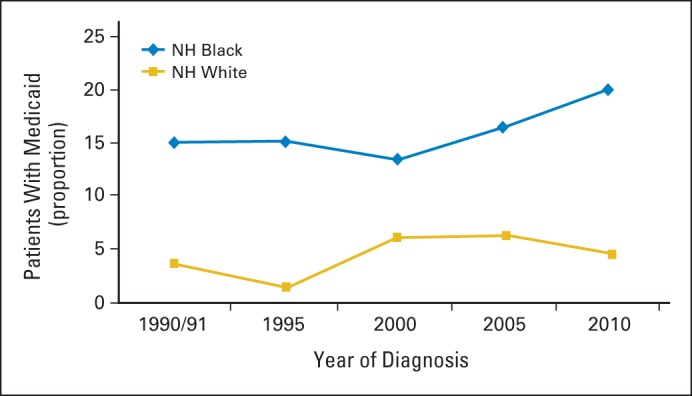
Proportion of patients with stage III colon cancer with Medicaid by year of diagnosis and race (N = 1,219). NH, non-Hispanic.
Footnotes
Supported by National Institutes of Health Grant No. T32 DK07634 (C.C.M.) and National Cancer Institute Contracts No. HHSN261201000024C, HSN261201000025C, HHSN261201000032C, HHSN261201000027C, HHSN261201000026C, HHSN261201000140C, HHSN261201000037C, HHSN261201000033C, HSN261201000034C, HHSN261201000035C, HHSN261201000029C, HHSN261201000031C, HSN261201000028C, and HHSN261201000030C.
Presented at the 7th American Association for Cancer Research Special Conference on the Science of Cancer Health Disparities in Racial/Ethnic Minorities and the Medically Underserved, San Antonio, TX, November 9-12, 2014.
Authors' disclosures of potential conflicts of interest are found in the article online at www.jco.org. Author contributions are found at the end of this article.
AUTHORS' DISCLOSURES OF POTENTIAL CONFLICTS OF INTEREST
Disclosures provided by the authors are available with this article at www.jco.org.
AUTHOR CONTRIBUTIONS
Conception and design: Caitlin C. Murphy, Linda C. Harlan, Ann M. Geiger
Financial support: Linda C. Harlan
Administrative support: Linda C. Harlan, Ann M. Geiger
Provision of study materials or patients: Linda C. Harlan
Collection and assembly of data: Linda C. Harlan
Data analysis and interpretation: Caitlin C. Murphy, Linda C. Harlan, Joan L. Warren
Manuscript writing: All authors
Final approval of manuscript: All authors
AUTHORS' DISCLOSURES OF POTENTIAL CONFLICTS OF INTEREST
Race and Insurance Differences in the Receipt of Adjuvant Chemotherapy Among Patients With Stage III Colon Cancer
The following represents disclosure information provided by authors of this manuscript. All relationships are considered compensated. Relationships are self-held unless noted. I = Immediate Family Member, Inst = My Institution. Relationships may not relate to the subject matter of this manuscript. For more information about ASCO's conflict of interest policy, please refer to www.asco.org/rwc or jco.ascopubs.org/site/ifc.
Caitlin C. Murphy
No relationship to disclose
Linda C. Harlan
No relationship to disclose
Joan L. Warren
No relationship to disclose
Ann M. Geiger
No relationship to disclose
REFERENCES
- 1.National Cancer Institute. surveillance, epidemiology, and end results. Cancer Statistics Review. 2013:1975–2011. [Google Scholar]
- 2.Siegel R, Desantis C, Jemal A. Colorectal cancer statistics, 2014. CA Cancer J Clin. 2014;64:104–117. doi: 10.3322/caac.21220. [DOI] [PubMed] [Google Scholar]
- 3.Robbins AS, Siegel RL, Jemal A. Racial disparities in stage-specific colorectal cancer mortality rates from 1985 to 2008. J Clin Oncol. 2012;30:401–405. doi: 10.1200/JCO.2011.37.5527. [DOI] [PubMed] [Google Scholar]
- 4.Doubeni CA, Major JM, Laiyemo AO, et al. Contribution of behavioral risk factors and obesity to socioeconomic differences in colorectal cancer incidence. J Natl Cancer Inst. 2012;104:1353–1362. doi: 10.1093/jnci/djs346. [DOI] [PMC free article] [PubMed] [Google Scholar]
- 5.Doubeni CA, Laiyemo AO, Major JM, et al. Socioeconomic status and the risk of colorectal cancer: An analysis of more than a half million adults in the National Institutes of Health-AARP Diet and Health Study. Cancer. 2012;118:3636–3644. doi: 10.1002/cncr.26677. [DOI] [PMC free article] [PubMed] [Google Scholar]
- 6.Siegel RL, Jemal A, Thun MJ, et al. Trends in the incidence of colorectal cancer in relation to county-level poverty among blacks and whites. J Natl Med Assoc. 2008;100:1441–1444. doi: 10.1016/s0027-9684(15)31544-3. [DOI] [PubMed] [Google Scholar]
- 7.Lansdorp-Vogelaar I, Kuntz KM, Knudsen AB, et al. Contribution of screening and survival differences to racial disparities in colorectal cancer rates. Cancer Epidemiol Biomarkers Prev. 2012;21:728–736. doi: 10.1158/1055-9965.EPI-12-0023. [DOI] [PMC free article] [PubMed] [Google Scholar]
- 8.Klabunde CN, Cronin KA, Breen N, et al. Trends in colorectal cancer test use among vulnerable populations in the United States. Cancer Epidemiol Biomarkers Prev. 2011;20:1611–1621. doi: 10.1158/1055-9965.EPI-11-0220. [DOI] [PMC free article] [PubMed] [Google Scholar]
- 9.Doubeni CA, Field TS, Buist DS, et al. Racial differences in tumor stage and survival for colorectal cancer in an insured population. Cancer. 2007;109:612–620. doi: 10.1002/cncr.22437. [DOI] [PubMed] [Google Scholar]
- 10.Laiyemo AO, Doubeni C, Pinsky PF, et al. Race and colorectal cancer disparities: Health-care utilization vs different cancer susceptibilities. J Natl Cancer Inst. 2010;102:538–546. doi: 10.1093/jnci/djq068. [DOI] [PMC free article] [PubMed] [Google Scholar]
- 11.Alexander D, Jhala N, Chatla C, et al. High-grade tumor differentiation is an indicator of poor prognosis in African Americans with colonic adenocarcinomas. Cancer. 2005;103:2163–2170. doi: 10.1002/cncr.21021. [DOI] [PMC free article] [PubMed] [Google Scholar]
- 12.Shavers VL. Racial/ethnic variation in the anatomic subsite location of in situ and invasive cancers of the colon. J Natl Med Assoc. 2007;99:733–748. [PMC free article] [PubMed] [Google Scholar]
- 13.Johnson H, Jr., Carstens R. Anatomical distribution of colonic carcinomas. Interracial differences in a community hospital population. Cancer. 1986;58:997–1000. doi: 10.1002/1097-0142(19860815)58:4<997::aid-cncr2820580435>3.0.co;2-2. [DOI] [PubMed] [Google Scholar]
- 14.Francois F, Park J, Bini EJ. Colon pathology detected after a positive screening flexible sigmoidoscopy: A prospective study in an ethnically diverse cohort. Am J Gastroenterol. 2006;101:823–830. doi: 10.1111/j.1572-0241.2006.00433.x. [DOI] [PubMed] [Google Scholar]
- 15.Fairley TL, Cardinez CJ, Martin J, et al. Colorectal cancer in U.S. adults younger than 50 years of age, 1998-2001. Cancer. 2006;107:1153–1161. doi: 10.1002/cncr.22012. [DOI] [PubMed] [Google Scholar]
- 16.Moertel CG, Fleming TR, Macdonald JS, et al. Levamisole and fluorouracil for adjuvant therapy of resected colon carcinoma. N Engl J Med. 1990;322:352–358. doi: 10.1056/NEJM199002083220602. [DOI] [PubMed] [Google Scholar]
- 17.Laurie JA, Moertel CG, Fleming TR, et al. Surgical adjuvant therapy of large-bowel carcinoma: An evaluation of levamisole and the combination of levamisole and fluorouracil. The North Central Cancer Treatment Group and the Mayo Clinic. J Clin Oncol. 1989;7:1447–1456. doi: 10.1200/JCO.1989.7.10.1447. [DOI] [PubMed] [Google Scholar]
- 18.Windle R, Bell PR, Shaw D. Five year results of a randomized trial of adjuvant 5-fluorouracil and levamisole in colorectal cancer. Br J Surg. 1987;74:569–572. doi: 10.1002/bjs.1800740707. [DOI] [PubMed] [Google Scholar]
- 19.NIH consensus conference. Adjuvant therapy for patients with colon and rectal cancer. JAMA. 1990;264:1444–1450. [PubMed] [Google Scholar]
- 20.Potosky AL, Harlan LC, Kaplan RS, et al. Age, sex, and racial differences in the use of standard adjuvant therapy for colorectal cancer. J Clin Oncol. 2002;20:1192–1202. doi: 10.1200/JCO.2002.20.5.1192. [DOI] [PubMed] [Google Scholar]
- 21.Cronin DP, Harlan LC, Potosky AL, et al. Patterns of care for adjuvant therapy in a random population-based sample of patients diagnosed with colorectal cancer. Am J Gastroenterol. 2006;101:2308–2318. doi: 10.1111/j.1572-0241.2006.00775.x. [DOI] [PubMed] [Google Scholar]
- 22.Wolmark N, Rockette H, Mamounas E, et al. Clinical trial to assess the relative efficacy of fluorouracil and leucovorin, fluorouracil and levamisole, and fluorouracil, leucovorin, and levamisole in patients with Dukes' B and C carcinoma of the colon: Results from National Surgical Adjuvant Breast and Bowel Project C-04. J Clin Oncol. 1999;17:3553–3559. doi: 10.1200/JCO.1999.17.11.3553. [DOI] [PubMed] [Google Scholar]
- 23.Haller DG, Catalano PJ, Macdonald JS, et al. Phase III study of fluorouracil, leucovorin, and levamisole in high-risk stage II and III colon cancer: Final report of Intergroup 0089. J Clin Oncol. 2005;23:8671–8678. doi: 10.1200/JCO.2004.00.5686. [DOI] [PubMed] [Google Scholar]
- 24.Efficacy of adjuvant fluorouracil and folinic acid in colon cancer. International Multicentre Pooled Analysis of Colon Cancer Trials (IMPACT) investigators. Lancet. 1995;345:939–944. [PubMed] [Google Scholar]
- 25.André T, Boni C, Mounedji-Boudiaf L, et al. Oxaliplatin, fluorouracil, and leucovorin as adjuvant treatment for colon cancer. N Engl J Med. 2004;350:2343–2351. doi: 10.1056/NEJMoa032709. [DOI] [PubMed] [Google Scholar]
- 26.André T, Boni C, Navarro M, et al. Improved overall survival with oxaliplatin, fluorouracil, and leucovorin as adjuvant treatment in stage II or III colon cancer in the MOSAIC trial. J Clin Oncol. 2009;27:3109–3116. doi: 10.1200/JCO.2008.20.6771. [DOI] [PubMed] [Google Scholar]
- 27.Haller DG, Tabernero J, Maroun J, et al. Capecitabine plus oxaliplatin compared with fluorouracil and folinic acid as adjuvant therapy for stage III colon cancer. J Clin Oncol. 2011;29:1465–1471. doi: 10.1200/JCO.2010.33.6297. [DOI] [PubMed] [Google Scholar]
- 28.Schmoll HJ, Cartwright T, Tabernero J, et al. Phase III trial of capecitabine plus oxaliplatin as adjuvant therapy for stage III colon cancer: A planned safety analysis in 1,864 patients. J Clin Oncol. 2007;25:102–109. doi: 10.1200/JCO.2006.08.1075. [DOI] [PubMed] [Google Scholar]
- 29.Twelves C, Wong A, Nowacki MP, et al. Capecitabine as adjuvant treatment for stage III colon cancer. N Engl J Med. 2005;352:2696–2704. doi: 10.1056/NEJMoa043116. [DOI] [PubMed] [Google Scholar]
- 30.Benson AB, 3rd, Venook AP, Bekaii-Saab T, et al. Colon cancer, version 3.2014. J National Comprehensive Cancer Network. 2014;12:1028–1059. doi: 10.6004/jnccn.2014.0099. [DOI] [PubMed] [Google Scholar]
- 31.Baldwin LM, Dobie SA, Billingsley K, et al. Explaining black-white differences in receipt of recommended colon cancer treatment. J Natl Cancer Inst. 2005;97:1211–1220. doi: 10.1093/jnci/dji241. [DOI] [PMC free article] [PubMed] [Google Scholar]
- 32.Schrag D, Cramer LD, Bach PB, et al. Age and adjuvant chemotherapy use after surgery for stage III colon cancer. J Natl Cancer Inst. 2001;93:850–857. doi: 10.1093/jnci/93.11.850. [DOI] [PubMed] [Google Scholar]
- 33.Jessup JM, Stewart A, Greene FL, et al. Adjuvant chemotherapy for stage III colon cancer: Implications of race/ethnicity, age, and differentiation. JAMA. 2005;294:2703–2711. doi: 10.1001/jama.294.21.2703. [DOI] [PubMed] [Google Scholar]
- 34.Charlson ME, Pompei P, Ales KL, et al. A new method of classifying prognostic comorbidity in longitudinal studies: Development and validation. J Chronic Dis. 1987;40:373–383. doi: 10.1016/0021-9681(87)90171-8. [DOI] [PubMed] [Google Scholar]
- 35.Pan W. Akaike's information criterion in generalized estimating equations. Biometrics. 2001;57:120–125. doi: 10.1111/j.0006-341x.2001.00120.x. [DOI] [PubMed] [Google Scholar]
- 36.Mariotto AB, Yabroff KR, Shao Y, et al. Projections of the cost of cancer care in the United States: 2010-2020. J Natl Cancer Inst. 2011;103:117–128. doi: 10.1093/jnci/djq495. [DOI] [PMC free article] [PubMed] [Google Scholar]
- 37.Ekwueme DU, Yabroff KR, Guy GP, Jr, et al. Medical costs and productivity losses of cancer survivors–United States, 2008-2011. MMWR Morb Mortal Wkly Rep. 2014;63:505–510. [PMC free article] [PubMed] [Google Scholar]
- 38.Guy GP, Jr., Ekwueme DU, Yabroff KR, et al. Economic burden of cancer survivorship among adults in the United States. J Clin Oncol. 2013;31:3749–3757. doi: 10.1200/JCO.2013.49.1241. [DOI] [PMC free article] [PubMed] [Google Scholar]
- 39.Kent EE, Forsythe LP, Yabroff KR, et al. Are survivors who report cancer-related financial problems more likely to forgo or delay medical care? Cancer. 2013;119:3710–3717. doi: 10.1002/cncr.28262. [DOI] [PMC free article] [PubMed] [Google Scholar]
- 40.Dowling EC, Chawla N, Forsythe LP, et al. Lost productivity and burden of illness in cancer survivors with and without other chronic conditions. Cancer. 2013;119:3393–3401. doi: 10.1002/cncr.28214. [DOI] [PMC free article] [PubMed] [Google Scholar]
- 41.Yabroff KR, Lund J, Kepka D, et al. Economic burden of cancer in the United States: Estimates, projections, and future research. Cancer Epidemiol Biomarkers Prev. 2011;20:2006–2014. doi: 10.1158/1055-9965.EPI-11-0650. [DOI] [PMC free article] [PubMed] [Google Scholar]
- 42.Ramsey S, Blough D, Kirchhoff A, et al. Washington State cancer patients found to be at greater risk for bankruptcy than people without a cancer diagnosis. Health Aff (Millwood) 2013;32:1143–1152. doi: 10.1377/hlthaff.2012.1263. [DOI] [PMC free article] [PubMed] [Google Scholar]
- 43.The Henry J. Kaisure Family Foundation, Kaiser Commission on Medicaid and the Uninsured: Medicaid's role for black Americans. http://kaiserfamilyfoundation.files.wordpress.com/2013/01/8188.pdf.
- 44.United States Bureau of Labor Statistics. Unemployment rates by race and ethnicity, 2010. http://www.bls.gov/opub/ted/2011/ted_20111005.htm.
- 45.Chirikos TN, Roetzheim RG, McCarthy EP, et al. Cost disparities in lung cancer treatment by disability status, sex, and race. Disabil Health J. 2008;1:108–115. doi: 10.1016/j.dhjo.2008.01.004. [DOI] [PMC free article] [PubMed] [Google Scholar]
- 46.Jayadevappa R, Malkowicz SB, Chhatre S, et al. Racial and ethnic variation in health resource use and cost for prostate cancer. BJU Int. 2010;106:801–808. doi: 10.1111/j.1464-410X.2010.09227.x. [DOI] [PubMed] [Google Scholar]
- 47.Pisu M, Azuero A, Meneses K, et al. Out of pocket cost comparison between Caucasian and minority breast cancer survivors in the Breast Cancer Education Intervention (BCEI) Breast Cancer Res Treat. 2011;127:521–529. doi: 10.1007/s10549-010-1225-0. [DOI] [PMC free article] [PubMed] [Google Scholar]
- 48.Weaver KE, Rowland JH, Bellizzi KM, et al. Forgoing medical care because of cost: Assessing disparities in healthcare access among cancer survivors living in the United States. Cancer. 2010;116:3493–3504. doi: 10.1002/cncr.25209. [DOI] [PMC free article] [PubMed] [Google Scholar]
- 49.Schrag D. The price tag on progress–chemotherapy for colorectal cancer. N Engl J Med. 2004;351:317–319. doi: 10.1056/NEJMp048143. [DOI] [PubMed] [Google Scholar]
- 50.Mayer RJ. Should capecitabine replace infusional fluorouracil and leucovorin when combined with oxaliplatin in metastatic colorectal cancer? J Clin Oncol. 2007;25:4165–4167. doi: 10.1200/JCO.2007.11.6582. [DOI] [PubMed] [Google Scholar]
- 51.Gupta S, Jain P, Gupta S, et al. 5-flourouracil (5FU) shortage: Clinical implications and costs in a single month. J Clin Oncol. 2012;30 abstr 663. [Google Scholar]
- 52.Balogh E, Patlak M, Nass SJ. Delivering Affordable Cancer Care in the 21st Century: Workshop Summary, National Academies Press. 2013 [PubMed] [Google Scholar]
- 53.The Henry J. Kaiser Family Foundation, Kaiser Commission on Medicaid and the Uninsured: Medicaid spending growth and the great recession, 2007-2009. http://kaiserfamilyfoundation.files.wordpress.com/2013/01/8157.pdf.
- 54.Shankaran V, Jolly S, Blough D, et al. Risk factors for financial hardship in patients receiving adjuvant chemotherapy for colon cancer: A population-based exploratory analysis. J Clin Oncol. 2012;30:1608–1614. doi: 10.1200/JCO.2011.37.9511. [DOI] [PubMed] [Google Scholar]
- 55.White A, Liu CC, Xia R, et al. Racial disparities and treatment trends in a large cohort of elderly African Americans and Caucasians with colorectal cancer, 1991 to 2002. Cancer. 2008;113:3400–3409. doi: 10.1002/cncr.23924. [DOI] [PubMed] [Google Scholar]
- 56.Davidoff AJ, Rapp T, Onukwugha E, et al. Trends in disparities in receipt of adjuvant therapy for elderly stage III colon cancer patients: The role of the medical oncologist evaluation. Med Care. 2009;47:1229–1236. doi: 10.1097/MLR.0b013e3181b58a85. [DOI] [PubMed] [Google Scholar]
- 57.Haas JS, Brawarsky P, Iyer A, et al. Association of area sociodemographic characteristics and capacity for treatment with disparities in colorectal cancer care and mortality. Cancer. 2011;117:4267–4276. doi: 10.1002/cncr.26034. [DOI] [PubMed] [Google Scholar]
- 58.Hao Y, Landrine H, Jemal A, et al. Race, neighbourhood characteristics and disparities in chemotherapy for colorectal cancer. J Epidemiol Community Health. 2011;65:211–217. doi: 10.1136/jech.2009.096008. [DOI] [PubMed] [Google Scholar]
- 59.Gross CP, Smith BD, Wolf E, et al. Racial disparities in cancer therapy: Did the gap narrow between 1992 and 2002? Cancer. 2008;112:900–908. doi: 10.1002/cncr.23228. [DOI] [PMC free article] [PubMed] [Google Scholar]
- 60.Zuckerman S, Williams AF, Stockley KE. Trends in Medicaid physician fees, 2003-2008. Health Aff (Millwood) 2009;28:w510–519. doi: 10.1377/hlthaff.28.3.w510. [DOI] [PubMed] [Google Scholar]
- 61.Schoenman J, Feldman J. Bethesda (MD): The Project HOPE Center for Health Affairs; 2002. Results of the Medicare Payment Advisory Commission's 2002 survey of physicians. [Google Scholar]