Abstract
The dramatic decay of dipole geomagnetic field intensity during the last 160 years coincides with changes in Southern Hemisphere (SH) field morphology and has motivated speculation of an impending reversal. Understanding these changes, however, has been limited by the lack of longer-term SH observations. Here we report the first archaeomagnetic curve from southern Africa (ca. 1000–1600 AD). Directions change relatively rapidly at ca. 1300 AD, whereas intensities drop sharply, at a rate greater than modern field changes in southern Africa, and to lower values. We propose that the recurrence of low field strengths reflects core flux expulsion promoted by the unusual core–mantle boundary (CMB) composition and structure beneath southern Africa defined by the African large low shear velocity province (LLSVP). Because the African LLSVP and CMB structure are ancient, this region may have been a steady site for flux expulsion, and triggering of geomagnetic reversals, for millions of years.
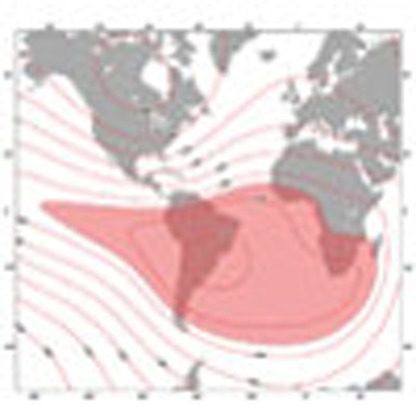 The rapid decay of Earth's dipole magnetic field has recently captured the public imagination. Here, the authors present a southern hemisphere magnetic record from South African Iron Age sites using oriented samples in the floors and suggest that the anomalous field behaviour is not just a recent feature.
The modern decay of the dipole geomagnetic field, best documented with magnetic observatory and satellite data1,2,3,4, coincides with an area of low surface field intensity spanning the southern Atlantic Ocean, Africa and South America. This SH area of low field intensity is so pronounced that it allows the close approach of Earth's radiation belts, creating an ionospheric feature known as the South Atlantic Anomaly (SAA). Hereafter, we use the SAA term to include the low geomagnetic intensity region. Some models call for constant field intensity between 1590 and onset of dipole decay around 1840 (ref. 5), whereas another study suggests an onset at least in the seventeenth century6, but all models are limited by the near lack of SH archaeomagnetic data.
Ritualistic cleansing of villages7,8 by Iron Age agricultural communities of southern Africa involved burning of structures (huts, grain bins and kraals); preserved burnt floors provide opportunities to obtain directional data from oriented samples. A previous investigation of ca. 1200–1250 AD burnt hut and grain bin floors showed that these retain stable, consistent magnetizations9. Here we present a ca. 600-year-long record based on sampling at Baobab (1013–1047 AD), Icon (1317–1415 AD) and Kolope (1507–1585 AD) localities (Supplementary Note 1). The hut floors and grain bins are fired clays, whereas kraals were originally a mixture of cattle dung, grass, clay and wood. Firing reached temperatures of at least 1,000 °C and the upper portion of the kraals, especially along their edges where there was an abundance of wood fuel10, were vitrified into a heterogeneous mixture of grey, green and rare black vesicle-rich glass, which was the focus of sampling.
Results
Magnetic measurements
Magnetic hysteresis data plot mainly in the pseudosingle domain state field (Supplementary Fig. 1). Individual curves are sometimes wasp-waisted, which we interpret as reflecting a mixture of superparamagnetic pigmentary haematite and magnetite. Low field magnetic susceptibility measurements suggest that magnetite is the dominant carrier in most samples; however, haematite and magnetite affected by low-temperature oxidation are probably also present in variable, but minor amounts (Supplementary Fig. 2).
Directional data
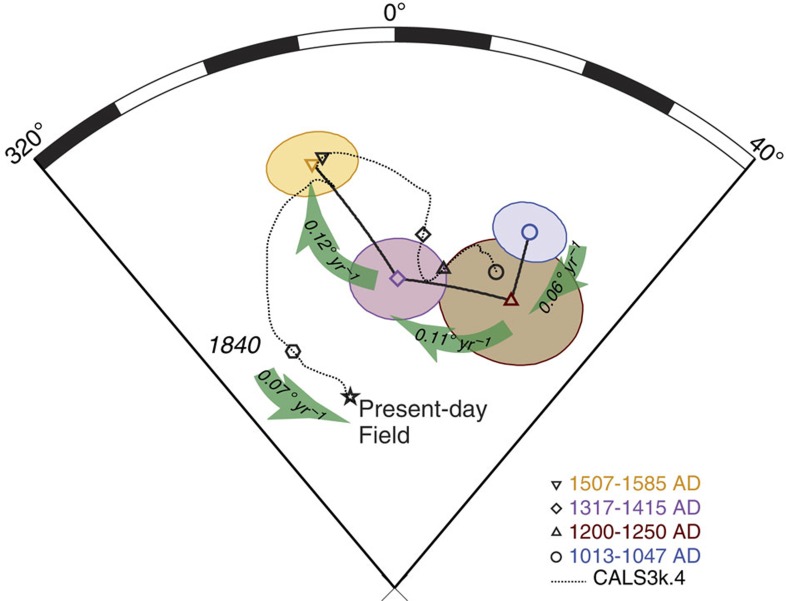
Alternating field and thermal demagnetization data from the burnt structures define linear trajectories towards the origin of orthogonal vector plots (Supplementary Figs 3 and 4). Directions of similar age are well grouped. We average directions from floors for which ages are indistinguishable, and compare these mean directions (Fig. 1, Supplementary Tables 1–5) with predictions from the CALS3k.4 (ref. 11) model that is based on a compilation of results from archaeomagnetic, sediment and lava samples. Considering the dearth of SH archaeomagnetic data in the CALS3k.4 database, broad similarities between the predictions and the new data are notable. In detail, however, rates of directional change differ markedly. Although only four time windows are available, the directional data show some clear trends. The observations show modest changes (0.06° per year ) from 1030 to 1225 AD, followed by a time of rapid change (0.11° to 0.12° per year) from 1225 to ∼1550 AD. For reference, the rate of field change from 1840 to present at our South African sites constrained by historical measurements is about 0.07° per year.
Figure 1. Archaeomagnetic directional data for southern Africa.
Mean directional data (Supplementary Table 1, ref. 9) from burnt floors with 95% confidence intervals. Green arrows highlight rate of change between observations. Model path CALS3k.4 from ref. 11.
Palaeointensity
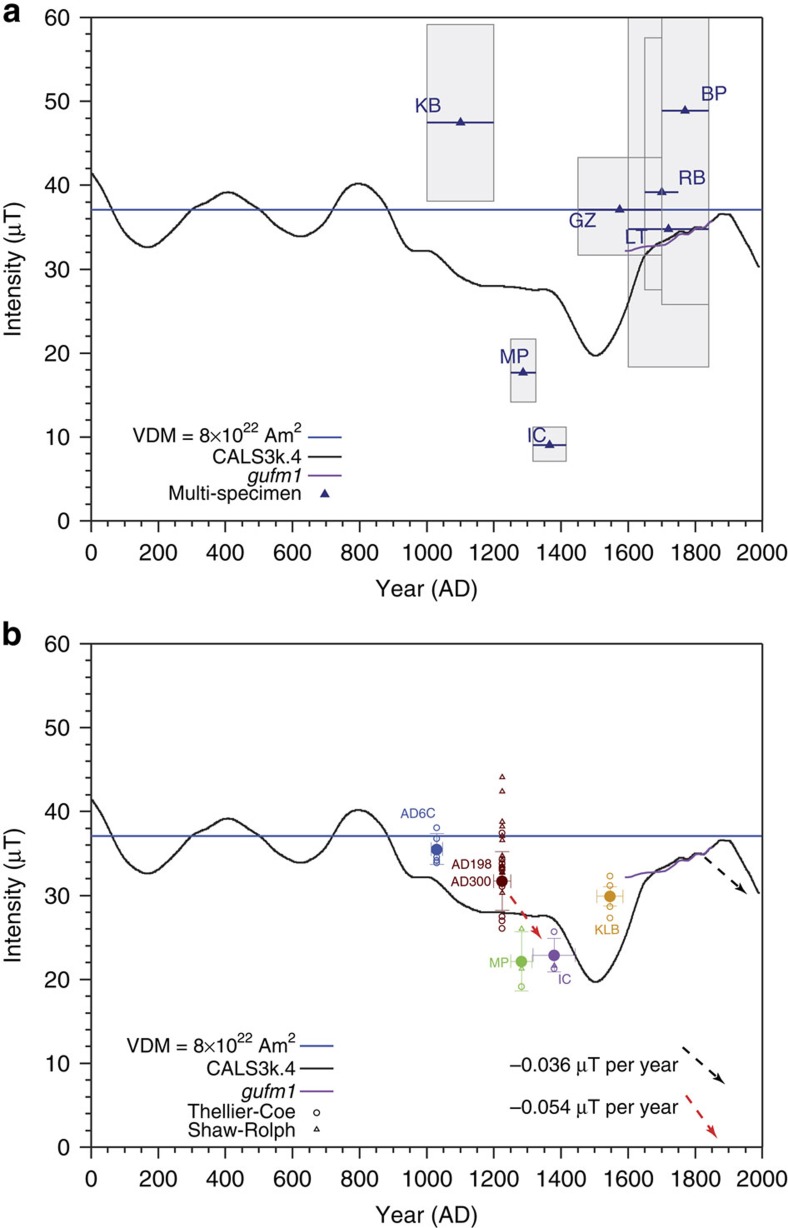
To further investigate the nature of the field, we first consider the coeval record of Iron Age ceramics. We conducted a survey of palaeointensity using the multispecimen technique described in ref. 12. These data (Supplementary Table 6, Supplementary Fig. 5) define a sharp decrease in field strength after 1250 AD. Lowest values in our data are recorded at ca. 1370 AD, and are followed by an increase in field strength thereafter (Fig. 2). Models predict a dip in palaeointensity 100 to 200 years after that seen in the available data. However, the closest Southern Hemisphere (SH) palaeointensity observation used in the model is thousands of kilometres from southern Africa. In general, the models better match predictions in the North Hemisphere; however, they still fail to capture some centennial-scale features13. Overall, the spatial and temporal resolution of the model prediction for southern Africa is crude relative to that of the new data (see Supplementary Methods).
Figure 2. Field strength versus time for southern Africa.
(a) Palaeointensity based on multispecimen technique12 data (Supplementary Table 6) applied to ceramics. Uncertainties are from jack-knife-1 analyses (1σ). (b) Palaeointensity based on Thellier–Coe17 and Shaw18 palaeointensity data meeting selection criteria from ceramics and burnt floors (Supplementary Tables 7 and 8, ref. 9). Palaeointensity means (large circles) shown with 1σ uncertainties. Model prediction CALS3k.4 from ref. 11 and from gufm1 from ref. 15.
The potential for grain size bias has been noted in the multispecimen technique14, and we note that data for the youngest pottery, with ages where field values are constrained by historical data15 (model gufm1 of Fig. 2), appear systematically high. Since the multispecimen technique was proposed12, corrections to account for grain size bias have been proposed14,16, and these hold promise for future investigations of ceramics from southern Africa. However, we feel the true test of the veracity of palaeointensity values remains Thellier-type experiments. Accordingly, we conducted Thellier–Coe17 palaeointensity measurements on Iron Age pottery shards as well as select samples from the burnt structures (Fig. 2, Supplementary Fig. 6). We apply a set of rock magnetic and palaeointensity selection criteria to the data to exclude the affects of in situ and laboratory alteration and multidomain grains (see Methods). The success rate using these criteria for the ceramics is very low (∼3%), mainly because of thermally induced alteration in the laboratory. Therefore, we supplemented the Thellier–Coe analyses with several Shaw18 palaeointensity studies (Supplementary Fig. 7); these yielded results consistent with the Thellier–Coe values. With careful sample selection (see Supplementary Methods), the Thellier–Coe success rate for the burnt floor and kraal glass samples was much higher (∼70%). The successful Thellier–Coe/Shaw results come from five time windows. Overall, the general trend outlined by the low-resolution palaeointensity data is supported, but with lower amplitude (Fig. 2, Supplementary Tables 7 and 8). A conservative estimate, comparing Thellier–Coe data at 1250 AD with that of Icon (IC) ceramics yields −0.054±0.036 μT per year. A rate some three times greater, and greater than peak decay rates seen in models of the field for historical times15 is suggested by a comparison of data at 1250 AD and the less-well resolved Thellier–Coe and Shaw MP results (Fig. 2). These rates are greater than that seen at the site since 1840 (−0.036 μT yr−1), and the field intensity drops to a point lower than that of today.
Discussion
Flux expulsion19 invoked to account for the nature of the recent field3,20 might also explain the recurrence of low field values in southern Africa. We conjecture on how this might work below.
The magnetic induction equation describes the influences of advection and diffusion:
 |
where u is fluid velocity and  is a microphysical magnetic diffusivity for magnetic permeability μ0 and electrical conductivity σ. Assuming that the field gradient is characterized by a macroscopic length scale L, the magnetic Reynolds number RM(L) is given by:
 |
where the numerical scalings are for the outer core21. Because the hydrodynamic Reynolds number Re(L) in the outer core has a value Re(L)≃105RM(L)>>1 (or equivalently, the magnetic Prandtl number PrM≡RM/Re<<1)22 the flows are likely turbulent down to the microphysical viscous velocity scale (we note that there is some question of whether a measurement of compositional stratification implies a reduced level of turbulence in the outer 200 km (ref. 23); however, this issue does not affect our present discussion). The microphysical viscous velocity scale is much smaller than the resistive magnetic dissipation scale for PrM<<1 systems. Under such circumstances with small-scale flow structures, RM(L)>>1 (with L associated with large scales) is not a robust measure of flux freezing because the large gradients associated with smaller-scale structures produce a macroscopic diffusivity that can swiftly cascade or shear magnetic structures to smaller scales l<<L where the RM(l)∼1 and microphysical diffusivity operates. This can greatly reduce the timescale for diffusion relative to that implied by the high magnetic Reynold's number estimated with the outer core macroscopic scale L (refs 20, 22). For PrM<<1 flows, the scale on which RM=1 also delineates the smallest scale of the field since tangling on smaller scales is too slow to compete with dissipation. A local small-scale protrusion in the flow may provide a different path towards RM=1 structures than away from the protrusion and we suggest that this possible difference be further studied for its potential role in linking the flux expulsion site to the effect of the protrusion. Away from the protrusion, small-scale turbulence within the flow can produce randomly oriented or sheared structures with field gradients down to the dissipation scale where RM=1. A local small-scale protrusion may instead redirect the local mean flow towards the CMB where the flow is then again redirected as it is bounded to stay within the CMB. If the deflection scale of the flow near the CMB approaches the scale where RM=1, the flux might leak up through the boundary, separating from the flow. A reversed polarity patch beneath South Africa2,20 might be associated with such a region of core flow.
The core flow could be deflected by differences in core–mantle boundary (CMB) topography, conductivity or heat flow24,25; we focus here on the topography effects to isolate how an identified feature could affect the core flow even in the absence of microphysical transport coefficient gradients. Ultimately, understanding the interplay between these different effects would be desirable.
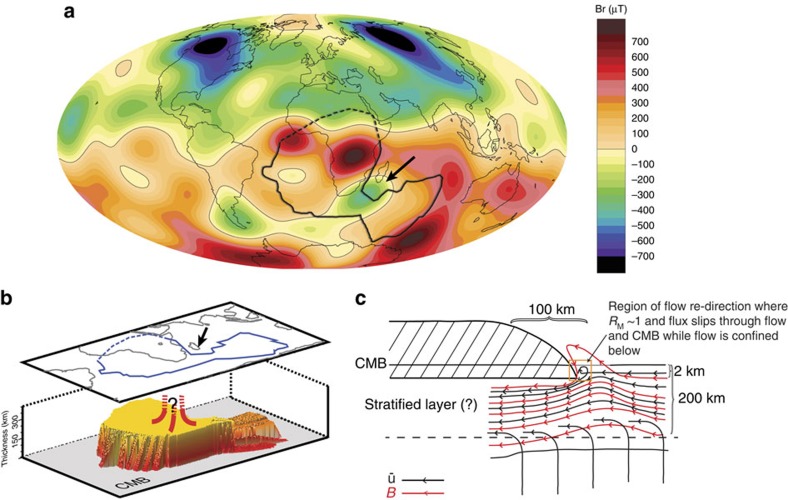
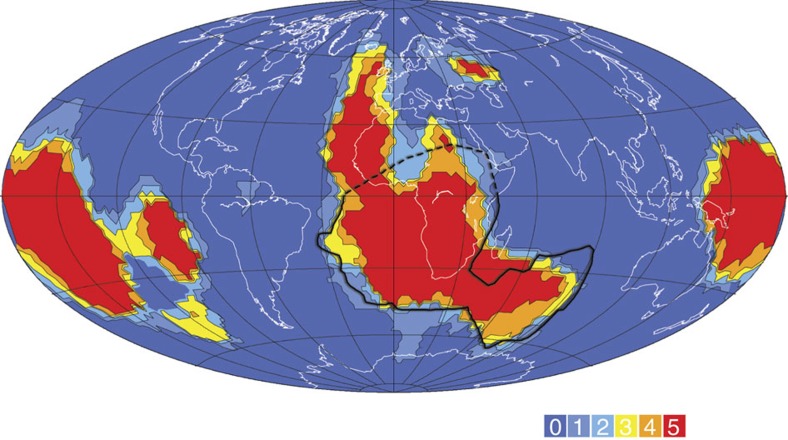
The CMB beneath South Africa today is characterized by a low seismic wave anomaly26,27,28,29 called the African large low shear velocity province (LLSVP)30 (Fig. 3), which is a robust feature of different tomographic models31,32,33,34,35,36 (Fig. 4). There also appears to be a growing consensus that the African LLSVP is bounded by unusual steep sides26,27,28,29,37,38. Here we note that the steep-sided border of the anomaly falls close to the prominent reversed flux patch beneath South Africa that has been linked to the SAA (arrow, Fig. 3). The sharp structural gradients that the core flow encounters can be expected to stimulate the formation of small-scale structures (or vortices) in the flow. We propose that core flow into the region near the LLSVP will develop an upward component on such small scales and that RM is sufficiently reduced to allow reversed polarity flux bundles to leak upward.
Figure 3. Possible scenario for flux expulsion.
Edges of the African LLSVP are envisioned as sites of flux expulsion. (a) Radial component of the geomagnetic field at the core–mantle for 1980 (ref. 11) shown with sharp edges of the African LLSVP27,28 (black outline). Northern boundary of the LLSVP (dashed) is uncertain in these models27,28. Arrow highlights region of reversed flux at the CMB. (b) Edges of African LLSVP at CMB from ref. 27. Note arrow for comparison with a. (c) Schematic model of the beginning stages of flux expulsion at steep edge of African LLSVP. Basal 300 km of LLSVP shown (diagonal stripes).
Figure 4. Vote map of cluster analysis of shear wave profiles.
(1,000–2,800 km depth). Map from ref. 31 shown with the edge of African LLSVP at CMB from refs 27, 28. The cluster analyses evaluate five global tomographic models32,33,34,35,36, with the colour-coded voting map representing the number of models, which assign a lower than average shear wave velocity to the pixel. The average spacing of the pixels is 4°. The voting map highlights the consistency between the global models in defining the African LLSVP, as well as the similar, but more spatially complex, Pacific LLSVP. Because of the inherent averaging in the cluster analyses, the voting map should not be used to comment on the sharpness of the African anomaly, which is better constrained by regional dense data coverage such as that used in refs 27, 28.
Seismic studies suggest a limit to core–side topography39 of lv∼±2 km, which we use to approximate the vertical extent to which the LLSVP structure penetrates the core from above. The core–side topographic change associated with the LLSVP occurs on a horizontal scale27,28 of ls∼50–100 km (Fig. 3). Because of the low slope (1–2°), this topography can be thought of as a change in CMB core–side roughness. In the extreme limit that lv replaces L in equation (1) and the magnitude of u is kept constant, then RM(lv) from equation (1) is ∼0.3. If instead we use a geometric mean of these two small scales (lslv)1/2∼104 m for L, then RM∼3.2. In short, if the scales of the LLSVP could drive RM=l towards unity in this region, they might provide a path for flux expulsion distinct from elsewhere in the outer core.
The associated flux bundle expulsion might lead to pairs of reversed and normal core patches. The summation and upward continuation of field from the reversed patches results in the SAA in our conceptual model. A map of the 1980 field shows a prominent pair beneath southern Africa, coinciding with an embayment in the African LLSVP (Fig. 3). Another reversed patch, beneath the southern tip of South America, lacks a nearby normal flux counterpart. Evolution of the field since ∼1700 in models incorporating historical data11,40 suggests that the southern South American reversed patch might have originated near the western boundary of the African LLSVP, and subsequently was advected westward. A persistent normal flux patch occurs beneath equatorial Africa near the western boundary of the African LLSVP. This may be the counterpart to the southern South American reversed patch, but origin from a bottom-up process related to inner core growth is also possible41. More detailed theoretical and numerical investigations of flux loss into the CMB are needed.
The recurrence of anomalously rapid field decay in the region over an ∼700-year-old timespan implies a dynamic process of flux diffusion, reconnection and advection. While the temporal evolution of escaping flux bundles warrants a detailed study, we do note that the 700-year timescale is within a factor of 2–3 of the turnover (destruction) time for a typical energy-containing eddy  , using21 the characteristic outer core thickness for the eddy size L and typical core velocity. If the field from the core is anchored within a turbulent eddy it would not be unreasonable for the flux bundle evolution to exhibit some temporal signature of the large-scale eddy turnover time. This could be tested by longer archaeomagnetic records from the SAA region, further addressing the SH gap in data (Supplementary Fig. 8). Efforts to map the present day magnetic field at higher resolution (for example, the Swarm mission) might also detect nascent flux expulsion along the African LLSVP edges, if the LLSVP edges are influential in flux explusion.
Cox first suggested flux expulsion as a reversal mechanism42, and numerical simulations of the dynamo43 suggest that reversals commence with the rapid growth of reversed polarity patches. An often unstated assumption is that reversals initiate at random locations. In contrast, we suggest that a statistically larger number of reversed polarity fluxes might occur along the sharp and steep African LLSVP boundaries. The Pacific LLSVP (Fig. 4) shares many common characteristics with the African anomaly38; however, overall the structure appears more complex44, composed of distinct regions with both shallow and steep boundaries45,46. Nevertheless, portions of the Pacific LLSVP might also represent areas of preferred flux expulsion.
The distinct African LLSVP is thought to be >>100 million years old29; its steep sides may be more variable, but, given typical lower mantle flow velocity of 1 cm per year for mantle viscosity47, contrasts between 10 and 100, today's geometry should have been relatively unchanged for 1–10 m.y. Therefore, core flow in the southern African region can be thought of as a steady site for flux bundle expulsion. Moreover, if flux from stochastically produced diffusing patches along the African LLSVP margins reconnect, a supercell of reversed polarity flux could form, triggering global field reversal.
Methods
Directional data
Directional data were collected using 1-cc cubes and stepwise alternating and thermal demagnetization methods. Remanence was measured using a 2G Enterprises three-component DC SQUID magnetometer with high-resolution sensing coils in the magnetically shielded room at the University of Rochester (<200 nT ambient field).
Palaeointensity data
Multispecimen palaeointensity data were collected by heating samples to 300 °C (a temperature deemed optimal on the basis of susceptibility versus temperature curves) in quartz tubes. For ceramic samples, Thellier–Coe palaeointensity data were collected with the field applied in a direction parallel to the surface of the shard using either a 40 or 60 μT field in air or Argon. Palaeointensity on bulk floor samples was collected on 1-cc samples in air with an applied field of 30 μT. Palaeointensity data on kraal glass were collected on unoriented samples (∼2 × 2 × 3 mm) in air with an applied field of 30 μT. Heating of 1-cc samples in an ASC thermal demagnetizing oven was typically 30–40 min at each Thelier–Coe temperature step, cooling over 20–30 min. Kraal glass samples were heated for Thellier–Coe experiments with a CO2 laser over 3 min, and cooled over 3–5 min.
Palaeointensity selection criteria
We applied the following palaeointensity selection criteria: (1) after removal of any viscous magnetization, a principal component of magnetization trending to the origin of an orthogonal vector plot must be defined; (2) demagnetization behaviour must be consistent (median angular deviation of the principal component <5°); (3) the thermoremanent magnetization/natural remanent magnetization plot must be linear (R2>0.9); (4) partial thermoremanent magnetization checks must be within 9%; (5) Shaw plot with Rolph corrections must be linear without outliers. TRM anisotropy tests were conducted and are provided as Supplementary Information.
Additional information
How to cite this article: Tarduno, J. A. et al. Antiquity of the South Atlantic Anomaly and evidence for top-down control on the geodynamo. Nat. Commun. 6:7865 doi: 10.1038/ncomms8865 (2015).
Supplementary Material
Supplementary Figures 1-8, Supplementary Tables 1-8, Supplementary Note 1, Supplementary Methods and Supplementary References
Acknowledgments
We thank Julia Voronov for help in the field. Lianxing Wen graciously provided materials used in portions of Figs 3 and 4, and provided helpful discussions. Cathy Constable provided an animation of CALS3k.4 used in Fig. 3. We thank Vedra Levic for access to the cluster analysis used in Fig. 4. This work was supported by NSF Grant EAR-0838185 to J.A.T. and South African National Research Foundation Grant No. 65780 to T.N.H. E.G.B. acknowledges partial support from the Simons Foundation and the IBM-Einstein fellowship fund at the IAS. Excavations were performed under permits from the South African Heritage Resources Agency to T.N.H.
Footnotes
Author contributions The research was designed and field work undertaken by J.A.T., T.N.H. and M.K.W. Magnetic measurements were conducted by A.W., C.A.S., C.L.W. and R.D.C., data analysed by R.D.C. and J.A.T. J.A.T. and E.G.B. devised the magnetic field/reversal scenario. J.A.T. wrote the manuscript with contributions from all the co-authors.
References
- Liu L. & Olson P. Geomagnetic dipole moment collapse by convective mixing in the core. Geophys. Res. Lett. 36, L10305 (2009). [Google Scholar]
- Hulot G., Eymin C., Langlais B., Mandea M. & Olsen N. Small-scale structure of the geodynamo inferred from Oersted Magsat satellite data. Nature 416, 620–623 (2002). [DOI] [PubMed] [Google Scholar]
- Olson P. & Amit H. Changes in Earth's dipole. Naturwissenschaften 913, 519–542 (2006). [DOI] [PubMed] [Google Scholar]
- Leaton B. R. & Malin S. R. C. Recent changes in the magnetic dipole moment of the earth. Nature 213, 1110 (1967). [Google Scholar]
- Gubbins D., Jones A. L. & Finlay C. C. Fall in Earth's magnetic field is erratic. Science 312, 900–902 (2006). [DOI] [PubMed] [Google Scholar]
- Suttie N., Holme R., Hill M. J. & Shaw J. Consistent treatment of errors in archaeointensity implies rapid decay of the dipole prior to 1840. Earth Planet Sci. Lett. 304, 13–21 (2011). [Google Scholar]
- Huffman T. Handbook to the Iron Age, The Archeology of Pre-Colonial Farming Societies in Southern Africa University of KwaZulu-Natel Press 504 (2007). [Google Scholar]
- Huffman T. H. A cultural proxy for drought: ritual burning in the Iron age of Southern Africa. J. Archaeol. Sci. 36, 991–1005 (2009). [Google Scholar]
- Neukirch L. P. et al. An archeomagnetic analysis of burnt grain bin floors from ca. 1200 to 1250 AD Iron-Age South Africa. Phys. Earth Planet. In. 190-191, 71–79 (2012). [Google Scholar]
- Huffman T. N., Elburg M. & Watkeys M. Vitrified cattle dung in the Iron Age of southern Africa. J. Archaeol. Sci. 40, 3553–3560 (2013). [Google Scholar]
- Korte M. & Constable C. Improving geomagnetic field reconstructions for 0-3 ka. Phys. Earth Planet Int. 188, 247–259 (2011). [Google Scholar]
- Dekkers M. J. & Böhnel H. N. Reliable absolute palaeointensities independent of magnetic domain state. Earth Planet. Sci. Lett. 248, 508–517 (2006). [Google Scholar]
- de Groot L. V., Biggin A. J., Dekkers M. J., Langereis C. G. & Herrero-Bervera E. Rapid regional perturbations to the recent global geomagnetic decay revealed by a new Hawaiian record. Nat. Commun. 4, 2727 (2013). [DOI] [PMC free article] [PubMed] [Google Scholar]
- Fabian K. & Leonhardt R. Multiple-specimen absolute paleointensity determination: An optimal protocol including pTRM normalization, domain-state correction, and alteration test. Earth Planet Sci. Lett. 297, 84–94 (2010). [Google Scholar]
- Jackson A., Jonkers A. R. T. & Walker M. R. Four centuries of geomagnetic secular variation from historical records. Phil. Trans. R Soc. Lond. A 358, 957–990 (2000). [Google Scholar]
- de Groot L. V., Dekkers M. J. & Mullender T. A. T. Exploring the potential of acquisition curves of the anhysteretic remanent magnetization as a tool to detect subtle magnetic alteration induced by heating. Phys. Earth Planet In. 194-195, 71Ð84 (2012). [Google Scholar]
- Coe R. S. The determination of paleointensities of the earths magnetic field with emphasis on mech- anisms which could cause non-ideal behaviour in Thelliers' method. J. Geomag. Geoelectr. 19, 157–179 (1967). [Google Scholar]
- Shaw J. A new method of determining the magnitude of the palaeomagnetic field: application to five historic lavas and five archaeological samples. Geophys. J. Int. 39, 133–141 (1974). [Google Scholar]
- Weiss N. O. The expulsion of magnetic flux by eddies. Proc. R Soc. A 293, 310–328 (1966). [Google Scholar]
- Bloxham J. The expulsion of magnetic-flux from the Earth's core. Geophys. J. R. Astron. Soc. 87, 669–678 (1986). [Google Scholar]
- Olson P. Laboratory experiments on the dynamics of the core. Phys. Earth Planet. Inter 187, 1–18 (2011). [Google Scholar]
- Blackman E. G. & Field G. B. Dimensionless measures of turbulent magnetohydrodynamic dissipation rates. Mon. Not. R Astron. Soc. 386, 1481–1486 (2008). [Google Scholar]
- Helffrich G. & Kaneshima S. Causes and consequences of outer core stratification. Phys. Earth Planet Inter 223, 2–7 (2013). [Google Scholar]
- Buffett B. A. Effects of a heterogeneous mantle on the velocity and magnetic fields at the top of the core. Geophys. J. Int. 125, 303–317 (1996). [Google Scholar]
- Calkins M. A., Noir J., Eldredge J. D. & Aurnou J. M. The effects of boundary topography on con- vection in Earth's core. Geophys. J. Int. 189, 799–814 (2012). [Google Scholar]
- Wen L., Silver P., James D. & Kuehnel R. Seismic evidence for a thermo-chemical boundary layer at the base of the Earth's mantle. Earth Planet Sci. Lett. 189, 141–153 (2001). [Google Scholar]
- Wang Y. & Wen L. Mapping the geometry and geographic distribution of a very low velocity province at the base of the Earth's mantle. J. Geophys. Res. 109, B10305 (2004). [Google Scholar]
- Wang Y. & Wen L. Geometry and P and S velocity structure of the ‘African Anomaly'. J. Geophys. Res. 112, B05313 (2007). [Google Scholar]
- Ni S. D. & Helmberger D. V. Seismological constraints on the South African superplume; could be the oldest distinct structure on Earth. Earth Planet Sci. Lett. 206, 119–131 (2003). [Google Scholar]
- Garnero E. J. & McNamara A. K. Structure and dynamics of Earth's lower mantle. Science 320, 626–628 (2008). [DOI] [PubMed] [Google Scholar]
- Lekic V., Cottaar S., Dziewonski A. & Romanowicz B. Cluster analysis of global lower mantle tomography: A new class of structure and implications for chemical heterogeneity. Earth Planet Sci. Lett. 357-358, 68–77 (2012). [Google Scholar]
- Mégnin C. & Romanowicz B. The three-dimensional shear velocity structure of the mantle from the inversion of body, surface and higher-mode waveforms. Geophys. J. Int. 143, 709–728 (2000). [Google Scholar]
- Houser C., Masters G., Shearer P. & Laske G. Shear and compressional velocity models of the mantle from cluster analysis of long-period waveforms. Geophys. J. Int. 174, 195–212 (2008). [Google Scholar]
- Kustowski B., Ekstrom G. & Dziewonski A. M. Anisotropic shear-wave velocity structure of the Earth's mantle: a global model. J. Geophys. Res. 113, B06306 (2008). [Google Scholar]
- Simmons N. A., Forte A., Boschi L. & Grand S. GyPSuM: a joint tomographic model of mantle density and seismic wave speeds. J. Geophys. Res. 115, B12310 (2010). [Google Scholar]
- Ritsema J., Deuss A., van Heijst H. J. & Woodhouse J. H. S40RTS: a degree-40 shear-velocity model for the mantle from new Rayleigh wave dispersion, teleseismic travel time and normal-mode splitting function measurements. Geophys. J. Int. 184, 1223–1236 (2011). [Google Scholar]
- Ni S., Tan E., Gurnis M. & Helmberger D. Sharp sides to the African superplume. Science 296, 1850–1852 (2002). [DOI] [PubMed] [Google Scholar]
- Lay T. & Garnero E. J. Deep mantle seismic modeling and imaging. Annu. Rev. Earth Planet Sci. 39, 91–123 (2011). [Google Scholar]
- Tanaka S. Constraints on the core-mantle boundary topography from P4KP-PcP differential travel times. J. Geophys. Res. 115, B04310 (2010). [Google Scholar]
- Finlay C. C. & Jackson A. Equatorially dominated magnetic field change at the surface of Earth's core. Science 300, 2084–2086 (2003). [DOI] [PubMed] [Google Scholar]
- Aubert J., Finlay C. C. & Fournier A. Bottom-up control of geomagnetic secular variation by the Earth's inner core. Nature 502, 219–223 (2013). [DOI] [PubMed] [Google Scholar]
- Cox A. The frequency of geomagnetic reversals and the symmetry of the nondipole field. Rev. Geophys. Space Phys. 13, 35–51 (1975). [Google Scholar]
- Glatzmaier G. A. & Roberts P. H. A 3-dimensional self-consistent computer simulation of a geomagnetic field reversal. Nature 377, 203–209 (1995). [Google Scholar]
- Thorne M. S., Garnero E. J., Jahnke G., Igel H. & McNamara A. K. Mega ultra low velocity zone and mantle flow. Earth Planet Sci. Lett. 364, 59–67 (2013). [Google Scholar]
- To A., Romanowicz B., Capdeville Y. & Takeuchi N. 3D effects of sharp boundaries at the borders of the African and Pacific superplumes: Observations and modeling. Earth Planet Sci. Lett. 233, 137–153 (2005). [Google Scholar]
- He Y. & Wen L. Geographic boundary of the “Pacific Anomaly” and its geometry and transitional structure in the north. J. Geophys. Res. 117, B09308 (2012). [Google Scholar]
- Hager B. H. Subducted slabs and the geoid- Constraints on mantle rheology and flow. J. Geophys. Res. 89, 6003–6015 (1984). [Google Scholar]
Associated Data
This section collects any data citations, data availability statements, or supplementary materials included in this article.
Supplementary Materials
Supplementary Figures 1-8, Supplementary Tables 1-8, Supplementary Note 1, Supplementary Methods and Supplementary References


