

Abstract
Using an Illumina exome sequencing dataset generated from pediatric Acute Myeloid Leukemia patients (AML; type FLT3/ITD+) a comprehensive bioinformatics pipeline was developed to aid in a better clinical understanding of the genetic data associated with the clinical phenotype. The pipeline starts with raw next generation sequencing reads and using both publicly available resources and custom scripts, analyzes the genomic data for variants associated with pediatric AML. By incorporating functional information such as Gene Ontology annotation and protein-protein interactions, the methodology prioritizes genomic variants and returns disease specific results and knowledge maps. Furthermore, it compares the somatic mutations at diagnosis with the somatic mutations at relapse and outputs variants and functional annotations that are specific for the relapse state.
Introduction
Acute myeloid leukemia (AML) is a complex disease characterized by dysregulation of signal transduction pathways in hematopoietic progenitors that ultimately results in the increase of proliferation and survival of leukemic cells(1). AML is considered a disease of the genome as many genetic alterations are required for onset. Genomic variants for AML are often described as either Type I mutations, which alter cell proliferation, or Type II mutations, which alter cell survival pathways(2).
Pediatric AML is a rare disease with only ~500 children a year diagnosed (stjude.org) and prognosis has improved over the decades(3). However, relapse is a major concern and accounts for more than half of the deaths in pediatric leukemia cases(1)(3). Common mutations associated with AML are found in several genes including FLT3, NPM1, CEBPA, RAS, c-KIT, and WT1. Furthermore, co-occurring mutations such as an internal tandem duplication (ITD) in the FLT3 gene accompanied by mutations in WT1, have been associated with poor outcome (4). The FLT3/ITD is an in-frame insertion in exon 14 or 15 that changes the amino acid sequence in the juxtamembrane domain, leading to ligand-independent FLT3 activation (5). In the clinical setting FLT3 / ITD is detected through a PCR based assay, and additional testing is required to further analyze the sample for other potential genomic mutations.
Recent advancements in DNA sequencing technology have aided in our ability to detect numerous genetic alterations from a single genomic sample. These advancements can aid in personalized medicine by revealing the genomic architecture of a specific patient. However, applying NGS in the medical field requires knowledgeable personnel and significant computer infrastructure and algorithms specific for handling the large datasets. This study retrospectively analyzes FLT3/ITD positive samples, diagnosis, remission, and relapse, with the goal of developing a bioinformatics pipeline capable of detecting the FLT3/ITD, along with other genetic alterations, which collectively can aid in a better understanding of biological processes dysregulated in the relapse state of pediatric AML. The goal of the bioinformatics pipeline is to provide an enhanced output that allows a clinician to better understand the pathways and biological processes affected by the detected genetic alterations.
Starting with raw NGS sequencing reads, bioinformatics pipelines were created for analyzing exon-captured Illumina data. The pipeline combines publicly available algorithms and custom scripts to detect and prioritize genomic variants. Six FLT3/ITD positive pediatric AML samples, with varying FLT3/ITD allelic ratios, were analyzed using the developed methodologies. A thorough analysis between the diagnosis and relapse sample was conducted for each patient, revealing several relapse specific mutations. Our pipeline detected different types of genetic alterations, i.e. large insertions and single nucleotide polymorphisms (SNP), helping to establish NGS as a feasible methodology in the clinical setting. The pipeline is being designed with the flexibility to integrate other genomic detection algorithms in the future, such as copy number variation.
Methods
Illumina paired-end exon-sequencing data generated from bone marrow samples was received from the Children’s Oncology Group. The quality of the sequence reads was examined using fastqc (Babraham Institute) and cutadapt (https://code.google.com/p/cutadapt/) was used to trim low quality bases. The trimmed NGS reads were aligned to the human reference genome (hg19) using bwa-mem (version bwa-0.7.4) (6). Average depth of coverage per exon (vertical) and average exon coverage (horizontal) were calculated using a custom script and Ensembl annotation files. Following the best practices described by the Genome Analysis Tool Kit (GATK) developers (7), alignment files were processed using Picard Tools Version 1.67 (http://picard.sourceforge.net/).
Mutect (Version 1.1.4) and Shimmer (Version 5.8.8) were executed for SNP detection, and to aid in the validation of the pipeline the results were compared to verified variants provided by the Children Oncology Group. Variant call files (VCF version 4.1) were annotated with SnpEff Version 3.3a using the package GRCh37.75 annotation recommended by SnpEff(4). Using SnpEff annotated transcript ID, variants in the VCFs were mapped to UniProt Accession Numbers and Gene Ontology information using a custom script. Protein-protein interactions for the protein coding genes were determined using the STRING API (9), a database of known and predicted protein interactions derived from: genomic context, high-throughput experiments, co-expression, and previous knowledge.
Pindel algorithm was executed on the alignment files for detection of FLT3/ITD (10). The output files were converted to vcf files using the pindel2vcf script provided with the Pindel package. Only insertions located in exon 14 or 15 in the FLT3 gene were analyzed as potential ITDs. All computational work was performed at the University of Delaware on the BioHen high performance computing cluster.
Results and Discussion
Six FLT3/ITD positive samples, with varying allelic ratios and cytogenetic markers were analyzed with a custom pipeline (Figure 1). The pipeline consisted of publicly available algorithms, such as bwa and GATK, plus custom scripts. A key aspect of the established methodologies is the modularization of algorithms and scripts, which creates an environment that allows for the dynamic integration with up-dated algorithms and databases.
Figure 1.
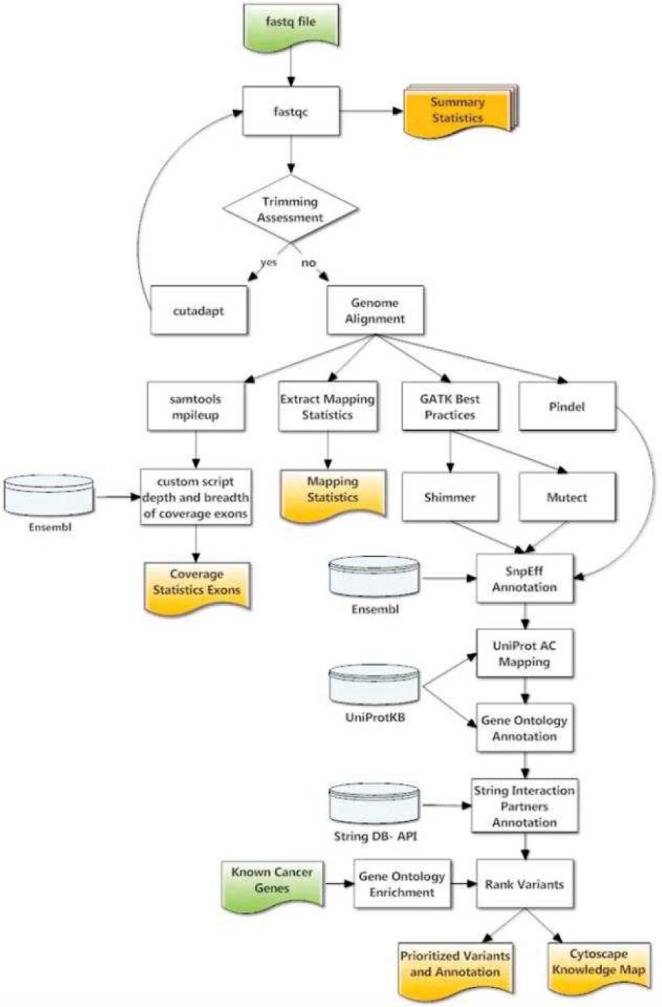
Bioinformatics workflow
Genomic Detection FLT3/ITD
Detecting large insertions, deletions, and tandem duplications from NGS is a challenging task with only a few high quality algorithms publicly available. Recently, Spencer et al. (11) compared several algorithms for the detection of FLT3/ITD and published that Pindel (10), a pattern growth approach, successfully identified FLT3 / ITD. The Pindel algorithm was incorporated into the pipeline for the detection of an insert in exon 14 or 15 in the FLT3 gene that was consistent with the clinical FLT3/ITD (Table 1). For the 6 patients analyzed, 3 samples per patient, Pindel detected an insert in 5 of the 6 patient’s diagnosis sample (83%). The Spencer et al. study reported 100% detection of the FLT3 / ITD in the samples analyzed in their study using a targeted NGS approach (27 genes). For the study presented whole exon-sequencing was used and therefore the coverage in the region of interest was much lower, perhaps decreasing the ability to detect the ITD. Pindel also detected an insert in 4 of the relapse samples and 1 of the remission samples. A benefit to using Pindel is that it provides a better resolution of the genomic abnormality by providing a genomic position, sequence, and length of the insert, which are not all available with the PCR electrophoresis assay. Future work for this portion of the pipeline will include an allelic ratio calculation for the FLT3/ITD. This is a difficult task as purity of the cell population sequenced is difficult to determine.
Table 1.
Summary of Pindel Results
| ID | Sample | Position | Sequence | Length |
|---|---|---|---|---|
| Patient 1 | Diagnosis | – | None Detected | – |
| Relapse | – | None Detected | – | |
| Remission | – | None Detected | – | |
| Patient 2 | Diagnosis | 28,608,235 | TCTTGGAAACTCCCATTTGAGATCATATTCA | 31 |
| Relapse | – | None Detected | – | |
| Remission | – | None Detected | – | |
| Patient 3 | Diagnosis | 28,608,249 | ATTTGAGATCATATTCATATTCTCTGAAATCAACGTAGCC | 40 |
| Relapse | 28,608,265 | ATATTCTCTGAAATCTCCACGGGGG | 25 | |
| Remission | – | None Detected | – | |
| Patient 4 | Diagnosis | 28,608,214 | CTTACCAAACTCTAAATTTTCTCTTGGAAACTCCC | 37 |
| Relapse | 28,608,214 | ATCTTACCAAACTCTAAATTTTCTCTTGGAAACTCCCAT | 37 | |
| Remission | – | None Detected | – | |
| Patient 5 | Diagnosis | 28,608,223 | CTCTAAATTTTCTCTTGGAAACTCCCATTTGAGATCATATTCATATTCTCTGAAATCAACGTAGAAGTACTCATTA | 76 |
| Relapse | 28,608,223 | CTCTAAATTTTCTCTTGGAAACTCCCATTTGAGATCATATTCATATTCTCTGAAATCAACGTAGAAGTACTCATTA | 76 | |
| Remission | 28,608,223 | CTCTAAATTTTCTCTTGGAAACTCCCATTTGAGATCATATTCATATTCTCTGAAATCAACGTAGAAGTACTCATTA | 76 | |
| Patient 6 | Diagnosis | 28,608,243 | ACTCCCATTTGAGATCATATTCATATTCTCTGAAATCAACGTAGAAGTACTCATTATCTGAGGAGCCGGTCAC | 73 |
| Relapse | 28,608,243 | ACTCCCATTTGAGATCATATTCATATTCTCTGAAATCAACGTAGAAGTACTCATTATCTGAGGAGCCGGTCAC | 73 | |
| Remission | – | None Detected | – |
Genomic Detection Somatic SNPs and InDels
The pipeline is composed of 3 genomic variant detection algorithms, Pindel, Mutect, and Shimmer, that collectively report single nucleotide polymorphisms (SNP), small insertions and deletions (InDel), and large InDels. When analyzing cancer samples it is important to distinguish, and prioritize, somatic SNPs versus germline SNPs. To aid with validating the pipeline, the somatic SNPs detected were fist compared to the list of verified variants provided by COG (Figure 2). Mutect detected 100% of the verified variants in eight of the twelve samples (diagnosis and relapse), with an average of 93% detection of verified variants. Shimmer detected 100% of the verified variants in five of the twelve samples, with an average of 78% detection of verified variants.
Figure 2.
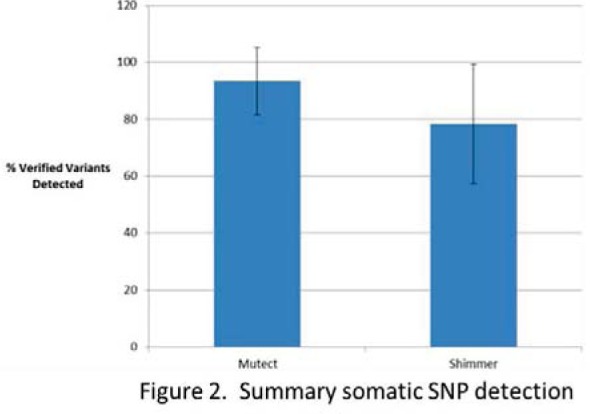
Summary somatic SNP detection
The pipeline also detected high quality somatic SNPS that were not reported to COG. Table 2 summarizes the number of somatic SNPs detected in each sample. For the majority of the patients the relapse samples had more somatic mutations compared with their matched diagnosis sample. Three of the patients had an extremely high number of somatic mutations in their relapse sample, and are undergoing further analysis to determine the potential driver of these mutations.
Table 2.
Summary ranked somatic SNPs
| ID | Sample | Somatic SNPs | Ranked Variants |
|---|---|---|---|
| Patient 1 | diagnosis | 201 | 50 |
| relapse | 16782 | 9706 | |
| Patient2 | diagnosis | 160 | 47 |
| relapse | 7311 | 1617 | |
| Patient 3 | diagnosis | 177 | 47 |
| relapse | 111 | 42 | |
| Patient 4 | diagnosis | 194 | 71 |
| relapse | 2 | 50 | |
| Patient 5 | diagnosis | 155 | 52 |
| relapse | 200 | 79 | |
| Patient 6 | diagnosis | 153 | 29 |
| relapse | 7177 | 4306 |
Genomic Variant Prioritization
A custom prioritization module was developed to rank the somatic variants, located in protein coding regions of the genome, at the diagnosis state and relapse state using a similar method as described by Hu et al. (12). Five major criteria were used for prioritizing the variants detected: protein-protein interactions, gene ontology, functional consequence, and quality of variant. Using the 27 genes published by Spencer et al., a Gene Ontology (GO) enrichment analysis was done using Bingo, a Cytoscape plug-in. These 27 genes were used because they are cited as genes with known genetic alterations associated with pediatric AML. GO terms that had a significant p-value (<0.05) were extracted, and variants located in a gene annotated with one of the enriched GO terms, were given a positive score. Protein-protein interactions were scored with a similar strategy, with positive scores given to variants located in a gene whose product has a protein-protein interaction with a protein known to be associated with pediatric AML. The goal is to use characteristics of known pediatric AML cancer genes to identify new genes of interest.
Cytoscape Knowledge Maps
A comparison between diagnosis and relapse samples was performed to better understand shifts in the biological processes influenced by genetic alterations between the two time points. A special feature of the pipeline is the automatic generation of a knowledge map consisting of protein-protein interactions and GO terms associations for the genes of interest that can be easily displayed in Cytoscape.
The Cytoscape map displays genes with a highly ranked mutation as red nodes connected to their GO term (green nodes) and other interacting proteins or proteins with a genetic alteration that does not cause a change in amino acid sequence (blue nodes). Figure 2 highlights an example map generated for a Patient’s relapse state, highlighting mutations specific for the relapse state, except for the FLT3/ITD. The pipeline detected and prioritized variants detected in PAK2, PRAMEF1, PRAMEF13, and RHPN2. There were two variants detected in PAK2 (rs76714248, MAF 0.019 and rs67093638) that are predicted to alter the amino acid sequence of the translated protein. PAK2 is a protein kinase involved in several signaling pathways such as apoptosis and proliferation. Two other genes, PRAMEF1 and PRAMEF13, which mapped to GO negative regulation of apoptosis, were also prioritized for this sample. These genes are also annotated with negative regulation of cell differentiation, negative regulation of retinoic acid receptor signaling, positive regulation of cell proliferation, and negative regulation of transcription. The goal of this type of functional output is to help researchers and clinicians make hypothesis regarding the changes from the diagnosis state to the relapse state. For example, this patient gained several mutations in genes involved in apoptosis, cellular differentiation, and retinoic acid signaling that may alter their susceptibility to treatment.
Cancer is a disease of the genome making it a necessity to be able to analyze multiple types of genetic alterations at once. The application of next generation sequencing has the potential to aid in the diagnosis and treatment of cancer as costs for sequencing decline and the magnitude of data increases. A primary limiting factor to clinical applications of genomic NGS is downstream bioinformatics analysis. This paper highlights core algorithms required for analyzing clinical NGS samples and reports new algorithms under development for the prioritization and visualization of somatic mutations detected in clinical NGS samples. Currently, the pipeline is available for in-house use only, but in the future it will be made publicly available. Furthermore, as additional samples are analyzed the pipeline will be broaden to rank and distinguish between driver mutations and clinically actionable mutations.
Figure 2.

Custom Knowledge Map for Patient 1 Relapse Sample
Acknowledgments
This project was partially supported by the Leukemia Research Foundation of Delaware and the Delaware INBRE program, with a grant from the National Institute of General Medical Sciences NIGMS (8 P20 GM103446-13) from the National Institutes of Health. The author appreciates the discussions regarding this project from Chuming Chen, Shawn Polson, and Karen Ross. The author recognizes Karol Miaskiewicz for maintaining the High Performance Cluster (Biohen), and Jennifer Wyffels for proof-reading the manuscript. The author would like to acknowledge Dr. Soheil Meshinchi for his help and guidance with requesting data from the Children’ Oncology Group and his input on data analysis.
References
- 1.Meshinchi S, Arceci RJ. Prognostic factors and risk-based therapy in pediatric acute myeloid leukemia. Oncologist [Internet] 2007 Mar;12(3):341–55. doi: 10.1634/theoncologist.12-3-341. cited 2014 Sep 16. Available from: http://www.ncbi.nlm.nih.gov/pubmed/17405900. [DOI] [PubMed] [Google Scholar]
- 2.Cancer Genomics. Elsevier. 2014 [Google Scholar]
- 3.Gamis AS, Alonzo TA, Perentesis JP, Meshinchi S. Children’s Oncology Group’s 2013 blueprint for research: acute myeloid leukemia. Pediatr Blood Cancer [Internet] 2013 Jun;60(6):964–71. doi: 10.1002/pbc.24432. cited 2015 Jan 8. Available from: http://www.ncbi.nlm.nih.gov/pubmed/23255301. [DOI] [PMC free article] [PubMed] [Google Scholar]
- 4.Summers K, Stevens J, Kakkas I, Smith M, Smith LL, Macdougall F, et al. Wilms’ tumour 1 mutations are associated with FLT3-ITD and failure of standard induction chemotherapy in patients with normal karyotype AML. Leukemia [Internet] 2007 Mar;21(3):550–1. doi: 10.1038/sj.leu.2404514. cited 2014 Sep 22. author reply 552. Available from: http://www.ncbi.nlm.nih.gov/pubmed/17205055. [DOI] [PubMed] [Google Scholar]
- 5.Meshinchi S, Appelbaum FR. Structural and functional alterations of FLT3 in acute myeloid leukemia. Clin Cancer Res [Internet] 2009 Jul 1;15(13):4263–9. doi: 10.1158/1078-0432.CCR-08-1123. cited 2014 Sep 22. Available from: http://www.pubmedcentral.nih.gov/articlerender.fcgi?artid=2716016&tool=pmcentrez&rendertype=abstract. [DOI] [PMC free article] [PubMed] [Google Scholar]
- 6.Li H. Aligning sequence reads, clone sequences and assembly contigs with BWA-MEM. 2013;00(00):1–3. [Google Scholar]
- 7.DePristo MA, Banks E, Poplin R, Garimella KV, Maguire JR, Hartl C, et al. A framework for variation discovery and genotyping using next-generation DNA sequencing data. Nat Genet [Internet] 2011 May;43(5):491–8. doi: 10.1038/ng.806. cited 2014 Mar 21. Available from: http://www.pubmedcentral.nih.gov/articlerender.fcgi?artid=3083463&tool=pmcentrez&rendertype=abstract. [DOI] [PMC free article] [PubMed] [Google Scholar]
- 8.Cingolani P, Platts A, Wang LL, Coon M, Nguyen T, Wang L, et al. A program for annotating and predicting the effects of single nucleotide polymorphisms, SnpEff: SNPs in the genome of Drosophila melanogaster strain w1118; iso-2; iso-3. Fly (Austin) [Internet] 2012;6(2):80–92. doi: 10.4161/fly.19695. cited 2014 Mar 20. Available from: http://www.pubmedcentral.nih.gov/articlerender.fcgi?artid=3679285&tool=pmcentrez&rendertype=abstract. [DOI] [PMC free article] [PubMed] [Google Scholar]
- 9.Jensen U, Kuhn M, Stark M, Chaffron S, Creevey C, Muller J, et al. STRING 8–a global view on proteins and their functional interactions in 630 organisms. Nucleic Acids Res [Internet] 2009 Jan;37(Database):D412–6. doi: 10.1093/nar/gkn760. cited 2014 Mar 28. Available from: http://www.pubmedcentral.nih.gov/articlerender.fcgi?artid=2686466&tool=pmcentrez&rendertype=abstract. [DOI] [PMC free article] [PubMed] [Google Scholar]
- 10.Ye K, Schulz MH, Long Q, Apweiler R, Ning Z. Pindel: a pattern growth approach to detect break points of large deletions and medium sized insertions from paired-end short reads. Bioinformatics [Internet] 2009 Nov 1;25(21):2865–71. doi: 10.1093/bioinformatics/btp394. cited 2014 Jul 14. Available from: http://www.pubmedcentral.nih.gov/articlerender.fcgi?artid=2781750&tool=pmcentrez&rendertype=abstract. [DOI] [PMC free article] [PubMed] [Google Scholar]
- 11.Spencer DH, Abel HJ, Lockwood CM, Payton JE, Szankasi P, Kelley TW, et al. Detection of FLT3 internal tandem duplication in targeted, short-read-length, next-generation sequencing data. J Mol Diagn [Internet] 2013 Jan;15(1):81–93. doi: 10.1016/j.jmoldx.2012.08.001. cited 2014 Sep 22. Available from: http://www.ncbi.nlm.nih.gov/pubmed/23159595. [DOI] [PubMed] [Google Scholar]
- 12.Hu P, Bader G, Wigle DA, Emili A. Computational prediction of cancer-gene function. Nat Rev Cancer [Internet] 2007 Jan;7(1):23–34. doi: 10.1038/nrc2036. cited 2014 Sep 19. Available from: http://www.ncbi.nlm.nih.gov/pubmed/17167517. [DOI] [PubMed] [Google Scholar]