Abstract
The elucidation of the molecular mechanisms underlying the differentiation and proliferation of human adipose tissue-derived stromal cells (hADSCs) represents a critical step in the development of hADSCs-based cellular therapies. To examine the role of the microRNA-103a-3p (miR-103a-3p) in hADSCs functions, miR-103a-3p mimics were transfected into hADSCs in order to overexpress miR-103a-3p. Osteogenic differentiation was induced for 14 days in an osetogenic differentiation medium and assessed by using an Alizarin Red S stain. The regulation of the expression of CDK6 (cyclin-dependent kinase 6), a predicted target of miR-103a-3p, was determined by western blot, real-time PCR and luciferase reporter assays. Overexpression of miR-103a-3p inhibited the proliferation and osteogenic differentiation of hADSCs. In addition, it downregulated protein and mRNA levels of predicted target of miR-103a-3p (CDK6 and DICER1). In contrast, inhibition of miR-103a-3p with 2′O methyl antisense RNA increased the proliferation and osteogenic differentiation of hADSCs. The luciferase reporter activity of the construct containing the miR-103a-3p target site within the CDK6 and DICER1 3′-untranslated regions was lower in miR-103a-3p-transfected hADSCs than in control miRNA-transfected hADSCs. RNA interference-mediated downregulation of CDK6 and DICER1 in hADSCs inhibited their proliferation and osteogenic differentiation. The results of the current study indicate that miR-103a-3p regulates the osteogenic differentiation of hADSCs and proliferation of hADSCs by direct targeting of CDK6 and DICER1 partly. These findings further elucidate the molecular mechanisms governing the differentiation and proliferation of hADSCs.
Introduction
MicroRNAs (miRNAs) are endogenous 19- to 25-nucleotide non-coding RNAs that bind to partially complementary recognition sequences of mRNA, resulting in translational repression or cleavage and degradation of mRNA, thus regulating the expression of mRNA targets.1 Each miRNA can regulate multiple mRNAs and each mRNA can be targeted by a number of miRNAs. Thus, it has been estimated that as many as 30% of protein-coding genes could be targets of miRNAs. miRNAs have been shown to be involved in diverse biological processes including cellular differentiation,2 proliferation,3 apoptosis4 and metabolism.5 miRNAs also have important roles in the self-renewal and pluripotency of stem cells.6, 7 The functions of one particular miRNA, miR-103a, have been investigated in several cancer cell lines. For example, the expression of miR-103 was found to be decreased in papillary thyroid cancer cells,8 but increased in endometrial cancer,9 nasopharyngeal carcinoma,10 pancreatic cancer,11 bladder cancer,12 colorectal cancer4 and lung cancer cells.13 In colorectal cancer cells, miR-103 was found to target a gene that induces apoptosis of cancer cells (PER3),4 and the tumor suppressor genes DICER and PTEN.14 In studies that examined the effects of miR-103 on cellular differentiation and proliferation, silencing of miR-103 decreased total fat by reducing adipocyte size,15 and inhibited proliferation of mouse intestinal cell by targeting the CCNE1, CDK2, and CREB1 genes.16 Bioinformatic studies have predicted a role for miR-103/miR-107 paralogs in lipid and energy metabolism with a prediction that miR-103/107 regulates human metabolic pathways.17
Adipose tissue, like bone marrow, is a mesodermally derived organ with a stromal cell population. This population, termed adipose tissue-derived mesenchymal stem cells or adipose tissue stromal cells (ADSCs), shares many of its characteristics with bone marrow, including extensive proliferative potential and the ability to differentiate toward adipogenic, osteogenic, chondrogenic and myogenic lineages. Elucidating the molecular events involved in adipocyte differentiation is necessary in order to develop trapeutics for metabolic diseases such as obesity and diabetes.18 Toward that end, our laboratory has reported that several miRNAs control proliferation and differentiation of human ADSCs (hADSCs).19, 20, 21
In the current study, we examined the role of miR-103a-3p on the proliferation and osteogenic differentiation of hADSCs. The data in this study suggested that miR-103a-3p inhibited hADSCs proliferation and osteogenic differentiation by binding to specific target sequences in the -CDK6 mRNA 3′-untranslated region (UTR).
Materials and methods
Cell culture
All protocols involving human subjects were approved by the Institutional Review Board of Pusan National University. Superfluous materials were collected from four individuals undergoing elective abdominoplasty after informed consent was given by each individual. We isolated the hADSCs according to the methods which described in previous studies.22 The hADSCs were maintained in α-minimal essential medium (MEM) with 10% fetal bovine serum, 100 μg ml−1 streptomycin and 100 mg ml−1 penicillin in 5% CO2 environment at 37 °C.
Osteogenic differentiation
Osteogenic differentiation was induced through the culturing of the cells for 10 days–2 weeks in osteogenic medium (10% fetal bovine serum, 0.1 mM dexamethasone, 10 mM β-glycerophosphate, and 50 mM ascorbic acid in α-MEM), and extracellular matrix calcification was estimated by using 2% Alizarin Red S with a pH of 4.3 (Sigma-Aldrich, St Louis, MO, USA) for 15 min. For obtaining quantitative data, 300 μl of 10% (w/v) cetylpyridinium chloride (Sigma-Aldrich) and 10 mM sodium phosphate (pH 7.0) solution was added to stained dishes and the absorbance of extracted dye was determined at 562 nm.
Evaluation of cell proliferation
hADSCs were transfected with miRNA or small interfering RNA (siRNA). After a 48 h incubation, the cells were detached and the plated in 6-well plates at a density of 1 × 10⁴ cells per well. The number of cells was counted at the indicated days after plating with a Countess Automated Cell Counter (Invitrogen, Carlsbad, CA, USA).
Real-time quantitative PCR
Total RNA was isolated by using Trizol (Invitrogen), according to the manufacturer's instructions and reverse-transcribed into cDNA with the Reverse Transcriptase M-MLV (Promega, Madison, WI, USA). Primer sequences to be used in the experiment were as follows: CDK6: FW: 5′-TCACACCGAGTAGTGCATCG-3′, RV: 5′-CAAGACTTCGGGTGCTCTGT-3′ Runx2: FW: 5′-CTCACTACCACACCTACCTG-3′, RV: 5′-TCAATATGGTCGCCAAACAGATTC-3′ Alkaline phosphatase: FW: 5′-CCACGTCTTCACATTTGGTG-3′, RV: 5′-AGACTGCGCCTGGTAGTTGT-3′. For miRNA quantitative reverse transcriptase PCR, small RNA species-enriched RNA was isolated according to the manufacturer's instructions (mirVana miRNA isolation kit; Ambion, Austin, TX, USA). miRNA was reverse-transcribed by using Ncode miRNA first-strand complementary DNA synthesis kits (Invitrogen). Forward primer sequence was designed as the corresponding mature miRNA sequences and 5S ribosomal RNA was used as normalizing control. The miR-103a-3p-specific forward primer sequence was designed on the basis of miRNA sequences obtained from the miRBase database. Quantitative reverse transcriptase PCR was performed by using a Power SYBR Green PCR Master Mix on the ABI7500 Instrument (Applied Biosystems, Warrington, UK). Data analysis was determined by using the relative standard curve method.
Western blot analysis
Samples were homogenized in RIPA buffer (Sigma, St Louis, MO, USA). The isolated proteins were separated by SDS-PAGE and electro-transferred to Nitrocellulose membranes (Millipore, Bedford, MA, USA). Blots were probed with primary antibodies, followed by horseradish peroxidase-conjugated secondary antibodies. Antibodies used in this study were purchased as follows: CDK6 from Abcam (Cambridge, UK), DICER1 from Santa Cruz Biotechnology (Santa Cruz, CA, USA) and GAPDH from Cell Signaling Technologies (Boston, MA, USA). Bound antibodies were detected by using an ECL detection kit (Pierce Biotechnology, Rockford, IL, USA) and visualized by using LAS 3000 Luminoimage Analyzer (Fujifilm, Tokyo, Japan). Protein level was quantified by using the National Institutes of Health ImageJ software (Bethesda, MD, USA).
miRNA/siRNA transfection
hADSCs were seeded with complete medium without antibiotics. On the following day, 20 nM of miRNAs (miR-103a-3p mimics or inhibitors, Dharmacon, Thermo Scientific, Epsom, UK) and 100 nM of siRNAs (on-TARGET plus SMART pool, Dharmacon) for CDK6 and DICER1 were transfected by using DharmaFECT Transfection Reagent I (Dharmacon) according to manufacturer's protocol. As negative control, control miRNA or non-targeting siRNA were transfected.
Reporter vectors and DNA consturcts
Putative miR-103a-3p-recognition elements (as single copy) from the CDK6 gene and DICER1 were cloned in the 3′-UTR of the firefly luciferase reporter vector (pMIR-Report, Ambion) according to the manufacturer's specified guidelines. The oligonucleotide sequences were designed to carry the HindIII and SpeI sites at their extremities facilitating ligation into the HindIII and SpeI sites of pMIR-Report (Ambion). The oligonucleotides used in these studies were as follows:
pMIR-CDK6 FW:5′-CTAGTAAAAAGATTGGAACTGTTACGACGGA-3′,
RV: 5′-AGCTTCCGTCGTAACAGTTCCAATCTTTTTA-3′
pMIR-CDK6 mutant FW: 5′-CTACTAAAAAGATTGAAACTGTTCCGTTGGA-3′,
RV: 5′-AGCTTCCAACGGAACAGTTTCAATCTTTTTA-3′
pMIR-DICER1 FW: 5′-CTAGTATAGTGTGGATTTTATACGACGTA-3′,
RV: 5′-AGCTT ACGTCGTATAAAATCCACACTATA-3′,
pMIR-DICER1 mutant FW: 5′-CTAGTATAGTGTGGATTTCACAAGACGTA-3′,
RV: 5′-AGCTT ACGTCTTGTGAAATCCACACTATA-3′
Reporter gene assay
All transient transfections were conducted by using Dharmafect Duo (Dharmacon, Thermo Scientific). The pMIR-CDK6 and pMIR-β-gal plasmids were used as reporter constructs. The cells were harvested 72 h after transfection, lysed in reporter lysis buffer, and subsequently assayed for their luciferase activity (Luciferase Assay System, Promega). The transfections were performed in duplicate per each experiment. The luciferase assays were normalized according to their β-galactosidase activity.
Stastistical analysis
All of the results are presented as the means±s.e.m. Comparisons between groups were analyzed via t-tests (two-sided) or analysis of variance for experiments with more than two subgroups. Post hoc range tests and pair-wise multiple comparisons were conducted by using the t-test (two-sided) with Bonferroni adjustments. Probability values of P<0.05 were considered to be statistically significant.
Results
Effects of miR-103a-3p overexpression on the osteogenic differentiation and proliferation of hADSCs
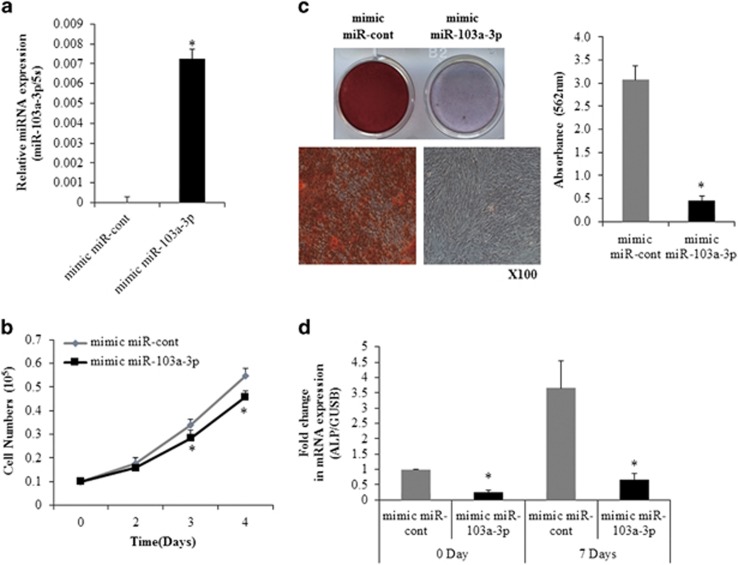
The miRNAs that showed high levels of expression in a preliminary miRNA microarray study were chosen and then differentiation-related molecules were targeted by using the miRWalk database.23 To examine the role of miR-103a-3p in hADSCs functions, miR-103a-3p mimics were transfected into hADSCs in order to overexpress miR-103a-3p. miRNA mimics augment the function of endogenous miRNAs for easier detection of phenotypic changes. Real-time PCR analysis showed that miR-103a-3p-transfected hADSCs had increased levels of miR-103a-3p expression (Figure 1a).
Figure 1.
Overexpression of miR-103a-3p inhibits osteogenic differentiation and proliferation of hADSCs. (a) miR-103a-3p levels were determined in mimic control (mimic miR-cont) or mimic miR-103a-3p-transfected hADSCs using real-time PCR. (b) hADSCs proliferation was determined by direct cell counting after oligonucleotide transfection. (c) Oligonucleotide-transfected hADSCs were grown for 2 days and, when the oligonucleotide-transfected hADSCs were grown to 80–90% confluence, osteogenic differentiation was induced for 2 weeks and determined by Alizarin Red S solution, which was quantified by absorbance at 562 nm. (d) Real-time PCR analysis of ALP, in mimic miR-103a-3p-transfected undifferentiated and differentiated cells. Total RNA was isolated at days after induction of differentiation. Internal control for expression analysis was GUSB. Data represent mean±s.e.m. (n=4). *P<0.05 compared with mimic miR-cont-transfected hADSCs at 0 and 7 days. ALP, alkaline phosphatase; hADSC, human adipose tissue-derived stromal cell; miR, microRNA.
To test the effect of miR-103a-3p on hADSCs proliferation, miR-103a-3p-transfected hADSCs were plated (1 × 10⁴ cells per well) on culture plates and the number of cells was counted on specific days. This cell counting experiment showed that miR-103a-3p-transfected cells had slower growth than control miR-transfected cells (Figure 1b). Osteogenic differentiation of miR-103a-3p-overexpressing hADSCs were induced with the appropriate media. After incubating hADSCs for 14 days after inducing differentiation, miR-103a-3p-overexpression significantly inhibited an osteogenic differentiation of hADSCs (Figure 1c). Real-time PCR analysis showed that the transfection of a miR-103a-3p mimic inhibited alkaline phosphatase expression at basal and 7 days after osteogenic differentiation (Figure 1d).
Effects of miR-103a-3p inhibition on the osteogenic differentiation and proliferation of hADSCs
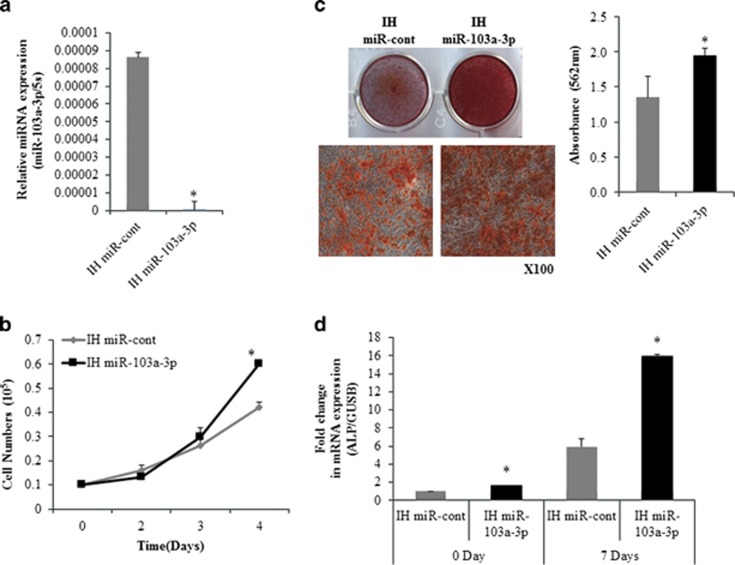
To investigate the effect of miR-103a-3p inhibition on hADSCs differentiation, hADSCs were transfected with a specific miRNA inhibitor (IH-miR-103a-3p). Real-time PCR analysis showed that transfection of IH-miR-103a-3p effectively downregulated miR-103a-3p expression in hADSCs (Figure 2a). The cell counting experiment showed that IH-miR-103a-3p enhanced hADSCs proliferation compared with control oligonucleotide-transfected cells (Figure 2b).
Figure 2.
Inhibition of miR-103a-3p increases osteogenic differentiation and proliferation of hADSCs. (a) miR-103a-3p levels were determined in inhibitor control-(IH-miR-cont) or IH-miR-103a-3p–transfected hADSCs using real-time PCR. (b) hADSCs proliferation was determined by direct cell counting after oligonucleotide transfection. (c) Oligonucleotide-transfected hADSCs were grown for 10 days and, when the oligonucleotide-transfected hADSCs were grown to 80–90% confluence, osteogenic differentiation was induced for 2 weeks and determined by Alizarin Red S solution staining, which was quantified by absorbance at 562 nm. (d) Real-time PCR analysis of ALP in IH-miR-103a-3p-transfeted undifferentiated and differentiated cells. Total RNA was isolated at days after induction of differentiation. Internal control for expression analysis was GUSB. Data represent mean±s.e.m. (n=4). *P<0.05 compared with IH-miR-cont transfected hADSCs at 0 and 7 days. ALP, alkaline phosphatase; hADSC, human adipose tissue-derived stromal cell; miR, microRNA.
To examine the effect of miR-103a-3p inhibition on osteogenic differentiation, IH-miR-103a-3p-transfected hADSCs were induced to differentiate into osteogenic lineages. Alizarin Red S staining revealed that the inhibition of miR-103a-3p enhanced an osteogenic differentiation of hADSCs (Figure 2c). To further confirm the effect, the expression of osteogenic differentiation marker gene was determined using real-time PCR. Results showed that IH-miR-103a-3p transfection increased the expression of alkaline phosphatase at basal and 7 days after osteogenic differentiation (Figure 2d).
miR-103a-3p targets the 3′-UTR of CDK6 mRNA
To determine the potential targets of miR-103a-3p in hADSCs, miR-103a-3p-induced changes in gene expression profiles were analyzed by microarray. The transfection of a miR-103a-3p mimic lead to increased the expression of 32 genes and inhibited the expression of 31 genes in hADSCs (Table 1). Using the miRWalk database for target gene prediction, CDK6 was selected as a potential target of miR-103a-3p among the downregulated genes.
Table 1. Partial list of genes of which expression are regulated by miR-103a-3p-overexpress hADSCs.
| Gene symbol | Gene name | Fold change |
|---|---|---|
| SMPD1 | Sphingomyelin phosphodiesterase 1 | −6.55 |
| CDK6 | Cyclin-dependent kinase 6 | −5.63 |
| MT1M | Metallothionein 1 M | −4.23 |
| UNC84B | Sad1 and UNC84 domain containing 2 | −3.67 |
| MT1E | Metallothionein 1E | −3.13 |
| GREM2 | Gremlin 2, DAN family BMP antagonist | −2.90 |
| DICER1 | Ribonuclease type III | −2.87 |
| TRIAP1 | TP53 regulated inhibitor of apoptosis 1 | −2.87 |
| VCAM1 | Vascular cell adhesion molecule 1 | −2.86 |
| GRN | Granulin | −2.70 |
| CUL4A | Cullin 4A | −2.60 |
| UBE2C | Ubiquitin-conjugating enzyme E2C | −2.50 |
| S1PR3 | Suppression of tumorigenicity 13 | −2.35 |
| BIRC5 | Baculoviral IAP repeat containing 5 | −2.30 |
| IL6 | Interleukin 6 | −2.24 |
| IL13RA1 | Interleukin 13 receptor, alpha 1 | 3.27 |
| ARNT2 | Aryl-hydrocarbon receptor nuclear translocator 2 | 3.22 |
| UBE2G1 | Ubiquitin-conjugating enzyme E2G 1 | 3.04 |
| CANX | Calnexin | 2.98 |
| NDUFB5 | NADH dehydrogenase (ubiquinone) 1 beta subcomplex, 5 | 2.84 |
| RRAS2 | Related RAS viral (r-ras) oncogene homolog 2 | 2.81 |
| ANKRD37 | Ankyrin repeat domain 37 | 2.79 |
| TPMT | Thiopurine S-methyltransferase | 2.57 |
| YWHAB | Tyrosine 3-monooxygenase/tryptophan 5-monooxygenase activation protein, beta polypeptide | 2.57 |
Abbreviations: hADSC, human adipose tissue-derived stromal cell; miR, microRNA.
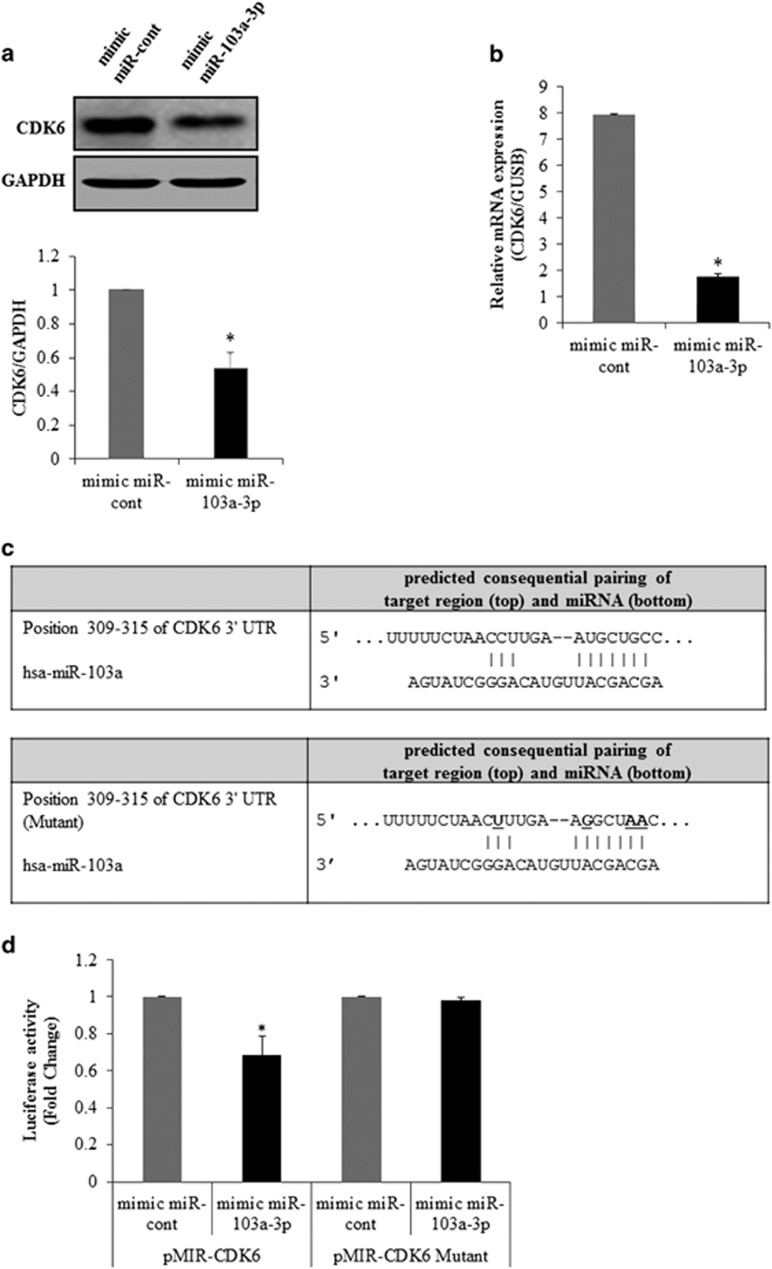
To determine the relationship between miR-103a-3p and CDK6, CDK6 expression was analyzed with real-time PCR and western blot analysis in miR-103a-3p mimic transfected cells. The transfection of a mimic miR-103a-3p led to a significant decrease in CDK6 protein (Figure 3a) and mRNA (Figure 3b) expression levels in the hADSCs.
Figure 3.
miR-103a-3p targets the 3′-UTR of CDK6 mRNA. (a) CDK6 expression in hADSCs transfected with oligonucleotides was analyzed by western blot. Lysates were prepared at 2 days after transfection with oligonucleotides. To confirm equal loading, the quantities of CDK6 and GAPDH were determined using anti-CDK6 and anti-GAPDH antibodies. The relative expression ratio of each protein was quantified by densitometric evaluation of western blots. Data represent mean±s.e.m. (n=4). *P<0.05 compared with mimic-miR-cont transfected hADSCs. (b) CDK6 expression in hADSCs transfected with oligonucleotides was analyzed by real-time PCR. Total RNAs were isolated at 2 days after transfection with oligonucleotides. Data represent mean±s.e.m. (n=4). *P<0.05 compared with mimic-miR-cont transfected hADSCs. (c) pMIR-CDK6 or pMIR-CDK6-mutant luciferase constructs were made according to the sequences from miRWalk database. (d) These contructs were cotransfected with mimic-miR-103a-3p or mimic-miR-control into hADSC. Data represent mean±s.e.m. of the ratio to the value of mimic miR-cont of pMIR-CDK6 or pMIR-CDK6 mutant (n=4), *P<0.05 compared with mimic miR-cont-transfected hADSCs. hADSC, human adipose tissue-derived stromal cell; miR, microRNA; UTR, untranslated region.
To test whether miR-103a-3p directly targeted CDK6 in hADSCs, luciferase reporter genes with CDK6 3′-UTRs with or without mutation at the miR-103a-3p binding regions were constructed (Figure 3c). The results showed a decrease in relative luciferase activity when the CDK6 3′-UTR (pMIR-CDK6) was transfected into miR-103a-3p-transfected hADSCs, while no decrease in relative luciferase activity was observed in hADSCs transfected with a mutant miR-103a-3p 3′-UTR (pMIR-CDK6-mut) (Figure 3d).
Effect of CDK6 siRNA on proliferation and osteogenic differentiation of hADSCs
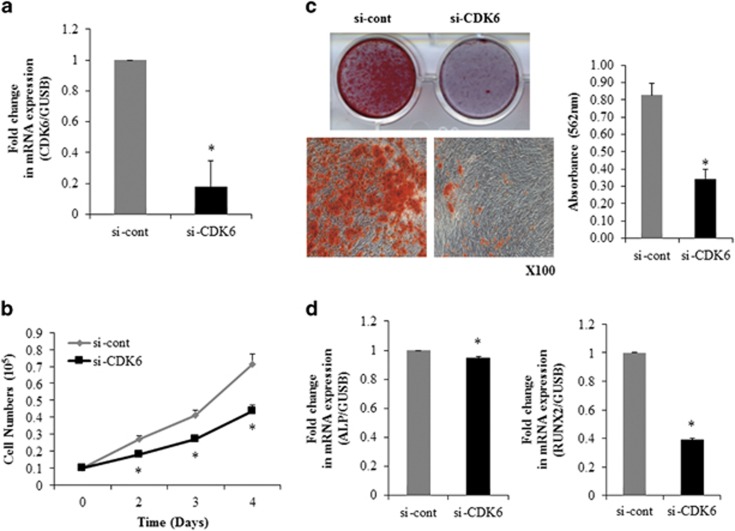
To determine the role of CDK6 in osteogenic differentiation and proliferation of hADSCs, CDK6 expression was suppressed in hADSCs with an RNA interference technique using CDK6 siRNA (CDK6 siRNA) transfection. Real-time PCR analysis confirmed that CDK6 siRNA effectively inhibited CDK6 expression in hADSCs (Figure 4a). Direct cell counting showed that CDK6 siRNA-transfected hADSCs proliferated less than the control cells (Figure 4b).
Figure 4.
CDK6 siRNA inhibits osteogenic differentiation and proliferation of hADSCs. (a) CDK6 mRNA levels were determined in control-(si-cont) or CDK6 oligonucleotide (si-CDK6) transfected hADSCs by using real-time PCR. Internal control for expression analysis was GUSB. (b) hADSCs proliferation was determined by direct cell counting. (c) Oligonucleotide-transfected hADSCs were grown for 2 days and, when the oligonucleotide-transfected hADSCs were grown to 80–90% confluence, osteogenic differentiation was induced for 2 weeks and determined by Alizarin Red S solution staining, which was quantified by absorbance at 562 nm. (d) Real-time PCR analysis of ALP, and Runx2 in si-CDK6-transfected undifferentiated cells. Internal control for expression analysis was GUSB. Data represent mean±s.e.m. (n=4). *P<0.05 compared with si-cont-transfected hADSCs. ALP, alkaline phosphatase; hADSC, human adipose tissue-derived stromal cell; miR, microRNA; si-CDK6, CDK6 small interfering RNA.
To study the effect of CDK6 downregulation on the efficiency of hADSCs differentiation, osteogenic differentiation of CDK6 siRNA-transfected hADSCs was induced. Alizarin Red S staining, and real-time PCR analysis of osteogenic differentiation marker genes indicated that downregulation of CDK6 inhibited osteogenic differentiation of hADSCs (Figure 4c and d).
miR-103a-3p targets the 3′-UTR of DICER1 mRNA
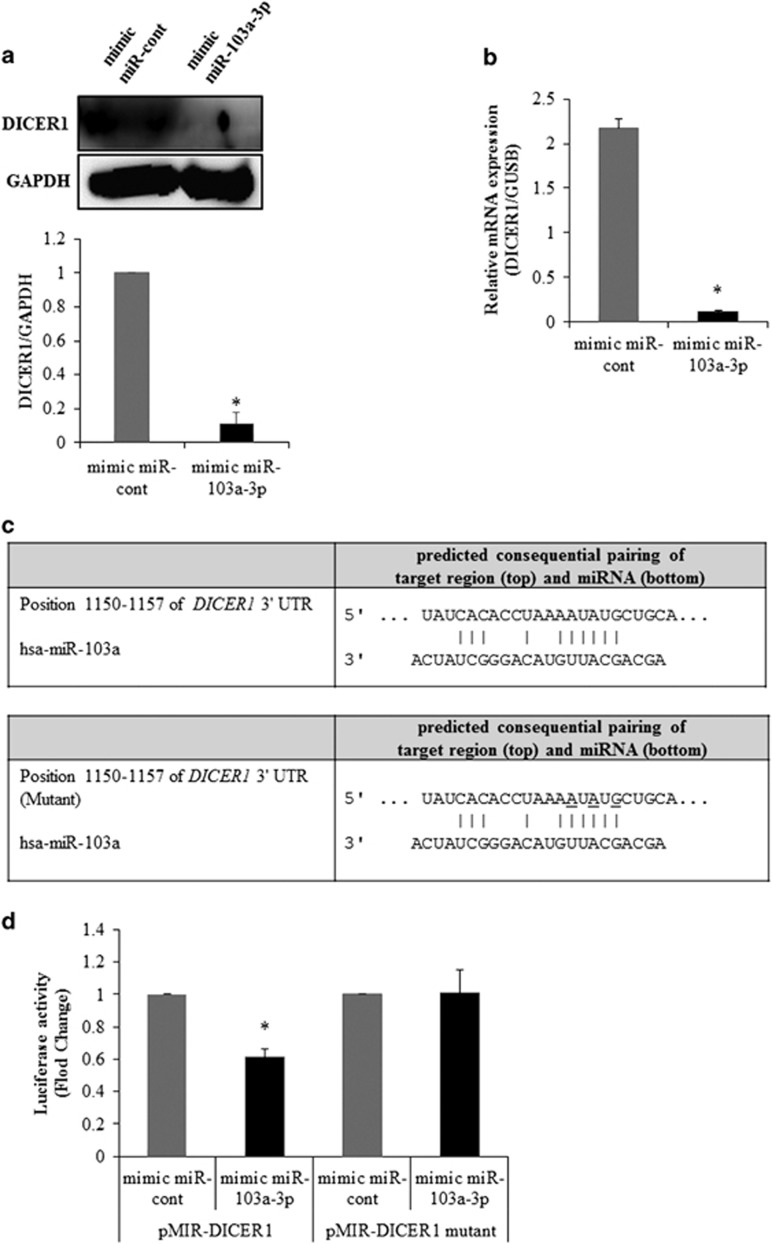
To determine the relationship between miR-103a-3p and DICER1, DICER1 expression was analyzed with real-time PCR and western blot analysis in miR-103a-3p mimic-transfected cells. The transfection of a miR-103a-3p mimic led to a significant decrease in DICER1 expression at both the protein (Figure 5a) and mRNA (Figure 5b) levels in the hADSCs.
Figure 5.
miR-103a-3p targets the 3′-UTR of DICER1 mRNA. (a) DICER1 expression in hADSCs transfected with oligonucleotides was analyzed by western blot. Lysates were prepared at 2 days after transfection with oligonucleotides. To confirm equal loading, the quantities of DICER1 and GAPDH were determined using anti-DICER1 and anti-GAPDH antibodies. The relative expression ratio of each protein was quantified by densitometric evaluation of western blots. Data represent mean±s.e.m. (n=4). *P<0.05 compared with mimic-miR-cont transfected hADSCs. (b) DICER1 expression in hADSCs transfected with oligonucleotides was analyzed by real-time PCR. Total RNAs were isolated at 2 days after transfection with oligonucleotides. Data represent mean±s.e.m. (n=4). *P<0.05 compared with mimic-miR-cont transfected hADSCs. (c) pMIR-DICER1 or pMIR-DICER1-mutant luciferase constructs were made according to the sequences from miRWalk database. (d) pMIR-DICER1 or pMIR-DICER1-mutant luciferase constructs were cotransfected with mimic-miR-103a-3p or mimic-miR-control into hADSCs hADSCs. Internal control for expression analysis was GUSB. Data represent mean±s.e.m. of the ratio to the value of mimic miR-cont of pMIR-DICER1 or pMIR-DICER1 mutant (n=4), *P<0.05 compared with miR-con-transfected hADSCs, #P<0.05 compared with anti-miR-cont-transfected hADSCs. hADSC, human adipose tissue-derived stromal cell; miR, microRNA; UTR, untranslated region.
To test whether miR-103a-3p directly targeted DICER1 in hADSCs, luciferase reporter genes with DICER1 3′-UTRs with or without mutation at the miR-103a-3p-binding regions were constructed and the changes in luciferase activity with miR-103a-3p transfection were determined. The results showed that miR-103a-3p transfection inhibited luciferase activity in hADSCs that were transfected with the constructs containing DICER1 3′-UTR (pMIR-DICER1) or mutant miR-103a-3p 3′-UTR (pMIR-DICER1-mut; Figure 5c and d).
Effect of DICER1 on osteogenic differentiation and proliferation of hADSCs
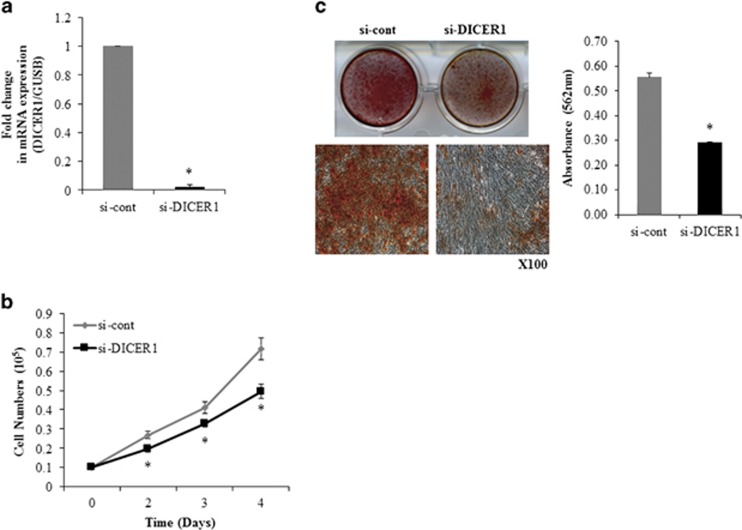
To determine the role of DICER1 in osteogenic differentiation and proliferation of hADSCs, DICER1 expression was suppressed in hADSCs with an RNA interference technique using DICER1 siRNA (DICER1 siRNA) transfection. Real-time PCR analysis confirmed that DICER1 siRNA effectively inhibited DICER1 expression in hADSCs (Figure 6a). The effect of DICER1 downregulation on hADSCs proliferation was also determined. Direct cell counting showed that DICER1 siRNA-transfected hADSCs proliferated less than the control cells (Figure 6b).
Figure 6.
DICER1 RNAi inhibits osteogenic differentiation and proliferation of hADSCs. (a) DICER1 mRNA levels were determined in control-(si-cont) or DICER1 oligonucleotide-(si-DICER1) transfected hADSCs by using real-time PCR. (b) hADSCs proliferation was determined by direct cell counting. (c) Osteogenic differentiation were determined same as Figure 1c method. Data represent mean±s.e.m. (n=4). *P<0.05 compared with si-con-transfected hADSCs. hADSC, human adipose tissue-derived stromal cell; si-DICER1, DICER1 small interfering RNA.
To study the effect of DICER1 downregulation on the efficiency of hADSC differentiation, osteogenic differentiation of DICER1 siRNA-transfected hADSCs was induced. Alizarin Red S staining indicated that downregulation of DICER1 inhibited osteogenic differentiation of hADSCs (Figure 6c).
Discussion
Although several reports have demonstrated the function of miR-103a in the neurogenesis of embryonic stem cells,24 studies have not examined its effects on the differentiation of other cell lineages. In the current study, we investigated whether miR-103a-3p was involved in proliferation and osteogenic differentiation of hADSCs. The data in this study demonstrated that miR-103a-3p overexpression with its mimic in hADSCs inhibited proliferation and osteogenic differentiation, and that miR-103 inhibition by transfection of inhibitor oligonucleotides increased osteogenic differentiation and proliferation. These results indicated that miR-103-3p was a negative regulator of osteogenic differentiation and proliferation in hADSCs.
Downregulated genes in miR-103a-3p mimic-transfected cells, including CDK6 was identified from a microarray experiment. The data from the current experiment showed that overexpression of miR-103 downregulated the expression of CDK6 at the protein and mRNA levels. An assay with a firefly luciferase reporter plasmid containing the predicted CDK6 target gene sequences showed that overexpression of miR-103 decreased luciferase activity, confirming the direct binding of miR-103 to the 3′-UTRs of CDK6 in hADSCs. Roles for CDK6 in the miR-103a-induced inhibition of the proliferation and osteogenic differentiation of hADSCs was further supported by determining the effects of CDK6 siRNAs. Downregulation of CDK6 showed similar changes in the phenotypes of hADSCs with miR-103a overexpression.
CDK6 was identified as a new member in a family of cdc-2 related kinases in 1992.25 This kinase, which is a partner with the D-type cyclins and possesses pRb kinase activity in vitro, has been thought to function solely as a pRb kinase in the regulation of the G1 phase of the cell cycle.26 Additional research indicated that miRNA-504 inhibited hypopharyngeal squamous cell carcinoma cell proliferation via targeting CDK6.27 Overexpression of CDK6 has been shown to block differentiation of mice chondrocytes without affecting cell-cycle progression in vitro.28 It has also been reported that several miRNAs target CDK6 and control cell proliferation and osteogenic differentiation. miR-13729 inhibits the proliferation of lung cancer cells by targeting CDK6 and cdc42. miR-34a inhibits osteoblast differentiation and cell proliferation in human mesenchymal stem cells through the inhibition of multiple targets including CDK6.30
DICER1 is a conserved RNAse III endonuclease that is essential for the processing of several classes of small RNAs, including miRNAs and endo-siRNAs, as well as for the degradation of toxic transposable elements.31, 32 DICER1 has an important role in the proliferation and differentiation of oligodendrocyte precursor cells and in the development of pancreatic endocrine cells.33 Oskowitz et al.34 reported that downregulation of Dicer expression did not affect cell proliferation in human bone marrow-derived mesenchymal stem cells, a finding which is inconsistent with data from the current study. DICER1 deletion has various effects on cell proliferation. Silencing of DICER1 inhibited cell proliferation in leukemia cells,35 however, a decrease in DICER1 expression by miR-192 increased proliferation of neuroblastoma cells.36 Therefore, the effects of DICER1on cell proliferation may differ based on the miRNA profiles present in different cell types.
Conditional deletion of the Dicer enzyme in osteoprogenitors by Col1a1-Cre compromised fetal survival after E14.5 and demonstrated impaired extracellular matrix mineralization and reduced expression of mature osteoblast markers during differentiation of mesenchymal cells of ex vivo deleted Dicer(c/c).37 This supports our findings that downregulation of DICER1 expression inhibits osteogenic differentiation of hADSCs.
In this study microarray data showed that miR-103a-3p downregulated 31 genes. It has been known that interleukin 638 and gemlin 239 inhibited osteoblast differentiation. Therefore, these genes could be excluded potential targets of miR-103a-3p. However, we cannot exclude the possibility that other genes besides of CDK6 may be involved in the miR-103-induced inhibition of osteogenic differentiation in hADSCs.
Collectively, the findings from the current study indicate that miR-103a controls the proliferation and osteogenic differentiation of hADSCs, and that these effects are partly mediated by targeting the 3′-UTRs of CDK6. These results are important, as novel pharmacological agents for disease treatment based on targeting miRNAs are already undergoing clinical trials.40 Previous studies in mice have shown that targeting miRNA led to the development of osteoporotic bone in mice41 and contributed to primary osteoporosis in humans.42, 43 Thus, inhibition of miR-103a in mesenchymal stem cells in vivo may lead to enhanced bone formation. It is plausible that local implantation of human mesenchymal stem cells cultured on a functionalized scaffold containing IH-miR-103a may represent one approach to enhance local bone formation needed for treatment of localized bone defects and non-healed fractures.
Acknowledgments
This research was supported by the National Research Foundation of Korea (NRF) funded by the Ministry of Science, ICT and Future Planning (NRF-2012M3A9B4028558).
The authors declare no conflict of interest.
References
- Huntzinger E, Izaurralde E. Gene silencing by microRNAs: contributions of translational repression and mRNA decay. Nat Rev Genet. 2011;12:99–110. doi: 10.1038/nrg2936. [DOI] [PubMed] [Google Scholar]
- Shi XE, Li YF, Jia L, Ji HL, Song ZY, Cheng J, et al. MicroRNA-199a-5p affects porcine preadipocyte proliferation and differentiation. Int J Mol Sci. 2014;15:8526–8538. doi: 10.3390/ijms15058526. [DOI] [PMC free article] [PubMed] [Google Scholar]
- Schober A, Nazari-Jahantigh M, Wei YY, Bidzhekov K, Gremse F, Grommes J, et al. MicroRNA-126-5p promotes endothelial proliferation and limits atherosclerosis by suppressing Dlk1. Nat Med. 2014;20:368–376. doi: 10.1038/nm.3487. [DOI] [PMC free article] [PubMed] [Google Scholar]
- Hong Z, Feng Z, Sai Z, Tao S. PER3, a novel target of miR-103, plays a suppressive role in colorectal cancer in vitro. BMB Rep. 2014;47:500–505. doi: 10.5483/BMBRep.2014.47.9.212. [DOI] [PMC free article] [PubMed] [Google Scholar]
- Ukai T, Sato M, Akutsu H, Umezawa A, Mochida J. MicroRNA-199a-3p, microRNA-193b, and microRNA-320c are correlated to aging and regulate human cartilage metabolism. J Orthop Res. 2012;30:1915–1922. doi: 10.1002/jor.22157. [DOI] [PubMed] [Google Scholar]
- Cairo S, Wang Y, de Reynies A, Duroure K, Dahan J, Redon MJ, et al. Stem cell-like micro-RNA signature driven by Myc in aggressive liver cancer. Proc Natl Acad Sci USA. 2010;107:20471–20476. doi: 10.1073/pnas.1009009107. [DOI] [PMC free article] [PubMed] [Google Scholar]
- Liu T, Chen Q, Huang Y, Huang Q, Jiang L, Guo L. Low microRNA-199a expression in human amniotic epithelial cell feeder layers maintains human-induced pluripotent stem cell pluripotency via increased leukemia inhibitory factor expression. Acta Biochim Biophys Sin (Shanghai) 2012;44:197–206. doi: 10.1093/abbs/gmr127. [DOI] [PubMed] [Google Scholar]
- Liu X, He M, Hou Y, Liang B, Zhao L, Ma S, et al. Expression profiles of microRNAs and their target genes in papillary thyroid carcinoma. Oncol Rep. 2013;29:1415–1420. doi: 10.3892/or.2013.2263. [DOI] [PubMed] [Google Scholar]
- Boren T, Xiong Y, Hakam A, Wenham R, Apte S, Wei Z, et al. MicroRNAs and their target messenger RNAs associated with endometrial carcinogenesis. Gynecol Oncol. 2008;110:206–215. doi: 10.1016/j.ygyno.2008.03.023. [DOI] [PubMed] [Google Scholar]
- Wang HY, Yan LX, Shao Q, Fu S, Zhang ZC, Ye W, et al. Profiling plasma microRNA in nasopharyngeal carcinoma with deep sequencing. Clin Chem. 2014;60:773–782. doi: 10.1373/clinchem.2013.214213. [DOI] [PubMed] [Google Scholar]
- Chakraborty C, George Priya Doss C, Bandyopadhyay S. miRNAs in insulin resistance and diabetes-associated pancreatic cancer: the 'minute and miracle' molecule moving as a monitor in the 'genomic galaxy'. Curr Drug Targets. 2013;14:1110–1117. doi: 10.2174/13894501113149990182. [DOI] [PubMed] [Google Scholar]
- Scheffer AR, Holdenrieder S, Kristiansen G, von Ruecker A, Muller SC, Ellinger J. Circulating microRNAs in serum: novel biomarkers for patients with bladder cancer. World J Urol. 2014;32:353–358. doi: 10.1007/s00345-012-1010-2. [DOI] [PubMed] [Google Scholar]
- Zhu X, Zhang X, Wang H, Song Q, Zhang G, Yang L, et al. MTA1 gene silencing inhibits invasion and alters the microRNA expression profile of human lung cancer cells. Oncol Rep. 2012;28:218–224. doi: 10.3892/or.2012.1770. [DOI] [PubMed] [Google Scholar]
- Geng L, Sun B, Gao B, Wang Z, Quan C, Wei F, et al. MicroRNA-103 promotes colorectal cancer by targeting tumor suppressor DICER and PTEN. Int J Mol Sci. 2014;15:8458–8472. doi: 10.3390/ijms15058458. [DOI] [PMC free article] [PubMed] [Google Scholar]
- Trajkovski M, Hausser J, Soutschek J, Bhat B, Akin A, Zavolan M, et al. MicroRNAs 103 and 107 regulate insulin sensitivity. Nature. 2011;474:649–653. doi: 10.1038/nature10112. [DOI] [PubMed] [Google Scholar]
- Liao Y, Lonnerdal B. Global microRNA characterization reveals that miR-103 is involved in IGF-1 stimulated mouse intestinal cell proliferation. PLoS One. 2010;5:e12976. doi: 10.1371/journal.pone.0012976. [DOI] [PMC free article] [PubMed] [Google Scholar]
- Wilfred BR, Wang WX, Nelson PT. Energizing miRNA research: a review of the role of miRNAs in lipid metabolism, with a prediction that miR-103/107 regulates human metabolic pathways. Mol Genet Metab. 2007;91:209–217. doi: 10.1016/j.ymgme.2007.03.011. [DOI] [PMC free article] [PubMed] [Google Scholar]
- Zuk P. Adipose-derived stem cells in tissue regeneration: a review. ISRN Stem Cells. 2013;2013:1–35. [Google Scholar]
- Shin KK, Kim YS, Kim JY, Bae YC, Jung JS. miR-137 controls proliferation and differentiation of human adipose tissue stromal cells. Cell Physiol Biochem. 2014;33:758–768. doi: 10.1159/000358650. [DOI] [PubMed] [Google Scholar]
- Kim YJ, Hwang SJ, Bae YC, Jung JS. MiR-21 regulates adipogenic differentiation through the modulation of TGF-beta signaling in mesenchymal stem cells derived from human adipose tissue. Stem Cells. 2009;27:3093–3102. doi: 10.1002/stem.235. [DOI] [PubMed] [Google Scholar]
- Kim YJ, Bae SW, Yu SS, Bae YC, Jung JS. miR-196a regulates proliferation and osteogenic differentiation in mesenchymal stem cells derived from human adipose tissue. J Bone Miner Res. 2009;24:816–825. doi: 10.1359/jbmr.081230. [DOI] [PubMed] [Google Scholar]
- Kim Y, Kim H, Cho H, Bae Y, Suh K, Jung J. Direct comparison of human mesenchymal stem cells derived from adipose tissues and bone marrow in mediating neovascularization in response to vascular ischemia. Cell Physiol Biochem. 2007;20:867–876. doi: 10.1159/000110447. [DOI] [PubMed] [Google Scholar]
- Dweep H, Sticht C, Pandey P, Gretz N. miRWalk–database: prediction of possible miRNA binding sites by ‘walking' the genes of three genomes. J Biomed Inform. 2011;44:839–847. doi: 10.1016/j.jbi.2011.05.002. [DOI] [PubMed] [Google Scholar]
- Annibali D, Gioia U, Savino M, Laneve P, Caffarelli E, Nasi S. A new module in neural differentiation control: two microRNAs upregulated by retinoic acid, miR-9 and -103, target the differentiation inhibitor ID2. PLoS One. 2012;7:e40269. doi: 10.1371/journal.pone.0040269. [DOI] [PMC free article] [PubMed] [Google Scholar]
- Meyerson M, Enders GH, Wu CL, Su LK, Gorka C, Nelson C, et al. A family of human cdc2-related protein kinases. EMBO J. 1992;11:2909–2917. doi: 10.1002/j.1460-2075.1992.tb05360.x. [DOI] [PMC free article] [PubMed] [Google Scholar]
- Grossel MJ, Hinds PW. From cell cycle to differentiation: an expanding role for cdk6. Cell Cycle. 2006;5:266–270. doi: 10.4161/cc.5.3.2385. [DOI] [PubMed] [Google Scholar]
- Kikkawa N, Kinoshita T, Nohata N, Hanazawa T, Yamamoto N, Fukumoto I, et al. microRNA-504 inhibits cancer cell proliferation via targeting CDK6 in hypopharyngeal squamous cell carcinoma. Int J Oncol. 2014;44:2085–2092. doi: 10.3892/ijo.2014.2349. [DOI] [PubMed] [Google Scholar]
- Moro T, Ogasawara T, Chikuda H, Ikeda T, Ogata N, Maruyama Z, et al. Inhibition of Cdk6 expression through p38 MAP kinase is involved in differentiation of mouse prechondrocyte ATDC5. J Cell Physiol. 2005;204:927–933. doi: 10.1002/jcp.20350. [DOI] [PubMed] [Google Scholar]
- Zhu X, Li Y, Shen H, Li H, Long L, Hui L, et al. miR-137 inhibits the proliferation of lung cancer cells by targeting Cdc42 and Cdk6. FEBS Lett. 2013;587:73–81. doi: 10.1016/j.febslet.2012.11.004. [DOI] [PubMed] [Google Scholar]
- Chen L, Holmstrom K, Qiu W, Ditzel N, Shi K, Hokland L, et al. MicroRNA-34a inhibits osteoblast differentiation and in vivo bone formation of human stromal stem cells. Stem Cells. 2014;32:902–912. doi: 10.1002/stem.1615. [DOI] [PubMed] [Google Scholar]
- Kaneko H, Dridi S, Tarallo V, Gelfand BD, Fowler BJ, Cho WG, et al. DICER1 deficit induces Alu RNA toxicity in age-related macular degeneration. Nature. 2011;471:325–330. doi: 10.1038/nature09830. [DOI] [PMC free article] [PubMed] [Google Scholar]
- Luense LJ, Carletti MZ, Christenson LK. Role of Dicer in female fertility. Trends Endocrinol Metab. 2009;20:265–272. doi: 10.1016/j.tem.2009.05.001. [DOI] [PMC free article] [PubMed] [Google Scholar]
- Kanji MS, Martin MG, Bhushan A. Dicer1 is required to repress neuronal fate during endocrine cell maturation. Diabetes. 2013;62:1602–1611. doi: 10.2337/db12-0841. [DOI] [PMC free article] [PubMed] [Google Scholar]
- Oskowitz AZ, Penfornis P, Tucker A, Prockop DJ, Pochampally R. Drosha regulates hMSCs cell cycle progression through a miRNA independent mechanism. Int J Biochem Cell Biol. 2011;43:1563–1572. doi: 10.1016/j.biocel.2011.07.005. [DOI] [PMC free article] [PubMed] [Google Scholar]
- Bai Y, Qiu GR, Zhou F, Gong LY, Gao F, Sun KL. Overexpression of DICER1 induced by the upregulation of GATA1 contributes to the proliferation and apoptosis of leukemia cells. Int J Oncol. 2013;42:1317–1324. doi: 10.3892/ijo.2013.1831. [DOI] [PubMed] [Google Scholar]
- Feinberg-Gorenshtein G, Guedj A, Shichrur K, Jeison M, Luria D, Kodman Y, et al. MiR-192 directly binds and regulates Dicer1 expression in neuroblastoma. PLoS One. 2013;8:e78713. doi: 10.1371/journal.pone.0078713. [DOI] [PMC free article] [PubMed] [Google Scholar]
- Gaur T, Hussain S, Mudhasani R, Parulkar I, Colby JL, Frederick D, et al. Dicer inactivation in osteoprogenitor cells compromises fetal survival and bone formation, while excision in differentiated osteoblasts increases bone mass in the adult mouse. Dev Biol. 2010;340:10–21. doi: 10.1016/j.ydbio.2010.01.008. [DOI] [PMC free article] [PubMed] [Google Scholar]
- Kaneshiro S, Ebina K., Shi K, Higuchi C, Hirao M, Okamoto M, et al. IL-6 negatively regulates osteoblast differentiation through the SHP2/MEK2 and SHP2/Akt2 pathways in vitro. J Bone Miner Metab. 2014;32:378–392. doi: 10.1007/s00774-013-0514-1. [DOI] [PubMed] [Google Scholar]
- Suzuki D, Yamada A, Aizawa R, Funato S, Matsumoto T, Suzuki W, et al. BMP2 differentially regulates the expression of Gremlin1 and Gremlin2, the negative regulators of BMP function, during osteoblast differentiation. Calcif Tissue Int. 2012;91:88–96. doi: 10.1007/s00223-012-9614-5. [DOI] [PubMed] [Google Scholar]
- Ahmed FE, Ahmed NC, Vos PW, Bonnerup C, Atkins JN, Casey M, et al. Diagnostic microRNA markers to screen for sporadic human colon cancer in stool: I. Proof of principle. Cancer Genomics Proteomics. 2013;10:93–113. [PubMed] [Google Scholar]
- Wang X, Guo B, Li Q, Peng J, Yang Z, Wang A, et al. miR-214 targets ATF4 to inhibit bone formation. Nat Med. 2013;19:93–100. doi: 10.1038/nm.3026. [DOI] [PubMed] [Google Scholar]
- Zhang YH, Shen L, Shen Y, Chen XD, Jiang LS. Study on key genes and regulatory networks associated with osteoporosis by microarray technology. Genet Test Mol Biomarkers. 2013;17:625–630. doi: 10.1089/gtmb.2013.0055. [DOI] [PubMed] [Google Scholar]
- Kim JH, Lee MR, Kim JH, Jee MK, Kang SK. Retraction: 'IFATS collection: selenium induces improvement of stem cell behaviors in human adipose-tissue stromal cells via SAPK/JNK and stemness acting signals'. Stem Cells. 2013;31:2848. doi: 10.1634/stemcells.2008-0184. [DOI] [PubMed] [Google Scholar]


