

Abstract
Background:
Adverse effects of metformin are primarily related to gastrointestinal (GI) intolerance that could limit titration to an efficacious dose or cause discontinuation of the medication. Because some metformin side effects may be attributable to shifts in the GI microbiome, we tested whether a GI microbiome modulator (GIMM) used in combination with metformin would ameliorate the GI symptoms.
Methods:
A 2-period crossover study design was used with 2 treatment sequences, either placebo in period 1 followed by GIMM in period 2 or vice versa. Study periods lasted for 2 weeks, with a 2-week washout period between. During the first week, type 2 diabetes patients (T2D) who experienced metformin GI intolerance took 500 mg metformin along with their assigned NM504 (GIMM) or placebo treatment with breakfast and with dinner. In the second week, the 10 subjects took 500 mg metformin (t.i.d.), with GIMM or placebo consumed with the first and third daily metformin doses. Subjects were permitted to discontinue metformin dosing if it became intolerable.
Results:
The combination of metformin and GIMM treatment produced a significantly better tolerance score to metformin than the placebo combination (6.78 ± 0.65 [mean ± SEM] versus 4.45 ± 0.69, P = .0006). Mean fasting glucose levels were significantly (P < .02) lower with the metformin–GIMM combination (121.3 ± 7.8 mg/dl) than with metformin-placebo (151.9 ± 7.8 mg/dl).
Conclusion:
Combining a GI microbiome modulator with metformin might allow the greater use of metformin in T2D patients and improve treatment of the disease.
Keywords: glucose, GI adverse events, metformin, metformin intolerance, microbiome modulator, NM504
Metformin is the first-line pharmacological therapy for type 2 diabetes (T2D).1 The fasting glucose-lowering activity of metformin is equal to or better than that of other oral agents without inducing hypoglycemia or weight gain. Metformin may be successfully combined with all other currently used glucose-lowering agents, including insulin. Metformin is best tolerated when taken with a meal and the most common effective dose is 1500-2000 mg/day, with a maximum of 2550 mg/day.2 A well-accepted mechanism of action for metformin is the activation of hepatic AMP-activated protein kinase (AMPK).3 Recently, a mechanism of action for metformin’s reduction of hepatic gluconeogenesis was described to be inhibition of glycerophosphate dehydrogenase, resulting in reduced conversion of lactate and glycerol to glucose.4
Adverse effects of metformin are primarily related to gastrointestinal (GI) intolerance. In a study of 360 newly diagnosed T2D individuals, approximately 88% of participants reported either single or multiple GI symptoms.5 The most common GI symptoms were diarrhea (62.1%), heartburn (52.1%), and nausea (47.4%), followed by abdominal pain (35.5%), bloating (35.2%), and retching (21.1%). Constipation was also reported in another study.6 Some mechanisms for these side effects may be attributable to metformin’s actions in the GI tract. These effects are usually mild, dose-related, mitigated by slowing the dose escalation, and cease after dose reduction or drug discontinuation.6 Approximately 5% of study subjects discontinue metformin use due to these events.7
The most serious and sometimes fatal, but rare, side effect is lactic acidosis. This could be attributed to metformin-mediated inhibition of glycerophosphate dehydrogenase.4 A contributing lactate source may be derived from colonic bacteria. Unabsorbed glucose or glucose polymer delivery to the colon provides a substrate for lactate-producing bacteria such as Lactobacillus species, Streptococcus bovis, Bifidobacterium species, and Eubacterium species. Bacteria produce d- and l-lactic acid, both of which are absorbed into the circulation.8 Accumulation of colonic lactic acid will contribute to some or all of the GI side effects9 observed in metformin users, especially those consuming diets intensified with starch and sugars.
The GI microbiome reported to be present in T2D patients is characterized by microbiota enriched in bacteria that harvest sugars.10 Other functional changes suggested by bacterial dysbiosis in T2D are boosted metabolism of branched-chain amino acids that are associated with increased methane metabolism, increased xenobiotic degradative metabolism, and stimulation of sulphate reduction. A microbiome modulator to shift the GI microbiome of someone with T2D toward 1 characterized in healthy individuals was developed. The modulator contains purified food ingredients to stimulate blooms of competing commensal microbiota that generate short chain fatty acids (SCFA) instead of lactic acid, retard absorption of small molecules by increasing the viscosity of luminal contents, fortify the mucosal barrier, sequester bile acids and salts, and deliver a potent antioxidant to combat the increased demand of oxidative stress.
An opportunity surfaced when a newly diagnosed T2D patient developed metformin-intolerance due to GI symptoms. The remarkable improvement in the GI symptoms with GIMM observed in that single case11 was the impetus for this pilot trial. The data suggest that this GI microbiome modulator improved GI symptoms while giving better regulation of fasting blood glucose levels in patients taking metformin.
Methods
Subjects
Subjects had T2D and either were referred by their Endocrinologist at the LSU Health Sciences Center clinic because they could not tolerate the metformin-associated GI symptoms (n = 6) after titration from 500 mg b.i.d. to 500 mg t.i.d. or responded to a radio advertisement seeking T2D patients who had experienced metformin GI side effects (n = 4). The sample size was selected by convenience (Table 1). Inclusion criteria included volunteers with a history of metformin intolerance who were ≥ 18 years of age, had a body mass index (BMI) ≥ 25 and fasting blood glucose between 100 mg/dl and 200 mg/dl. Exclusion criteria included pregnancy, nursing, taking proton pump inhibitors, taking antibiotics within the 3 previous months, or taking insulin. Twelve subjects from the clinic demonstrated interest to participate but only 6 of the referred showed for screening, qualified and were enrolled. Two of 6 subjects responding to radio advertisements did not qualify. One subject dropped out after screening but before commencing treatment because of scheduling conflicts and was replaced. Patients withdrew from diabetes medications for 2 weeks prior to entry into the study.
Table 1.
Subject Demographics.
| Subject | Age (years) | Gender | Race | BMI (kg/m2) | Diabetes duration (years) | Medication |
|---|---|---|---|---|---|---|
| 1 | 62 | Male | White | 37 | 2 | Glimepiride |
| 2 | 49 | Male | White | 34.2 | 16 | Avandia/Glimepiride |
| 3 | 29 | Female | African American | 37.7 | 5 | None |
| 4 | 52 | Female | African American | 43.9 | 3 | Metformin |
| 5 | 29 | Female | African American | 47.1 | 14 | None |
| 7 | 66 | Female | White | 37.6 | 32.9 | Metformin |
| 8 | 42 | Female | African American | 47.1 | 4 | Metformin |
| 9 | 58 | Female | African American | 26.4 | 4 | Glimepiride |
| 10 | 47 | Female | White | 33.1 | 6 | Glimepiride |
| 11 | 42 | Female | African American | 33.9 | 9 | Glimepiride |
Study Design
A 2-period crossover study design was used with 2 treatment sequences, either placebo in period 1 followed by the GIMM in period 2 or vice versa. Study periods lasted for 2 weeks, with a 2-week washout period between. Each subject was randomly assigned to 1 of the treatment sequences. All subjects received daily doses of metformin. During the first week of each study period, subjects took 500 mg along with their assigned GIMM/placebo treatment with breakfast and with dinner. In the second week, subjects took 500 mg metformin (t.i.d.), with GIMM or placebo consumed along with the first and third daily metformin doses. Subjects were permitted to discontinue metformin dosing if it became intolerable.
Metformin, GIMM, and placebo were dispensed by the Pennington Biomedical Research Center (PBRC) pharmacist. Metformin was administered in tablets. GIMM and placebo were provided by MicroBiome Therapeutics (Broomfield, CO) in sealed, coded pouches to make them indistinguishable. Volunteers were instructed to empty the entire content of a pouch into 6 ounces of water, mix, and drink along with the tablet.
This crossover pilot study was performed at PBRC between June 2013 and June 2014 in compliance with the Declaration of Helsinki. The PBRC Institutional Review Board approved the study protocol. This study was registered at www.clinicaltrials.gov (NCT01866462).
GIMM and Placebo
GIMM (NM504) is a combination of 3 purified food ingredients that are generally recognized as safe (GRAS) by the FDA. Inulin (3.79 g) from agave, beta-glucan (2.03 g) from oats and polyphenols from blueberry pomace (anthocyanins [162.5 mg]; total polyphenolics [723.99 mg]) were blended with inactive food ingredients (14.2 g) at Merlin Development Inc (Minneapolis, MN) to create a pleasant tasting, readily dissolvable powder. A placebo was developed in parallel to offer a powder that was indistinguishable in color and taste but substituted cellulose (8.7 g) for the total dietary fiber content of NM504 (8.7 g).
Assessment of GI Symptoms
An adaptation of questionnaires validated to evaluate GI symptoms for irritable bowel syndrome12 was used because it included GI symptoms associated with metformin use in the subject described in the case report11 and in those referred to the study by their physician. Assessments of stool consistency (not applicable, very hard, hard, formed, loose, watery), urgency to evacuate (no need to evacuate within 3h after dosing, need to evacuate within 3 hours, need to evacuate within 2 hours, need to evacuate within 1 hour), daily bowel movements (at least 1 movement every 3-4 days, at least 1 movement every 2 days, at least 1 movement per day, at least 2 movements per day), bloating sensation (not applicable, mild, moderate, severe), flatulence (less than normal, normal, moderately increased, greatly increased), and evacuation completeness (not applicable, incomplete, constipated) were recorded daily. In addition, the King’s Stool Chart13 was used daily to assess the appearance of fecal output using pictures of feces for the subject to select.
Blood Glucose
Fasting blood glucose was measured with a glucometer by finger stick each morning before eating and dosing. Data were recorded by the volunteers.
Statistical Methods
All calculations and data analyses were performed by a biostatistician at PBRC using SAS Version 9.4 (SAS Institute, Cary, NC). The data in the text are presented as mean ± standard error of the mean (SEM). The primary outcomes included tolerance of metformin, fasting glucose, and King’s stool chart scores. All outcomes were evaluated by fitting linear models including covariates to account for the crossover design utilized in the study. Least squares means (LS means) of the treatment effects were the output from each model and were compared via 2-sample t tests. P values below .05 were considered statistically significant.
Tolerability
For the analysis and comparison of metformin tolerability between the treatment groups, a composite tolerability score was calculated using participant ratings of severity of 4 GI symptoms (stool consistency, urgency to evacuate, bloating sensation, and flatulence). The symptom ratings were combined into a single score for each participant using a weighted sum, with weights derived using principal components analysis (PCA). Using PCA for constructing the tolerability score ensures that this particular weighted sum of the symptom ratings accounts for more variation in the data than any other combination of the symptoms. Although this score has not been validated for use in determining tolerability, the construction and statistical properties of the score are sound. The scores are such that a higher score indicates a higher tolerability. For treatment group comparisons, a linear mixed model was used with non-baseline-adjusted tolerability score as the response. Covariates included in the model were period and sequence effects from the crossover design. Group mean tolerability scores, adjusted for these covariates, were compared using a 2-sample t test.
Fasting Glucose
Measures of fasting glucose were recorded daily throughout the study. The observed glucose levels while participants were actively taking metformin were included in the analysis. Due to the nature of the design, a doubly repeated measures model was utilized, with the period of the crossover being the first level of repeated measures and days within period being the second level.
King’s Stool Chart
Daily measures of fecal consistency and volume were recorded by the subjects using the King’s stool chart and scored as described by Whelan, Judd, and Taylor.13 These scores were analyzed with a doubly repeated measures model.
Results
Subjects
Eight females and 2 males volunteered and were either Caucasian (n = 5) or African American (n = 5). Subjects were between the ages of 29 and 71 years. BMI ranged between 26.4 and 47.1 kg/m2. Patients had fasting plasma glucose levels ranging from 104 to 178 mg/dl on screening. Eleven T2D subjects were screened, but 1 declined to participate because of scheduling conflicts. Ten subjects were enrolled in the study after providing written consent.
Tolerance
The volunteers tolerated metformin GI side effects significantly better when the drug was combined with GIMM than in combination with placebo (Figure 1). Stools tended to be more formed and larger when the volunteers were taking metformin combined with GIMM than when taking metformin with placebo but the difference was not statistically significant (5.4 ± 0.5 vs 4.6 ± 0.5, King’s chart ratings).
Figure 1.
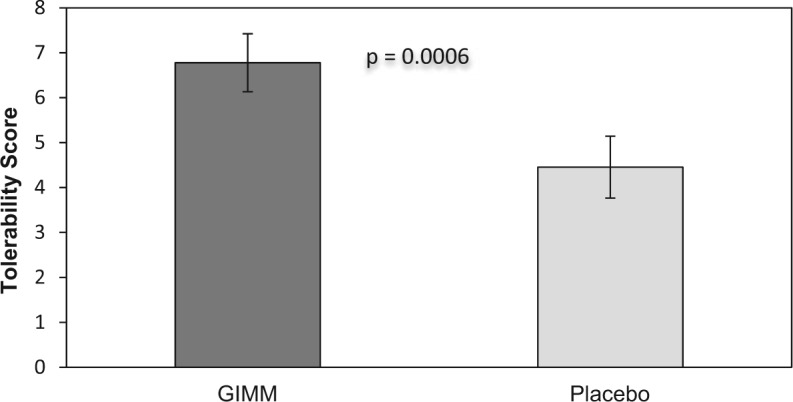
Metformin is better tolerated when combined with GIMM than placebo. Tolerability is a composite score of GI symptoms. A greater tolerability score indicates a better metformin tolerance.
Fasting Glucose
Fasting glucose levels were lower when metformin was combined with GIMM compared to when metformin was combined with placebo, though not statistically significant, during metformin b.i.d. (134.9 ± 6.7 vs 141.5 ± 6.9, mg/dl) and metformin t.i.d. (130.0 ± 14.5 vs 153.0 ± 16.6). There was a statistically significant sequence effect (order of administering GIMM or placebo affected glucose differently). After reviewing glucose levels for particular subjects (Figure 2), we suspect that this may be due to a carryover effect of GIMM on glucose in period 2 due to an inadequate washout period. For this reason, we chose to also compare mean glucose levels only for period 1.The results of this analysis demonstrate that mean fasting glucose was significantly (P < .02) lower with the metformin–GIMM combination (Figure 3).
Figure 2.

Fasting blood glucose levels. Subjects were assigned GIMM (A) or placebo (B) for the initial period. Subjects were instructed to take 500 mg metformin b.i.d. during the initial week of each period and 500 mg metformin t.i.d. during the second week. Subjects were permitted to discontinue metformin dosing if symptoms became intolerable. Days metformin was taken are indicated by the solid symbols. Subject number is indicated in the upper left as well as in Table 1.
Figure 3.
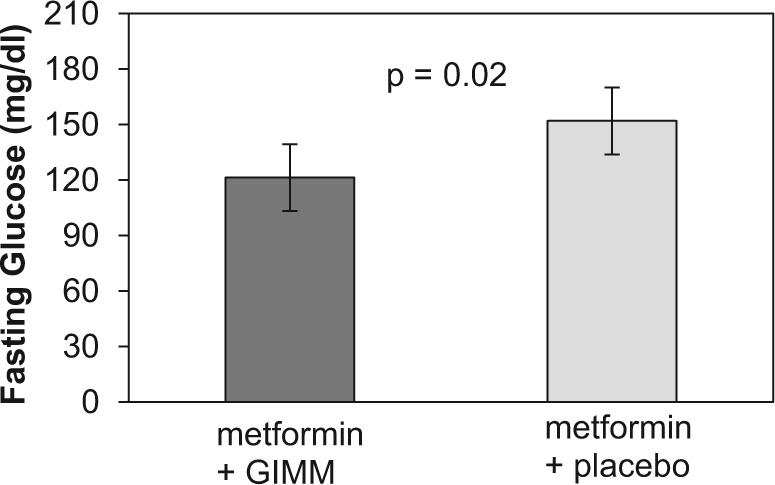
Mean observed fasting glucose for subjects taking GIMM during period 1. Bars represent the mean ± SEM.
Metformin Intolerant Patients
A subset of the participants (n = 6) in this study was identified as metformin-intolerant at baseline based on medical history. To investigate the combination of metformin with GIMM in this population, analyses were carried out only on these participants. More extreme differences in means were observed in all outcomes for the metformin-intolerant participants than for the entire study population, but the results did not change the statistical significance. Fasting glucose decreased more during the period when metformin was combined with GIMM compared to metformin combined with placebo (130.6 ± 6.5 vs 144.1 ± 6.4 mg/dl). The difference between the 2 treatments when comparing only period 1 was statistically significant (115.7 ± 6.7 vs 170.3 ± 9.7 mg/dl; P = .0099). GI symptoms were also lessened and stools were more formed and regular, but these changes were not statistically significant.
Discussion
The principal limitation for chronic metformin therapy in some patients is presentation of persistent adverse GI symptoms that may cause patients to discontinue metformin use. The data observed in this pilot clinical trial suggest that a modulator of the GI microbiome could both alleviate metformin-mediated GI symptoms and may improve glucose regulation. Additional clinical trials are necessary to confirm these preliminary findings.
There is a paucity of studies investigating the etiology of metformin mediated GI side effects. Inhibition of glycerophosphate dehydrogenase4 is a recently identified mechanism of action of metformin. This mechanism may be linked not only to serious and rare lactic acidosis, but also to some of the adverse GI symptoms. Bioavailability of metformin is 50%-60% and since efficacious doses range between 1 and 2 g/day with fecal recovery of an oral dose at 20%-30%, there is sufficient metformin to interact with GI microbiota.2 Commensal microbiota in the colon such as Bacillus subtilis contain glycerophosphate dehydrogenase14 that is inhibited by metformin.4 This could result in an overproduction of d-lactate in the colon. Additional colonic contributions of d-lactate are from organisms such as Lactobacillus species, Streptococcus bovis, Bifidobacterium species, and Eubacterium species that utilize sugars present in the colon.15,16 Furthermore, d-lactate can convert to l-lactate by some colon microbiota, which could contribute to the plasma lactate pool.16
Bile acids are well known to promote colonic fluid and electrolyte secretion, thereby causing diarrhea associated with bile acid malabsorption.17 Metformin may cause GI disturbances by reducing ileal bile salt reabsorption leading to elevated colonic bile salt concentrations.18 The GIMM contains beta-glucan, which is an oligosaccharide resistant to human digestion. Viscous beta-glucan encapsulates or sequesters bile acids19 in the colonic contents.
Beta-glucan and inulin are oligoscaaharides that are both metabolized in the colon by microbiota in the Bacteroides and Prevotella genera.20 The end products of this fermentation are short chain fatty acids (SCFAs) that activate free fatty acid receptors (FFAR3 and FFAR4) in the colon,21,22 resulting in secretion of peptide YY (PYY), glucagon-like peptide-1 (GLP-1), and GLP-2.21,22 Both PYY and GLP-1 signal satiety. GLP-1 also decreases gastric emptying and increases insulin release. GLP-1 analogs are used to treat T2D and oral drugs that block rapid degradation of endogenous GLP-1 are also widely used to treat T2D.
Ghrelin is a hormone secreted by the stomach and by the colon that functions to prevent hypoglycemia by stimulating gluconeogenesis.23 Ghrelin must be acylated with a medium chain fatty acid (MCFA) to activate its receptor (GHS-R1a).24 The acylating enzyme, termed GOAT (ghrelin O-acyltransferase), has a high affinity for MCFAs; however, recent evidence indicates that GOAT can use a SCFA to acylate ghrelin,25 rendering the hormone inactive.26 In addition, SCFAs may act as competitive inhibitors of GOAT.27 Therefore, generation of SCFAs could contribute to reduce blood glucose levels via production of an inactive ghrelin or lower active ghrelin levels.
The microbiome of the typical T2D patient appears to be one with an increased production of reactive oxygen species.10 This suggests that ingestion of polyphenols with low bioavailability could be beneficial in scavenging the reactive oxygen species. Blueberries contain high antioxidant activity28 because of antioxidant enzymes, anthocyanidins, and flavanols.29 Most of these polyphenols have poor bioavailability.30 Since they stay in the colon, they are able to alter the redox state in the intestines and shift communities of GI microbiota.31 Each dose of GIMM is developed to contain the same polyphenolic mass as that found in 2 cups of blueberries. Blueberry consumption is shown to improve insulin sensitivity in men and women.32 The sugars are removed from the blueberry extract used in GIMM, which should further improve the effect on carbohydrate metabolism. Although we did not measure insulin sensitivity in the present study, we observed a greater improvement of fasting blood glucose levels in subjects taking GIMM with metformin compared to those taking a placebo-metformin combination.
Therapeutic interventions that have mechanisms of actions in the GI microbiome may offer a level of safety that is not attainable by most orally active treatments designed to be absorbed. There is also a reduced potential for a GI modulator to interact with the metabolism of drugs that are orally absorbed. Therefore, we feel that GI microbiome modulators are ideal partners to be used in combination with current and future orally available medications. Although this GIMM was developed to be a monotherapy to treat prediabetes, an opportunity surfaced when a newly diagnosed T2D patient developed metformin-intolerance due to GI symptoms. The remarkable improvement in the GI symptoms with GIMM observed in that single case11 was the impetus for this pilot trial.
Conclusion
We observed that combining metformin with GIMM permitted 10 T2D subjects, who experienced GI adverse events to metformin, to better tolerate metformin GI side effects than when metformin was combined with placebo. Some subjects could only escalate from 500 mg metformin b.i.d. to t.i.d. while also taking GIMM. This observation is particularly valuable since a slow titration of metformin is presently the only way to reduce metformin-related GI adverse effects. Finally, significantly lower fasting glucose levels were observed when subjects took the metformin-GIMM combination. Larger trials with GIMM–metformin in combination are needed to replicate and expand these findings. Such trials might allow the greater use of metformin in T2D patients and improve treatment of the disease.
Footnotes
Abbreviations: BMI, body mass index; b.i.d., twice per day; FFAR, free fatty acid receptor; GI, gastrointestinal; GIMM, GI microbiome modulator; GOAT, ghrelin O-acyltransferase; GHS-R1a, growth hormone secretagogue receptor 1a; GRAS, generally recognized as safe; LS means, least squares means; MCFA, medium chain fatty acid; PBRC, Pennington Biomedical Research Center; PCA, principal components analysis; SCFA, short chain fatty acid; t.i.d., 3 times per day; T2D, type 2 diabetes.
Declaration of Conflicting Interests: The author(s) declared the following potential conflicts of interest with respect to the research, authorship, and/or publication of this article: FLG is a MicroBiome Therapeutics clinical advisor. MLH is a full-time employee of MicroBiome Therapeutics.
Funding: The author(s) disclosed receipt of the following financial support for the research, authorship, and/or publication of this article: This work was funded by MicroBiome Therapeutics. This work was funded in part by Nutrition Obesity Research Center grant NIH 2P30DK072476 from NIDDK, Botanical Research Center grant P50AT002776 from NCCAM and ODS, and 1 U54 GM104940 from NIGMS, which funds the Louisiana Clinical and Translational Science Center.
References
- 1. Inzucchi SE, Bergenstal RM, Buse JB, et al. Management of hyperglycaemia in type 2 diabetes, 2015: a patient-centered approach. Update to a position statement of the American Diabetes Association (ADA) and the European Association for the Study of Diabetes (EASD). Diabetes Care. 2015; 38:140-149. [DOI] [PubMed] [Google Scholar]
- 2. Graham GG, Punt J, Arora M, et al. Clinical pharmacokinetics of metformin. Clin Pharmacokinet. 2011;50:81-98. [DOI] [PubMed] [Google Scholar]
- 3. Zhou G, Meyers R, Li Y, et al. Role of AMP-activated protein kinase in mechanism of metformin. J Clin Invest. 2001;108:1167-1174. [DOI] [PMC free article] [PubMed] [Google Scholar]
- 4. Madiraju AK, Erion DM, Rahimi Y, et al. Metformin suppresses gluconeogenesis by inhibiting mitochondrial glycerophosphate dehydrogenase. Nature. 2014;510:542-546. [DOI] [PMC free article] [PubMed] [Google Scholar]
- 5. Florez H, Luo J, Castillo-Florez S, et al. Impact of metformin-induced gastrointestinal symptoms on quality of life and adherence in patients with type 2 diabetes. Postgrad Med. 2010;122:112-120. [DOI] [PubMed] [Google Scholar]
- 6. Bouchoucha M, Uzzan B, Cohen R. Metformin and digestive disorders. Diabetes Metab. 2011;37:90-96. [DOI] [PubMed] [Google Scholar]
- 7. Glucophage (metformin hydrochloride) and Glucophage XR (extended-release) prescribing information. Bristol, NJ: Bristol-Myers Squibb; 2009. [Google Scholar]
- 8. Halperin ML, Kamel KS. D-lactic acidosis: turning sugar into acids in the gastrointestinal tract. Kidney Int. 1996;49:1-8. [DOI] [PubMed] [Google Scholar]
- 9. Gennari FJ, Weise WJ. Acid-base disturbances in gastrointestinal disease. Clin J Am Soc Nephrol. 2008;3:18618. [DOI] [PubMed] [Google Scholar]
- 10. Qin J, Li Y, Cai Z, Li S, et al. A metagenome-wide association study of gut microbiota in type 2 diabetes. Nature. 2012;490:55-60. [DOI] [PubMed] [Google Scholar]
- 11. Greenway F, Wang S, Heiman M. A novel cobiotic containing a prebiotic and an antioxidant augments the glucose control and gastrointestinal tolerability of metformin: a case report. Beneficial Microbes. 2014;5:29-32. [DOI] [PubMed] [Google Scholar]
- 12. Gordon S, Ameen V, Bagby B, Shahan B, Jhingran P, Carter E. Validation of irritable bowel syndrome global improvement scale: an integrated symptom end point for assessing treatment efficacy. Dig Dis Sci. 2003;48:1317-1323. [DOI] [PubMed] [Google Scholar]
- 13. Whelan K, Judd PA, Taylor MA. Assessment of fecal output in patients receiving enteral tube feeding: validation of a novel chart. Eur J Clin Nutr. 2004;58:1030-1037. [DOI] [PubMed] [Google Scholar]
- 14. Fillinger S, Boschi-Muller S, Azza S, Dervn E, Branlant G, Aymerich S. Two glyceraldehyde-3-phosphate dehydrogenases with opposite physiological roles in a nonphotosynthetic bacterium. J Biol Chem. 2000;275:14031-14037. [DOI] [PubMed] [Google Scholar]
- 15. Stolberg L, Rolfe R, Gitlin N, et al. d-Lactic acidosis due to abnormal gut flora: diagnosis and treatment of two cases. N Engl J Med. 1982;306:1344-1348. [DOI] [PubMed] [Google Scholar]
- 16. Hove H, Mortensen PB. Colonic lactate metabolism and d-lactic acidosis. Dig Dis Sci. 1995;40:320-330. [DOI] [PubMed] [Google Scholar]
- 17. Kelly OB, Mroz MS, Ward JB, et al. Ursodeoxycholic acid attenuates colonic epithelial secretory function. J Physiol. 2013;591(pt 9):2307-2318. [DOI] [PMC free article] [PubMed] [Google Scholar]
- 18. Scarpello JH, Hodgson E, Howlett HC. Effect of metformin on bile salt circulation and intestinal motility in type 2 diabetes metllitus. Diabet Med. 1998;15:651-656. [DOI] [PubMed] [Google Scholar]
- 19. Kim HJ, White PJ. Interactional effects of β-glucan, starch, and protein in heated oat slurries on viscosity and in vitro bile acid binding. J Agric Food Chem. 2012;60:6217-6222. [DOI] [PubMed] [Google Scholar]
- 20. Bolam DN, Sonnenburg JL. Mechanistic insight into polysaccharide use within the intestinal microbiota. Gut Microbes. 2011;2:86-90. [DOI] [PMC free article] [PubMed] [Google Scholar]
- 21. Covington DK, Briscoe CA, Brown AJ, Jayawickreme CK. The G-protein-coupled receptor 40 family (GPR40-GPR43) and its role in nutrient sensing. Biochem Soc Trans. 2006;34:770-773. [DOI] [PubMed] [Google Scholar]
- 22. Karaki S, Mitsui R, Hayashi H, et al. Short-chain fatty acid receptor, GPR43, is expressed by enteroendocrine cells and mucosal mast cells in rat intestine. Cell Tissue Res. 2006;324:353-360. [DOI] [PubMed] [Google Scholar]
- 23. Li RL, Sherbet DP, Elsbernd DL, Goldstein JL, Brown MS, Zhao TJ. Profound hypoglycemia in starved, ghrelin-deficient mice is caused by decreased gluconeogenesis and reversed by lactate or fatty acids. J Biol Chem. 2012;287:17942-17950. [DOI] [PMC free article] [PubMed] [Google Scholar]
- 24. Kojima M, Hosoda H, Date Y, Nakazato M, Matsuo H, Kangawa K. Ghrelin is a growth-hormone-releasing acylated peptide from stomach. Nature. 1999;402:656-660. [DOI] [PubMed] [Google Scholar]
- 25. Kirchner H, Gutierrez JA, Solenberg PJ, et al. GOAT links dietary lipids with the endocrine control of energy balance. Nat Med. 2009;15:741-745. [DOI] [PMC free article] [PubMed] [Google Scholar]
- 26. Matsumoto M, Hosoda H, Kitajima Y, et al. Structure-activity relationship of ghrelin: pharmacological study of ghrelin peptides. Biochem Biophys Res Commun. 2001;287:142-146. [DOI] [PubMed] [Google Scholar]
- 27. Fukumori R, Sugino T, Hasegawa Y, et al. Plasma ghrelin concentration is decreased by short chain fatty acids in wethers. Domest Anim Endocrinol. 2011;41:50-55. [DOI] [PubMed] [Google Scholar]
- 28. Wang SY, Chen H, Ehlenfeldt MK. Antioxidant capacities vary substantially among cultivars of rabbiteye blueberry (Vaccinium ashei Reade). Int J Food Sci Tech. 2011;46:2482-2490. [Google Scholar]
- 29. Rodriquez-Mateos A, Cifuentes-Gomez T, Tabatabaee S, Lecras C, Spencer JPE. Procyanidin, anthocyanin, and chlorogenic acid contents of highbush and lowbush blueberries. J Agric Food Chem. 2012;60:5772-5778. [DOI] [PubMed] [Google Scholar]
- 30. Del BC, Ciappellano S, Klimis-Zacas D, et al. Anthocyanin absorption, metabolism, and distribution from a wild blueberry-enriched diet (Vaccinium angustifolium) is affected by diet dyration in the Sprague-Dawley rat. J Agric Food Chem. 2010;58:2491-2497. [DOI] [PubMed] [Google Scholar]
- 31. Hidalgo M, Oruna-Concha MJ, Kolida S, et al. Metabolism of anthocyanins by human gut microflora and the influence on gut bacterial growth. J Agric Food Chem. 2012;60:3882-3890. [DOI] [PubMed] [Google Scholar]
- 32. Stull AJ, Cash KC, Johnson WD, Champagne CM, Cefalu WT. Bioactives in blueberries improve insulin sensitivity in obese, insulin-resistant men and women. J Nutr. 2010;140:1764-1768. [DOI] [PMC free article] [PubMed] [Google Scholar]