Abstract
Background:
Glycemic control in hospital intensive care units (ICU) has been the subject of numerous research publications and debate over the past 2 decades. There have been multiple studies showing the benefit of ICU glucose control in reducing both morbidity and mortality. GlySure Ltd has developed a glucose monitor based on a diboronic acid receptor that can continuously measure plasma glucose concentrations directly in a patient’s vascular system. The goal of this study was to validate the performance of the GlySure CIGM system in different patient populations.
Methods:
The GlySure Continuous Intravascular Glucose Monitoring (CIGM) System was evaluated in both the Cardiac ICU (33 patients) and MICU setting (14 patients). The sensor was placed through a custom CVC and measured the patients’ blood glucose concentration every 15 seconds. Comparison blood samples were taken at 2 hourly then 4 hourly intervals and measured on a YSI 2300 STAT Plus or an i-STAT.
Results:
Consensus error grid analysis of the data shows that the majority of the data (88.2% Cardiac, and 95.0% MICU) fell within zone A, which is considered to be clinically accurate and all data points fell within zones A and B. The MARD of the Cardiac trial was 9.90% and the MICU trial had a MARD of 7.95%. Data analysis showed no significant differences between data generated from Cardiac and MICU patients or by time or glucose concentration.
Conclusions:
The GlySure CIGM System has met the design challenges of measuring intravascular glucose concentrations in critically ill patients with acceptable safety and performance criteria and without disrupting current clinical practice. The accuracy of the data is not affected by the patients’ condition.
Keywords: continuous glucose, intravascular, boronic acid
Glycemic control in hospital intensive care (ICU) has been the subject of numerous research publications and debate over the past 2 decades. Beginning with the work of Furnary first presented in 1995 and followed by the DIGAMI-1, Van den Berghe and Krinsley trials among others, there have been multiple studies showing the benefit of ICU glucose control in reducing both morbidity and mortality.1-8 In contrast several multicentre trials attempting to reproduce these results were either discontinued due to high levels of hypoglycemia (VISEP and GLUCONTROL) or showed both an increase in hypoglycemia and an increase in mortality in the target arm (NICE-SUGAR).9-11 One commonality among these 3 negative trials is that in addition to increased hypoglycemia they also failed to achieve the set glucose ranges in the target arm. The problem was not that the glucose ranges were set too low, but that the average ICU lacks the ability to control glucose in a narrow range with the currently available tools.5,6 Recent publications by Egi, Mackenzie, Krinsley, and others have shown an association between glucose variability and mortality as well as differences in optimal “normal” levels for diabetic versus nondiabetic patients.7,8,12,13 These results have helped explain the discrepancies in the earlier trials as efforts to hold tight targets using inadequate wide resolution intermittent instruments may contribute to sine wave correction/overcorrection patterns which actually increase variability. The conclusion drawn by many researchers and clinicians is that the solution lies in better tools to enable safe and effective glucose control in the ICU, which would reduce patient risk.8,14,15
Reduction of Patient Risk
The major impetus for the development programs of continuous glucose monitors over intermittent devices is one that is based on enabling glycemic control and subsequently reducing patient risk. Figure 1 shows the difference between intermittent and continuous monitoring.
Figure 1.
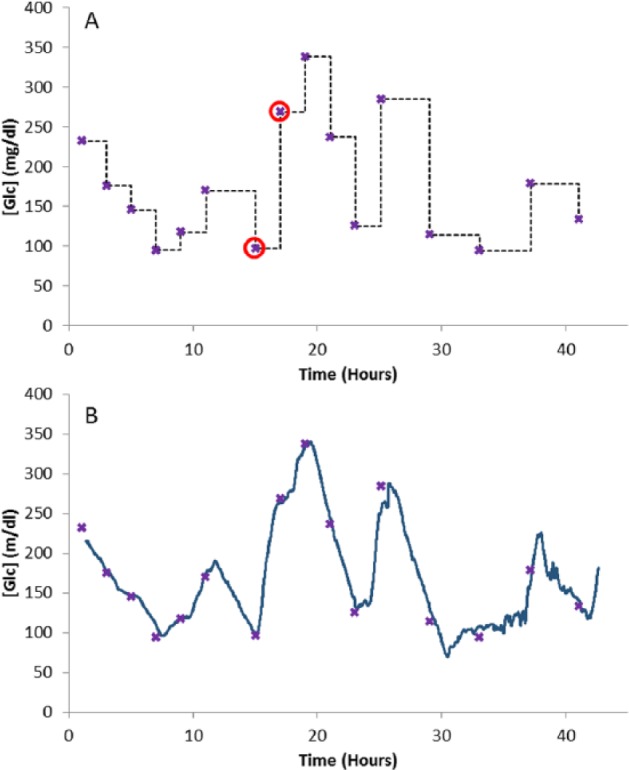
(A) Clinician’s view of patients’ blood glucose concentration ( ) based on intermittent blood sample measurements (
 ); samples 7 and 8 are highlighted (
 ). (B) CGM (-) versus intermittent blood sample measurements.
It is obvious from Figure 1A that with intermittent testing a clinicians view of the glycemic status of the patient at a point where a new blood sample is to be taken is governed by the glucose value given by the previous sample. For instance at the point where blood sample 8 is to be taken, the only knowledge of the patients glycemic status is given by sample 7, which is at 97 mg/dl. When blood sample 8 is measured it is found to be at 268 mg/dl. This gap in the knowledge of a patient’s glycemic status between blood samples can be regarded as a risk to the patient. Figure 1B demonstrates how this gap is eliminated by overlaying the continuous blood glucose trace from a continuous sensor.
This risk can be quantified by integrating the area under the curve (AUC) between the intermittent samples Figure 2. This measurement would have units of mg.h/dl, and the reduction of this area can be used to estimate the patient risk reduction.
Figure 2.
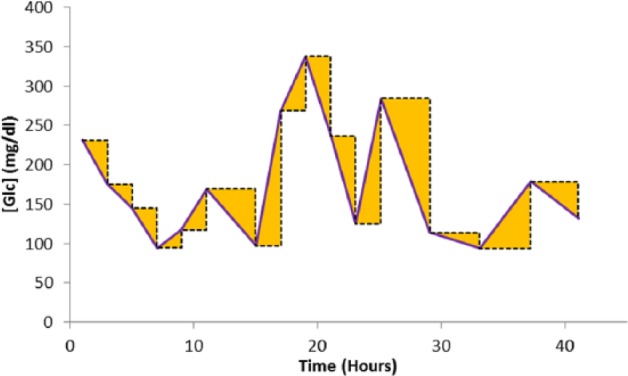
Integrating the errors associated with the intermittent samples.
Sensor Introduction Site and Access Device
A prime objective in selecting a site for introducing a sensor into an ICU patient is not to disrupt current clinical practice.
Measurement of capillary blood by the use of a finger stick and a glucometer are now commonly used in the ICU setting although originally designed for the home diabetic market. There is a body of evidence that glucometers are inherently inaccurate, particularly at low glucose values, but also that sampling capillary blood in sick patients can in itself provide misleading glucose values. In patients with peripheral circulatory failure and severe dehydration (eg, diabetic ketoacidosis, hyperosmolar nonketotic coma), shock, and hypotension this may occur. In these situations capillary blood glucose readings can be artificially low due to peripheral shutdown.16
Similar issues arise when continuous subcutaneous glucose sensors (originally designed for home diabetic use) are used on sick ICU patients. Severely ill patients can experience edema that can affect the subcutaneous glucose values by diluting the glucose.16 Microcirculation can be shut down in patients in shock as well as by various vasodilating drugs. The decrease in peripheral circulation can lead to less glucose transport to the subcutaneous space around the sensor and glucose concentrations lower than the blood.17
Glucose measurements on whole blood may be variable due to variable hematocrit levels. The World Health Organization (WHO) recommends that plasma values be converted into laboratory whole blood values by applying a correction factor of 1.12. However, plasma values do not depend on the hematocrit value and are more reflective of active glucose.18 The American Diabetes Association and the International Federation of Clinical Chemistry and Laboratory Medicine Scientific Division have urged that practice be harmonized by quoting plasma glucose values only, regardless of sampling site and measuring device, so as to avoid any errors and in interpretation.19
This suggests that the ideal positioning of a sensor to measure glucose in ICU patients is to be indwelling in the vascular system and also to measure plasma glucose concentrations.
Placement of the sensor through either a central venous catheter (CVC) or a radial artery catheter would seem sensible options. CVCs are routinely placed to monitor central venous pressure in 95% of ICUs in Europe and in the majority of ICU patients in the United States,20 where over 5 million are used annually.21 The CVC is commonly placed in the right internal jugular vein (RIJV).
The CVC’s primary use is to facilitate the measurement of central venous pressure and to infuse fluids and therapeutics into the patient whereas radial artery catheterization, with a 20 g or 22 g catheter, is used as a primary means of continuously measuring arterial blood pressure. The main issues with placing a glucose sensor in the radial artery is that low body temperatures and vasospasm can restrict blood flow to the sensor as can the placement of the catheter and sensor, by obstruction, with collateral flow taking place down the ulnar artery. The placement of the sensor through the radial artery catheter also has the drawback of potential dampening of the arterial pressure waveform, the main reason for its placement.
Based on the above reasons and the goal of developing a use model and form factor that does not disrupt current practice GlySure has developed a sensor that is placed through a single lumen of a 5 lumen CVC, Figure 3, such that the sensing tip of the sensor is in a large diameter vessel with a high blood velocity (Table 1). Although the sensor resides in whole blood the diffusion of glucose solution through the sensor outer membrane precludes any formed blood elements diffusing to the glucose detecting chemistry in the optical fiber and hence the sensor measures the glucose concentration in plasma and is independent of hematocrit.
Figure 3.
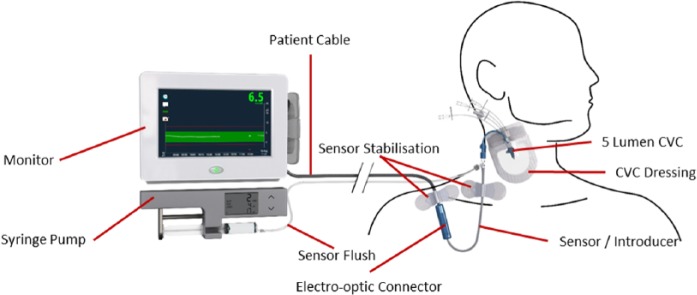
Use model GlySure CIGM System.
Table 1.
Flow Rates and Diameters of the RIJV and Radial Artery.
Methods
Sensor Design
Figure 4 shows a cross section of the sensor tip. The sensor comprises of a plastic optical fiber, having at the distal end a cell containing the immobilized glucose indicating chemistry, a strengthening wire, and a thermocouple. The distal end of the optical fiber is covered by a dialysis membrane. All 3 sensor elements are enclosed in an outer sheath (of diameter < 0.6 mm), the distal end of which is terminated in a microporous membrane. The glucose detecting chemistry, a fluorescent diboronic acid receptor, is immobilized within the hydrogel. This hydrogel fills the optical cell within the optical fiber that is surrounded with a dialysis membrane. The microporous membrane is a barrier to blood cells entering the sensor. These pores (~0.1 µm) are impregnated with platinum that catalytically decomposes any peroxides in the blood (often found in low concentrations in the blood of patients that have had ischemic events and that oxidize the boronic acids present in the receptor) to oxygen and water. The membrane has a covalently bonded modified heparin coating, which reduces the deposition of platelets, and blood cells, which could impair the diffusion of glucose through the membrane. The inner dialysis membrane and hydrogel act as filters for soluble high molecular weight materials, such as proteins and glycated proteins, thus eliminating these as potential interferents. This configuration was designed to remove potential interfering species that could interact with the glucose detecting chemistry. Interference testing of endogenous and exogenous substances was performed and the only interfering substance identified was mannitol. During production sensors undergo an extensive washing procedure. Aqueous extractable/leachable testing on sensors showed that no detectable materials were leached (detection limit 1.0 µg/ml).
Figure 4.

Cross section of sensor tip.
Receptor Chemistry
Receptors for carbohydrates have been designed based on hydrogen bonding interactions24,25 and covalent ester formation with boronic acids.26-28 Boronic acids can bind saccharides via covalent interactions in basic aqueous media through the formation of cis-1,2- or 1,3-diols which form 5- or 6-membered rings, respectively.26-28
Photoinduced electron transfer (PET) saccharide sensors based on boronic acids were first synthesized over 15 years ago,29-31 which exploit the interactions between o-methylphenylboronic acids (Lewis acids) and proximal tertiary amines (Lewis bases).
It has been shown that the “inherent stability order” for simple/monoboronic acids of D-fructose > D-galactose > D-mannose > D-glucose can be perturbed by the use of diboronic acids.32-34 Diboronic acid receptors with a 6 carbon linker between the 2 tertiary amines, Figure 5, have the a “stability order” of D-glucose > D-fructose > D-galactose >> D-mannose.33
Figure 5.

Binding of glucose switches the fluorescence of the receptor “on” upon binding.
The GlySure CIGM Sensor glucose detecting chemistry based on the chemistry outlined above and which is immobilized within a hydrogel, is highly selective to glucose and because of the intramolecular quenching mechanism is particularly resistant to quenching by endogenous quenchers. The fluorophore used is not sensitive to pH/pO2 and is therefore not sensitive to physiological changes.
This study was designed to initially validate the accuracy of the GlySure CIGM System on cardiac surgery patients then to validate the accuracy on the wider MICU patient population. The goal was to compare the systems glucose measurements against an acknowledged and widely used reference instrument and method. We also aimed to demonstrate the benefits of continuous monitoring over intermittent monitoring.
Study Location
A Cardiac trial was conducted at 2 sites in India (Care Hospitals—Nampally and Star Hospital, both in Hyderabad). A second study (MICU) was performed at 6 sites in India, all in Hyderabad. The study protocol had ethical committee approval from all of the sites involved. All participants gave their appropriate informed consent in compliance with the Declaration of Helsinki and the rules of good clinical practice. Informed consent was obtained from each patient before the start of any study-related activity.
Study Population
Between July and October 2013 the GlySure CIGM System was evaluated in 33 patients undergoing cardiac surgery. A further 14 patients undergoing treatment in MICUs were evaluated between May and July 2014. Exclusion criteria included pregnancy, history of pulmonary embolism, history of thrombosis, hypercoagulation, heparin hypersensitivity, history of heparin-induced thrombocytopenia, hypersensitivity/allergy to adhesive IV dressings, or below 18 years old.
Study Design
The aim of the studies was to compare the accuracy of the GlySure CIGM System against a reference standard, either the YSI 2300 STAT Plus (Yellow Springs Instruments, Yellow Springs, OH) or the i-STAT (Abbott Laboratories, Abbott Park, IL) as a reference standard across a range of glucose concentrations.
At all times the patients’ safety was ensured by close monitoring of the patients’ well-being. The sensor could remain in situ for up to 5 days, comparison data were taken initially at 2-hour intervals, then 4-hour intervals.
Reference Device
The GlySure sensor was inserted through the 9Fr gauge 5 lumen GlySure CVC into the RIJV with a saline flush (2-4 ml/h). Blood samples for comparison points were taken from a peripheral vein or the proximal lumen of the CVC. The GlySure CIGM System recorded a data point every 15 seconds. Comparison blood samples were time indexed on the monitor when drawn. Keep-vein-open saline infusions were used on the sensor and the sampling location. When samples were taken the saline infusion was stopped and the samples were drawn slowly to reduce the chance of sample dilution/contamination. After each blood draw the sampling site was flushed with saline.
Analysis and Data Collection
GlySure CIGM System measurements and comparison blood sample measurements were recorded in a database along with details of medications administered and any events that occurred during patient monitoring. During monitoring the hospital staff were blinded to the continuous glucose measurement.
Analysis of the data included correlation analysis, MARD (mean absolute relative difference), consensus error grid analysis. The consensus error grid (ISO 15917-2013) is a standard for quantifying the clinical accuracy of blood glucose measurements against a reference. Zone A values are considered to be clinically accurate with no risk. Zone B is considered to generally accurate with a slight risk. Bland–Altman and significance analysis will be performed to determine if there were any significant changes in accuracy with time or glucose concentration. The differences between the continuous and intermittent measurements were integrated to analyze the potential benefits of continuous monitoring.
Results
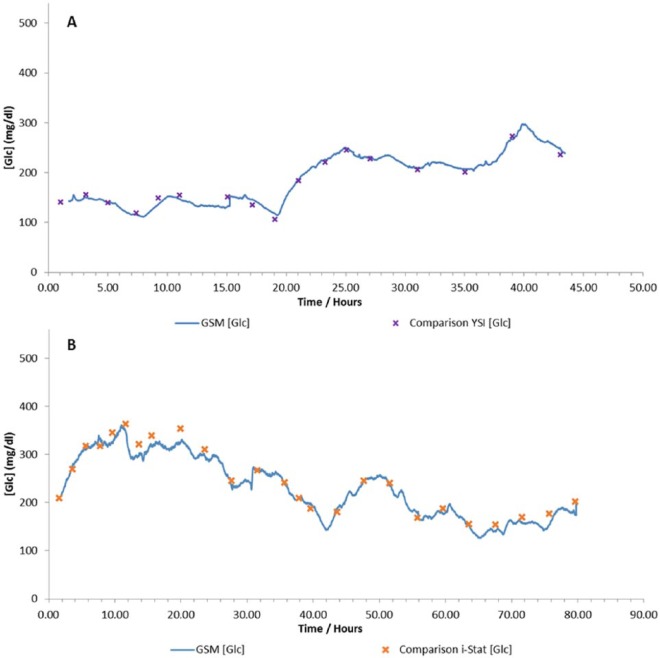
The patient populations for the Cardiac and MICU trials are shown in Table 2. The patients enrolled on the Cardiac trial had predominately undergone either coronary artery bypass grafts or valve repairs, whereas on the MICU trial the patients conditions were more diverse. Conditions monitored included pneumonia, sepsis, acute gastroenteritis, chronic kidney disease, chronic liver disease, cerebral vascular accident, meningitis, and acute pancreatitis. Examples of patient data are shown in Figure 6.
Table 2.
Patient Population.
| Cardiac patients | MICU patients | |
|---|---|---|
| n | 33 | 14 |
| Duration (hours) | 40.8 (21.1-50.7) | 56.0 (36.4-114.4) |
| Male | 22 (66.7%) | 9 (64.3%) |
| Female | 11 (33.3%) | 5 (35.7%) |
| Diabetic | 14 (42.4%) | 5 (35.7%) |
| Hypertensive | 15 (45.5%) | 6 (42.9%) |
| BMI | 25.3 (17.7-35.8) | 25.2 (21.9-30.5) |
| Age | 50.8 (19-77) | 49.4 (32-80) |
Figure 6.
Example data from the (A) Cardiac trial using a YSI as a comparison device and (B) MICU trial using an i-STAT as a comparison device.
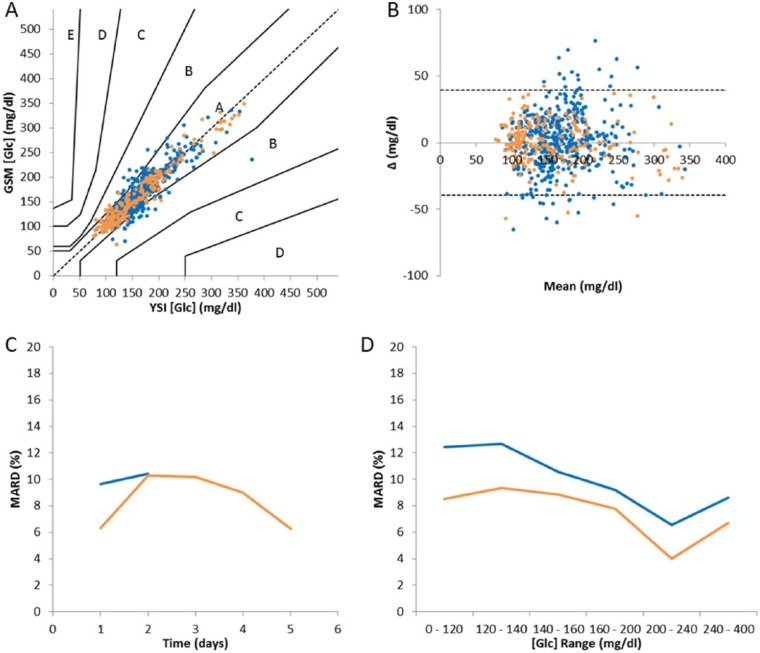
Consensus error grid (Figure 7A) analysis of the data shows that the majority of the data (88.2% Cardiac, and 95.0% MICU) fell within zone A, which is considered to be clinically accurate, and all data points fell within zones A and B. The MARD of the Cardiac trial was 9.90% and the MICU trial had a MARD of 7.95%.
Figure 7.
(A) Consensus error grid analysis; (B) Bland–Altman chart; (C) MARD versus time; (D) MARD versus glucose range. °/– Cardiac trial, °/– MICU trial.
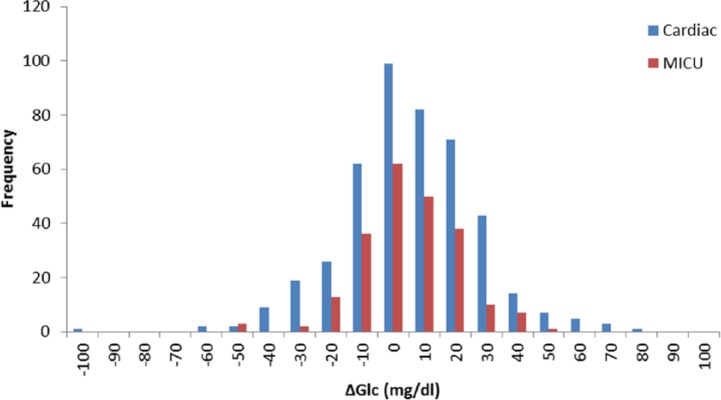
Figure 8 shows a histogram of the errors from the Cardiac and MICU trials.
Figure 8.
Histogram of errors for Cardiac and MICU patients.
Details of a t test between the errors from the 2 trials are given in Table 3. The null hypothesis was that there was no difference between the average error on the Cardiac trial and the MICU trial, α = .05 (ie, 95%).
Table 3.
t Test Between Errors During the Cardiac and MICU Trials.
| Cardiac trial | MICU trial | |
|---|---|---|
| Mean | 0.744 | –0.045 |
| Variance | 483.74 | 242.95 |
| Observations | 446 | 222 |
| Hypothesized mean difference | 0 | |
| df | 589 | |
| t Stat | 0.534 | |
| P(T<=t) 2-tailed | 0.593 | |
| t critical 2-tailed | 1.964 |
A null hypothesis cannot be rejected because P > .05, therefore there was no significance difference between the clinical data collected at the 2 sites.
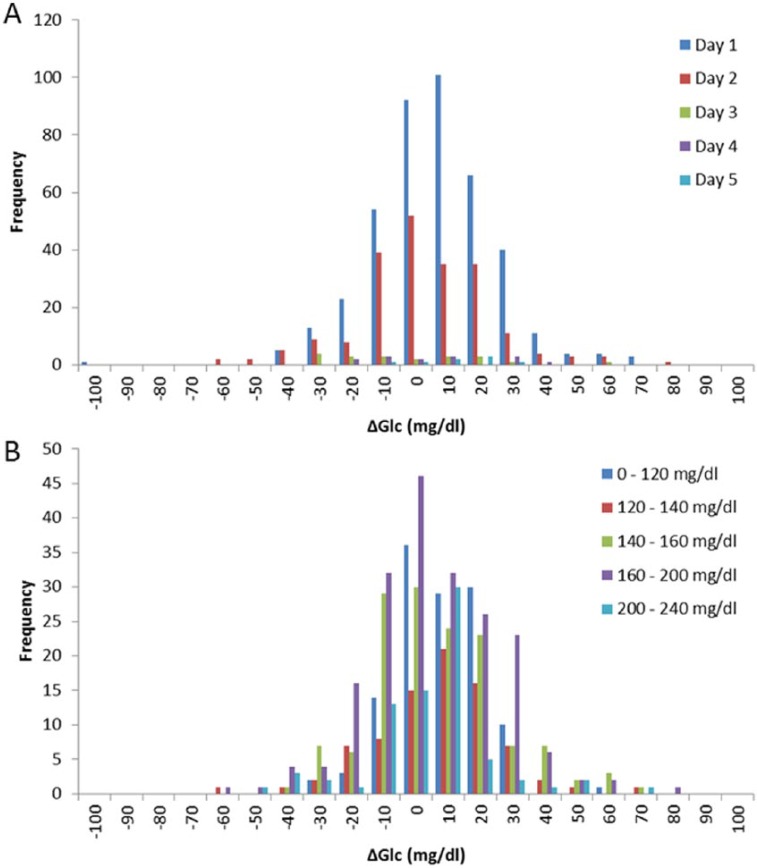
A Bland–Altman chart is shown in Figure 7B. The standard deviation of the data was 20.1 mg/dl and the 95% confidence interval is indicated. These data show that there was no discernible change in bias with changes in the concentration of glucose. Analysis of the MARD verses glucose range and time, Figure 7C and Figure 7D, show no discernible trend. Figure 9 shows histograms of errors versus time and glucose range. Significance testing was performed comparing the errors from day 1 to subsequent days (Table 4) and the lowest glucose range against higher ranges (Table 5). In all cases there was no significant difference between the analyzed data. No data was recorded below 120 mg/dl. This is because all patients were biased toward higher glucose levels and away from hypoglycemic ranges and in these critically ill patients any inducement into hypoglycemia has ethical implications.
Figure 9.
Histogram of errors (A) versus time and (B) versus glucose concentration range.
Table 4.
t Tests Between Errors on Day 1 Versus Subsequent Days in All Cases, P > .05 showing no significant differences.
| Day 1 | Day 2 | Day 3 | Day 4 | Day 5 | |
|---|---|---|---|---|---|
| Mean | 1.727 | –1.590 | –6.143 | 1.673 | 6.643 |
| Variance | 383.79 | 433.68 | 552.92 | 372.74 | 152.63 |
| Observations | 417 | 209 | 20 | 14 | 8 |
| Hypothesized mean difference | — | 0 | 0 | 0 | 0 |
| df | — | 395 | 20 | 14 | 8 |
| t Stat | — | 1.916 | 1.473 | 0.010 | –1.099 |
| P(T<=t) 2-tailed | — | 0.056 | 0.156 | 0.992 | 0.304 |
| t critical 2-tailed | — | 1.966 | 2.086 | 2.145 | 2.306 |
Table 5.
t Tests Between Errors on Between 0-120 mg/dl Versus Higher Values in All Cases, P > .05 Showing No Significant Differences.
| 0-120 mg/dl | 120-140 mg/dl | 140-160 mg/dl | 160-200 mg/dl | 200-240 mg/dl | 240-400 mg/dl | |
|---|---|---|---|---|---|---|
| Mean | 2.672 | 1.665 | 1.251 | 0.318 | –1.606 | –4.908 |
| Variance | 177.65 | 394.67 | 400.01 | 424.31 | 352.10 | 997.07 |
| Observations | 125 | 82 | 140 | 194 | 78 | 49 |
| Hypothesized mean difference | — | 0 | 0 | 0 | 0 | 0 |
| df | — | 129 | 244 | 317 | 125 | 55 |
| t Stat | — | 0.403 | 0.687 | 1.239 | 1.756 | 1.625 |
| P(T<=t) 2-tailed | — | 0.687 | 0.493 | 0.216 | 0.082 | 0.110 |
| t critical 2-tailed | — | 1.979 | 1.970 | 1.967 | 1.979 | 2.004 |
Intermittent measurements from the 2 trials had an average patient risk value of 639.6 mg.h/dl (Table 6). Using our continuous measurements we can estimate the AUC for different sampling frequencies and hence estimate the reduction in patient risk. The GlySure CIGM fiber optic fluorescent sensor samples an electronic signal every 15 seconds, but the sensor has a 90% response time of 5 minutes so if the AUC is calculated at a sampling frequency of 5 minutes a risk value can again be calculated as 84.3 mg.h/dl. From comparing these 2 values a patient risk reduction can be estimated in moving from intermittent measurement at a 2- to 4-hour sampling frequency to continuous glucose monitoring at a frequency of 5 minutes, namely an 87% reduction in patient risk. This method has not been previously/independently validated.
Table 6.
Timescale Versus Average AUC.
| Sampling frequency | Mean AUC (mg.h/dl) | Risk reduction (%) |
|---|---|---|
| 15 seconds | 46.5 | 93 |
| 1 minute | 56.8 | 91 |
| 5 minutes | 84.3 | 87 |
| 15 minutes | 135.3 | 79 |
| 1 hour | 297.3 | 54 |
| 2 hours | 430.6 | 33 |
| Intermittent | 639.6 | — |
There were 3 patients who consented to the Cardiac CE trial whose data are not included in the analysis. Two patients received a CVC but no sensor, while the other had insufficient comparison blood samples, fewer than 12, due to catheter/sensor being removed based on a clinical decision that they were no longer required . There was no evidence of fibrin deposition on any of the sensors removed from the patients (Figure 10).
Figure 10.

Sensor after removal from a patient.
Discussion
The number of data points within the A+B zones for both cardiac surgery patients and MICU patients indicates that it is safe to use up to a period of 5 days without generating data that would result in erroneous treatment. The average period of monitoring for cardiac surgery patients was 40.8 hours (21.1-50.7 hours) and 56.0 hours (36.4-114.4 hours) for the MICU patients.
In all, 47 patients were monitored during the course of these 2 trials with the GlySure CIGM System, and no adverse or serious adverse events were recorded by the participating sites that were attributable to the use of the GlySure CIGM System.
The studies showed that the GlySure CIGM System is capable of accurately measuring intravenous glucose concentrations continuously in patients with a range of clinical conditions. The aggregate MARD was 9.90% for cardiac surgery patients and 7.95% for MICU patients. The accuracy of the system does not appear to change over a 5-day period.
Participating clinicians surveyed agreed that the sensor introduction process is easy to perform and does not interfere with current practices.
The benefits of continuous over intermittent glucose monitoring can be illustrated by integrating the area between the intermittent samples and the continuous data. There are some interesting characteristics about this simple analysis. First, the more frequent the sampling, whether physical or electronic, the greater the reduction to patient risk. Second, the risk reduction in moving from intermittent to continuous measurement is at a maximum for patients that have large glucose excursions and at a minimum for patients with stable blood glucose values. Third, the risk reduction in moving from intermittent to continuous is effectively independent of the accuracy of the intermittent test methodology.
Conclusions
The GlySure CIGM System has met the design challenges of measuring intravascular glucose concentrations in critically ill patients with acceptable safety and performance criteria. The benefits of continuous glucose monitoring in reducing patient risk have been demonstrated.
Footnotes
Abbreviations: AUC, area under curve; BMI, body mass index; CAD, coronary artery disease; CE, Conformité Européenne; CIGM, continuous intravascular glucose monitoring; CVC, central venous catheter; Fr, French; ICU, intensive care unit; ISO, International Organization for Standardization; MARD, mean absolute relative difference; MICU, medical intensive care unit; PET, photoinduced electron transfer; R&D, research and development; RIJV, right internal jugular vein; WHO, World Health Organization; YSI, Yellow Springs Instruments.
Declaration of Conflicting Interests: The author(s) declared the following potential conflicts of interest with respect to the research, authorship, and/or publication of this article: BCC, NPB, CMJ, AM, and WP are full-time employees of GlySure Ltd.
Funding: The author(s) disclosed receipt of the following financial support for the research, authorship, and/or publication of this article: This work was funded by GlySure Ltd.
References
- 1. Malberg K. Prospective randomised study of intensive insulin treatment on long term survival after acute myocardial infarction in patients with diabetes mellitus. DIGAMI (diabetes mellitus, insulin glucose infusion in acute myocardial infarction) Study Group. BMJ. 1997;314:1512-1515. [DOI] [PMC free article] [PubMed] [Google Scholar]
- 2. Van den Berghe G, Wouters P, Weekers F, et al. Intensive insulin therapy in critically ill patients. N Engl J Med. 2001;345:1359-1367. [DOI] [PubMed] [Google Scholar]
- 3. Krinsley J. Effect of an intensive glucose management protocol on the mortality of critically ill adult patients. Mayo Clin Proc. 2004;79:992-1000. [DOI] [PubMed] [Google Scholar]
- 4. Kanji S. Reliability of point-of-care testing for glucose measurement in critically ill adults. Crit Care Med. 2005;33:2778-2785. [DOI] [PubMed] [Google Scholar]
- 5. Cembrowskia GS, Tran DV, Slater-Maclean L, et al. Could susceptibility to low hematocrit interference have compromised the results of the NICE-SUGAR Trial? Clin Chem. 2010;55:1193-1195. [DOI] [PubMed] [Google Scholar]
- 6. Sacks D. Tight glucose control in critically ill patients: should glucose meters be used? Clin Chem. 2009;55:1580-1583. [DOI] [PubMed] [Google Scholar]
- 7. Krinsley J, Egi M, Kiss A, et al. Diabetic status and the relationship of the 3 domains of glycemic control to mortality in critically ill patients: an international multi-center cohort study. Crit Care. 2013;17:R37. [DOI] [PMC free article] [PubMed] [Google Scholar]
- 8. Krinsley J. Glycemic control in the critically ill—3 domains and diabetic status means one size does not fit all! Crit Care. 2013;17:131. [DOI] [PMC free article] [PubMed] [Google Scholar]
- 9. Brunkhorst F. Intensive insulin therapy and pentastarch resuscitation in severe sepsis. N Engl J Med. 2008;358:125-139. [DOI] [PubMed] [Google Scholar]
- 10. NICE-SUGAR Study Investigators. Intensive versus conventional glucose control in critically ill patients. N Engl J Med. 2009;360:1283-1297. [DOI] [PubMed] [Google Scholar]
- 11. Egi M, Bellomo R, Stachowski E, French C, Hart G. Variability of blood glucose concentration and short-term mortality in critically ill patients. Anesthesiology. 2006;105:244-252. [DOI] [PubMed] [Google Scholar]
- 12. Krinsley J. Glycemic variability: a strong independent predictor of mortality in critically ill patients. Crit Care Med. 2008;36:3008-3013. [DOI] [PubMed] [Google Scholar]
- 13. Mackenzie I, Whitehouse T, Nightingale P. The metrics of glycaemic control in critical care. Intensive Care Med. 2011;37:435-443. [DOI] [PubMed] [Google Scholar]
- 14. Hirsch I. Understanding low sugar from NICE-SUGAR. N Engl J Med. 2012;367:2449-2450. [DOI] [PubMed] [Google Scholar]
- 15. Vincent J. Blood glucose control in 2010: 110 to 150 mg/dl and minimal variability. Crit Care Med. 2010;38:993-995. [DOI] [PubMed] [Google Scholar]
- 16. Makale MTBGJ. In-vivo glucose sensing. In: Cunningham D, Stenken J, eds. Commercially Available Continuous Glucose Monitoring Systems. New York, NY: John Wiley; 2010:113-156. [Google Scholar]
- 17. Rajaratnam H, Pathmanathan S. How reliable are capillary blood glucose measurements? Sri Lanka J Diabetes Endocrinol Metab. 2011;1:22-24. [Google Scholar]
- 18. Ichai C, Preiser J. International recommendations for glucose control in adult non diabetic critically ill patients. Crit Care. 2010;14:R116. [DOI] [PMC free article] [PubMed] [Google Scholar]
- 19. D’Orazio P, Burnett RW, Fogh-Andersen N, et al. Approved IFCC recommendation on reporting results for blood glucose: international federation of clinical chemistry and laboratory medicine scientific division, working group on selective electrodes and point-of-care testing. Clin Chem Lab Med. 2006;44:1486-1490. [DOI] [PubMed] [Google Scholar]
- 20. Narayanan M, Pamment R. GlySure Internal Unpublished European and USA Market Survey.
- 21. McGee D, Gould M. Preventing complications of central venous catheterisation. N Engl J Med. 2003;348:1123-1133. [DOI] [PubMed] [Google Scholar]
- 22. Doepp F, Paul F, Valdueza J, Schmierer K, Schreiber S. No cerebrocervical venous congestion in patients with multiple sclerosis. Ann Neurol. 2010;68:173-183. [DOI] [PubMed] [Google Scholar]
- 23. Ashraf T, Panhwar Z, Habib S, et al. Size of radial and ulnar artery in local population. J Pakistan Med Assoc. 2010;60:817-819. [PubMed] [Google Scholar]
- 24. Davis AP, Wareham RS. Carbohydrate recognition through noncovalent interactions : a challenge for biomimetic and supramolecular chemistry. Angew Chem Int Ed Engl. 1999;38:2978-2996. [PubMed] [Google Scholar]
- 25. Mazik M. Molecular recognition of carbohydrates by acyclic receptors employing noncovalent interactions. Chem Soc Rev. 2009;38:935-956. [DOI] [PubMed] [Google Scholar]
- 26. Cao H, Heagy MD. Fluorescent chemosensors for carbohydrates: a decade’s worth of bright spies for saccharides in review. J Fluoresc. 2004;14:569-584. [DOI] [PubMed] [Google Scholar]
- 27. Fang H, Kaur G, Wang B. Progress in boronic acid-based fluorescent glucose sensors. J Fluoresc. 2004;14:481-489. [DOI] [PubMed] [Google Scholar]
- 28. James TD, Phillips MD, Shinkai S. Boronic Acids in Saccharide Recognition Boronic Acids. Cambridge, UK: RSC; 2006. [Google Scholar]
- 29. James TD, Sandanayake KRAS, Iguchi R, Shinkai S. Novel saccharide-photoinduced electron transfer sensors based on the interaction of boronic acid and amine. J Am Chem Soc. 1995;117:8982-8987. [Google Scholar]
- 30. James TD, Sandanayake K, Shinkai S. Novel photoinduced electron-transfer sensor for saccharides based on the interaction of boronic acid and amine. J Chem Soc Chem Commun. 1994;117:477-478. [Google Scholar]
- 31. James TD. Saccharide-selective boronic acid based photoinduced electron transfer (PET) fluorescent sensors. Top Curr Chem. 2007;277:107-152. [Google Scholar]
- 32. Arimori S, Bell ML, Oh CS, James TD. A modular fluorescence intramolecular energy transfer saccharide sensor. Org Lett. 2002;4:4249-4251. [DOI] [PubMed] [Google Scholar]
- 33. Arimori S, Bell ML, Oh CS, Frimat KA, James TD. Modular fluorescence sensors for saccharides. Chem Commun. 2001;2002:1836-1837. [PubMed] [Google Scholar]
- 34. Arimori S, Bell ML, Oh CS, Frimat KA, James TD. Modular Fluorescence Sensors for Saccharides. J Chem Soc Perkin Trans. 2002;1:803-808. [PubMed] [Google Scholar]


