Abstract
Background:
Chronic continuous glucose monitoring options for animal research have been very limited due to various technical and biological challenges. We provide an evaluation of a novel telemetry device for continuous monitoring of temperature, activity, and plasma glucose levels in the arterial blood of rats for up to 2 months.
Methods:
In vivo testing in rats including oral glucose tolerance tests (OGTTs) and intraperitoneal glucose tolerance tests (IPGTTs) and ex vivo waterbath testing were performed to evaluate acute and chronic sensor performance. Animal studies were in accordance with the guidelines for the care and use of laboratory animals and approved by the corresponding animal care and use committees (Data Sciences International, Eli Lilly).
Results:
Results demonstrated the ability to record continuous measurements for 75 days or longer. Bench testing demonstrated a high degree of linearity over a range of 20-850 mg/dL with R2 = .998 for linear fit and .999 for second order fit (n = 8 sensors). Evaluation of 6 rats over 28 days with 52 daily and OGTT test strip measurements each resulted in mean error of 3.8% and mean absolute relative difference of 16.6%.
Conclusions:
This device provides significant advantages in the quality and quantity of data that can be obtained relative to existing alternatives such as intermittent blood sampling. These devices provide the opportunity to expand the understanding of both glucose metabolism and homeostasis and to work toward improved therapies and cures for diabetes.
Keywords: blood glucose, continuous glucose, diabetes, glucose sensor, rats, telemetry
Current options for obtaining glucose measurements in animal studies are limited in terms of the quality and quantity of data available. Glucometers and test strips are perhaps most commonly used. These require tail tip amputation or venipuncture, are stressful to the animal and handler, and often result in high measurement variability due to factors including measurement error, variability in the sampling process, and physiologic stress response. The use of arterial or venous cannulae can help facilitate sample collection and minimize subject and handler stress, but these require routine maintenance with blood loss and offer limited chronic patency.1 Options for continuous sampling for periods of a few days to 2 weeks include tethered automated blood sampling and some limited use of human continuous glucose monitors (CGMs), which have limited longevity and accuracy.
Amperometric electrochemical sensors have been available for over 30 years and originated with the Clark electrode.2,3 The basic principle involves application of a reference voltage to an electrode (typically a noble metal such as platinum) to oxidize a target chemical and measure the current resulting from electron transfer to the electrode. The current is proportional to the availability of the target chemical.
Many glucose sensors available today or under development are intended for use in humans with the sensor placed subcutaneously to measure glucose in interstitial fluid. These sensors are targeted at the management of diabetes where patient safety and minimal invasiveness are critical factors, thus precluding placement directly in the blood. These sensors are subject to notable biofouling due to foreign body immune response and are typically overgrown with a fibrous sheath in a matter of days. Common examples include the Dexcom 7 or G4, the Medtronic Guardian or Enlite, and the Abbott Freestyle Navigator. Most sensors are approved for use in humans for periods for up to 7 days. The sensor readings can change substantially with movement as the sensor encounters varying exposure to tissue and fluids. Notable degrees of fibrous biofouling can limit the availability of glucose and oxygen to the sensor, which results in a muted and delayed response to rapid glucose changes such as with an oral glucose tolerance test (OGTT).4,5 Substantial resources have been applied by many companies and individuals to develop advanced algorithms to model and correct for these differences.6-8 Still, the state of the art and Food and Drug Administration (FDA) requirements are such that the human subject is directed to confirm high or low readings with an independent test strip measurement before taking corrective action such as an insulin injection or consuming sugar.9
Sensing glucose directly in the blood has the potential to reduce or eliminate many of the issues commonly encountered with interstitial sensing. Cardiovascular researchers have over 30 years of experience monitoring blood pressure in arteries of animals for many months or even years with very good patency results.10,11 DSI catheters remain patent in arteries through the use of proven biocompatible polymers (primarily polyurethane) and a proprietary antithrombogenic coating on the polymer surface without the need for heparin or other postsurgical treatment. The telemetry glucose sensor has nearly identical materials and dimensions, thus providing a basis for good results for chronic glucose sensing.
The HD-XG implantable glucose device (Data Sciences International, Saint Paul, MN) presented herein provides continuous measurement of blood glucose, temperature and locomotor activity for up to 2 months or longer. This employs an electrochemical glucose oxidase (GOX) sensor placed directly in an artery. Temperature is measured within the telemetry housing and activity is derived from the telemetry receiver based on changes in signal strength related to physical movement.
Methods
The glucose telemetry device assessed is 1.4 cc and 2.2 grams. Since its availability in March 2014 it has been used exclusively in rats. The size and weight is appropriate for placement in mice, but refinements in the sensor construction and surgical procedure have been necessary to optimize surgical success and performance in mice. The transmission range is approximately 25 cm, which allows for use of multiple standard rodent cages in a cage rack. Although the revised sensors have recently been evaluated in mice in our lab, for brevity we will emphasize use in rats in this article.
The device can be turned on/off with a magnet while implanted. However, the continuous battery life is 6-8 weeks, which matches up nicely with the effective sensor life. Each time the device is turned off for more than a few hours and then turned back on, there is a stabilization period of at least 3-4 hours, so it is advantageous to leave the device on and transmitting from the time of surgery through the duration of the study. Monitoring the animal during the recovery period will help confirm surgical recovery by way of observing a stable baseline and circadian variation in glucose, temperature, and activity.
Data collection requires the use of the Dataquest® or Ponemah® acquisition system (DSI) including an individual telemetry receiver for each animal, a data matrix to power and consolidate receiver signals and a Windows-based computer system (Figure 1). The system accommodates continuous sampling from up to 16 animals or scheduled sampling of an unlimited number of animals. Each animal must be housed individually due to use of a common telemetry frequency. The software includes provisions for configuring the devices and data acquisition protocol, entering and applying calibration values, and a variety of visualization and reporting tools. Data are recorded continuously at a sample rate of 1 Hz and averaged to 10 second reporting intervals to provide a temporal resolution adequate for the detailed assessment of glucose regulation during acute challenges such as intraperitoneal or OGTTs.
Figure 1.
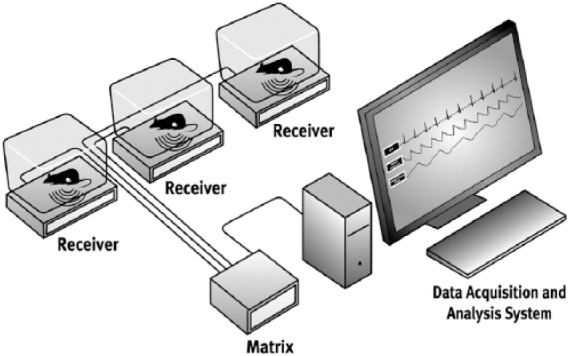
Glucose telemetry system diagram including telemetry receivers, matrix, and data acquisition computer.
The glucose telemetry device incorporates a glucose sensor (Nova Biomedical, Waltham, MA) on 1 lead and an Ag/AgCl reference electrode on a separate lead (Figure 2). The sensor is interfaced to a stainless steel helix lead with a .0125-inch diameter connector. The length of the sensor is approximately 1.4 inches (3.5 cm). The distal 0.3 inches (7.6 mm) of the sensor is 0.016 inches (0.41 mm) diameter and the remainder is 0.023 inches (0.58 mm) diameter, corresponding to the diameters of the existing DSI mouse and rat blood pressure catheters respectively. This allows leveraging a history of surgical success with similar characteristics. For reference the diameter of the descending aorta of a 175 g Sprague Dawley rat is approximately 0.059 inches (1.5 mm).
Figure 2.
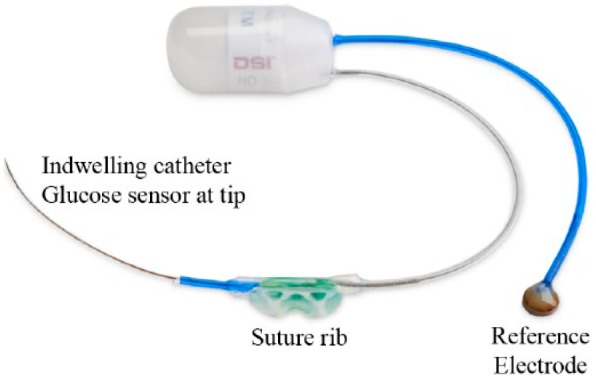
HD-XG telemetry device for continuous monitoring of glucose, temperature, and locomotor activity in rats.
The glucose sensor is based on a proven whole blood technology using GOX as a catalyst to convert glucose and oxygen into gluconic acid and hydrogen peroxide, which in turn interacts with a noble metal electrode to give up electrons and create a current proportional to the amount of glucose available (Figure 3). The Ag/AgCl reference electrode is slowly depleted during use, and the use of a relatively large separate reference electrode helps maintain signal stability and longevity while mitigating the need for a separate counter electrode and additional intricate in vivo connections.
Figure 3.
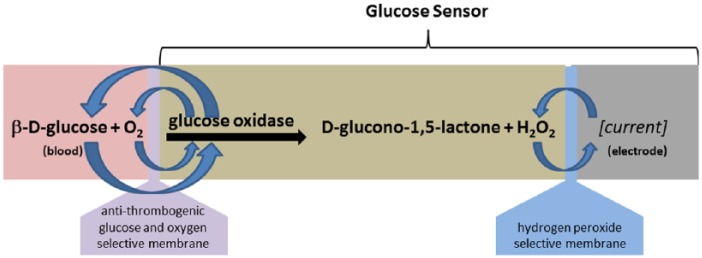
Diagram of glucose sensor with platinum electrode, H2O2 selective membrane, GOX, and Glucose+O2 selective membrane. Glucose oxidase catalyzes the reaction between glucose and oxygen to produce H2O2.
Many implementations of in vivo glucose sensors incorporate a platinum wire coated with a H2O2 selective inner membrane (such as polycarbonate) and GOX enzyme and covered by a selective outer membrane (such as nafion) designed to allow glucose and oxygen to pass, but to exclude many common interferents such as ascorbic acid, uric acid, acetaminophen, and so on (Figure 3). The sensor evaluated is based on a planar configuration with a noble metal electrode at the bottom of a well filled with GOX and covered with a biocompatible selective membrane. Details on the specific materials and construction used in the inner and outer membranes are proprietary to the sensor manufacturer. The planar construction of the whole blood sensor layers are configured for long-term in vivo enzyme stability.
The telemetric glucose device is intended to be fully implanted in a rat. The glucose sensor is placed directly in the descending aorta of a rat (Figure 4). The device is placed through a midline abdominal incision. The sensor is inserted by briefly occluding the abdominal aorta and using a 25 gauge needle with the tip bent at a 90-degree angle as a catheter introducer. The aorta is sealed and secured by placing a drop of tissue adhesive on the aorta at the insertion site and adding 2 notched tissue patch squares around the catheter with an additional drop of tissue adhesive. The Ag/AgCl reference is sutured to the inner abdominal wall and the electronics/battery module housing is placed in the abdomen and sutured into the midline abdominal muscle incision during closure using the suture rib integrated on the back side of the housing. Standard procedures are established and available regarding pre- and postsurgery analgesia and antibiotics. A detailed surgical manual and video are available from DSI (email: support@datasci.com).
Figure 4.

Surgical placement in abdominal aorta with connector anchored to back muscle in rats.
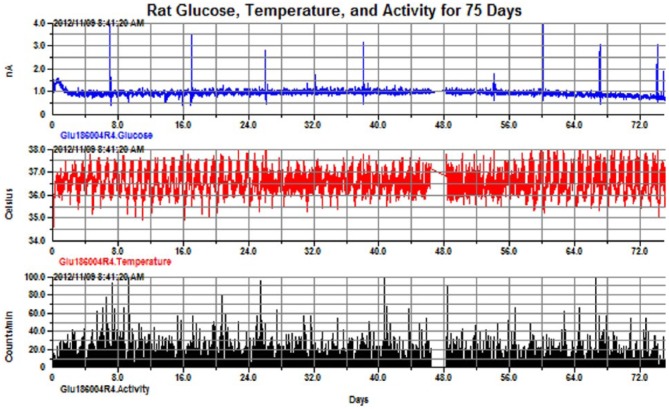
The device requires calibration against a reference such as blood samples and analytics or a standard glucometer and test strips. The devices were typically left on from the time of surgery and we observed a characteristic transient elevation in glucose values over the first 2-3 days following surgery, followed by the return of a notable circadian pattern in glucose, temperature and activity (Figure 5). This transient is primarily due to surgical response/recovery and secondarily due to acute glucose sensor stabilization. We perform an initial calibration following surgical recovery (typically 4-7 days postsurgery). The initial calibration requires collecting at least 2 samples over a minimum glucose excursion of at least 200 mg/dL with sample timing designed to accommodate potential lag (~3-5 minutes) between the descending aorta and blood sampling location such as the tip of the tail. This is typically accomplished through an intraperitoneal glucose tolerance test (IPGTT) or OGTT (Figure 6). DSI also recommends collecting single-point calibration samples twice per week throughout the study, although weekly samples are adequate for studies involving moderately hyperglycemic animals with sustained glucose levels less than 250 mg/dL (14 mmol/L) whereby loss of sensor sensitivity is typically less than 20% over the first 4 weeks following surgery (Figure 7). In our experience, the most common causes of sensitivity loss over time are degradation of the enzyme function or development of a fibrin sheath over the sensor tip. We find that the enzyme function degradation is escalated by high glucose levels, and this might be attributed to excess H2O2 and the resulting impact on the enzyme. Less common reasons for signal loss include degradation or aggressive fibrinous growth over the reference electrode. We haven’t seen any evidence of working electrode poisoning/fouling in our evaluations.
Figure 5.
Rat glucose, 75 days (top—in unconverted units of nanoamps), temperature (middle), and activity (bottom). Note the spikes in the glucose signal that indicate periods where the dynamic sensor response was confirmed via IPGTT.
Figure 6.
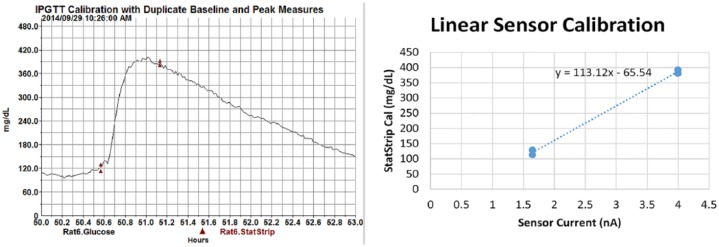
Device calibration showing use of duplicate samples and XY plot. Linear calibration provides individualized equation y = 113.1x − 65.5. Note the peak sampling time a few minutes after the observed telemetry peak to accommodate for time lag at the tail tip.
Figure 7.
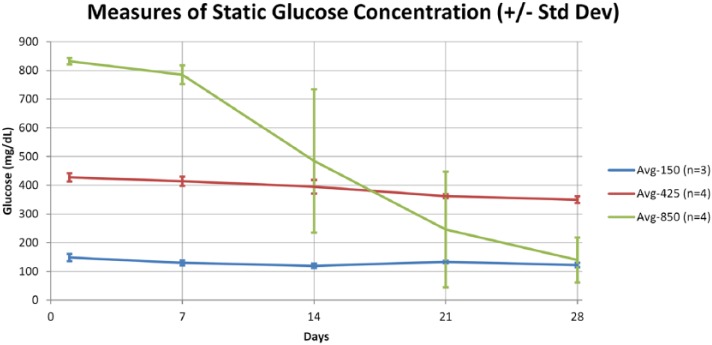
In vitro testing results at 150, 425, and 850 mg/dL for 28 days. The sensors are very stable at 425 mg/dL but start to drift notably at higher glucose levels. This drift can be corrected by collecting reference calibration values until the sensor has lost about 60% of the original sensitivity.
The accuracy and timing of the collected reference calibration points is critical to the calibration and accuracy of the telemetry sensor. The ideal calibration reference is an arterial blood sample analyzed using standard benchtop analyzers such as the YSI2300. Reasonable alternatives are available such as an accurate handheld glucometer and tail samples. We typically use the Nova StatStrip Xpress glucometer and strips (Nova Biomedical, Waltham, MA), which measures and corrects for common interferents including hematocrit, acetaminophen, maltose, galactose, and others and provides accuracy comparable to benchtop analyzers.12,13 Regardless of the sampling location and measurement device used, we strongly advocate the collection of duplicate samples to minimize sampling error, and we further recommend use of a third sample when there is more than 10% difference between the duplicate samples.
In vitro testing linearity testing involved evaluation of n = 8 sensors at glucose levels of 20, 50, 100, 200, 400, 600, 750, and 850 mg/dL in a waterbath of phosphate buffered saline (PBS) at 37 degrees C with a stir plate. Sensor drift was evaluated over 28 days using glucose waterbaths at 100, 425, and 850 mg/dL with control over water loss and periodic titration of PBS to maintain target glucose concentration. The YSI2300 (Yellow Springs Instruments, South Burlington, VT) was used to confirm glucose levels.
We performed several in vivo assessments of the acute and chronic sensor performance. Acute assessment (fa/fa study) includes the performance of an OGTT and IPGTT in both normal healthy rats (n = 4) and in DIO Zucker fa/fa rats (n = 4). In a streptozotocin (STZ) study we also induced diabetes in Sprague Dawley rats (n = 8) using STZ (60 mg/kg IP) to evaluate the acute response and disease progression toward prolonged and severe hyperglycemia. Mean absolute relative difference (MARD) was assessed in a separate ZDSD rat study (n = 6) over 28 days with daily duplicate StatStrip samples and weekly OGTT assessments using 6 samples per OGTT at t = 0, 30, 60, 90, 120, 240 minutes relative to dosing.
Chronic sensor performance was assessed in the fa/fa and STZ studies mentioned above as well as in a normoglycemic Sprague Dawley rat study. Data were recorded continuously with 10-second averages for at least 28 days in all cases. Periodic IPGTTs or IPITTs (STZ study) were performed every 1 to 2 weeks provided ongoing assessment of the dynamic sensor response as well as a basis for ongoing adjustments to the calibration as needed. IPGTT samples were collected from the tail via venipuncture and consisted of a minimum of duplicate samples at baseline and 3-5 minutes following the peak as observed on the telemetry signal.
In the STZ study we also placed Medtronic Guardian CGM sensors on the same rats to facilitate comparison of arterial blood glucose sensing versus interstitial glucose sensing. The CGM sensors were applied at the same time as the rats were dosed with streptozotocin to induce diabetes. These sensors were placed subcutaneously on the back with the telemetry module secured with tape and adhesive and the tape is treated with a green apple spray to prevent tampering. The implantable and interstitial sensors were calibrated using daily duplicate tail samples from the StatStrip Xpress glucometer.
Results
We successfully obtained high quality glucose signals for up to 75 days in the Sprague Dawley study and 28 days or longer in the fa/fa, ZDSD, and STZ studies involving diabetic rats with sustained glucose values up to 750 mg/dL. Precommercialization (alpha/beta) studies conducted by researchers outside of DSI resulted in a success rate of 147/180 (73%) from the time of surgery through 28 days postsurgery, accounting for both surgical and technical failures. Postcommercialization 28-day success rates have increased above a target level of 80%.
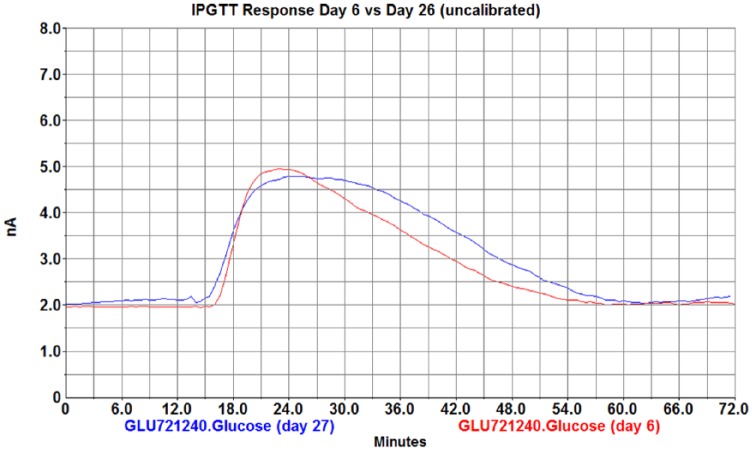
Although we haven’t perfectly categorized all failures, the 20% loss incorporates all failure modes including initial and chronic mortality (<5%), mechanical or electrical failure of the telemetry devices such as broken sensors (5-10%), and signal degradation over time due to various causes (5-10%) including hyperglycemia, fibrous sensor overgrowth, or reference sensor issues. Each of these occur to varying degrees over the 28-day duration. At the time of explantation most sensors showed minimal fibrous growth at 28 days and maintained rapid response to glucose challenges throughout 28 day and longer studies (Figure 8).
Figure 8.
IPGTT (3 g/kg) results at day 6 (red) and day 27 (blue) showing consistent baseline and peak response.
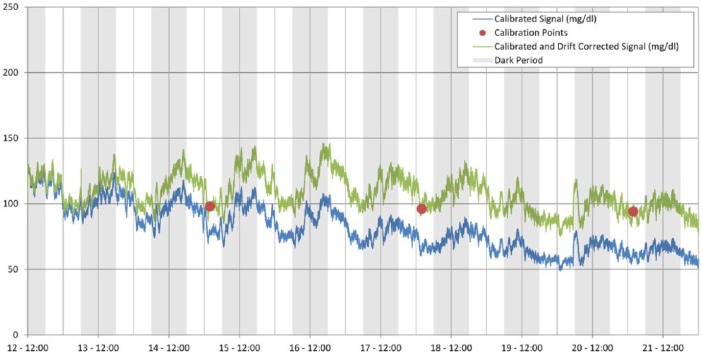
In vitro results demonstrated that the sensor rate of degradation increases as a function of blood glucose concentration. Both in vivo and in vitro results demonstrated that at glucose levels exceeding 425 mg/dL, the sensors drifted notably (toward zero) and required periodic calibration points to compensate for this drift up until the sensors have lost 50-60% of their original sensitivity (Figure 7, 9), at which point the signal is considered inadequate.
Figure 9.
In vivo sensor drift over 9 days and correction via calibration values. Sensor drift is linear enough and slow enough for 1-2 calibrations/week to provide adequate correction of the baseline without signal distortion.
In vitro linearity results (n = 8) showed an average R2 of .998 for linear fit and .999 for second order fit of glucose concentration vs sensor output (Table 1, Figure 10). This high degree of linearity supports a simple application of 2-point calibration values to derive a slope and intercept to map sensor output in nanoamps to glucose values in the desired units of mg/dL or mmol/L. In vivo accuracy over 28 days in the ZDSD study (n = 6) produced average error of 3.8% and MARD of 16.6% (Table 2, Figure 11).
Table 1.
Linear and Second Order Fit to n = 6 Sensors at Glucose Concentrations of Approximately 20, 50, 100, 200, 400, 600, 750, 850 mg/dL.
| Line fits and R2 | |||||||||
|---|---|---|---|---|---|---|---|---|---|
| P71-S1 | P71-S2 | P71-S3 | P71-S4 | P74-S1 | P74-S2 | P74-S3 | P74-S4 | Average | |
| x coef | 202.5595 | 206.1809 | 314.2437 | 218.3638 | 182.8645 | 205.3441 | 222.3670 | 222.3943 | 221.7897 |
| Intercept | −36.9354 | −38.2946 | −94.9531 | −35.9948 | −49.1950 | −60.6936 | −163.1160 | −42.1438 | −65.1658 |
| R2 | .9992 | .9989 | .9941 | .9990 | .9990 | .9991 | .9974 | .9979 | .9981 |
| Second order poly fits and R2 | |||||||||
| P71-S1 | P71-S2 | P71-S3 | P71-S4 | P74-S1 | P74-S2 | P74-S3 | P74-S4 | ||
| x^2 coef | 5.7834 | 6.8957 | 36.4643 | 7.3630 | 4.4833 | 5.5423 | 12.1146 | 10.9721 | 11.2024 |
| x coef | 176.4784 | 175.6263 | 197.9964 | 187.6789 | 159.7632 | 179.2818 | 159.3513 | 177.1182 | 176.6618 |
| Intercept | −21.3024 | −20.2732 | −37.8288 | −19.0989 | −32.8541 | −43.2117 | −105.5037 | −17.5080 | −37.1976 |
| R2 | 1.0000 | .9999 | .9997 | 1.0000 | .9998 | .9998 | .9998 | .9999 | .9999 |
Resulting R2 of .998 for linear fit and .999 for second order fit demonstrate a very linear relationship between glucose levels and sensor output and support the simple application of 2-point linear calibration values.
Figure 10.
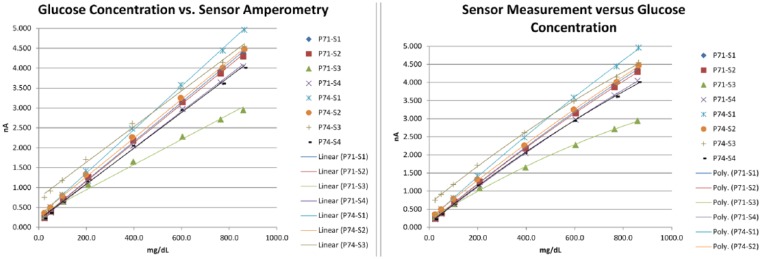
In vitro linearity including linear and second order curve fitting in 8 sensors.
Table 2.
In Vitro MARD Assessment for 28 Days With 52 Samples per n = 6 Rats.
| Rat ID | n | Min cal | Max cal | Avg err (%) | MARD (%) |
|---|---|---|---|---|---|
| 1 | 52 | 112.0 | 315.0 | −3.6 | 15.6 |
| 2 | 52 | 111.0 | 376.5 | 5.8 | 20.0 |
| 3 | 52 | 121.5 | 319.0 | 8.9 | 16.4 |
| 4 | 52 | 103.0 | 408.0 | 0.0 | 17.6 |
| 5 | 52 | 108.0 | 395.0 | 4.8 | 18.5 |
| 6 | 52 | 119.0 | 314.0 | 6.7 | 11.2 |
| Avg | 52 | 112.4 | 354.6 | 3.8 | 16.6 |
Overall MRD of 3.8% and MARD of 16.6%.
Figure 11.
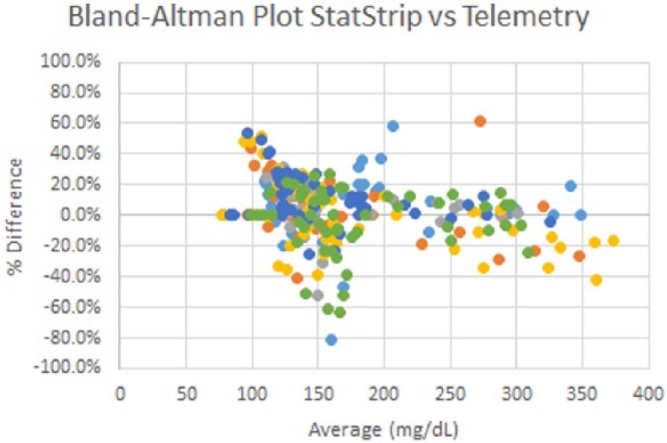
Bland–Altman plot for strip vs telemetry glucose measurements representing 52 data points over 28 days for n = 6 ZDSD rats.
Figure 12 shows an OGTT and IPGTT in the same normal and insulin-resistant rats, with intermittent tail samples provided for reference. We observed relevant additional detail in the continuous telemetry signal relating to peak amplitude, time to peak amplitude, and area under the curve. The rising slope of the curve can be used to characterize glucose uptake and the falling slope can be used to further characterize glucose clearance rates. The devices have also been leveraged in separate studies to provide acute measurements during hyperglycemic clamp studies and to characterize fasting/refeeding response.
Figure 12.
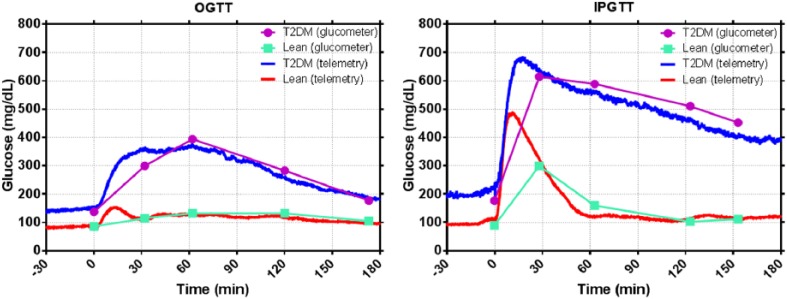
OGTT (left) and IPGTT (right) from lean (n = 4) and insulin-resistant (n = 4) rats.
Many early studies were performed in healthy Sprague Dawley rats to establish calibration procedures and assess the chronic performance of the sensors. We have routinely recorded data for 60-90 days (Figure 5) in these normal healthy populations. We have also collected data showing model development and disease progression in both insulin-deficient and insulin-resistant rat models (Figure 13) for 28 days and longer.
Figure 13.

Insulin-resistant (left, n = 4/group) and insulin-deficient (right, n = 11) disease model progression.
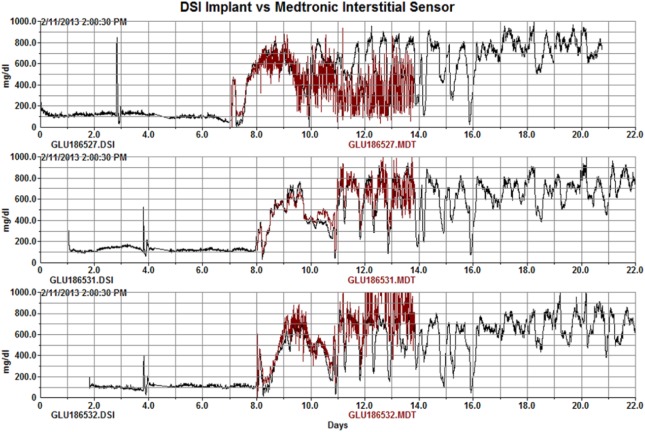
We have performed a limited evaluation of the blood sensors vs interstitial sensors. Figure 14 shows the comparison of Medtronic interstitial CGM sensors vs the HD-XG arterial sensor on the same rats in the STZ study. The CGM and arterial sensors correlated nicely for 4-7 days with the CGM sensors becoming increasingly noisy and eventually failing within 7 days. Others have reported viable interstitial signals up to 1714 or 2815 days in rats with varying success rates and calibration requirements.
Figure 14.
MDT vs XG glucose comparison in 3 rats following streptozotocin dosing. The interstitial MDT signals degrade over the course of 6 days.
For the 2-month durations for which the HD-XG has been evaluated, there were generally minimal but varying degrees of fibrous growth observed on the sensor at the time of explantation. To the degree that fibrous growth is observed on the sensors, it appears to be a result of endothelial irritation and extends from the endothelium of the vessel wall to encompass the sensor tip. In most cases this has not caused any observed effect on the ability to measure glucose, but in a few severe cases it has contributed to a lower baseline and a reduced response to dynamic glucose changes such as with IPGTT (Figure 15). This effect is due to reduced availability of glucose and/or oxygen to the sensor.
Figure 15.
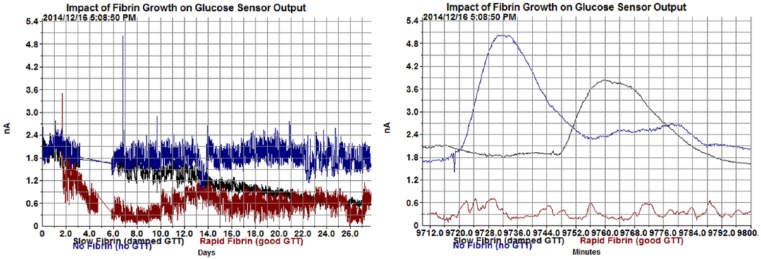
Severe encapsulation can lead to a reduced baseline and slow response to dynamic changes such as a glucose tolerance test as shown here on the right at 7 days postsurgery. Note that the rapid fibrin growth sensor shows no detectable response to GTT at 7 days postsurgery.
Discussion
Implantable arterial glucose telemetry presents several advantages over existing alternatives including the ability to automatically record continuous data profiles over periods of many weeks without stress to the rodent subjects and their handlers. However, there are some tradeoffs and this method will complement, rather than replace existing methods. Table 3 summarizes the tradeoffs of implantable telemetry versus the common glucose monitoring techniques of using tail samples and test strips as well as using indwelling arterial or venous catheters in conjunction with standard benchtop analysis. The need for periodic in vivo calibration means that the use of telemetric glucose devices does not completely obviate the need for manual sampling. It is critical to use accurate and representative calibration points, paying close attention to sampling methods and measurement accuracy. It is particularly important to pay attention sample timing when doing multipoint calibrations as calibration accuracy can be impacted by time lag in glucose values between the arterial glucose measured by telemetry and the reference sampling location such as the tail tip (Figure 5).
Table 3.
Comparison of Implantable Telemetry to 2 Common Glucose Sampling Methods.
| Sampling attribute | Tail samples/test strips | Arterial/venous samples and benchtop analysis | Implantable telemetry |
|---|---|---|---|
| Number of samples per day | Many (subject to blood volume restrictions) | Limited due to blood volume restrictions | Unlimited (continuous—every second) |
| Accuracy | Moderate | High | High (dependent on calibration) |
| Sample variability | Moderate | Low | Very low |
| Stress induced (during sampling) | High | Moderate | None |
| Ability to measure other blood chemistries | No | Yes (insulin, triglycerides, etc) | No |
| Other physiologic parameters | None | None | Temperature, locomotor activity |
| Surgery | Very minor (poke or minor tail snip) | Minor (initial placement of arterial or venous sampling lines) | Minor (SubQ) to major (IP) initial placement of device and arterial sensor |
| Cost | Low | Moderate | High |
Bold cells are the favorable attributes.
Due to the cost and surgery required, implantable glucose telemetry will not be appropriate for all study types. For example in drug development it will be highly valuable for late-stage discovery screening of drugs undergoing safety assessment studies with a goal of FDA submission, but it may be less appropriate for high-throughput phenotyping of animal models or rapid screening of a large number of candidate compounds. In basic research applications it will be ideal for characterizing subtle details in glucose metabolism and treatment effects, but may not be necessary to establish the significant differences between healthy and fully diabetic populations such as with disease progression.
Sensor linearity is excellent and allows for a relatively simple 2-point linear calibration with opportunity to slightly improve calibration accuracy using a second order fit. The relatively high MARD of 16.6% may be due in part to actual time and amplitude differences between the arterial glucose and the glucose available at the tip of the tail. These data were based on early alpha testing in early 2013 and would be improved in a follow up study through use of a more accurate reference and through refinements in the calibration procedure that have occurred over the past 2 years.
Conclusions
We have demonstrated the functionality of a novel glucose sensor over a range of dynamic glucose challenges and for over 2 months of continuous use in rats. Placing the sensors directly in arterial blood provides a direct plasma glucose measurement without the degree of complications of biofouling and signal degradation common with interstitial sensors. Good sensor linearity (R2 = .998) over a range of 20-850 mg/dL allows for a relatively simple calibration procedure that continues to evolve to improve on our initial MARD of 16.6%. The current success rate of >80% at 28 days makes this a viable option for many research settings. The continuous data profiles made available through the use of implantable glucose telemetry will enable advances in the understanding of glucose metabolism and homeostasis in animal research models and will contribute to improved therapies and cures for diabetes.
Footnotes
Abbreviations: BGM, blood glucose meter; CGM, continuous glucose monitor; DSI, Data Sciences International; FPG, fasting plasma glucose; GOX, glucose oxidase; IPGTT, intraperitoneal glucose tolerance test; MARD, mean absolute relative difference; MRD, mean relative difference; OGTT, oral glucose tolerance test; STZ, streptozotocin; YSI, Yellow Springs Instruments.
Disclosures: RB, ST, HB, KW, and MF are full-time employees of Data Sciences International, Inc and may own company stock. LO, MM, AC, and TC are full-time employees of Eli Lilly and Company and may own company stock.
Declaration of Conflicting Interests: The author(s) declared no potential conflicts of interest with respect to the research, authorship, and/or publication of this article.
Funding: The author(s) disclosed receipt of the following financial support for the research, authorship, and/or publication of this article: This work was funded by Data Sciences International, Inc and Eli Lilly and Company.
Reference Listing
- 1. Yoburn BC, Morales R, Inturrisi CE. Chronic vascular catheterization in the rat: comparison of three techniques. Physiol Behav. 1984;33(1):89-94. [DOI] [PubMed] [Google Scholar]
- 2. Clark L, Lyons C. Electrode systems for continuous monitoring in cardiovascular surgery. Ann NY Acad Sci. 1962;102:29. [DOI] [PubMed] [Google Scholar]
- 3. Severinghaus JW, Astrup PB. History of blood gas analysis. IV. Leland Clark’s oxygen electrode. J Clin Monitoring. 1986;2(2):125-139. [DOI] [PubMed] [Google Scholar]
- 4. Cengiz E, Tamborlane WV. A tale of two compartments: interstitial versus blood glucose monitoring. Diabetes Technol Ther. 2009;11(suppl 1):S11-S16. doi: 10.1089/dia.2009.0002. [DOI] [PMC free article] [PubMed] [Google Scholar]
- 5. Kulcu E, Tamada JA, Reach G, Potts RO, Lesho MJ. Physiological differences between interstitial glucose and blood glucose measured in human subjects. Diabetes Care. 2003;26(8):2405-2409. doi: 10.2337/diacare.26.8.2405. [DOI] [PubMed] [Google Scholar]
- 6. Wang J. Review: glucose biosensors: 40 years of advances and challenges. Electroanalysis. 2001;13(12):983-988. [Google Scholar]
- 7. Rebrin K, Sheppard NF, Jr, Steil GM. Use of subcutaneous interstitial fluid glucose to estimate blood glucose: revisiting delay and sensor offset. J Diabetes Sci Technol. 2010;4(5):1087-1098. doi: 10.1177/193229681000400507. [DOI] [PMC free article] [PubMed] [Google Scholar]
- 8. Bequette WB. Continuous glucose monitoring: real-time algorithms for calibration, filtering, and alarms. J Diabetes Sci Technol. 2010;4(2):404-418. doi: 10.1177/193229681000400222. [DOI] [PMC free article] [PubMed] [Google Scholar]
- 9. Sacks DB, Arnold M, Bakris GL, et al. Guidelines and recommendations for laboratory analysis in the diagnosis and management of diabetes mellitus. Diabetes Care. 2011;34(6):e61-e99. doi: 10.2337/dc11-9998. [DOI] [PMC free article] [PubMed] [Google Scholar]
- 10. Brooks D, Horner RL, Kozar LF, Waddell TK, Render CL, Phillipson EA. Validation of a telemetry system for long-term measurement of blood pressure. J Appl Physiol. 1996;81(2):1012-1018. [DOI] [PubMed] [Google Scholar]
- 11. El-Mas MM, Abdel-Rahman AA. Longitudinal studies on the effect of hypertension on circadian hemodynamic and autonomic rhythms in telemetered rats. Life Sci. 2005;76:901-915. [DOI] [PubMed] [Google Scholar]
- 12. Karon B, Griesmann L, Scott R, et al. Evaluation of the impact of hematocrit and other interference on the accuracy of hospital-based glucose meters. J Diabetes Technol Ther. 2008;10(2):111-120. doi: 10.1089/dia.2007.0257. [DOI] [PubMed] [Google Scholar]
- 13. Peterson RG, Brockway R. Assessment of Nova biomedical statstrip glucose meters and test strips in rat glucose studies. Poster presented at: Experimental Biology Annual Meeting; April 21-25, 2012; San Diego, CA. [Google Scholar]
- 14. Ailllon DV, Naylor E, Harmon HP, et al. A two-week continuous glucose monitoring system for subcutaneous implantation in rodents. Poster presented at: American Diabetes Association 74th Scientific Sessions; June 13-17, 2014; San Francisco, CA. [Google Scholar]
- 15. Klueh U, Kaur M, Qiao Y, Kreutzer DL. Critical role of tissue mast cells in controlling long term glucose sensor function in vivo. Biomaterials. 2010;31(16):4540-4551. [DOI] [PMC free article] [PubMed] [Google Scholar]


