Abstract
Purpose
Protein kinase C α (PKCα) is abundantly expressed in rod bipolar cells (RBCs) in the retina, yet the physiological function of PKCα in these cells is not well understood. To elucidate the role of PKCα in visual processing in the eye, we examined the effect of genetic deletion of PKCα on the ERG and on RBC light responses in the mouse.
Methods
Immunofluorescent labeling was performed on wild-type (WT), TRPM1 knockout, and PKCα knockout (PKC-KO) retina. Scotopic and photopic ERGs were recorded from WT and PKC-KO mice. Light responses of RBCs were measured using whole-cell recordings in retinal slices from WT and PKC-KO mice.
Results
Protein kinase C alpha expression in RBCs is correlated with the activity state of the cell. Rod bipolar cells dendrites are a major site of PKCα phosphorylation. Electroretinogram recordings indicated that loss of PKCα affects the scotopic b-wave, including a larger peak amplitude, longer implicit time, and broader width of the b-wave. There were no differences in the ERG a- or c-wave between PKCα KO and WT mice, indicating no measurable effect of PKCα in photoreceptors or the RPE. The photopic ERG was unaffected consistent with the lack of detectable PKCα in cone bipolar cells. Whole-cell recordings from RBCs in PKC-KO retinal slices revealed that, compared with WT, RBC light responses in the PKC-KO retina are delayed and of longer duration.
Conclusions
Protein kinase C alpha plays an important modulatory role in RBCs, regulating both the peak amplitude and temporal properties of the RBC light response in the rod visual pathway.
Keywords: protein kinase C, b-wave, rod bipolar cell, electroretinogram
Electroretinogram recordings and single cell recordings of rod bipolar cells (RBCs) were compared between wild-type and PKCa knockout mice. The results indicate an important role for Pkcα in accelerating the kinetics of RBC light responses, particularly for bright intensities.
Bipolar cells in the retina carry light-elicited signals from photoreceptors (rods and cones) to amacrine cells and ganglion cells. Two basic types of bipolar cells are present in the mammalian retina: rod bipolar cells (RBCs) and cone bipolar cells (CBCs).1
Rod and cone photoreceptors respond to increases in light intensity by hyperpolarizing and reducing the rate of glutamate release at the synapse.2,3 In terms of the polarity of light responses, bipolar cells can be classified into OFF and ON bipolar cells, with mammalian RBCs all having ON responses. OFF-CBCs express ionotropic glutamate receptors and, therefore, hyperpolarize when synaptic glutamate levels fall in the light.4,5 Rod bipolar cells and ON-CBCs, on the other hand, express a unique metabotropic glutamate receptor, mGluR6, which is negatively coupled to the TRPM1 cation channel, so that the channel opens and depolarizes the cell when light intensity increases and the synaptic glutamate concentration falls.6–11
The rod to RBC synapse transmits visual information in very dim (scotopic) light. The sensitivity is such that the RBC is able to detect and transmit single photon responses from one of the 20 to 40 rods (in mouse) from which it receives input.12,13 In bright (photopic) light, rods are saturated and the visual signal is transmitted from the less sensitive, but faster cone photoreceptors to ON- and OFF-CBCs. In the intermediate (mesopic) light range, overlap, and intermixing of the rod and cone pathways occurs via gap junctions between rod and cone synaptic terminals.14,15
Protein kinase C α (PKCα) is abundantly expressed in RBCs, so much so that it is used as a cell marker to identify RBCs in retinal immunohistochemistry.16,17 Yet the physiological role of PKCα in RBCs is not well understood. Protein kinase C alpha is a serine/threonine protein kinase that undergoes calcium-dependent translocation from the cytosol to the plasma membrane, where it is activated upon binding to diacylglycerol (DAG).18 Because of its distribution throughout the RBC, PKCα is likely to have several targets within these cells, and to have multiple effects on their physiological properties. The light response of RBCs is reflected in the b-wave of the scotopic ERG.19–22 In mice lacking PKCα (PKCα knockout [PCK-KO]) the scotopic b-wave is reported to be delayed and to exhibit a prolonged recovery time.23 Within the RBC terminal, PKCα has been shown to regulate the dynamics of the actin cytoskeleton, affecting both the morphology of the terminal and synaptic vesicle exocytosis,24 and to downregulate gamma-aminobutyric acid (GABAC) receptor function.25 Within the RBC dendrites, phosphorylation by PKCα has been shown to enhance the TRPM1 current, though it is not clear whether this is a direct result of phosphorylation of the channel or of another component in the signal transduction pathway.26 Here, we have examined the effect of genetic knock out of PKCα (PKC-KO) on retinal and RBC light responses in mouse in greater detail than has previously been reported.
Methods
Mice
All animal procedures were in accordance with the National Institutes of Health guidelines and were approved by the Institutional Animal Care and Use Committees at Oregon Health & Science University (Portland, OR, USA) and Baylor College of Medicine (Houston, TX, USA). The PKC-KO mouse strain is B6:129-Pkrca (tm1Jmk)/J, stock number 009068 from Jackson Laboratory (Bar Harbor, ME, USA).27 The PKC-KO mice were crossed with C57BL6 mice to generate heterozygous breeding pairs. The litters were genotyped according to the PCR protocol from the Jackson Laboratory, using as primers: 8441: CCAAGTGTGAAGTGTGTGAG (WT and KO, forward), 8442: AGCTAGGTCCTGTTGGTAAC (WT, reverse) and 8444: GCGCATCGCCTTCTATCGC (KO, reverse). TRPM1-KO mice have been described previously.10 TRPM1-PKC double-KO mice were generated by breeding PKC-KO and TRPM1-KO mice, and the genotypes confirmed by PCR.
Intravitreous Injections
A 34-G needle attached to a Nanofil syringe (World Precision Instruments, Sarasota, FL, USA) pierced the sclera 0.5-mm posterior to the limbus. The needle was then inserted at a 45° angle, 1 mm into the vitreous of an anesthetized mouse (intraperitonealy [IP] 50 mg/kg ketamine and 5 mg/kg xylazine). While the contralateral eye was injected with saline only, 20 mM L-2-amino-4-phosphonobutyrate (L-AP4, or APB), an agonist of mGluR6,28 in saline was injected into one eye. Total injected volume was 3 to approximately 4 μl.
Immunohistochemistry
Mouse retina sections were prepared and processed for immunofluorescence according to a previously described protocol.10 For light-adapted retina sections, the mice were exposed to 2 to 6 hours of indoor light before being killed and the retinas were removed in indoor light. For dark-adapted retina sections, the mice were kept in darkness for 24 hours before they were killed and the retinas were removed in the dark under dim red light. A mouse monoclonal PKCα antibody (Novus Biologicals, Littleton, CO, USA) was applied to retina sections from light-adapted and dark-adapted wild-type (WT) mice, as well as light-adapted TRPM1-KO and TRPM1-WT mice10 at a dilution of 1:5000, and immunoreactivity was visualized with an anti-mouse IgG antibody coupled to Alexa Fluor 594 (Molecular Probes, Eugene, OR, USA). Frozen retina sections from light-adapted PKC-KO and PKC-WT littermates were incubated with the following antibodies: rabbit anti-phospho-serine (1:250; Cell Signaling, Danvers, MA, USA), rabbit anti-phosphothreonine (1:100; Cell Signaling), human anti-TRPM129 (1:1000), sheep anti-mGluR630 (1:100), and immunoreactivity revealed with either anti-rabbit, anti-human, or anti-sheep IgG secondary antibodies coupled to Alexa-594 (all diluted 1:1000; Molecular Probes). Fluorescence images of retina sections were acquired with an Olympus FluoView FV1000 confocal microscope using a ×60/1.42 oil immersion objective (Center Valley, PA, USA). Image brightness and contrast were enhanced using Pixelmator (Pixelmator, Vilnius, Lithuania).
Western Blot
Equal quantities of retinal proteins from TRPM1-KO and TRPM1-WT littermates were subjected to electrophoresis on precast 4% to 12% polyacrylamide gradient gels (Novex; Invitrogen, Carlsbad, CA, USA). The separated proteins were electrophoretically transferred to polyvinylidene difluoride (PVDF) membranes, which were then probed with a mouse anti-PKCα antibody (1:10,000; Novus Biologicals). An anti-mouse IRDye 800CW secondary antibody (Li-Cor, Lincoln, NE, USA) was used at a dilution of 1:10,000, and visualized with an Odyssey infrared imaging system (Li-Cor).
Electroretinogram
Scotopic ERG.
Electroretinograms were recorded from PKC-KO and WT mouse littermates. Mice were dark-adapted overnight (>12 hours) and prepared for recording under dim red light. Initial anesthesia was achieved via intraperitoneal injection of ketamine:xylazine (100:10 mg/kg), and maintained with supplemental 30:3 mg/kg anesthesia injections approximately every 35 minutes. Body temperature was maintained between 35.5°C to 36.5°C by placing the mouse on a water-circulated heating pad and monitoring its temperature with a rectal thermometer. Before ERG recording, the pupil was dilated with phenylephrine (2.5%) and tropicamide (1%) and the cornea was anesthetized with topical proparacaine (1.0%). A custom-made cone placed over the snout allowed delivery of 95% O2 and 5% CO2, which helped minimize breathing artifacts during recording. A platinum needle electrode bent at 90° was placed in contact with the center of the cornea with a small amount of 2.5% methylcellulose gel, and covered with a contact lens to serve as the active electrode. Similar platinum reference and ground electrodes were placed in the forehead and tail, respectively. Following setup, the mouse and heating plate were advanced into the Ganzfeld in complete darkness and ERG recording began following an additional 12 minutes of dark adaptation. Light stimuli were provided by custom-made light-emitting diode (LED) photoflash units. The stimulus strength could be controlled by altering the flash duration under computer control. A 3.0 log unit glass neutral density filter was used to further extend the stimulus strength range. Flash intensities were measured using a photometer (Model IL1700; International Light, Newburyport, MA, USA) fitted with a scotopic filter in integrating mode that gave results as scotopic (sc) candela second per square meter. Scotopic and photopic ERGs were amplified at a gain of 5000, and were band-pass filtered (0.1–1 kHz). Data were acquired with a National Instruments data acquisition board (sampling rate: 10 kHz; National Instruments, Austin, TX, USA). Traces were recorded with customized software (ERGTool 1.0a20; Richard Weleber, Casey Eye Institute, Portland, OR, USA).
Full-field, scotopic ERGs were recorded to a series of flashes ranging between −4.5 and 2.27 log(cd-s/m2). Electroretinograms were the averages of 8 to 25 responses for dim intensities, up to −1 log(cd-s/m2). For intensities above −1 log(cd-s/m2), three trials were averaged. For brighter stimuli above 1 log(cd-s/m2), each ERG was recorded to two flashes. The interflash intervals were 10 seconds for the −4.5 to −1 log(cd-s/m2) flashes, 20 seconds for the −1 to 0 log(cd-s/m2) flashes, 30 seconds after the 0 log(cd-s/m2) flash, 60 seconds after the 1 log(cd-s/m2) flash, and 120 seconds after 2 log(cd-s/m2) flash.
Photopic ERG.
Full-field photopic ERGs were recorded to a series of flashes ranging from 0.6 to 2.27 log(cd-s/m2), after the mouse was light-adapted for 5 minutes to 100 cd/m2 steady white light. The photopic ERG traces were averages of 30 responses.
Paired-Flash ERG.
Paired-flash ERGs were recorded at a stimulus strength of either −2.29 or −1.5 log(cd-s/m2) at variable interstimulus intervals. To measure recovery from photo-bleaching, dark-adapted mouse eyes were bleached for 210 ms and the recovery ERG was recorded with two flash intensities (−1.59 or 2.22 log[cd-s/m2]) at different times after photo-bleach.
ERG Data Analysis
The scotopic ERG data were processed and analyzed using MATLAB software (version R2006a; MathWorks, Natick, MA, USA). The start of flash was set to time zero of the ERG recording. The baseline was set to the average of the 3 ms recording before the flash, and the peak of the a-waves were measured between 5 and 30 ms after the flash without low-pass filtering. The implicit time of the a-wave was measured from the start of the flash to the peak of the a-wave. For b-waves, the oscillatory potentials (OP) were removed from the signals by a digital filter using the filtfilt function in MATLAB (low-pass filter; FC 58 Hz). The b-wave amplitude (the peak during 25–350 ms) was calculated from the baseline or from the a-wave trough if present. The implicit time and time to 5% of the b-wave were the times measured from the start of the flash to either the peak of the b-wave or to 5% of the peak, respectively. The full width half maximum (FWHM) of a-waves and b-waves were the full duration at half maximum of the peak of a-wave and b-wave, respectively, which were measured using MATLAB programs.
The relationship of the b-wave peak amplitude versus stimulus strength was fitted with Hill functions for PKC-KO and WT mice. Separate Hill functions were used to fit responses to flashes less than 0.1 cd.s/m2 and to flashes greater than 0.1 cd.s/m2, because the a-wave was only evident for flash strengths above 0.1 cd.s/m2. The maximum peak amplitude (Vmax) and the stimulus strength required to reach half of the maximum response (K50) were derived from the Hill functions for flashes below 0.1 cd.s/m2.
Similar analysis was done with the photopic ERG recordings except that photopic ERGs were low pass filtered with filtfilt function in MATLAB at an FC of 35 Hz to remove the OPs. Paired-flash ERGs were analyzed by subtracting the test response from the probe response, then the subtraction was normalized with the test response and plotted versus the interval time. To assess recovery after photo-bleaching, ERGs were recorded to flashes at different intervals following photo-bleach. The peak amplitudes of the a- and b-waves were normalized with the responses before bleaching, and plotted against the time after photo-bleach. All the data points were averaged and plotted, with the mean and SEM, using Origin (OriginLab; Northampton, MA, USA). Repeated-measures ANOVA were performed to determine whether the differences between the PKC-KO and WT are statistically significant or not at P less than 0.05.
Retina Slice Whole-Cell Recording of RBCs
Whole cell voltage-clamp recordings were made from RBCs in dark-adapted living retinal slices under infrared visual guidance with an Axopatch 200A amplifier connected to a DigiData 1200 interface and pClamp 6.1 software (Axon Instruments, Foster City, CA, USA). Dissection and preparation of living retinal slices followed essentially the procedures described in previous publications.31,32 Oxygenated Ames solution (adjusted to pH 7.3; Sigma-Aldrich Corp., St. Louis, MO, USA) was introduced continuously to the recording chamber by a gravity superfusion system, and the medium was maintained at 34°C by a temperature control unit (TC 324B, Warner Instruments, CT, USA). Whole-cell patch electrodes were made with Narishige or Sutter patch electrode pullers that were of 5 to 7 MΩ tip resistance when filled with internal solution containing 118 mM Cs methanesulfonate, 12 mM CsCl, 5 mM EGTA, 0.5 mM CaCl2 , 4 mM ATP, 0.3 mM guanosine-5′-triphosphate (GTP), 10 mM Tris, and 0.8 mM Lucifer yellow, adjusted to pH 7.2 with CsOH. The chloride equilibrium potential, ECl, with this internal solution was approximately −60 mV. Cell morphology was visualized in retinal slices through the use of Lucifer yellow fluorescence with a confocal microscope (Zeiss 510; Zeiss, Thornwood, NY, USA). A photostimulator was used to deliver light spots (of diameter 600–1200 μm) to the retina via the epi-illuminator of the microscope. The stimulus strength of unattenuated (log I = 0) 500 nm light was 1.4 × 10⁶ photons μm−2 sec−1.
Results
PKCα Expression and Distribution Is Correlated With the Activity State of Mouse RBCs
Protein kinase C alpha expression in RBCs and its distribution within the cell has previously been shown to be activity-dependent in the rat.33 Here, we show the difference in PKCα distribution in light- and dark-adapted mouse RBCs (Fig. 1A). In the light-adapted retina, PKCα immunofluorescence is brighter in the tips of the RBC dendrites and in the axon terminals compared with the dark-adapted tissue. In the dark-adapted retina, PKCα immunofluorescence is strongest in the RBC bodies. Supporting activity-dependent regulation of PKCα expression, PKCα protein was found to be dramatically reduced in the TRPM1-KO mouse retina, in which ON-BPCs are unresponsive to light. Immunofluorescent labeling of retina sections from TRPM1-WT and TRPM1-KO littermates shows a loss of PKCα in both the dendrites and synaptic terminals of the TRPM1-KO retina compared with WT, whereas PKCα immunofluorescence in the axons appears unchanged (Fig. 1B). Western blotting confirmed the decrease in PKCα in the TRPM1-KO retina (Fig. 1C).
Figure 1.
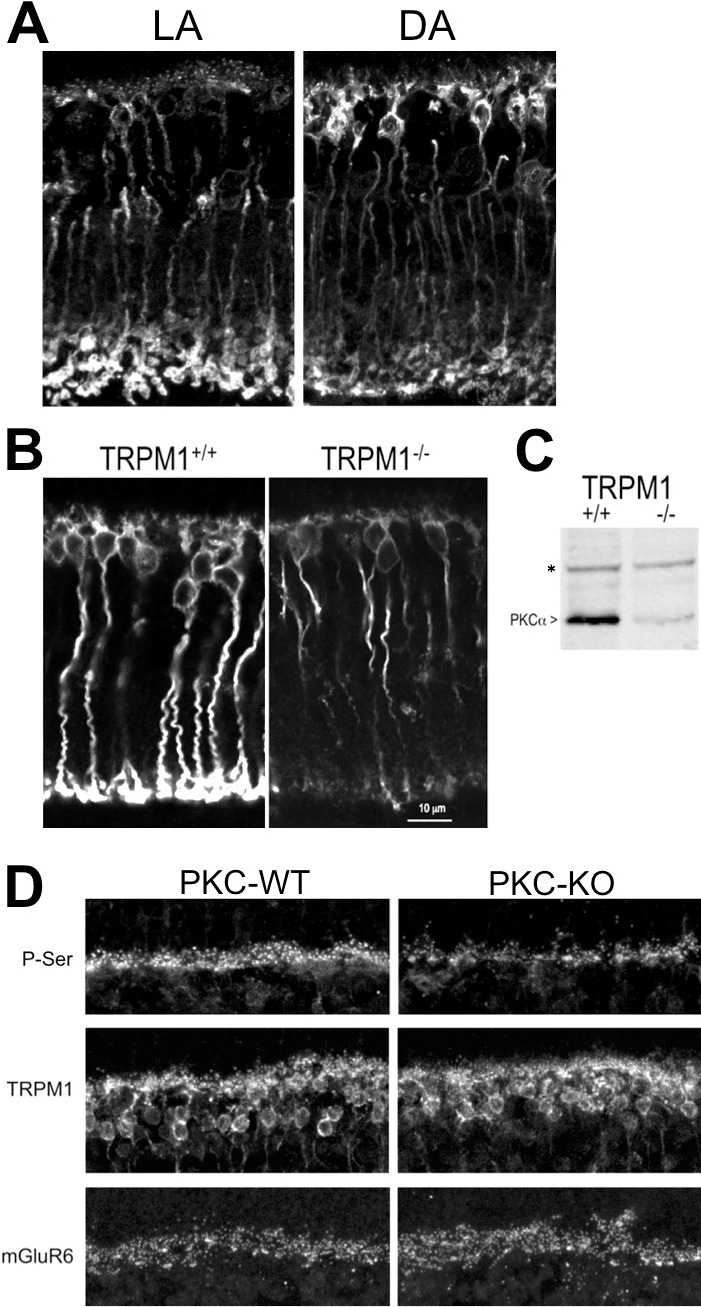
Protein kinase C alpha distribution in mouse RBCs is light and activity dependent. Immunofluorescent labeling for PKCα of retina sections from (A) light-adapted and dark-adapted WT mice, and (B) light-adapted TRPM1+/+ and TRPM1−/− mice. (C) Western blot showing the relative quantities of PKCα in TRPM1+/+ and TRPM1−/− retinas. The asterisk denotes a background band that serves as a loading control for equal quantities of protein in each lane. (D) Phospho-serine, TRPM1, and mGluR6 immunofluorescence in the OPL of retina sections from WT and PKC-KO littermates. The scale bar in the lower right panel represents 12 μm and applies to (A, B, D).
The Outer Plexiform Layer Is a Major Site of PKCα Phosphorylation
Retina sections from WT and PKC KO littermates were labeled by immunofluorescence with antibodies against phospho-serine and phospho-threonine. Weak immunofluorescence was observed with the anti–phospho-threonine antibody and no difference was observed between PKC-KO and WT retina sections (not shown). Immunofluorescent labeling of retina sections with an antibody against phospho-serine revealed that the outer plexiform layer (OPL) is a major site of serine phosphorylation in the mouse retina (Fig. 1D, upper left panel). Punctate labeling similar to that obtained with antibodies to mGluR6 was observed (Fig. 1D, bottom panels), indicating the presence of phosphorylation sites in the RBC dendritic tips. Phospho-serine immunofluorescence in the OPL was reduced in the PKC-KO retina (Fig. 1D, upper right panel), indicating that PKCα is required for maximum serine phosphorylation at this site. TRPM1 immunofluorescence is localized to the tips of the ON-BPC dendrites as well as the cell bodies and proximal axon in both WT and PKC-KO retinas (Fig. 1D, middle panels), and mGluR6 is localized to the tips of RBC and cone ON-BPC dendrites in both WT and PKC-KO retinas. No difference in either TRPM1 or mGluR6 immunofluorescence was observed between WT and PKC-KO retinas, which is consistent with a previous report indicating that the PKC-KO retina is morphologically and immunohistochemically normal.23
Deletion of PKCα Alters the Scotopic ERG
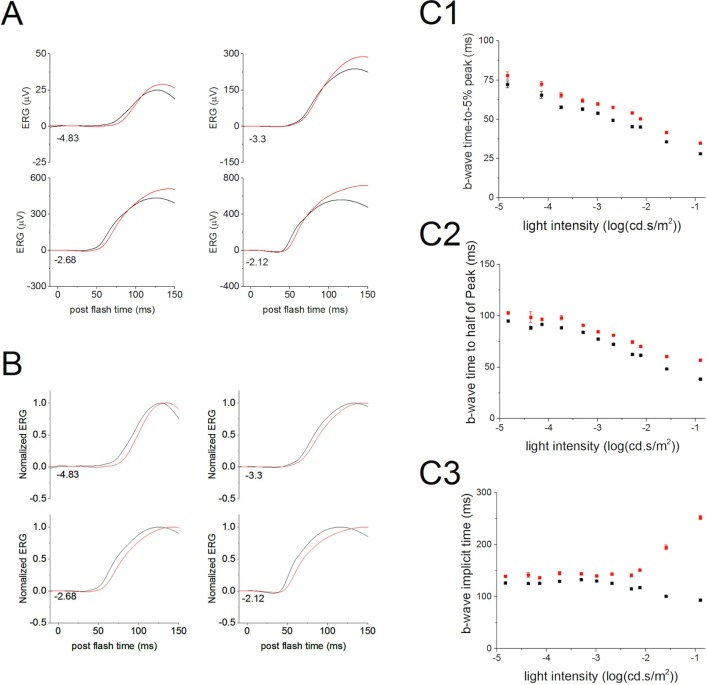
Comparison of ERGs of WT and PKC-KO mice revealed that the b-wave is the component most affected by the absence of PKCα. Under scotopic conditions, the ERG b-wave mainly reflects the activity of RBCs.19 Deletion of PKCα changed the rising phase of the b-wave in the scotopic ERG suggesting that PKCα is involved in the initiation of the RBC light response (Fig. 2A; WT, black, and KO, red traces). Comparison of the time for the b-wave to rise to 5% of the b-wave peak (summarized in Fig. 2C1) revealed that the PKC-KO b-wave initiated significantly later (P ≤ 0.05; at −4.14 log[cd.s/m2], 65.5 ± 2.21 ms [WT] and 72.5 ± 1.47 ms [KO]; at −0.9 log[cd.s/m2], 28.1 ± 0.72 ms [WT], and 34.8 ± 0.32 ms [KO]). Similarly, the time for the b-wave to reach 50% of the peak amplitude and the time for the b-wave to reach peak amplitude (i.e., the implicit time), both showed statistically significant differences by repeated-measures ANOVA, with the PKC-KO mice requiring longer times (Figs. 2C2, 2C3).
Figure 2.
Deletion of PKCα delays the rising phase of ERG b-wave. (A) Electroretinograms evoked by dim flashes from WT (n = 62, black) and KO (n = 52, red) eyes were averaged and plotted versus postflash time after OPs were filtered out. At these flash intensities, the main component of the ERG is the b-wave, which primarily reflects rod bipolar cell activity. The numbers at the lower left of the traces indicate the flash strength in log(cd-s/m2). (B) The averaged ERG b-wave from WT (black) and KO (red) eyes were normalized to the peak b-wave amplitude and plotted versus postflash time. Numbers indicate the flash strength in log(cd-s/m2). (C) The average time to 5% (C1), 50% (C2), and 100% (C3) of the b-wave peak amplitude from WT (black) and KO (red) eyes were plotted (mean ± SEM) versus light intensity.
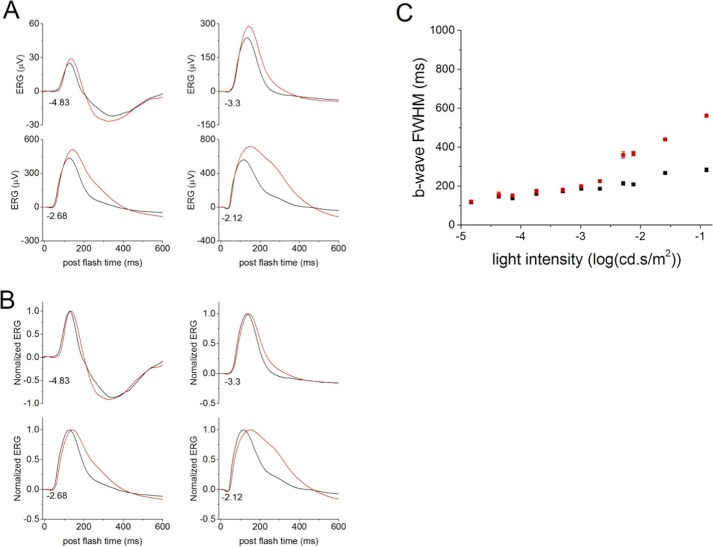
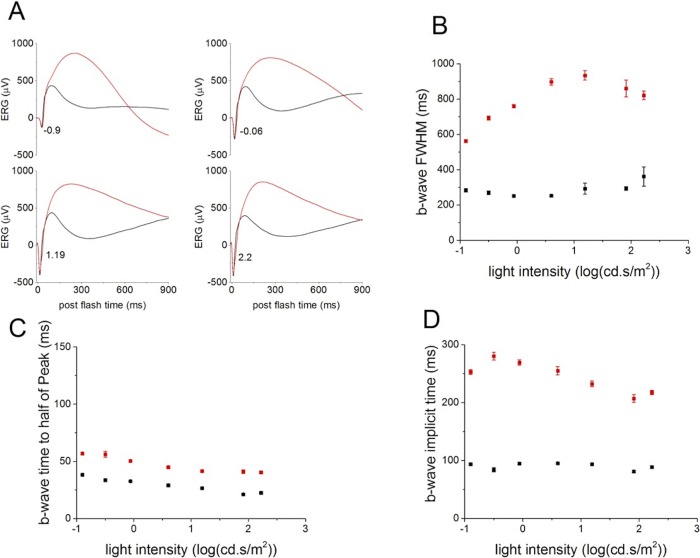
The most striking change caused by the deletion of PKCα is the duration of the b-wave (Figs. 3A, 3B). The b-wave FWHM was significantly longer in PKC-KO mice compared with WT for flashes above −2.68 log(cd.s/m2) (Fig. 3C), tested with repeated measures ANOVA. This is the result of a delay in the falling phase of the b-wave, and suggests that PKCα is required for efficient termination of the RBC light response. The differences observed in the ERG b-wave of PKC-KO mice in response to dim flashes (Figs. 2, 3) were even more pronounced in response to bright flashes (above −2.29 log[cd.s/m2]; Figs. 3, 4). At these intensities, the FWHM in PKC-KO mice was much larger than at dimmer intensities (Fig. 4B), and the PKC-KO mice also exhibited a longer delay in the time to reach half of the peak amplitude and in the implicit time of the b-wave (Figs. 4C, 4D).
Figure 3.
Deletion of PKCα changes the falling phase of ERG b-wave. (A) Electroretinograms evoked by dim flashes collected from WT (n = 62, black) and KO (n = 52, red) eyes were averaged and plotted versus postflash time after OPs were filtered out. The numbers at the lower, left of the traces indicate the flash strength in log(cd-s/m2). (B) The averaged ERG b-waves from WT (black) and KO (red) eyes were normalized to the peak b-wave amplitude and plotted versus postflash time. Numbers at the lower left of the traces indicate flash strength. (C) The averaged FWHM from WT (black) and KO (red) eyes are plotted (mean ± SEM) versus flash intensity.
Figure 4.
Deletion of PKCα changes the ERG b-wave evoked by bright flashes. (A) Electroretinograms b-waves evoked by bright flashes collected from WT (n = 62, black) and KO (n = 52, red) eyes were averaged and plotted versus postflash time after OPs were filtered out. Numbers at the lower left of the traces represent flash strength in log(cd-s/m2). (B) The b-wave FWHM of the average ERGs from WT (black) and KO (red) eyes are plotted (mean ± SEM) versus light intensity. (C) The times to reach half of the b-wave peak amplitude were calculated from the average ERGs of WT (black) and KO (red) eyes and plotted (mean ± SEM) versus light intensity. (D) The b-wave implicit times of the averaged ERGs from WT (black) and KO (red) eyes are plotted (mean ± SEM) versus light intensity.
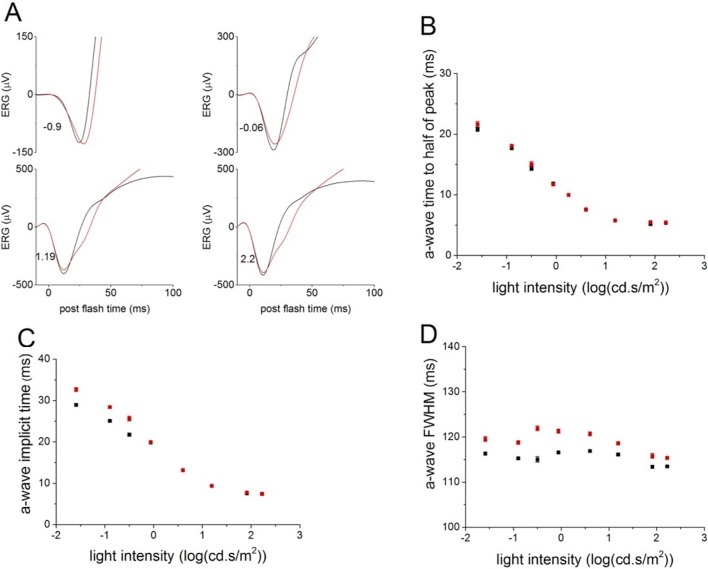
In contrast, ERG a-waves, reflecting photoreceptor activity, were normal in the PKC-KO mice. The leading edge of the scotopic ERG a-wave evoked by bright flashes was almost identical between WT and PKC-KO mice (Fig. 5A), with similar times to reach half of the peak amplitude and similar implicit times (Figs. 5B, 5C), suggesting that photoreceptor function was not affected by the deletion of PKCα. Changes in the a-wave FWHM are likely the consequence of the delay in the rise of the b-wave (Fig. 5D).
Figure 5.
Deletion of PKCα does not change the leading edge of ERG a-wave. (A) Electroretinograms a-waves evoked by bright flashes collected from WT (n = 62, black) and KO (n = 58, red) eyes were averaged and plotted versus postflash time after OPs were filtered out. Numbers at the lower left of the traces represent flash strength in log(cd-s/m2). (B) The times to reach half of the a-wave peak were calculated from the averaged WT (black) and KO (red) ERGs and plotted (mean ± SEM) versus light intensity. (C) The a-wave implicit times of the averaged WT (black) and KO (red) ERGs are plotted (mean ± SEM) versus light intensity. (D) The a-wave FWHM of the averaged WT (black) and KO (red) ERGs are plotted (mean ± SEM) versus light intensity.
The relationship of the a-wave peak amplitude versus stimulus strength was not affected by the deletion of PKCα (Figs. 6A, 6C), whereas the b-wave peak amplitude versus stimulus strength was changed, with larger peak amplitudes in the PKC-KO mouse at brighter light intensities (Figs. 6B, 6D). Statistically, the maximum peak amplitude (Vmax) and the stimulus strength required to reach half of the maximum response (K50) were both increased significantly by the deletion of PKCα (at P ≤ 0.05 level, Vmax: 660 ± 27.0μV [WT] and 1012 ± 31.0 μV [KO]; K50: 0.0010 ± 0.000055 cd.s/m2 [WT], and 0.0022 ± 0.00018 cd.s/m2 [KO]).
Figure 6.
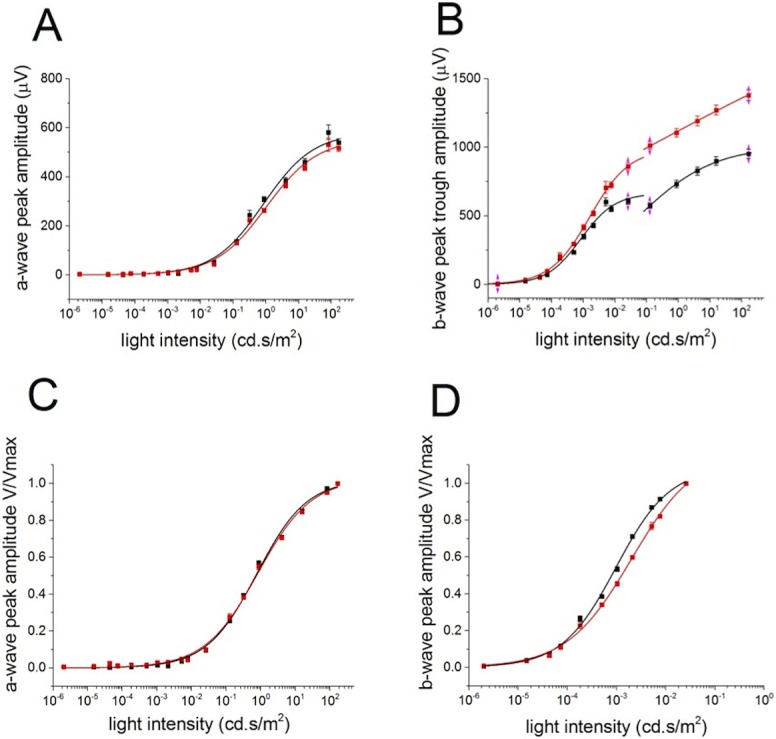
Deletion of PKCα changes the ERG b-wave response amplitude to flashes. (A) The collected results of a-wave peak amplitudes from WT (n = 62, black) and KO (n = 52, red) eyes are plotted (mean ± SEM) versus light intensity. The data are fitted with Hill functions shown with solid lines. (B) The b-wave trough to peak amplitudes of the averaged WT (black) and KO (red) ERGs are plotted (mean ± SEM) versus light intensity. The data below and above 10−1 cd.s/m2 are fitted with separate Hill functions. (C) The a-wave normalized peak amplitudes of the average WT (black) and KO (red) ERGs are plotted (MEAN ± SEM) versus light intensity and fitted with Hill functions shown with solid lines. (D) The averaged b-waves evoked by light flashes below 10−1 cd.s/m2 from WT (black) and KO (red) eyes were normalized to the peak amplitude and plotted (mean ± SEM ) versus light intensity. The data points were fitted with Hill functions, shown with solid lines.
In addition to the changes in the scotopic ERG b-wave, the OPs of the PKC-KO mouse were also altered, as shown in Figure 7. Oscillatory potentials were extracted with a high-pass filter (Fc at 60–300 Hz) for comparison between WT and PKC-KO mice. All the traces from WT and PKC-KO mice were collected and averaged. The averaged OPs were reduced in amplitude and appear to be delayed in PKC-KO mice (Fig. 7).
Figure 7.
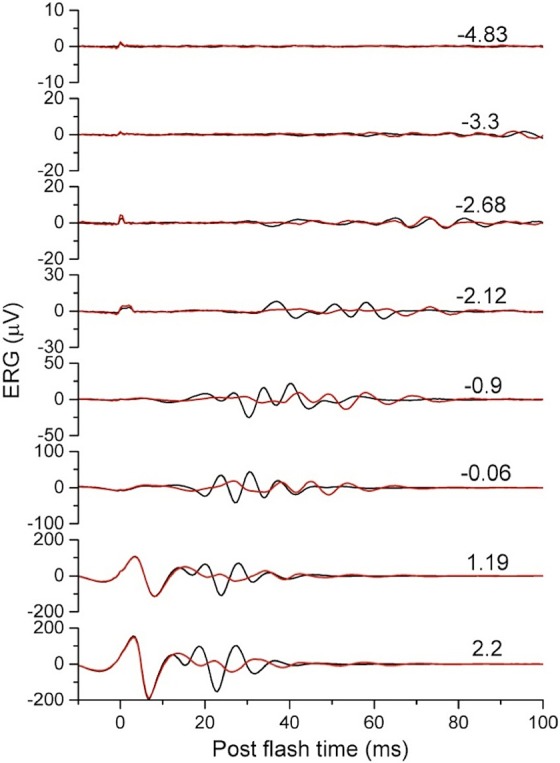
Deletion of PKCα affects the oscillatory potentials of the scotopic ERG. Oscillatory potentials were extracted from scotopic ERGs of WT (n = 62, black) and KO (n = 52, red) eyes and the averages plotted versus postflash time. Numbers on the right side of the traces indicate flash strength. For the two brightest flashes (1.19 and 2.2 cd s/m2), the a-wave is visible in the traces and is unchanged between KO and WT.
Whole-Cell Voltage Clamp Recordings of Single Rod Bipolar Cells in PKCα-KO Mouse Retinal Slices
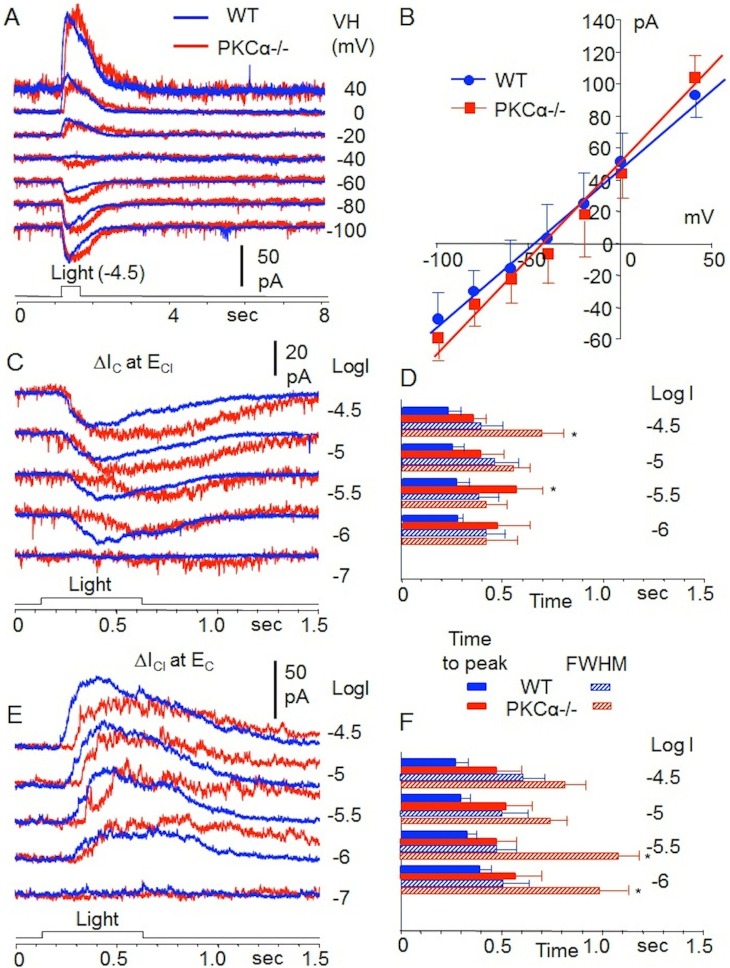
We studied light-evoked responses of 15 morphologically-identified RBCs in dark-adapted retinal slices of PKC-KO mice. Each cell exhibited the characteristic long axons with globular axon terminals near the retinal ganglion cell layer (revealed by Lucifer yellow fluorescent dye, not shown, but see Refs. 31 and 32). Figure 8A shows current-voltage relations of a RBC in the PKC-KO mouse (blue traces) and a RBC in the WT mouse (red traces) to a 500 nm, 0.5-sec and −4.5 (log unit attenuation, see Methods section) light step. The average peak response values (with standard error bars) of 15 RBCs in the PKC-KO mice and 39 RBCs in the WT mice are plotted in Figure 8B. The difference in average peak responses of the two groups of RBCs are not statistically significant (P = 0.155, t-test). Figure 8C and 8E are the light-evoked cation and chloride currents (ΔIC and ΔICl , recorded at ECl and EC, respectively) of the two RBCs to 500 nm, 0.5-sec light steps of various intensities. It is evidence that the peak response amplitudes of the PKC-KO and WT RBCs do not consistently differ from each other (a RBC may have larger response to light of one intensity but smaller response to light of another intensity; Figs. 8C, 8E), but the response kinetics (time-to-peak and FWHM) of the RBCs in the PKC-KO mouse are consistently slower than the corresponding values of the RBCs in the WT mouse. Figures 8D and 8F are the average time-to-peak and FWHM values (with standard error bars) of ΔIC and ΔICl (respectively) of nine RBCs in PKC-KO mice and 11 RBCs in WT mice, and the time-to-peak and FWHM values of responses elicited by light steps of most intensities (marked with an asterisk) are significantly slower (P < 0.001) in the PKC-KO mice than the corresponding values in the WT mice. These results indicate that deletion of PKCα from RBCs does not noticeably change response amplitudes but markedly slows the response kinetics in the entire physiological voltage range.
Figure 8.
Whole-cell recordings of single RBCs in PKC-KO and WT mice. (A) Current-voltage relations of a RBC in a PKC-KO mouse (red traces) and a RBC in a WT mouse (blue traces) to a 500 nm, 0.5 s and −4.5 (log unit attenuation, see Methods section) light step. (B) Average peak response values (with standard error bars) of 15 RBCs in PKC-KO mice and 39 RBCs in WT mice. (C, E) Representative light-evoked cation and chloride currents (ΔIC and ΔICl) from single RBCs to 500 nm, 0.5-s light steps of various intensities. (D, F) Average time-to-peak and FWHM values (with standard error bars) of ΔIC and ΔICl of 9 RBCs in PKC-KO mice (red) and 11 RBCs in WT (blue) mice. *s indicate values obtained from the PKC-KO mice that are significantly different from WT mice (P < 0.001).
The Photopic ERG Is Unaffected by Deletion of PKCα
As expected, since PKCα is a marker of RBCs and not is readily detectable in ON-CBCs, the photopic ERG was not significantly altered by the deletion of PKCα; both the a- and b-wave appeared normal in the PKC-KO animals (Fig. 9A). The relationships of the a- and b-wave peak amplitudes versus stimulus strength were similar between WT and KO (Figs. 9C, 9D), and the OPs of the photopic ERG were also similar, at least for the first OPs (Fig. 9B).
Figure 9.
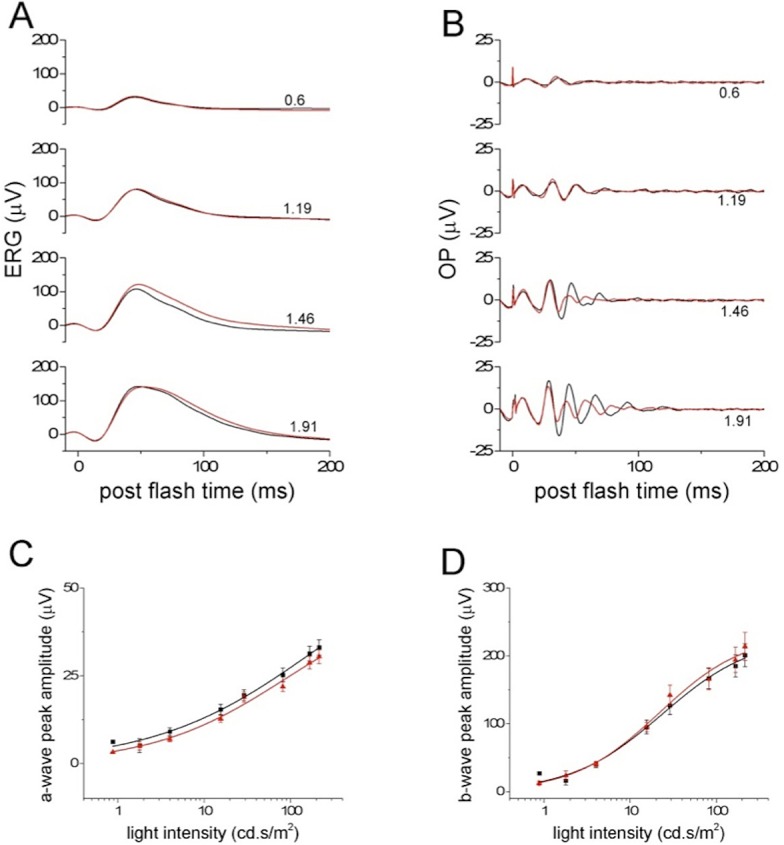
Deletion of PKCα does not change the photopic ERG. (A) Low-pass filtered photopic ERGs from WT (n = 24, black) and KO (n = 20, red) eyes were averaged and plotted versus postflash time. Numbers to the right of the traces indicate flash strength. (B) The averaged OPs of photopic ERGs from WT (n = 24, black) and KO (n = 20, red) eyes were extracted and plotted versus postflash time. Numbers to the right of the traces indicate flash strength. (C) The photopic ERG a-wave peak amplitudes from WT (n = 24, black) and KO (n = 20, red) eyes were averaged and plotted (means ± SEM) versus light intensity. The data points were fitted with a Hill function shown with solid lines. (D) The photopic ERG b-wave peak amplitudes from WT (n = 24, black) and KO (n = 20, red) eyes were averaged and plotted (means ± SEM) versus light intensity. The data points were fitted with a Hill function shown with solid lines.
The ERG C-Wave Is Unaffected by Deletion of PKCα
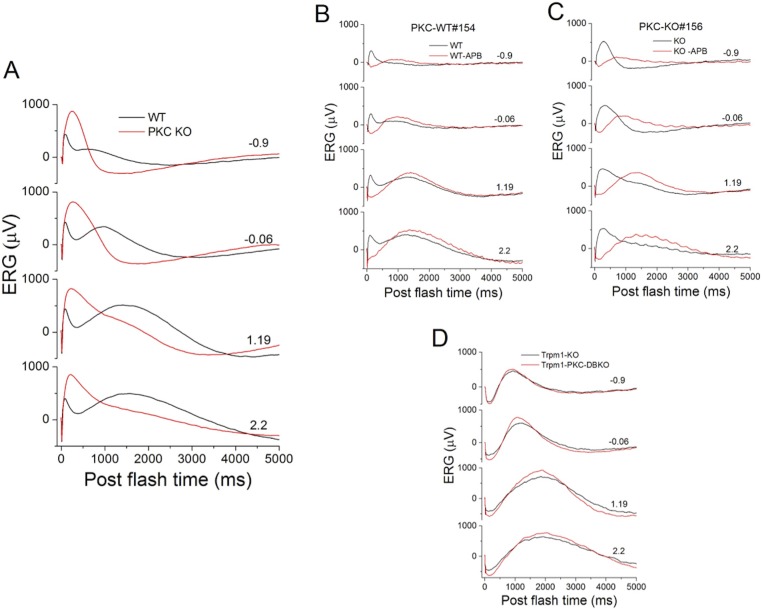
When the scotopic ERG is displayed with a longer time scale, 5 seconds, for example, the c-wave in the PKC-KO ERG appears to disappear when compared with that from WT mice (Fig. 10A). The c-wave has been proposed to arise from activity of the RPE.34,35 In order to address whether the apparent disappearance of the c-wave was due to a functional effect of PKCα in RPE cells, or some other mechanism, two sets of experiments were carried out. In the first, L-AP4, or APB28 was injected intravitreously into one eye while the contralateral eye was injected with PBS. The aim of this manipulation was to eliminate the RBC component of the ERG (b-wave) without affecting the RPE-derived component (c-wave). In both PKC-KO and WT mice, the c-wave showed up very clearly after removal of the b-wave, and both c-waves looked very similar (red traces in Figs. 10B, 10C). In another set of experiments, mice in which both TRPM1 and PKCα were genetically knocked out (TRPM1-PKC double-KO) were characterized with scotopic ERGs and compared with mice lacking only TRPM1 (TRPM1-KO). Consistent with the L-AP4 experiments, the b-wave was eliminated in both TRPM1-KO mice and TRPM1-PKC double-KO mice, and both had similar c-waves (Fig. 10D). Together, these results indicate that the c-wave is unaffected by the deletion of PKCα.
Figure 10.
Deletion of PKCα does not change the scotopic ERG c-wave. (A) Low-pass filtered scotopic ERGs from WT (n = 62, black) and PKC-KO (n = 52, red) eyes were averaged and plotted over a time course of 5 seconds. For (A–D) the numbers to the right of the traces represent stimulus strength in log(cd-s/m2). (B) Low-pass filtered scotopic ERGs of a WT mouse following intravitreal injection of one eye with APB (red) to block the RBC light response and the other eye with PBS (black). (C) Low-pass filtered scotopic ERGs of a PKC-KO mouse mouse following intravitreal injection of one eye with APB (red) to block the RBC light response and the other eye with PBS (black). (D) Scotopic ERG c-waves from TRPM1-KO (n = 3, black) and PKC-TRPM1 double-KO (n = 8, red) eyes were averaged and plotted versus postflash time.
Effect of PKCα Deletion on the Refractory Period of the Light Response
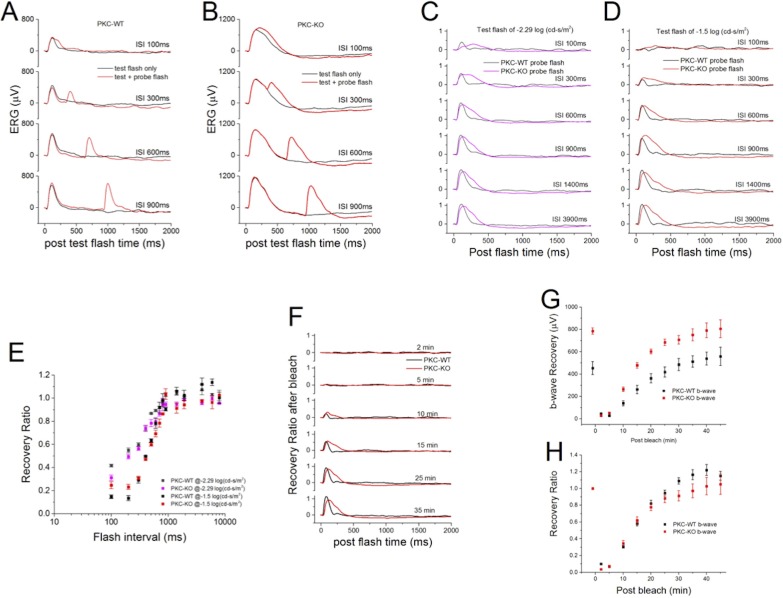
To examine the involvement of PKCα in the refractory period of light responses following an initial flash, we used a paired-flash protocol as shown in Figure 11A for WT mice and Figure 11B for PKC-KO mice. At different intervals after a test flash, a probe flash was applied, and ERGs to both were recorded. The probe flash ERG was isolated and normalized to the test flash peak amplitude (Figs. 11C, 11D). At both −2.29 log(cd.s/m2) (Fig. 11C) and at −1.5 log(cd.s/m2) (Fig. 11D), the recoveries of the WT and PKC-KO ERG amplitude are similar. The only difference is the larger FWHM, as described above. The summarized recovery ratio of the b-wave versus the interval preceding the probe flash did not show significant changes between WT and PKC-KO mice (Fig. 11E).
Figure 11.
Deletion of PKCα does not change the refractory period or postbleach recovery of the scotopic ERG b-wave. (A) Paired-flash ERGs were recorded from WT mice. Black traces are the responses to the test flash alone and red traces are the responses to the test flash paired with a probe flash given at different interstimulus intervals. For (A–D), the interstimulus intervals (ISI) are indicated by the numbers to the right of the traces. (B) Paired-flash ERGs were recorded from PKC-KO mice. Black traces are the responses to the test flash alone, and red traces are the responses to the test flash with probe flash at different intervals. (C) Normalized probe flash ERGs from WT (black) and PKC-KO (pink) eyes are plotted for different ISI following a test flash of −2.29 log(cd-s/m2). (D) Normalized probe flash ERGs from WT (black) and PKC-KO (red) eyes were plotted at different ISI following a test flash of −1.5 log(cd-s/m2). (E) The averaged results of experiments (C, D) are plotted (mean ± SEM). (F) Recovery after photo-bleaching of WT (black) and PKC-KO (red) ERGs are plotted at different recovery times indicated to the right of the traces. (G) The recovery of the b-wave peak amplitudes from WT (black) and PKC-KO (red) eyes are plotted versus the postbleach time. (H) The recovery of b-wave peak amplitudes from WT (black) and PKC-KO (red) eyes were normalized to the initial responses before bleach and plotted versus the postbleach time.
In order to rule out possible changes in photoreceptor function, recovery from photo-bleaching experiments were also carried out. A 200-ms bright light flash was applied to saturate the photoreceptors, then at different times following the photo-bleach, ERGs were recorded and normalized to the peak amplitude of the ERG before the photo-bleach (Fig. 11F). The results show that the b-wave amplitude recovered to larger levels in PKC-KO than in WT mice (Fig. 11G), but the normalized recovery ratio of b-wave amplitudes was not significantly different (Fig. 11H), suggesting that PKCα has no discernable role in photoreceptors.
Discussion
In the mouse retina, each RBC receives input from 20 to 40 rods, and is capable of reliably transmitting single photon responses in starlight, as well as integrating input from multiple rods at brighter intensities.12,13,36 Adaptive mechanisms that allow the RBC to transition between these modes may involve phosphorylation by PKCα, which is abundantly expressed in RBCs. Increases in light intensity reduce the rate of glutamate release by rods, leading to deactivation of the mGluR6 pathway and the subsequent opening of TRPM1 cation channels, which gives rise to the depolarizing response of RBCs to light.9–11 The signal transduction pathway from mGluR6 to TRPM1 includes the G protein Go37,38 and two regulators of G protein signaling, RGS7 and RGS11.39–41 Other proteins implicated in the pathway are GPR179,42,43 LRIT3,44,45 and nyctalopin.30,46–48 Additionally, Gβ3, Gγ13, and RetRGS1 likely participate in the RBC light response.49,50 Our results indicate a role of PKCα in modulating the mGluR6 signal transduction pathway in RBCs, particularly at brighter light intensities. Phospho-serine immunolabeling results clearly pinpoint the RBC dendrites as a major site of PKCα activity in the retina, because phospho-serine labeling is reduced in the OPL in the PKCα KO mouse. The substrates of PKCα in the RBC dendrites are not known but are likely to be components of the mGluR6 signaling pathway.
The effect of PKCα on RBC light responses includes two aspects. The first is that PKCα modifies the rising phase of the light response by changing the onset of the light response, (i.e., PKC-KO RBCs take a longer time to reach 5% of the peak amplitude, and a longer time to reach the maximum slope of the ERG b-wave, which is also confirmed in the whole-cell slice recordings). The second and the most striking effect is that PKCα strongly influences the termination of the RBC light responses, which was shown as a longer duration of the b-wave as measured by the FWHM of the b-wave. This second effect was more profound in response to brighter light flashes, indicating that PKCα has an important role in regulating the termination of responses to bright light. Again, this observation is consistent with the FWHM measurements of the PKC-KO cation and chloride currents in single RBCs (ΔIC and ΔICl; Figs. 8D, 8F). A possible interpretation of these data is that PKCα may not be a member of the direct mGluR6 → TrpM1 channel cascade, but it is likely to be a key regulator of the kinetics of the light-evoked, metabotropic glutamate signaling pathway in mouse RBCs.
The scotopic b-wave peak amplitude in PKC-KO appears larger than that in the WT mice, especially at brighter intensities (Figs. 3, 4). This is also observed in some single RBCs in the peak ΔIC elicited by brighter stimuli (e.g., responses in Fig. 8C to −5 and −4.5 light steps), but such findings did not hold for other RBCs. The light intensities used for the single-cell recordings, however, are considerably weaker than the stimuli used for the ERG recordings, and may have been insufficient to reveal a robust difference in response amplitudes between PKC-KO and WT RBCs. It should also be noted that the duration of the light stimulus for the single cell recordings (0.5 seconds; Fig. 8) might be too long to reveal changes in temporal integration caused by PKCα deletion.
A possible mechanism underlying the increase in the ERG b-wave amplitude in the PKC-KO mice is via GABA signaling. Targets of PKCα in the RBC include GABAc receptors,25 which increase the sensitivity and dynamic range of RBCs. Genetic deletion or pharmacological block of GABAc receptors has been shown to reduce the scotopic ERG b-wave.51,52 The activity of RBC GABAc receptors is downregulated by PKCα phosphorylation,25 thus elimination of PKCα may increase the amplitude of the ERG b-wave through enhanced GABAc receptor activity.
In addition to changes in the ERG b-wave, the PKC-KO mice also show clear differences in the oscillatory potentials compared with WT. Oscillatory potentials are thought to reflect the activity of amacrine cells in the inner plexiform layer,53–55 and are dependent on glutamate release from bipolar cells,56 Our results suggest that PKCα might change the release of glutamate in the bipolar cell axon terminals or the feedback responses from amacrine cells, as synaptic release in goldfish retinal bipolar cells was reported to be regulated by PKC.57–59
The c-wave of the ERG is a slow, positive component that originates in the RPE.34,35 The ERG c-wave is dependent on the integrity of the photoreceptors and RPE. Several PKC isoforms including PKCα have been reported to be expressed in the RPE,60–63 and have different functions.64–71 The c-wave of the ERG recorded from PKC-KO mouse is difficult to detect, leading Ruether et al.23 to propose that this indicates a direct effect of the PKCα deletion on the RPE. As can be seen in Figure 10A, the b-wave in the PKC-KO ERG is immediately followed by a slow, negative potential in response to the dimmest flashes, although a slight, positive inflection is seen for the two brighter flashes. Despite the absence of an obvious c-wave, our ERG results comparing WT and PKC-KO mice, in which the b-wave has been eliminated by intravitreal injection of L-AP4, clearly demonstrate that the c-wave of the ERG is not affected by the deletion of PKCα. This result was confirmed by the appearance of a normal c-wave in the TRPM1-PKC double KO mouse. We conclude, therefore, that PKCα in the RPE is not involved in generating the ERG c-wave.
Wu et al.72 compared c-waves from WT and nob (no b-wave) mice, a strain lacking ON-bipolar cell responses, and noted that, though similar in appearance, the c-wave was of consistently larger amplitude in the nob mice. They proposed that in WT animals there is a negative component originating from the ON-BPCs that partially counteracts the c-wave. In PCK-KO mice, the RBC-derived negative component may be larger than in WT mice, reducing the apparent amplitude of the c-wave even further. The negative potential following the b-wave in the PKC-KO may reflect a larger Müller cell potassium flux (slow PIII wave)35 driven by the increased RBC depolarization.
Deletion of PKCα did not change the photopic ERG, which mainly reflects the activity of cones and CBCs,73 consistent with the expression of PKCα being largely confined to RBCs and undetectable in ON-CBCs. However, phospho-serine immunoreactivity was detected in the OPL in a pattern consistent with labeling of both RBC and ON-CBC dendrites, and the putative ON-CBC staining appeared unchanged in the PKC-KO retina. It is thus reasonable to propose that ON-CBCs use a similar protein kinase system to regulate and control their light responses, perhaps involving a different member of the PKC family. In retina, rod, and cone photoreceptors are known to have receptor kinases to control the shut-down of activated G-protein coupled receptors, rhodopsin kinase (GRK1)74 and GRK7.75 An analogous mechanism may occur in RBCs and ON-CBCs.
Acknowledgments
The authors thank Richard Weleber (Casey Eye Institute, OHSU) for generously sharing his custom developed ERG software.
Supported by National Eye Institute (Bethesda, MD, USA) Grants R01EY018625 (CWM), R01EY004446 (SMW), P30EY002520 (SMW), and R01EY019907 (RMD); the Retina Research Foundation (SMW; Houston, TX, USA); and Research to Prevent Blindness (SMW; New York, NY, USA).
Disclosure: W.-H. Xiong, None; J.-J. Pang, None; M.E. Pennesi, None; R.M. Duvoisin, None; S.M. Wu, None; C.W. Morgans, None
References
- 1. Ghosh KK,, Bujan S,, Haverkamp S,, Feigenspan A,, Wassle H. Types of bipolar cells in the mouse retina. J Comp Neurol. 2004; 469: 70–82. [DOI] [PubMed] [Google Scholar]
- 2. Mercer AJ,, Thoreson WB. The dynamic architecture of photoreceptor ribbon synapses: cytoskeletal, extracellular matrix, and intramembrane proteins. Vis Neurosci. 2011; 28: 453–471. [DOI] [PMC free article] [PubMed] [Google Scholar]
- 3. Regus-Leidig H,, Brandstatter JH. Structure and function of a complex sensory synapse. Acta Physiol. 2012; 204: 479–486. [DOI] [PubMed] [Google Scholar]
- 4. Puller C,, Ivanova E,, Euler T,, Haverkamp S,, Schubert T. OFF bipolar cells express distinct types of dendritic glutamate receptors in the mouse retina. Neurosci. 2013; 243: 136–148. [DOI] [PubMed] [Google Scholar]
- 5. Lindstrom SH,, Ryan DG,, Shi J,, Devries SH. Kainate receptor subunit diversity underlying response diversity in retinal Off bipolar cells. J Physiol. 2014; 592: 1457–1477. [DOI] [PMC free article] [PubMed] [Google Scholar]
- 6. Nawy S. Regulation of the on bipolar cell mGluR6 pathway by Ca2+. J Neurosci. 2000; 20: 4471–4479. [DOI] [PMC free article] [PubMed] [Google Scholar]
- 7. Snellman J,, Nawy S. Regulation of the retinal bipolar cell mGluR6 pathway by calcineurin. J Neurophysiol. 2002; 88: 1088–1096. [DOI] [PubMed] [Google Scholar]
- 8. Nawy S. Desensitization of the mGluR6 transduction current in tiger salamander On bipolar cells. J Physiol. 2004; 558: 137–146. [DOI] [PMC free article] [PubMed] [Google Scholar]
- 9. Shen Y,, Heimel JA,, Kamermans M,, Peachey NS,, Gregg RG,, Nawy S. A transient receptor potential-like channel mediates synaptic transmission in rod bipolar cells. J Neurosci. 2009; 29: 6088–6093. [DOI] [PMC free article] [PubMed] [Google Scholar]
- 10. Morgans CW,, Zhang J,, Jeffrey BG,, et al. TRPM1 is required for the depolarizing light response in retinal ON-bipolar cells. Proc Natl Acad Sci U S A. 2009; 106: 19174–19178. [DOI] [PMC free article] [PubMed] [Google Scholar]
- 11. Koike C,, Obara T,, Uriu Y,, et al. TRPM1 is a component of the retinal ON bipolar cell transduction channel in the mGluR6 cascade. Proc Natl Acad Sci U S A. 2010; 107: 332–337. [DOI] [PMC free article] [PubMed] [Google Scholar]
- 12. Berntson A,, Smith RG,, Taylor WR. Transmission of single photon signals through a binary synapse in the mammalian retina. Vis Neurosci. 2004; 21: 693–702. [DOI] [PubMed] [Google Scholar]
- 13. Sampath AP,, Rieke F. Selective transmission of single photon responses by saturation at the rod-to-rod bipolar synapse. Neuron. 2004; 41: 431–443. [DOI] [PubMed] [Google Scholar]
- 14. Deans MR,, Volgyi B,, Goodenough DA,, Bloomfield SA,, Paul DL. Connexin36 is essential for transmission of rod-mediated visual signals in the mammalian retina. Neuron. 2002; 36: 703–712. [DOI] [PMC free article] [PubMed] [Google Scholar]
- 15. Abd-El-Barr MM,, Pennesi ME,, Saszik SM,, et al. Genetic dissection of rod and cone pathways in the dark-adapted mouse retina. J Neurophysiol. 2009; 102: 1945–1955. [DOI] [PMC free article] [PubMed] [Google Scholar]
- 16. Greferath U,, Grunert U,, Wassle H. Rod bipolar cells in the mammalian retina show protein kinase C-like immunoreactivity. J Comp Neurol. 1990; 301: 433–442. [DOI] [PubMed] [Google Scholar]
- 17. Haverkamp S,, Ghosh KK,, Hirano AA,, Wassle H. Immunocytochemical description of five bipolar cell types of the mouse retina. J Comp Neurol. 2003; 455: 463–476. [DOI] [PMC free article] [PubMed] [Google Scholar]
- 18. Wu-Zhang AX,, Newton AC. Protein kinase C pharmacology: refining the toolbox. Biochem J. 2013; 452: 195–209. [DOI] [PMC free article] [PubMed] [Google Scholar]
- 19. Robson JG,, Frishman LJ. Response linearity and response kinetics of the cat retina: the bipolar cell component of the dark-adapted electroretinogram. Vis Neurosci. 1995; 12: 837–50. [DOI] [PubMed] [Google Scholar]
- 20. Hood DC,, Birch DG. Beta wave of the scotopic (rod) electroretinogram as a measure of the activity of human on-bipolar cells. J Opt Soc Am A Opt Image Sci Vis. 1996; 13: 623–633. [DOI] [PubMed] [Google Scholar]
- 21. Cameron AM,, Mahroo OA,, Lamb TD. Dark adaptation of human rod bipolar cells measured from the b-wave of the scotopic electroretinogram. J Physiol. 2006; 575: 507–526. [DOI] [PMC free article] [PubMed] [Google Scholar]
- 22. Cameron AM,, Miao L,, Ruseckaite R,, Pianta MJ,, Lamb TD. Dark adaptation recovery of human rod bipolar cell response kinetics estimated from scotopic b-wave measurements. J Physiol. 2008; 586: 5419–5436. [DOI] [PMC free article] [PubMed] [Google Scholar]
- 23. Ruether K,, Feigenspan A,, Pirngruber J,, Leitges M,, Baehr W,, Strauss O. PKC{alpha} is essential for the proper activation and termination of rod bipolar cell response. Invest Ophthalmol Vis Sci. 2010; 51: 6051–6058. [DOI] [PMC free article] [PubMed] [Google Scholar]
- 24. Job C,, Lagnado L. Calcium and protein kinase C regulate the actin cytoskeleton in the synaptic terminal of retinal bipolar cells. J Cell Biol. 1998; 143: 1661–1672. [DOI] [PMC free article] [PubMed] [Google Scholar]
- 25. Feigenspan A,, Bormann J. Modulation of GABAC receptors in rat retinal bipolar cells by protein kinase C. J Physiol. 1994; 481: 325–330. [DOI] [PMC free article] [PubMed] [Google Scholar]
- 26. Rampino MA,, Nawy SA. Relief of Mg(2)(+)-dependent inhibition of TRPM1 by PKCalpha at the rod bipolar cell synapse. J Neurosci. 2011; 31: 13596–13603. [DOI] [PMC free article] [PubMed] [Google Scholar]
- 27. Braz JC,, Gregory K,, Pathak A,, et al. PKC-alpha regulates cardiac contractility and propensity toward heart failure. Nature Med. 2004; 10: 248–254. [DOI] [PubMed] [Google Scholar]
- 28. Slaughter MM,, Miller RF. 2-amino-4-phosphonobutyric acid: a new pharmacological tool for retina research. Science. 1981; 211: 182–185. [DOI] [PubMed] [Google Scholar]
- 29. Xiong WH,, Duvoisin RM,, Adamus G,, Jeffrey BG,, Gellman C,, Morgans CW. Serum TRPM1 autoantibodies from melanoma associated retinopathy patients enter retinal ON-bipolar cells and attenuate the electroretinogram in mice. PLoS One. 2013; 8: e69506. [DOI] [PMC free article] [PubMed] [Google Scholar]
- 30. Morgans CW,, Ren G,, Akileswaran L. Localization of nyctalopin in the mammalian retina. Eur J Neurosci. 2006; 23: 1163–1171. [DOI] [PubMed] [Google Scholar]
- 31. Pang JJ,, Gao F,, Wu SM. Light-evoked current responses in rod bipolar cells cone depolarizing bipolar cells, and AII amacrine cells in dark-adapted mouse retina. J Physiol. 2004; 558: 897–912. [DOI] [PMC free article] [PubMed] [Google Scholar]
- 32. Pang JJ,, Gao F,, Lem J,, Bramblett DE,, Paul DL,, Wu SM. Direct rod input to cone BCs and direct cone input to rod BCs challenge the traditional view of mammalian BC circuitry. Proc Natl Acad Sci U S A. 2010; 107: 395–400. [DOI] [PMC free article] [PubMed] [Google Scholar]
- 33. Gabriel R,, Lesauter J,, Silver R,, Garcia-Espana A,, Witkovsky P. Diurnal and circadian variation of protein kinase C immunoreactivity in the rat retina. J Comp Neurol. 2001; 439: 140–150. [DOI] [PMC free article] [PubMed] [Google Scholar]
- 34. Steinberg RH,, Schmidt R,, Brown KT. Intracellular responses to light from cat pigment epithelium: origin of the electroretinogram c-wave. Nature. 1970; 227: 728–730. [DOI] [PubMed] [Google Scholar]
- 35. Steinberg RH,, Frishman LJ,, Seiving PA. Negative components of the electroretinogram from proximal retina and photoreceptor. : NN Osborne,, Chader GJ, Progress in Retinal Research. Oxford, UK: Pergamon; 1991: 121–160. [Google Scholar]
- 36. Field GD,, Rieke F. Nonlinear signal transfer from mouse rods to bipolar cells and implications for visual sensitivity. Neuron. 2002; 34: 773–785. [DOI] [PubMed] [Google Scholar]
- 37. Dhingra A,, Jiang M,, Wang TL,, et al. Light response of retinal ON bipolar cells requires a specific splice variant of Galpha(o). J Neurosci. 2002; 22: 4878–4884. [DOI] [PMC free article] [PubMed] [Google Scholar]
- 38. Okawa H,, Pahlberg J,, Rieke F,, Birnbaumer L,, Sampath AP. Coordinated control of sensitivity by two splice variants of Galpha(o) in retinal ON bipolar cells. J Gen Physiol. 2010; 136: 443–454. [DOI] [PMC free article] [PubMed] [Google Scholar]
- 39. Chen FS,, Shim H,, Morhardt D,, et al. Functional redundancy of R7 RGS proteins in ON-bipolar cell dendrites. Invest Ophthalmol Vis Sci. 2010; 51: 686–693. [DOI] [PMC free article] [PubMed] [Google Scholar]
- 40. Zhang J,, Jeffrey BG,, Morgans CW,, et al. RGS7 and -11 complexes accelerate the ON-bipolar cell light response. Invest Ophthalmol Vis Sci. 2010; 51: 1121–1129. [DOI] [PMC free article] [PubMed] [Google Scholar]
- 41. Cao Y,, Pahlberg J,, Sarria I,, Kamasawa N,, Sampath AP,, Martemyanov KA. Regulators of G protein signaling RGS7 and RGS11 determine the onset of the light response in ON bipolar neurons. Proc Natl Acad Sci U S A. 2012; 109: 7905–7910. [DOI] [PMC free article] [PubMed] [Google Scholar]
- 42. Audo I,, Bujakowska K,, Orhan E,, et al. Whole-exome sequencing identifies mutations in GPR179 leading to autosomal-recessive complete congenital stationary night blindness. Am J Hum Gen. 2012; 90: 321–330. [DOI] [PMC free article] [PubMed] [Google Scholar]
- 43. Peachey NS,, Ray TA,, Florijn R,, et al. GPR179 is required for depolarizing bipolar cell function and is mutated in autosomal-recessive complete congenital stationary night blindness. Am J Hum Gen. 2012; 90: 331–339. [DOI] [PMC free article] [PubMed] [Google Scholar]
- 44. Zeitz C,, Jacobson SG,, Hamel CP,, et al. Whole-exome sequencing identifies LRIT3 mutations as a cause of autosomal-recessive complete congenital stationary night blindness. Am J Hum Gen. 2013; 92: 67–75. [DOI] [PMC free article] [PubMed] [Google Scholar]
- 45. Neuille M,, El Shamieh S,, Orhan E,, et al. Lrit3 deficient mouse (nob6): a novel model of complete congenital stationary night blindness (cCSNB). PLoS One. 2014; 9: e90342. [DOI] [PMC free article] [PubMed] [Google Scholar]
- 46. Gregg RG,, Kamermans M,, Klooster J,, et al. Nyctalopin expression in retinal bipolar cells restores visual function in a mouse model of complete X-linked congenital stationary night blindness. J Neurophysiol. 2007; 98: 3023–3033. [DOI] [PMC free article] [PubMed] [Google Scholar]
- 47. Cao Y,, Posokhova E,, Martemyanov KA. TRPM1 forms complexes with nyctalopin in vivo and accumulates in postsynaptic compartment of ON-bipolar neurons in mGluR6-dependent manner. J Neurosci. 2011; 31: 11521–11526. [DOI] [PMC free article] [PubMed] [Google Scholar]
- 48. Pearring JN,, Bojang P,, Jr,, Shen Y,, et al. A role for nyctalopin, a small leucine-rich repeat protein, in localizing the TRP melastatin 1 channel to retinal depolarizing bipolar cell dendrites. J Neurosci. 2011; 31: 10060–10066. [DOI] [PMC free article] [PubMed] [Google Scholar]
- 49. Dhingra A,, Faurobert E,, Dascal N,, Sterling P,, Vardi N. A retinal-specific regulator of G-protein signaling interacts with Galpha(o) and accelerates an expressed metabotropic glutamate receptor 6 cascade. J Neurosci. 2004; 24: 5684–5693. [DOI] [PMC free article] [PubMed] [Google Scholar]
- 50. Dhingra A,, Ramakrishnan H,, Neinstein A,, et al. Gbeta3 is required for normal light ON responses and synaptic maintenance. J Neurosci. 2012; 32: 11343–11355. [DOI] [PMC free article] [PubMed] [Google Scholar]
- 51. Herrmann R,, Heflin SJ,, Hammond T,, et al. Rod vision is controlled by dopamine-dependent sensitization of rod bipolar cells by GABA. Neuron. 2012; 72: 101–110. [DOI] [PMC free article] [PubMed] [Google Scholar]
- 52. Dang TM,, Vingrys AJ,, Bui BV. Sustained and transient contributions to the rat dark-adapted electroretinogram b-wave. J Ophthalmol. 2013; 2013: 352917. [DOI] [PMC free article] [PubMed] [Google Scholar]
- 53. Wachtmeister L,, Dowling JE. The oscillatory potentials of the mudpuppy retina. Invest Ophthalmol Vis Sci. 1978; 17: 1176–1188. [PubMed] [Google Scholar]
- 54. Heynen H,, Wachtmeister L,, van Norren D. Origin of the oscillatory potentials in the primate retina. Vision Res. 1985; 25: 1365–1373. [DOI] [PubMed] [Google Scholar]
- 55. Wachtmeister L. Oscillatory potentials in the retina: what do they reveal. Prog Ret Eye Res. 1998; 17: 485–521. [DOI] [PubMed] [Google Scholar]
- 56. Yu M,, Peachey NS. Attenuation of oscillatory potentials in nob2 mice. Doc Ophthalmol. 2007; 115: 173–186. [DOI] [PMC free article] [PubMed] [Google Scholar]
- 57. Minami N,, Berglund K,, Sakaba T,, Kohmoto H,, Tachibana M. Potentiation of transmitter release by protein kinase C in goldfish retinal bipolar cells. J Physiol. 1998; 512: 219–225. [DOI] [PMC free article] [PubMed] [Google Scholar]
- 58. Berglund K,, Midorikawa M,, Tachibana M. Increase in the pool size of releasable synaptic vesicles by the activation of protein kinase C in goldfish retinal bipolar cells. J Neurosci. 2002; 22: 4776–4785. [DOI] [PMC free article] [PubMed] [Google Scholar]
- 59. Behrens UD,, Borde J,, Mack AF,, Wagner HJ. Distribution of phosphorylated protein kinase C alpha in goldfish retinal bipolar synaptic terminals: control by state of adaptation and pharmacological treatment. Cell Tissue Res. 2007; 327: 209–220. [DOI] [PubMed] [Google Scholar]
- 60. Usuda N,, Kong Y,, Hagiwara M,, et al. Differential localization of protein kinase C isozymes in retinal neurons. J Cell Biol. 1991; 112: 1241–1247. [DOI] [PMC free article] [PubMed] [Google Scholar]
- 61. Wood JP,, McCord RJ,, Osborne NN. Retinal protein kinase C. Neurochem Internat. 1997; 30: 119–136. [DOI] [PubMed] [Google Scholar]
- 62. Moriarty P,, Dickson AJ,, Erichsen JT,, Boulton M. Protein kinase C isoenzyme expression in retinal cells. Ophthalmic Res. 2000; 32: 57–60. [DOI] [PubMed] [Google Scholar]
- 63. Yu K,, Ma P,, Ge J,, et al. Expression of protein kinase C isoforms in cultured human retinal pigment epithelial cells. Graefes Arch Clin Exp Ophthalmol. 2007; 245: 993–999. [DOI] [PubMed] [Google Scholar]
- 64. Murphy TL,, Sakamoto T,, Hinton DR,, et al. Migration of retinal pigment epithelium cells in vitro is regulated by protein kinase C. Exp Eye Res. 1995; 60: 683–695. [DOI] [PubMed] [Google Scholar]
- 65. Karihaloo A,, Kato K,, Greene DA,, Thomas TP. Protein kinase and Ca2+ modulation of myo-inositol transport in cultured retinal pigment epithelial cells. Am J Physiol. 1997; 273: C671–C678. [DOI] [PubMed] [Google Scholar]
- 66. Nash MS,, Wood JP,, Osborne NN. Protein kinase C activation by serotonin potentiates agonist-induced stimulation of cAMP production in cultured rat retinal pigment epithelial cells. Exp Eye Res. 1997; 64: 249–255. [DOI] [PubMed] [Google Scholar]
- 67. Strauss O,, Mergler S,, Wiederholt M. Regulation of L-type calcium channels by protein tyrosine kinase and protein kinase C in cultured rat and human retinal pigment epithelial cells. FASEB J. 1997; 11: 859–867. [DOI] [PubMed] [Google Scholar]
- 68. Ryan JS,, Kelly ME. Activation of a nonspecific cation current in rat cultured retinal pigment epithelial cells: involvement of a G(alpha i) subunit protein and the mitogen-activated protein kinase signalling pathway. Br J Pharmacol. 1998; 124: 1115–1122. [DOI] [PMC free article] [PubMed] [Google Scholar]
- 69. Malfait M,, Gomez P,, van Veen TA,, et al. Effects of hyperglycemia and protein kinase C on connexin43 expression in cultured rat retinal pigment epithelial cells. J Membr Biol. 2001; 181: 31–40. [DOI] [PubMed] [Google Scholar]
- 70. Strauss O,, Rosenthal R,, Dey D,, et al. Effects of protein kinase C on delayed rectifier K+ channel regulation by tyrosine kinase in rat retinal pigment epithelial cells. Invest Ophthalmol Vis Sci. 2002; 43: 1645–1654. [PubMed] [Google Scholar]
- 71. Qiu S,, Jiang Z,, Huang Z,, et al. Migration of retinal pigment epithelium cells is regulated by protein kinase Calpha in vitro. Invest Ophthalmol Vis Sci. 2013; 54: 7082–7090. [DOI] [PubMed] [Google Scholar]
- 72. Wu J,, Peachey NS,, Marmorstein AD. Light-evoked responses of the mouse retinal pigment epithelium. J Neurophysiol. 2004; 91: 1134–1142. [DOI] [PMC free article] [PubMed] [Google Scholar]
- 73. Rangaswamy NV,, Hood DC,, Frishman LJ. Regional variations in local contributions to the primate photopic flash ERG: revealed using the slow-sequence mfERG. Invest Ophthalmol Vis Sci. 2003; 44: 3233–3247. [DOI] [PubMed] [Google Scholar]
- 74. Chen CK,, Burns ME,, Spencer M,, et al. Abnormal photoresponses and light-induced apoptosis in rods lacking rhodopsin kinase. Proc Natl Acad Sci U S A. 1999; 96: 3718–3722. [DOI] [PMC free article] [PubMed] [Google Scholar]
- 75. Kawamura S,, Tachibanaki S. Rod and cone photoreceptors: molecular basis of the difference in their physiology. Comp Biochem Physiol A Mol Integr Physiol. 2008; 150: 369–377. [DOI] [PubMed] [Google Scholar]


