Abstract
Purpose
We evaluated the incongruous observation whereby flecks in recessive Stargardt disease (STGD1) can exhibit increased short-wavelength autofluorescence (SW-AF) that originates from retinal pigment epithelium (RPE) lipofuscin, while near-infrared AF (NIR-AF), emitted primarily from RPE melanin, is usually reduced or absent at fleck positions.
Methods
Flecks in SW- and NIR-AF images and spectral-domain optical coherence tomography (SD-OCT) scans were studied in 19 STGD1 patients carrying disease-causing ABCA4 mutations. Fleck spatial distribution and progression were recorded in serial AF images.
Results
Flecks observed in SW-AF images typically colocalized with darkened foci in NIR-AF images; the NIR-AF profiles were larger. The decreased NIR-AF signal from flecks preceded apparent changes in SW-AF. Spatiotemporal changes in fleck distribution usually progressed centrifugally, but in one case centripetal expansion was observed. Flecks in SW-AF images corresponded to hyperreflective deposits that progressively traversed photoreceptor-attributable bands in SD-OCT images. Outer nuclear layer (ONL) thickness negatively correlated with expansion of flecks from outer to inner retina.
Conclusions
In the healthy retina, RPE lipofuscin fluorophores form in photoreceptor cells but are transferred to RPE; thus the SW-AF signal from photoreceptor cells is negligible. In STGD1, NIR-AF imaging reveals that flecks are predominantly hypofluorescent and larger and that NIR-AF darkening occurs prior to heightened SW-AF signal. These observations indicate that RPE cells associated with flecks in STGD1 are considerably changed or lost. Spectral-domain OCT findings are indicative of ongoing photoreceptor cell degeneration. The bright SW-AF signal of flecks likely originates from augmented lipofuscin formation in degenerating photoreceptor cells impaired by the failure of RPE.
Keywords: ABCA4, lipofuscin, optical coherence tomography, fundus autofluorescence, recessive Stargardt disease, retinal pigment epithelium, scanning laser ophthalmoscope
Analysis by multimodal imaging indicates that the SW-AF signal of flecks in recessive Stargardt disease may originate not from RPE but from degenerating photoreceptor cells.
Recessive Stargardt disease (STGD1) is characterized by an increase in the fluorescent compounds comprising the lipofuscin of retinal pigment epithelium (RPE) cells. These fluorophores are all-trans-retinaldehyde adducts that undergo accelerated formation due to reduced or absent activity of the adenosine triphosphate binding cassette transporter 4 (ABCA4).1,2 The augmented accumulation of RPE lipofuscin pigments confers a vermillion color to the fundus under white light imaging,3 altered gray level intensities in fundus autofluorescence (AF) images,2,4,5 and often, but not always, a dark choroid in fluorescein angiograms.6 The adverse effects of accelerated lipofuscin deposition also lead to the demise of RPE cells that is visualized as areas of decreased short-wavelength autofluorescence (SW-AF) and near-infrared autofluorescence (NIR-AF).7,8 Particularly conspicuous in SW-AF fundus images obtained from patients with STGD1 are intensely fluorescent foci (flecks) that vary in size and shape; some are surrounded by a halo of reduced autofluorescence.9 With disease progression, flecks typically emerge along the central to peripheral axis of retina in somewhat regular patterns.10 While in SW-AF images the flecks are usually hyperautofluorescent, in NIR-AF images, flecks are most often hypoautofluorescent.8 With time, the SW autofluorescence of flecks undergoes decay.10
The SW-AF of flecks denotes a link to lipofuscin and RPE. Indeed, it has been suggested that flecks reflect lipofuscin-engorged RPE cells, displaced and stacked RPE, and/or remnants of RPE cell lysis.11,12 At the same time, flecks visible in SW-AF images have been equated with hyperreflective material in the RPE/Bruch's membrane and photoreceptor cell-attributable bands in optical cross sections of retina (optical coherence tomography, OCT).13,14 Nevertheless, there has been difficulty reconciling the intraretinal position of flecks with the autofluorescence usually associated with the lipofuscin in RPE. Thus the structural basis and location of flecks are poorly understood, and these lesions are still assumed to be positioned at the level of RPE.15–17
Here we have sought to understand how the SW-AF signal that is assumed to originate primarily from RPE lipofuscin can be increased at fleck positions wherein NIR-AF emitted primarily by melanin in RPE is reduced or absent. Examining flecks across multiple modalities, we have evaluated SW- and NIR-AF patterns, assessed the spatial distribution of flecks with time, and studied the structural changes in retina at the positions of flecks.
Methods
Patients and Genetic Testing
Images from 19 patients (age range, 9–54 years) were studied retrospectively after selection on the basis of the presence of flecks visible in fundus SW-AF images and the availability of SW-AF, NIR-AF, and spectral-domain optical coherence tomography (SD-OCT) images. Clinical diagnosis of STGD1 was confirmed by a retinal specialist (ST). The ABCA4 microarray was used for initial screening of most patients followed by direct Sanger sequencing to confirm identified changes, as previously described.18 followed by next-generation sequencing if only one mutated ABCA4 allele or no ABCA4 mutations were identified by the array.19 More recently recruited patients were screened immediately by next-generation sequencing. Demographic, clinical, and genetic information is presented in the Table. The study was carried out with the approval of the Institutional Review Board of Columbia University and complied with the Health Insurance Portability and Accountability Act of 1996. All patients were enrolled in accordance with the tenets set out in the Declaration of Helsinki. Informed consent was obtained prior to enrollment.
Table.
Summary of Demographic, Clinical, and Genetic Data
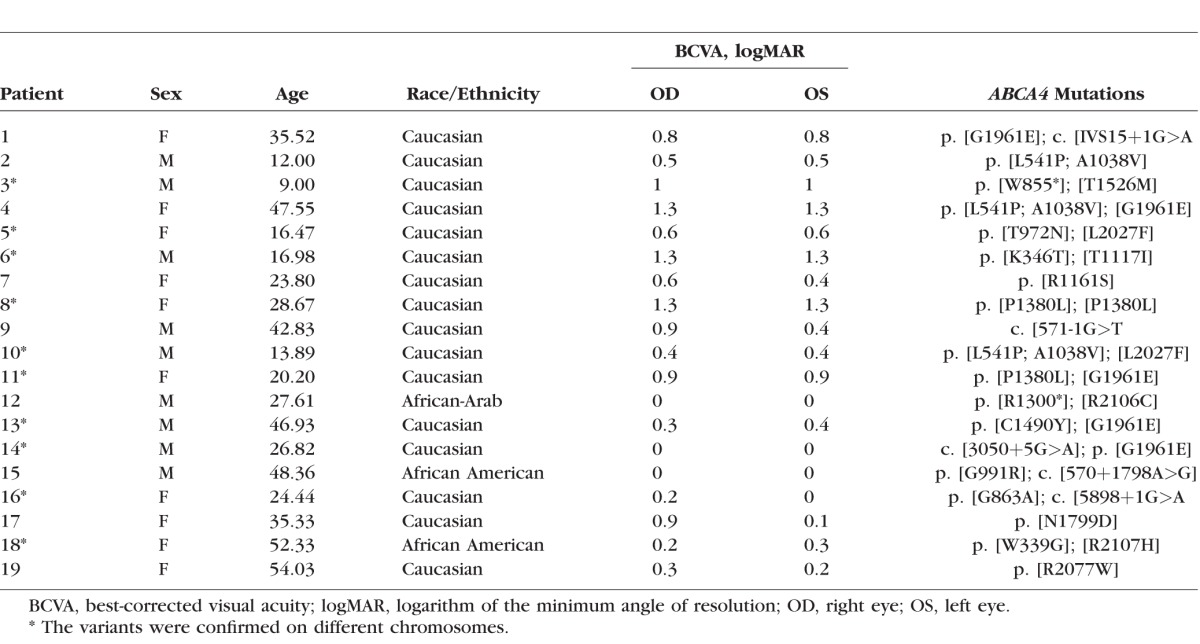
Image Acquisition
Short-wavelength AF images were acquired at 488-nm excitation using a Spectralis HRA+OCT (Heidelberg Engineering, Heidelberg, Germany). A previously described protocol was followed to acquire high-quality SW-AF images that could be used for quantitative analysis.2 Briefly, the beam of light was centered in the dilated pupil (at least 7-mm diameter), and the camera was aligned in all three dimensions to obtain an image with maximum uniformity. The fundus image was focused to reach maximum AF signal intensity and sharpness, and the detector sensitivity was adjusted to avoid nonlinear effects (image saturation). Photopigments were bleached for 20 to 30 seconds while focus and alignment were adjusted.20 Multiple images were acquired in video format (9–12 frames). After imaging, videos were examined for image quality and the frames were then aligned, averaged, and saved in nonnormalized mode (no histogram stretching).
Spectral-domain OCT scans were also acquired with the Spectralis HRA+OCT. Typically, horizontal 9-mm scans through the macula were acquired in high-resolution mode (minimum of 9, maximum of 100 single scans were averaged). The scans were automatically registered to a simultaneously acquired near-infrared reflectance (NIR-R) fundus image, which was later used for point-to-point correlation with other fundus images (see section below). For patients with multiple visits, the follow-up function of the Spectralis was used for precise scan placement. This function enabled the tracking of fleck evolution in SD-OCT scans over time.
Nonnormalized NIR-AF images (30° × 30° field; sensitivity 96) were acquired with an HRA2 (Heidelberg Engineering) as an average of up to 100 single frames using the indocyanin-green angiography mode (787-nm excitation) without injection of dye after focusing the fundus image in NIR-R mode. As in the SW-AF imaging protocol, care was taken to obtain high-quality images with maximum field uniformity.
Image Analysis
All images of each eye were aligned using i2kRetina software (DualAlign LLC, Clifton Park, NY, USA). This processing allowed for correlation of NIR-AF to SW-AF and serial images. Following registration, one Photoshop (Photoshop CS3; Adobe, San Jose, CA, USA) file was created for each eye, and all the images available for the corresponding eye were organized as layers of registered images. This disposition of overlaid images allowed for analysis of specific areas in different imaging modalities and at different intervals of time.
To calculate fleck brightness, mean gray level (±standard deviation, SD; 54 flecks) within the outlined fleck area was determined and the recorded zero gray level was subtracted. The gray level value was then normalized to the mean gray level of an adjacent nonfleck area (684 pixels) that was also outside the dark halo. A new layer was subsequently created, and a mask was generated at the selected area using the paint bucket tool. The magic wand allowed for selection of the mask at a later time.
To analyze flecks spatiotemporally within SW-AF images, a thresholding approach was utilized in Photoshop. First, in each SW-AF image, five nonfleck, nondiseased fundus areas (4356 pixels each) were selected by the operator. The mean gray level intensity (and SD) at these nonfleck fundus positions was determined. Threshold gray level was then calculated as the mean plus three times the standard deviation. Flecks having gray level intensities greater than the threshold were then manually selected and colored coded to indicate the visit (first visit, blue; second, yellow; third, pink). In an SW-AF image field, uniformity is highest out to an eccentricity of 20°20; thus this global thresholding approach was a good approximation. To study the distribution and spatial changes of flecks in wide-angle images, i2kRetina software was used to create fundus montages from multiple 55° field SW-AF images.
The bar visible at the top of some SW-AF images is an internal fluorescence reference installed in the confocal scanning laser ophthalmoscope for quantitative fundus AF studies.
SD-OCT Analysis
Flecks visible in SD-OCT cross sections (total of 94 flecks in both eyes of 19/19 patients) were selected for study if they presented as isolated profiles in the SW-AF images of the right eyes. The nomenclature used for identification of reflectivity bands in SD-OCT has been previously published.21
The hyperreflective deposits traversing photoreceptor-attributable band in the SD-OCT were qualitatively scored in terms of their extents relative to the cone interdigitation zone (IZ; interdigitation of cone outer segments and RPE apical processes) and whether they interrupted or displaced the ellipsoid zone (EZ) and external limiting membrane (ELM). Fleck height was measured on the Heidelberg Eye Explorer software (version 5.10.2) using the measure distance tool. Outer nuclear layer (ONL) thickness was measured at the position of the fleck center (if detectable) and at 150 μm nasal and temporal to the fleck.
Statistical Analyses
Statistical analysis was performed using PRISM 6 (GraphPad Software, Inc., La Jolla, CA, USA).
Results
Short-wavelength AF and NIR-AF images were analyzed in 19 patients (age range, 9–54 years; mean 30.7 years) (Table). For those patients imaged serially, the age reported is the age at last follow-up visit. Two disease-causing ABCA4 variants were detected in 14 patients and one mutation in the remaining 5 patients. Clinical and genetic findings are presented in the Table. Short-wavelength AF images from serial visits were available from 10 patients (two visits, 6 patients; three visits, 4 patients); 2 of these 10 patients also had serial NIR-AF images.
Flecks in SW-AF and NIR-AF Images
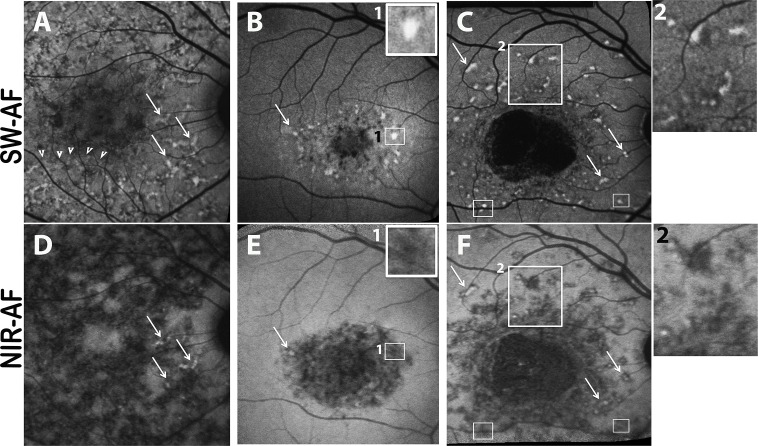
Images of STGD1 patients presented with a central area of abnormally reduced SW-AF signal (19/19 patients) surrounded by a heterogeneous region of hypo- and hyperautofluorescence across the macula (Fig. 1). Retinal flecks were readily identifiable in SW-AF images as hyperautofluorescent foci of varying shape and size (Fig. 1). Flecks were located in the perifoveal areas or were more diffusely distributed throughout the fundus. Some flecks presented as isolated inclusions; others contacted each other, producing a web-like appearance (Figs. 1B, 1C). Flecks could have distinct borders or their edges could be less well defined (Fig. 1). As previously reported,9 some flecks visible as bright foci in SW-AF images were surrounded by a halo of reduced SW autofluorescence (Fig. 1C).
Figure 1.
Autofluorescent flecks viewed in short-wavelength autofluorescence (SW-AF) (A–C) and near-infrared autofluorescence (NIR-AF) (D–F) images of patient 16 (A, D), patient 4 (B, E), and patient 17 (C, F). Flecks can be widespread (A, D) or limited to perifoveal areas (B, E) and can be isolated (C, F) or in contact with one another (area in [A] indicated by arrowheads). Flecks identified as bright profiles in SW-AF images are most often dark in NIR-AF images (B, E; C, F). Flecks that exhibit SW hyperautofluorescence (arrows in [A–C]) can sometimes have central NIR-AF intensity (arrows in [D–F]). In SW-AF images, flecks can exhibit a dark halo ([C] inset 2). The area of bright SW-AF signal in flecks ([B] inset 1; [C] small rectangles) is typically smaller than the area of low NIR-AF of flecks ([E] inset 1; [F] small rectangles).
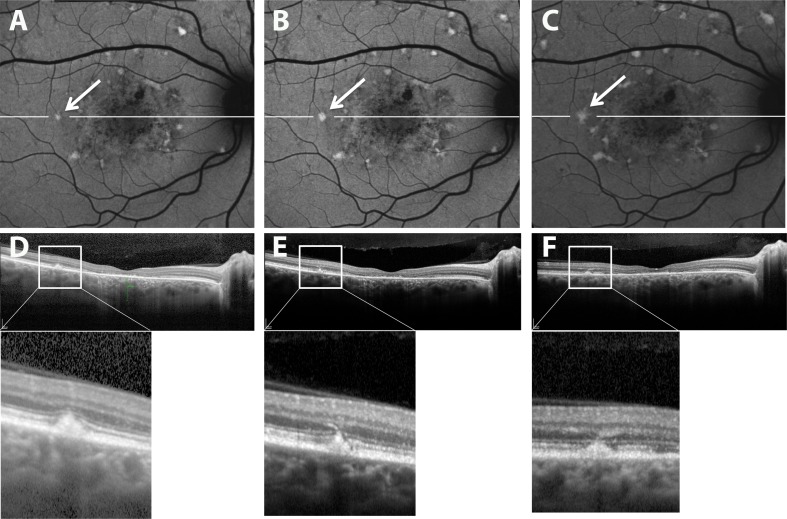
In all patients, dual imaging of NIR-AF and SW-AF was performed. The bright foci identified as flecks in SW-AF images typically colocalized with darkened foci in NIR-AF images (19/19 patients) (Figs. 1D–F), but the NIR-AF profiles were often slightly larger (Figs. 1B, 1E; 1C, 1F). Additionally, in patient 5, in whom longitudinal SW-AF and NIR-AF images were acquired within a 6-month interval, we observed flecks presenting with hypofluorescence in NIR-AF images before elevated SW-AF (Fig. 2). Flecks that were visible as foci in SW-AF images could be situated within or adjacent to large areas of atrophy detected with NIR-AF imaging (Figs. 1A, 1D).
Figure 2.

Serial short-wavelength autofluorescence (SW-AF) (A, C) and near-infrared autofluorescence (NIR-AF) (B) imaging in recessive Stargardt disease (STGD1). Patient 5. Short-wavelength AF image in (C) was obtained 6 months after image in (A). Hypoautofluorescent flecks are visible in the NIR-AF image (B) before appearing hyperautofluorescent in SW-AF images ([A] versus [C]).
Spatial Distribution of Flecks
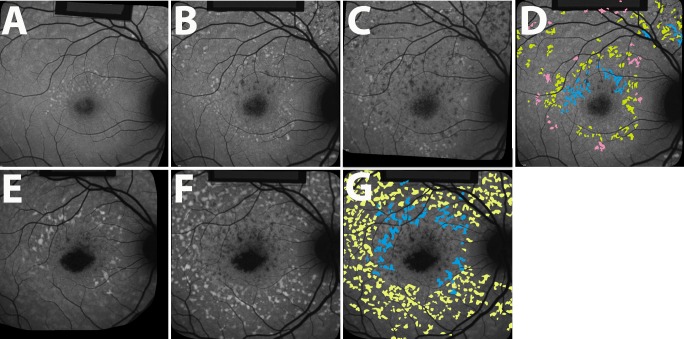
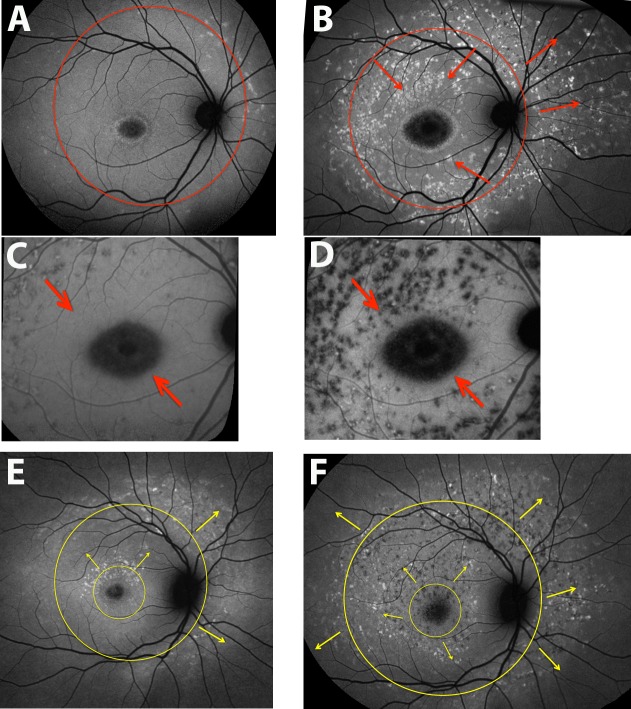
In 10 patients, serial SW-AF images were acquired, thus permitting longitudinal tracking of individual flecks and an analysis of fleck distribution with time. For the analysis of fleck distribution, 1606 flecks were included based on their detection in SW-AF images. As previously reported,10 spatiotemporal changes in fleck distribution were usually consistent with centrifugal spread (8/10 patients) (Fig. 3), although in one patient (patient 14) a pattern was not discernible. Additionally, in patient 2 the pattern of fleck expansion followed a centripetal direction on SW-AF (Figs. 4A, 4B), which was also visible in NIR-AF images (Figs. 4C, 4D). As shown in Figure 4, the directions of fleck progression were best illustrated in wide-field images. In some cases, two systems of fleck expansion could be identified, one that encircled the fovea and a second that formed outside the arcades (Figs. 4A, 4B, 4E, 4F). Occasionally, flecks exhibited a bright center in both SW- and NIR-AF images; and on these occasions, the flecks tended to be at the frontlines of the spatial progression (Fig. 3J) and the NIR-AF fleck profile included a dark halo.
Figure 3.
Spatial-temporal progression of fleck distribution. Longitudinal changes in fleck distribution demonstrated using short-wavelength autofluorescence (SW-AF). Flecks were identified using the thresholding technique described in the Methods. The spreading of flecks in these patients exhibits a centrifugal pattern. Temporal progression is indicated: first visit, blue; second visit 1 year later, yellow; third visit after another year, pink. Patient 5 (A–D), patient 6 (E–G). The black borders visible in some parts of figure were created by i2KRetina software during automatic image registration and alignment.
Figure 4.
Spatial progression of fundus flecks. Short-wavelength autofluorescence (SW-AF) wide-field (A, B, E, F) and near-infrared autofluorescence (NIR-AF) (C, D) images. Patient 2 (A–D), patient 5 (E, F). Centripetal and centrifugal patterns of fleck spreading are indicated with arrows. (A) A 55° field; (B, E, F) montages created as described in the Methods. The pattern of spread is also visible in NIR-AF images (C, D).
SD-OCT Analysis
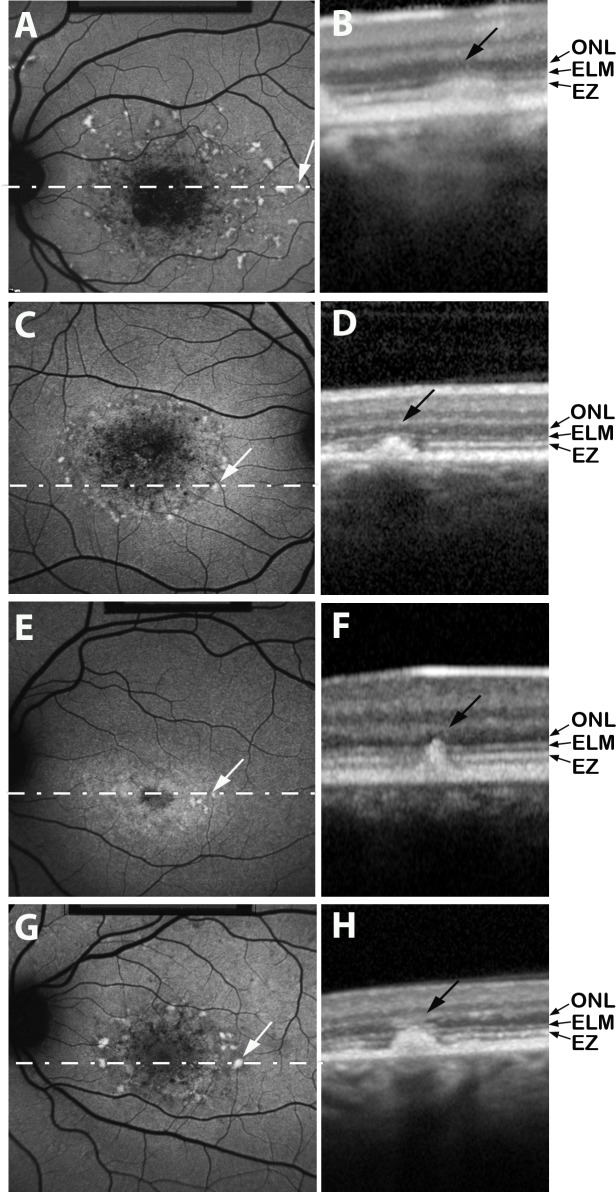
Flecks identified in SW-AF images corresponded to locations in SD-OCT images where hyperreflective deposits traversed photoreceptor-attributable OCT bands (Fig. 5). Optical coherence tomography bands at the position of the fleck were melded into barrel- or pyramidal-shaped deposits. In some cases the hyperreflective deposit appeared to be a thickening of the area attributable to the IZ band, while in other flecks the deposits extended through the EZ and ELM and impinged on ONL (Figs. 5B, 5D, 5F, 5H). Reduced reflectivity of the EZ and ELM bands could also be observed adjacent to the fleck material (Figs. 5F, 5H). Fleck height increased and ONL thickness decreased as the hyperreflective deposit progressively incorporated photoreceptor-attributable OCT bands (Figs. 6A, 6B). When flecks were viewed at the fundus using SW-AF, they varied in fluorescence intensity (Figs. 2, 4); however, the brightness of flecks did not differ as a function of fleck radial expansion in SD-OCT images. Specifically, as flecks extended radially and successively interrupted the IZ, EZ, and ELM bands, the fluorescence intensity of the flecks did not noticeably change (Fig. 6C). The absence of a correlation was the same whether the values were normalized or not normalized (not shown) to adjacent nonfleck retina.
Figure 5.
Short-wavelength fundus autofluorescence (SW-AF) images (A, C, E, G) registered to spectral-domain optical coherence tomography (SD-OCT) scans (B, D, F, H). The location of each horizontal SD-OCT scan is illustrated by a dashed white line superimposed on the SW-AF image. Flecks are visible as hyperreflective radial deposits in SD-OCT images; these hyperreflective aberrations progressively incorporate photoreceptor cell-associated hyperreflectivity bands identified as EZ (ellipsoid zone), ELM (external limiting membrane), and ONL (outer nuclear layer). Choroidal reflectivity below the fleck is blocked in (H). Patient 4 (A, B), patient 9 (C, D), patient 11 (E, F), patient 19 (G, H).
Figure 6.

Quantitative analysis of flecks. (A) Fleck height increases as fleck hyperreflectivity expands radially to IZ (interdigitation zone), to EZ (ellipsoid zone) also, and to external limiting membrane (ELM) also. Individual values (open circles), mean values (thick horizontal lines), and 95% confidence intervals (thin horizontal lines) are plotted. Fleck height (94 flecks) was measured in both eyes of all 19 patients. (B) Outer nuclear layer (ONL) thickness is reduced as fleck hyperreflectivity expands in the direction of inner retina. Thickness of ONL over 87 flecks was measured in both eyes of all 19 patients. For 7 flecks, ONL over the fleck was not detectable. (C) Fleck brightness measured as grayscale levels and normalized to adjacent off-fleck gray levels. Fleck gray levels were obtained from right eyes of all 19 patients (54 flecks). Numbers of values are indicated in parentheses. Statistically significant differences as indicated (P < 0.05) were determined by one-way ANOVA and Tukey's multiple comparisons test.
Typically, the hyperreflective deposits corresponding to flecks in SW-AF images did not displace outer retinal layers inward. Rather, the EZ and/or ELM bands were interrupted at the fleck while being continuous on either side of the fleck (Fig. 7). Extension of the hyperreflective deposits up into the ONL-attributable band was readily visible due to the contrast with the hyporeflectivity of the latter. Thinning of ONL over the fleck was observed (Fig. 6B); this thinning increased as the fleck extended from the IZ to ELM and then ONL-attributable bands. For seven flecks, ONL over the fleck was not detectable. The inner retina did not appear to be altered. As shown in Figure 8, resorbed flecks detectable because of fading of fleck AF in SW-AF images17 was associated with a conversion from hyperreflectivity to hyporeflectivity at the fleck position identified by SD-OCT. Thus flecks that in serial images exhibited SW-fluorescence fading were hyporeflective in SD-OCT images (Fig. 8).
Figure 7.
Retinal fleck imaged by confocal scanning laser ophthalmoscopy using short-wavelength autofluorescence (SW-AF) (A–C) and SD-OCT (D–F) (patient 19). Horizontal SD-OCT scans at level shown by white line in (A–C). Images in (B) and (E) were acquired 4 months after images in (A) and (D). Images in (C) and (F) acquired 8 months after images in (A) and (D). Fleck (arrows) interrupts photoreceptor-associated hyperreflectivity bands.
Figure 8.
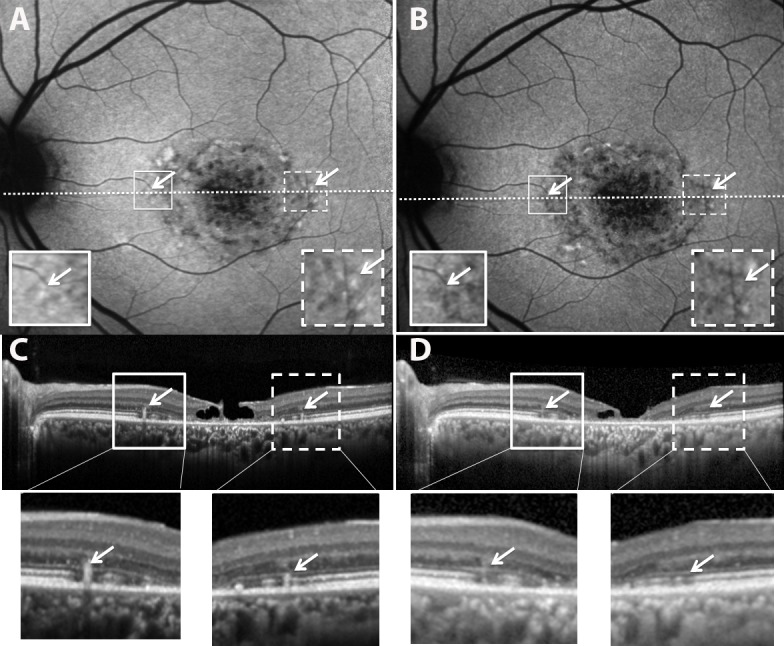
Resorbing flecks in SW-AF and SD-OCT images (patient 1). Images in (B) and (D) were acquired 2.3 years after images in (A) and (C). Flecks having reduced brightness in the SW-AF image in (B) ([B] versus [A], arrows) also exhibit hyporeflectivity in the SD-OCT scan ([D] versus [C]). Expanded views of the outlined areas in (A) and (B) and shown as insets; expanded views of outlined areas in (C) and (D) are shown below.
Discussion
Although the natural history of ABCA4-related disease is not fully understood, it is well known that SW-AF emission at the fundus is increased.2,4,5 A generalized increase in NIR-AF signal has also been reported in STGD1 patients,22,23 together with more localized alterations in intensity.8,24 Indeed, it has been noted that in STGD1, NIR-AF imaging provides a means to visualize RPE changes that precede SW-AF abnormalities.8 The NIR-AF signal emanates primarily from RPE melanin, although there is also a contribution from choroidal melanocytes.25–28 On the other hand, SW-AF is emitted by the fluorescent bisretinoids of RPE lipofuscin that originate in photoreceptor cells. In the healthy eye, these bisretinoids are kept to a minimum in photoreceptor cells due to a fully functional ABCA4 protein, efficient reduction of retinaldehyde, daily shedding of outer segment membrane, and phagocytic transfer to RPE.
Retinal flecks are also a prominent clinical feature of STGD1. Thus it is important to achieve an understanding of the structural underpinnings and disease processes responsible for the emergence of AF flecks. We observed here that the spatiotemporal appearance of flecks in the STGD1 fundus usually progressed centrifugally, as previously described,10 although in one case we observed centripetal expansion. Occasionally flecks exhibited brightness in both SW-AF and NIR-AF images; but far more frequently, the intense SW-AF of flecks colocalized with darkened foci in NIR-AF images. This difference in the SW-AF and NIR-AF signaling of flecks is consistent with earlier reports.8,10 Flecks identified in SW-AF images also corresponded to hyperreflective deposits traversing photoreceptor-attributable bands in SD-OCT scans. Outer nuclear layer thinning over the hyperreflective fleck deposit was observed; and as flecks expanded radially they progressively interrupted, rather than displaced, the IZ, EZ, and ELM bands. Instead of reflecting a range of fleck types, we view the outer to inner expansion of fleck deposits in SD-OCT scans as being indicative of stages in the degeneration of photoreceptor cells within individual flecks. The photoreceptor cell degeneration observed by SD-OCT is consistent with the decreased sensitivity detected with microperimetric testing of fleck versus nonfleck areas.29
Since in the current work image acquisition was preceded by bleaching of photoreceptor visual pigment, it is unlikely that RPE autofluorescence unmasking secondary to outer segment degeneration and photopigment loss can account for the hyperautofluorescence of flecks in SW-AF images. Additionally, the reduced or absent NIR-AF at positions of flecks is unlikely to be due to reduced light transmission since tissue absorption is negligible at wavelengths of 600 to 1300 nm.30
Because flecks emit a SW-AF signal, it has been assumed that they represent the presence of RPE in STGD1.10,31 In addition to large areas of macula that are devoid of RPE, reports of histopathological studies have included lipofuscin-filled enlarged RPE cells with increased lipofuscin and apically displaced or reduced melanin in STDG1.11,32,33 Some of these enlarged cells extend above the surrounding RPE monolayer,33,34 and cell lysis has been observed.32 Unexpectedly, one study describing these swollen cells reported normal levels of lipofuscin.34 Taken together, these observations are indicative of RPE abnormalities, but it is not known whether these aberrant cells correspond to the fundus flecks observed in SW-AF images and SD-OCT scans. Disease-related foci of elevated SW-AF35 can originate from superimposed RPE cells such as those shown to sometimes occur36 within the junctional zone of geographic atrophy (GA) in AMD. These abnormalities probably account for the increased, not decreased, NIR-AF signal surrounding areas of GA.37,38 The distortion of the RPE monolayer by sub-RPE drusen is also reported to create patterns of increased SW-AF.39 We note, however, that while drusen displace outer retinal layers,40,41 in our study flecks were not associated with a similar displacement of photoreceptor-attributable reflectance bands (Fig. 6). Thus we cannot conclude that flecks represent an expansion of the RPE/Bruch's membrane complex.
The finding in the current study that in NIR-AF images flecks are predominantly hypofluorescent could reflect abnormal RPE cells with reduced or absent melanin.11 This could be the situation if RPE cells flatten and spread to cover adjacent sites of RPE cell loss, as has been suggested.8,32 These cells might retain the SW-AF signal from lipofuscin; alternatively, lipofuscin and melanin density could both be decreased by cellular spreading. It is worth noting that in retinitis pigmentosa, areas of retina peripheral to a central hyperautofluorescent ring exhibit reduced NIR-AF signal42 attributable to attenuated RPE having greatly reduced numbers of melanosomes.43,44 These cells have likely spread to replace other members of this population that have migrated to perivascular sites and formed bone spicule pigmentations.45
There remains an additional possibility to explain the change in NIR-AF: that the absence or reduction of NIR-AF in advance of the increase in SW-AF of flecks denotes a loss of RPE cells. If this were the case, the absence of RPE at positions of flecks would exclude these cells as the origin of the SW-AF emission. As an alternative source of the SW-AF of flecks, we suggest that this emission derives from photoreceptor outer and inner segments that are degenerating secondary to RPE atrophy. The notion of SW-AF being generated from inner and outer segments is supported by previous reports of the presence of lipofuscin-like material in the inner segments of photoreceptor cells of the STGD1 retina.32 Additionally, when outer segment phagocytosis fails as in the Royal College of Surgeon rat, the outer segment debris accumulating in the subretinal space emits an autofluorescence.46–48 Moreover, in mutant mouse retina, the inner and outer segments of photoreceptor cells projecting into the center of photoreceptor cell rosettes emit an AF.49 Indeed, the lipofuscin biosynthetic pathway could be accelerated in disabled photoreceptor cells that are unable to sustain the work of reducing reactive all-trans-retinaldehyde generated when visual pigment absorbs photons. Amplified bisretinoid formation in photoreceptor cells would lead to increased fundus AF intensity.50 The subsequent decrease in SW-AF in old flecks10 that is accompanied by reduced reflectivity in SD-OCT images (Fig. 8) could be due to autofluorescence photobleaching and/or resolution of the degenerating debris.51
One of the limitations of this work is that we did not have specimens that would have allowed us to correlate SW-AF, NIR AF, and SD-OCT findings with histopathological changes. In addition, SD-OCT imaging has its limitations. For instance, the hyperreflectivity of the RPE/Bruch's membrane-attributable band in SD-OCT images cannot be readily differentiated from the signal of similar intensity originating from the hyperreflective material constituting flecks.
When information related to the integrity of the RPE monolayer is provided by NIR-AF and is combined with evidence from SW-AF and SD-OCT imaging, it is generally concluded that RPE alterations precede photoreceptor cell degeneration in STGD1.8,22,52 The SD-OCT findings reported here, including interrupted IZ and ELM and ONL thinning, indicate that fundus flecks track photoreceptor cell degeneration in STGD1. By giving consideration to photoreceptor cells as the source of the heightened SW-AF intensity of flecks, we also allow for therapeutic implications. Since heightened bisretinoid levels in photoreceptor cells could be toxic, thereby accelerating photoreceptor degeneration, interventions that limit bisretinoid production53 may directly aid in preserving photoreceptor cells. Perhaps therapeutic effectiveness could be assessed by evaluating fleck numbers and progression.
Acknowledgments
Supported in part by National Eye Institute/National Institutes of Health Grants EY024091, EY021163, and EY019007 (Core Support for Vision Research), and a grant from Research to Prevent Blindness to the Department of Ophthalmology, Columbia University. The authors alone are responsible for the content and writing of the paper.
Disclosure: J.R. Sparrow, None; M. Marsiglia, None; R. Allikmets, None; S. Tsang, None; W. Lee, None; T. Duncker, None; J. Zernant, None
References
- 1. Allikmets R,, Singh N,, Sun H,, et al. A photoreceptor cell-specific ATP-binding transporter gene (ABCR) is mutated in recessive Stargardt macular dystrophy. Nat Genet. 1997; 15: 236–246. [DOI] [PubMed] [Google Scholar]
- 2. Burke TR,, Duncker T,, Woods RL,, et al. Quantitative fundus autofluorescence in recessive stargardt disease. Invest Ophthalmol Vis Sci. 2014; 55: 2841–2852. [DOI] [PMC free article] [PubMed] [Google Scholar]
- 3. Bottoni F,, Fatigati G,, Carlevaro G,, De Molfetta V. Fundus flavimaculatus and subretinal neovascularization. Graefes Arch Clin Exp Ophthalmol. 1992; 230: 498–500. [DOI] [PubMed] [Google Scholar]
- 4. von Ruckmann A,, Fitzke FW,, Bird AC. In vivo fundus autofluorescence in macular dystrophies. Arch Ophthalmol. 1997; 115: 609–615. [DOI] [PubMed] [Google Scholar]
- 5. Lois N,, Halfyard AS,, Bird AC,, Holder GE,, Fitzke FW. Fundus autofluorescence in Stargardt macular dystrophy-fundus flavimaculatus. Am J Ophthalmol. 2004; 138: 55–63. [DOI] [PubMed] [Google Scholar]
- 6. Fishman GA,, Stone EM,, Grover S,, Derlacki DJ,, Haines HL,, Hockey RR. Variation of clinical expression in patients with Stargardt dystrophy and sequence variations in the ABCR gene. Arch Ophthalmol. 1999; 117: 504–510. [DOI] [PubMed] [Google Scholar]
- 7. Cideciyan AV,, Aleman TS,, Swider M,, et al. Mutations in ABCA4 result in accumulation of lipofuscin before slowing of the retinoid cycle: a reappraisal of the human disease sequence. Hum Mol Genet. 2004; 13: 525–534. [DOI] [PubMed] [Google Scholar]
- 8. Kellner S,, Kellner U,, Weber BH,, Fiebig B,, Weinitz S,, Ruether K. Lipofuscin- and melanin-related fundus autofluorescence in patients with ABCA4-associated retinal dystrophies. Am J Ophthalmol. 2009; 147: 895–902. [DOI] [PubMed] [Google Scholar]
- 9. Westeneng-van Haaften SC,, Boon CJ,, Cremers FP,, Hoefsloot LH,, den Hollander AI,, Hoyng CB. Clinical and genetic characteristics of late-onset Stargardt's disease. Ophthalmology. 2012; 1199–1210. [DOI] [PubMed]
- 10. Cukras CA,, Wong WT,, Caruso R,, Cunningham D,, Zein W,, Sieving PA. Centrifugal expansion of fundus autofluorescence patterns in Stargardt disease over time. Arch Ophthalmol. 2012; 130: 171–179. [DOI] [PMC free article] [PubMed] [Google Scholar]
- 11. Eagle RC,, Lucier AC,, Bernardino VB,, Yanoff M. Retinal pigment epithelial abnormalities in fundus flavimaculatus. Ophthalmology. 1980; 87: 1189–1200. [DOI] [PubMed] [Google Scholar]
- 12. Lopez PF,, Maumenee IH,, de la Cruz Z,, Green WR. Autosomal-dominant fundus favimaculatus. Clinicopathologic correlation. Ophthalmology. 1990; 97: 798–809. [DOI] [PubMed] [Google Scholar]
- 13. Querques G,, Leveziel N,, Benhamou N,, Voigt M,, Soubrane G,, Souied EH. Analysis of retinal flecks in fundus flavimaculatus using optical coherence tomography. Br J Ophthalmol. 2006; 90: 1157–1162. [DOI] [PMC free article] [PubMed] [Google Scholar]
- 14. Voigt M,, Querques G,, Atmani K,, et al. Analysis of retinal flecks in fundus flavimaculatus using high-definition spectral-domain optical coherence tomography. Am J Ophthalmol. 2010; 150: 330–337. [DOI] [PubMed] [Google Scholar]
- 15. Fujinami K,, Sergouniotis PI,, Davidson AE,, et al. Clinical and molecular analysis of Stargardt disease with preserved foveal structure and function. Am J Ophthalmol. 2013; 156: 487–501, e481. [DOI] [PubMed] [Google Scholar]
- 16. Sisk RA,, Leng T. Multimodal imaging and multifocal electroretinography demonstrate autosomal recessive Stargardt disease may present like occult macular dystrophy. Retina. 2014; 34: 1567–1575. [DOI] [PubMed] [Google Scholar]
- 17. Ritter M,, Zotter S,, Schmidt WM,, et al. Characterization of Stargardt disease using polarization-sensitive optical coherence tomography and fundus autofluorescence imaging. Invest Ophthalmol Vis Sci. 2013; 54: 6416–6425. [DOI] [PubMed] [Google Scholar]
- 18. Jaakson K,, Zernant J,, Kulm M,, et al. Genotyping microarray (gene chip) for the ABCR (ABCA4) gene. Hum Mutat. 2003; 22: 395–403. [DOI] [PubMed] [Google Scholar]
- 19. Zernant J,, Schubert C,, Im KM,, et al. Analysis of the ABCA4 gene by next-generation sequencing. Invest Ophthalmol Vis Sci. 2011; 52: 8479–8487. [DOI] [PMC free article] [PubMed] [Google Scholar]
- 20. Delori F,, Greenberg JP,, Woods RL,, et al. Quantitative measurements of autofluorescence with the scanning laser ophthalmoscope. Invest Ophthalmol Vis Sci. 2011; 52: 9379–9390. [DOI] [PMC free article] [PubMed] [Google Scholar]
- 21. Staurenghi G,, Sadda S,, Chakravarthy U,, Spaide RF. Proposed lexicon for atomic landmarks in normal posterior segment spectral-domain optical coherence tomography: the IN*OCT consensus. Ophthalmology. 2014; 121: 1572–1578. [DOI] [PubMed] [Google Scholar]
- 22. Cideciyan AV,, Swider M,, Aleman TS,, Roman MI,, Sumaroka A,, Schwartz SB. Reduced-illuminance autofluorescence imaging in ABCA4-associated retinal degenerations. J Opt Soc Am A Opt Image Sci Vis. 2007; 24: 1457–1467. [DOI] [PMC free article] [PubMed] [Google Scholar]
- 23. Duncker T,, Lee W,, Tsang SH,, et al. Distinct characteristics of inferonasal fundus autofluorescence patterns in stargardt disease and retinitis pigmentosa. Invest Ophthalmol Vis Sci. 2013; 54: 6820–6826. [DOI] [PMC free article] [PubMed] [Google Scholar]
- 24. Greenstein VC,, Schuman AD,, Lee W,, et al. Near-infrared autofluorescence: its relationship to short-wavelength autofluorescence and optical coherence tomography in recessive stargardt disease. Invest Ophthalmol Vis Sci. 2015; 56: 3226–3234. [DOI] [PMC free article] [PubMed] [Google Scholar]
- 25. Delori FC,, Keilhauer C,, Sparrow JR,, Staurenghi G. Origin of fundus autofluorescence. : Holz FG,, Schmitz-Valckenberg S,, Spaide RF,, Bird AC, Atlas of Fundus Autofluorescence Imaging. Berlin, Heidelberg: Springer-Verlag; 2007: 17–29. [Google Scholar]
- 26. Keilhauer CN,, Delori FC. Near-infrared autofluorescence imaging of the fundus: visualization of ocular melanin. Invest Ophthalmol Vis Sci. 2006; 47: 3556–3564. [DOI] [PubMed] [Google Scholar]
- 27. Schmitz-Valckenberg S,, Lara D,, Nizari S,, et al. Localisation and significance of in vivo near-infrared autofluorescent signal in retinal imaging. Br J Ophthalmol. 2011; 95: 1134–1139. [DOI] [PubMed] [Google Scholar]
- 28. Gibbs D,, Cideciyan AV,, Jacobson SG,, Williams DS. Retinal pigment epithelium defects in humans and mice with mutations in MYO7A: imaging melanosome-specific autofluorescence. Invest Ophthalmol Vis Sci. 2009; 50: 4386–4393. [DOI] [PMC free article] [PubMed] [Google Scholar]
- 29. Verdina T,, Tsang SH,, Greenstein VC,, et al. Functional analysis of retinal flecks in Stargardt disease. J Clin Exp Ophthalmol. 2012; 3 doi:http://dx.doi.org/10.4172/2155-9570.1000233. [DOI] [PMC free article] [PubMed]
- 30. Tsai CL,, Chen JC,, Wang WJ. Near-infrared absorption property of biological soft tissue constituents. J Med Biol Eng. 2001; 21: 7–14. [Google Scholar]
- 31. Gomes NL,, Greenstein VC,, Carlson JN,, et al. A comparison of fundus autofluorescence and retinal structure in patients with Stargardt disease. Invest Ophthalmol Vis Sci. 2009; 50: 3953–3959. [DOI] [PMC free article] [PubMed] [Google Scholar]
- 32. Birnbach CD,, Jarvelainen M,, Possin DE,, Milam AH. Histopathology and immunocytochemistry of the neurosensory retina in fundus flavimaculatus. Ophthalmology. 1994; 101: 1211–1219. [DOI] [PubMed] [Google Scholar]
- 33. Steinmetz RL,, Garner A,, Maguire JI,, Bird AC. Histopathology of incipient fundus flavimaculatus. Ophthalmology. 1991; 98: 953–956. [DOI] [PubMed] [Google Scholar]
- 34. McDonnell PJ,, Kivlin JD,, Maumenee IH,, Green WR. Fundus flavimaculatus without maculopathy. A clinicopathologic study. Ophthalmology. 1986; 93: 116–119. [DOI] [PubMed] [Google Scholar]
- 35. Holz FG,, Bellmann C,, Margaritidis M,, Schutt F,, Otto TP,, Volcker HE. Patterns of increased in vivo fundus autofluorescence in the junctional zone of geographic atrophy of the retinal pigment epithelium associated with age-related macular degeneration. Graefes Arch Clin Exp Ophthalmol. 1999; 237: 145–152. [DOI] [PubMed] [Google Scholar]
- 36. Rudolf M,, Vogt SD,, Curcio CA,, et al. Histologic basis of variations in retinal pigment epithelium autofluorescence in eyes with geographic atrophy. Ophthalmology. 2013; 120: 821–828. [DOI] [PMC free article] [PubMed] [Google Scholar]
- 37. Kellner U,, Kellner S,, Weinitz S. Fundus autofluorescence (488 nm) and near-infrared autofluorescence (787 nm) visualize different retinal pigment epithelium alterations in patients with age-related macular degeneration. Retina. 2010; 30: 6–15. [DOI] [PubMed] [Google Scholar]
- 38. Pilotto E,, Guidolin F,, Convento E,, et al. Fundus autofluorescence and microperimetry in progressing geographic atrophy secondary to age-related macular degeneration. Br J Ophthalmol. 2013; 97: 622–626. [DOI] [PubMed] [Google Scholar]
- 39. Delori FC,, Fleckner MR,, Goger DG,, Weiter JJ,, Dorey CK. Autofluorescence distribution associated with drusen in age-related macular degeneration. Invest Ophthalmol Vis Sci. 2000; 41: 496–504. [PubMed] [Google Scholar]
- 40. Schuman SG,, Koreishi AF,, Farsiu S,, Jung SH,, Izatt JA,, Toth CA. Photoreceptor layer thinning over drusen in eyes with age-related macular degeneration imaged in vivo with spectral-domain optical coherence tomography. Ophthalmology. 2009; 116: 488–496. [DOI] [PMC free article] [PubMed] [Google Scholar]
- 41. Leuschen JN,, Schuman SG,, Winter KP,, et al. Spectral-domain optical coherence tomography characteristics of intermediate age-related macular degeneration. Ophthalmology. 2013; 120: 140–150. [DOI] [PMC free article] [PubMed] [Google Scholar]
- 42. Kellner U,, Kellner S,, Weber BH,, Fiebig B,, Weinitz S,, Ruether K. Lipofuscin- and melanin-related fundus autofluorescence visualize different retinal pigment epithelial alterations in patients with retinitis pigmentosa. Eye (Lond). 2009; 23: 1349–1359. [DOI] [PubMed] [Google Scholar]
- 43. Szamier RB,, Berson EL,, Klein R,, Meyers S. Sex-linked retinitis pigmentosa: ultrastructure of photoreceptors and pigment epithelium. Invest Ophthalmol Vis Sci. 1979; 18: 145–160. [PubMed] [Google Scholar]
- 44. Szamier RB,, Berson EL. Retinal ultrastructure in advanced retinitis pigmentosa. Invest Ophthalmol Vis Sci. 1977; 16: 947–962. [PubMed] [Google Scholar]
- 45. Li ZY,, Possin DE,, Milam AH. Histopathology of bone spicule pigmentation in retinitis pigmentosa. Ophthalmology. 1995; 102: 805–816. [DOI] [PubMed] [Google Scholar]
- 46. Dowling JE,, Sidman RL. Inherited retinal dystrophy in the rat. J Cell Biol. 1962; 14: 73–109. [DOI] [PMC free article] [PubMed] [Google Scholar]
- 47. Matthes MT,, La Vail MM. Inherited retinal dystrophy in the RCS rat: composition of the outer segment debris zone. Prog Clin Biol Res. 1989; 314: 315–330. [PubMed] [Google Scholar]
- 48. D'Cruz PM,, Yasumura D,, Weir J,, et al. Mutation of the receptor tyrosine kinase gene Mertk in the retinal dystrophic RCS rat. Hum Mol Genet. 2000; 9: 645–651. [DOI] [PubMed] [Google Scholar]
- 49. Flynn E,, Ueda K,, Auran E,, Sullivan JM,, Sparrow JR. Fundus autofluorescence and photoreceptor cell rosettes in mouse models. Invest Ophthalmol Vis Sci. 2014; 55: 5643–5652. [DOI] [PMC free article] [PubMed] [Google Scholar]
- 50. Sparrow JR,, Yoon K,, Wu Y,, Yamamoto K. Interpretations of fundus autofluorescence from studies of the bisretinoids of retina. Invest Ophthalmol Vis Sci. 2010; 51: 4351–4357. [DOI] [PMC free article] [PubMed] [Google Scholar]
- 51. Sparrow JR,, Gregory-Roberts E,, Yamamoto K,, et al. The bisretinoids of retinal pigment epithelium. Prog Retin Eye Res. 2012; 31: 121–135. [DOI] [PMC free article] [PubMed] [Google Scholar]
- 52. Duncker T,, Marsiglia M,, Lee W,, et al. Correlations amongst near-infrared and short-wavelength autofluorescence and spectral domain optical coherence tomography in recessive Stargardt disease. Invest Ophthalmol Vis Sci. 2014; 55: 8134–8143. [DOI] [PMC free article] [PubMed] [Google Scholar]
- 53. Zarbin MA,, Rosenfeld PJ. Pathway-based therapies for age-related macular degeneration. An integrated survey of emerging treatment alternatives. Retina. 2010; 30: 1350–1367. [DOI] [PubMed] [Google Scholar]


