Abstract
With the rapid development of genome-wide high-throughput technologies, including expression arrays, SNP arrays and next-generation sequencing platforms, enormous amounts of molecular data have been generated and deposited in the public domain. The application of computational approaches is required to yield biological insights from this enormous, ever-growing resource. A particularly interesting subset of these resources is related to epigenetic regulation, with DNA methylation being the most abundant data type. In this paper, we will focus on the analysis of DNA methylation data and its application to cancer studies. We first briefly review the molecular techniques that generate such data, much of which has been obtained with the use of the most recent version of Infinium HumanMethylation450 BeadChip® technology (Illumina, CA, USA). We describe the coverage of the methylome by this technique. Several examples of data mining are provided. However, it should be understood that reliance on a single aspect of epigenetics has its limitations. In the not too distant future, these defects may be rectified, providing scientists with previously unavailable opportunities to explore in detail the role of epigenetics in cancer and other disease states.
Keywords: cancer/testis antigen, computational biology, data analysis, DNA methylation, Encyclopedia of DNA Elements Consortium, gene expression, imprinted gene, Infinium HumanMethylation450 BeadChip®, NIH Roadmap Epigenomics Mapping Consortium, The Cancer Genome Atlas
After the completion of the human genome project, the molecular biology field has witnessed rapid progress in high-throughput methods during the past decade. For example, genome-wide microarray platforms have been developed to measure gene expression [l], protein–DNA interaction [2], genotyping [3], and, more recently, DNA methylation [4,5]. In addition, the advancement of DNA sequencing technologies has revolutionized such measurements [6]. Accordingly, massive amounts of data have become available, posing a challenge for both experimental and computational biologists to use and integrate such data in a meaningful and efficient way. Nonetheless, such comprehensive public datasets also offer great opportunities for scientists at all levels to validate findings and to generate and test hypotheses. Among the various data types, DNA methylation profiling is becoming more prevalent and will be the main focus of this review.
During DNA methylation in mammalian cells, a methyl group is added to the cytosine nucleotides to form a methylcytosine. Such modifications, in general, occur on CpG dinucleotides, although abundant DNA methylation in non-CpG contexts has recently been described at a genome-wide level in stem cells [6]. At the biochemical level, the methy-lated cytosine can be differentiated, isolated or marked by methylation-sensitive restriction digestion, methylcytosine immunoprecipitation or bisulfite treatment. At the detection level, the methylated cytosine sequences can be measured by array hybridization or direct sequencing [5,7]. Clearly, direct sequencing methods offer base-pair resolution and allele-specific information, as well as digital counts on methylation percentages. On the other hand, array/chip methods share the property of lower costs [5]. Since the 29 million CpGs in the human genome are dispersed throughout the chromosomes [7], methylome profiling by direct sequencing methods is essentially equivalent to whole genome sequencing. However, the high cost of this type of sequencing prohibits all but the study of small sample sizes. As such, whole methylome profiling studies in humans [6] and pigs [8] have suffered from such small sample sizes. Even though costs for genome-wide sequencing have been decreasing, such limitations make direct sequencing methods impractical for disease studies in the near future. By contrast, the costs associated with array-based methods are more acceptable for most laboratories, and we are seeing a rapid accumulation of large numbers of samples from array methods.
DNA methylation is not distributed evenly throughout the genome. Some regions of DNA in which the frequency of the CpG sequence is higher than in others are termed CpG islands (CGI) [9]. CGIs are often located at the 5′-regions of housekeeping genes or other frequently expressed genes. Unlike CpG sites in the coding regions of a gene, CpG sites within the CGIs of promoters are, in most instances, un-methylated when the downstream genes are expressed. This observation led to the speculation that methylation of CpG sites in the promoter of a gene may inhibit gene expression. Methylation is also central to imprinting, as discussed later, along with K9 histone modifications. Most methylation changes occur within a short distance from the CGIs, also termed ‘CGI shores,’ rather than in the islands themselves [10]. Methylation may also occur at still more distant CpG regions known as ‘CpG shelves’ [9]. In other regions of the genome without any enrichment of CpG content, the CpG sites are said to be located in the ‘open sea’ region of the genome [11].
Recent approaches that enable genome-wide studies have demonstrated that the location of methylated sites in the transcriptional unit influences its relationship with gene control [9]. For example, methylation in the immediate vicinity of the transcriptional start site usually blocks gene expression [12], but methylation in the gene body may stimulate elongation [13]. Methylation in repetitive regions, such as centromeres or transposable elements, is important for chromosomal stability. Although variations in DNA methylation patterns are implicated in many pathological and physiological processes, such as development and aging [14,15], we will explore approaches for the study of cancer-associated changes and illustrate our findings with several examples. In the following section, we will focus on array-based methods owing to their lower cost and higher popularity in the cancer research field.
The Infinium HumanMethylation450 BeadChip®
The Infinium HumanMethylation450 Bead-Chip® (Illumina, CA, USA; hereinafter termed the 450k array) [4], which includes >480,000 CpG site probes, was released by Illumina (CA, USA) in 2011, as an updated version of the previous Infinium HumanMethylation27 BeadChip (27k array), where only 27,578 probes were included. This platform depends on the conversion of methylated cytosine into thymine by sodium bisulfite treatment. Each CpG site is targeted by two different probes (Infinium I design): one probe designed to match the methylated version and the other designed to match the un-methylated version of the corresponding CpG site. In addition, Infinium II probes are also employed in the 450k array, where a single probe is designed for some target CpG loci and differentially labeled nucleotides are used to determine the corresponding methylation status. It is noteworthy that Illumina utilized long target-specific probes to ensure hybridization specificity. This design clearly demands one important assumption to ensure the hybridization of long probes to target sequences: that adjacent CpG sites (e.g., CGIs) tend to have the same methylation pattern, an assumption that is supported by the work of Eckhardt et al. 16]. Obviously, boundaries of hyper- and hypomethylated regions will be difficult to detect by this method, as the mosaic nature of the boundaries makes the hybridization of probes to target sequences less efficient. Also, this platform only covers 1.7% of the 29 million CpG sites in the human genome, and the selected CpG sites are biased towards CGIs and promoters [4], a fact that should be kept in mind when considering possible bias introduced by genome coverage. Finally, similar to expression array/chip methods, population-level genetic variations, such as SNPs [17], are outside the scope of this platform. Nevertheless, the 450k array has the advantage of lower experimental cost and reasonable genome coverage, resulting in its wide application in cancer research.
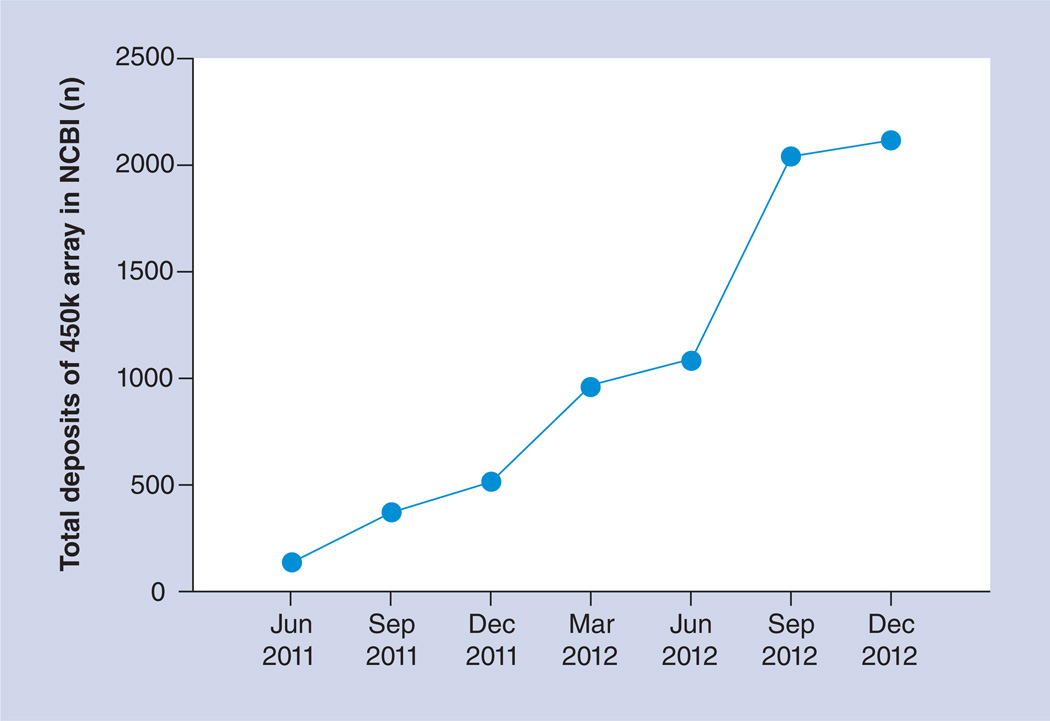
As can be seen in Figure 1, the 450k array is widely used since its recent introduction in 2011 [4]. Moreover, using this 450k array, The Cancer Genome Atlas (TCGA) consortium has made over 5000 cancer samples publicly available as of December 2012, making it the most widely utilized methylation study platform. These numbers are predicted to rise exponentially. In addition, the Encyclopedia of DNA Elements (ENCODE) Consortium (see [18,101; for a list of >30 publications) is an international collaboration of research groups funded by the National Human Genome Research Institute (NHGRI). The goal of ENCODE is to build a comprehensive parts list of functional elements in the human genome, including elements that act at the protein and RNA levels, as well as regulatory elements controlling gene expression across the multiple cell types [102] that represent different tissues/organs of the human body. As of December 2012, the ENCODE project had profiled the DNA methylation status of 63 cell types using the 450k array. In addition, the ENCODE project profiled the DNA methylation status for these 63 cell types using reduced representation bisulfite sequencing [19] for many selected regions of the genome, most of which are CGIs. Such digital data not only provide unique opportunities to validate the 450k array measurements, but also enable the study of detailed methylation changes at base-pair resolution across many cell types. Moreover, the coordinated data availability of ENCODE cell types makes it possible to explore in detail differentially methylated regions (DMRs). For example, differential methylation of a region where a transcription factor binds to may suggest differential binding of the corresponding transcriptional regulator. The NIH Roadmap Epigenomics Mapping Consortium [103] aims to produce a public resource of human epigenome data to aid basic biology and disease-oriented research. The Consortium leverages experimental pipelines built around next-generation sequencing technologies to map DNA methylation, histone modifications, chromatin accessibility and small RNA transcripts in stem cells and primary ex vivo tissues selected to represent the normal counterparts of tissues and organ systems frequently involved in human disease. Collectively, these public resources provide cancer biologists with unique opportunities to study DNA methylation and other epigenetic changes in physiological states and in cancer pathogenesis.
Figure 1. The steady increase of deposited samples utilizing the Infinium HumanMethylation450 BeadChip® (lllumina, CA, USA).
These samples are made publicly available in the Gene Expression Omnibus database of the NCBI, which hosts both array- and sequence-based data, in addition to its software tool services. 450k array: Infinium HumanMethylation450 BeadChip array; NCBI: National Center for Biotechnology Information.
Bioinformatics & computational biology
Bioinformatics and computational biology play crucial roles in biomedical research. While both techniques are distinct, there is considerable overlap. A working group convened by the NIH [104] has defined these applications as follows:
-
▪
“Bioinformatics: research, development, or application of computational tools and approaches for expanding the use of biological, medical, behavioral or health data, including those to acquire, store, organize, archive, analyze, or visualize such data;”
-
▪
“Computational biology: the development and application of data-analytical and theoretical methods, mathematical modeling and computational simulation techniques to the study of biological, behavioral, and social systems.”
As spelled out by the Committee, “…bioinformatics applies principles of information sciences and technologies to make the vast, diverse, and complex life sciences data more understandable and useful…,” while “…computational biology uses mathematical and computational approaches to address theoretical and experimental questions in biology.”
In this review article, we will demonstrate how bioinformatics and computational biology can be applied to the vast, ever-increasing amounts of publicly available data in order to understand and interpret epigenetics. Because much of the data involves DNA methylation, we will focus our attention on this aspect of epigenetics.
Methodology for performing basic analyses of 450k array data
The first step in a DNA methylation study is the DNA methylation percentage estimation [20]. The methylation level of each CpG locus in the 450k array is calculated using the formula:
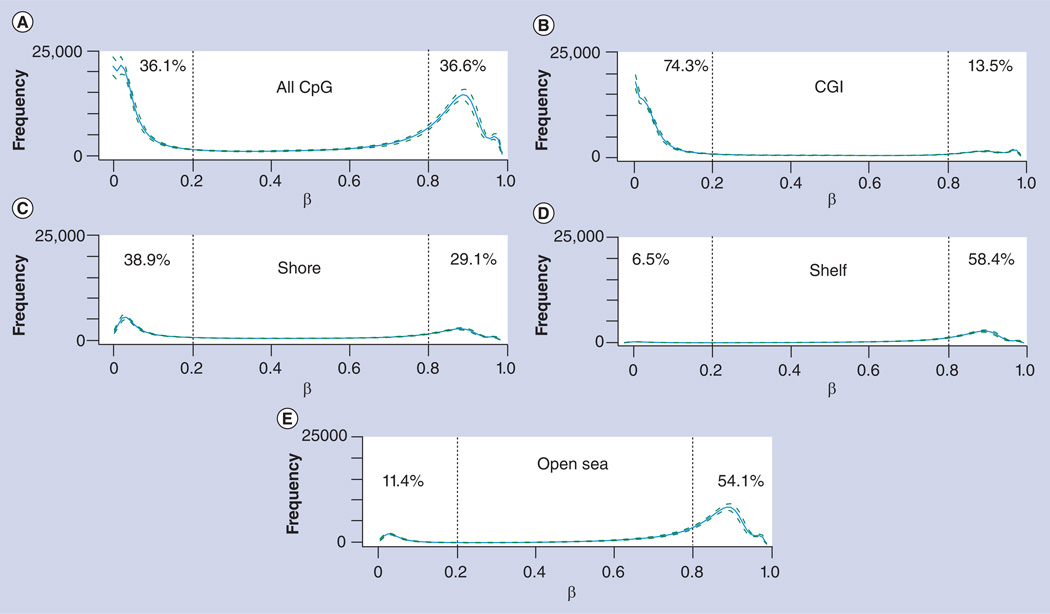
in the Illumina software package Human-Methylation450 manifest vl.l [4], where IM and IU are the signal intensity of the measured methylated allele and un-methylated allele, respectively, and 100 is a constant bias to regularize the case where both IM and IU are small. In other words, this β-value reflects the fraction of oligonucleotides matching a given sequence that is methylated. In fact, it has been shown that the β-value is highly correlated with direct sequencing results [4]. However, as was pointed out by Laird [5] and also shown below (Figure 2), the β-value has a finite scale (beta-distribution) that is statistically different from the common infinite scales seen in expression studies. For example, it was argued that variance of the β-value is not a constant, rather, it varies with the β-value [21]. Therefore, it was proposed [21] to calculate methylation levels as the log2 ratio of the intensities of the methylated probe versus the un-methylated probe using the following formula:
where α is again a constant bias to regularize the case when both IM and IU are small. It was shown that M score is a logistic version of the β-value [21]. Recognizing the differences of the intensity (and β-value) distribution between Infinium I and Infinium II probes, a subset quantile normalization procedure was proposed [22] to adjust the signal intensities to achieve a similar β-value distribution between Infinium I and II probes.
Figure 2. Global methylation patterns in blood samples from a Dutch population.
CpG sites are categorized into (A) all CpG loci, (B) CGI, (C) CGI shores, (D) CGI shelves and (E) open sea. The number of CpG sites (y-axis) is shown as a function of the methylation level (β; x-axis). Also listed are percentages of hypomethylated (0–0.2; dashed vertical line to the left of each panel) and hypermethylated (0.8–1; dashed vertical line to the right of each panel) CpGs in each category. Dashed curves indicate the sample standard deviation.
β: Methylation level; CGI: CpG island.
Data taken from [49].
In addition to the above preprocessing steps, it is also recognized that a significant portion of the 450k array probes is ambiguously mapped to the human genome (version hg19) [23]. This suggests the need to blacklist some 450k array probes for further scrutiny when discovered to be differentially methylated. Moreover, it should be kept in mind that all hybridization-based methods, such as the 450k array, are completely dependent on the probe sequences, which are determined using the reference genome during array design. This fact means that the population-level genetic variations, such as SNPs [17], cannot be considered. Similarly, methylated CpG sites are more prone to mutations [24], which has a direct impact on the detection of methylation level. Clearly, only the use of sequencing methods can eliminate these drawbacks, even though, as noted above, the process is still too costly for most clinical applications.
In addition to the above considerations in deriving methylation levels for each targeted CpG locus, the Illumina GenomeStudio® software package also reports a ‘detection p-value’, which reflects the signal intensities for each CpG locus and is similar to the presence/absence call for the Affymetrix array [25]. CpG loci with an insignificant detection p-value (i.e., >0.05) are, in general, regarded as missing values in some open source analysis packages, such as the Illumina Methylation Analyzer [26]. In turn, frequently utilized statistical tests, such as the Wilcoxon rank-sum test, student’s t-test and empirical Bayesian test, can be performed for case–control studies [26]. Owing to the large number of tests in a single study, popular multiple-testing correction algorithms, such as the Bonferroni correction and Benjamini–Hochberg [27] procedures, are frequently used [28], resulting in a Q-value for each CpG locus. With such false discovery rate-controlled Q-values, a volcano plot, a type of scatter plot for quickly identifying changes in large datasets composed of replicate data, is frequently used to visualize the global changes, where the x-axis depicts the difference between the average methylation levels from case and control groups, and the y-axis depicts the negative log Q-values [28]. Volcano plots are a powerful visual depiction of both the degree of methylation changes and their significance values.
Besides the detection of single CpG loci, considerable interest has been focused on detecting DMRs [6,29]. However, since the 450k array data is sparser than base-pair resolution DNA methylation data, the computational methods developed to detect DMRs are not directly applicable to 450k array data, indicating the need to develop methods applicable to 450k array data.
Global DNA methylation patterns
Given the higher coverage of the genome by the 450k array, it is now possible to study DNA methylation patterns at the genome level on many primary samples. As shown in Figure 2, the genome-wide methylation level of blood samples from a Dutch population shows a clear bimodal distribution, suggesting that the genome is a mosaic of hyper- and hypo-methylated segments. These data also suggest the thresholds to define hyper- and hypo-methylation. For example, it was proposed to use the thresholds of 0.2 and 0.8, respectively, with the intervening values indicative of intermediate levels of methylation [21]. The hypermethylated mode becomes much less prominent when the CGIs are examined, indicating that most CGIs are not methylated, consistent with the evolutionary history of CGIs. It was recently proposed to define CGI shores and shelves [9]. As can also be seen from Figure 2, the methylation level of shore CpGs is closer to that of CGIs, but shelf CpGs are largely methylated. Consistently, the open sea CpGs are also mostly hypermethylated. This result is consistent with previous knowledge that most CGI CpGs are not methylated, while many non-CGI CpGs are methylated. Thus, methylation levels vary greatly in different regions of the genome, with hypomethylation in most CpG sites in the islands and shores, while most hypermethylation occurs in the shelves and open seas.
Relationship between DNA methylation & gene expression
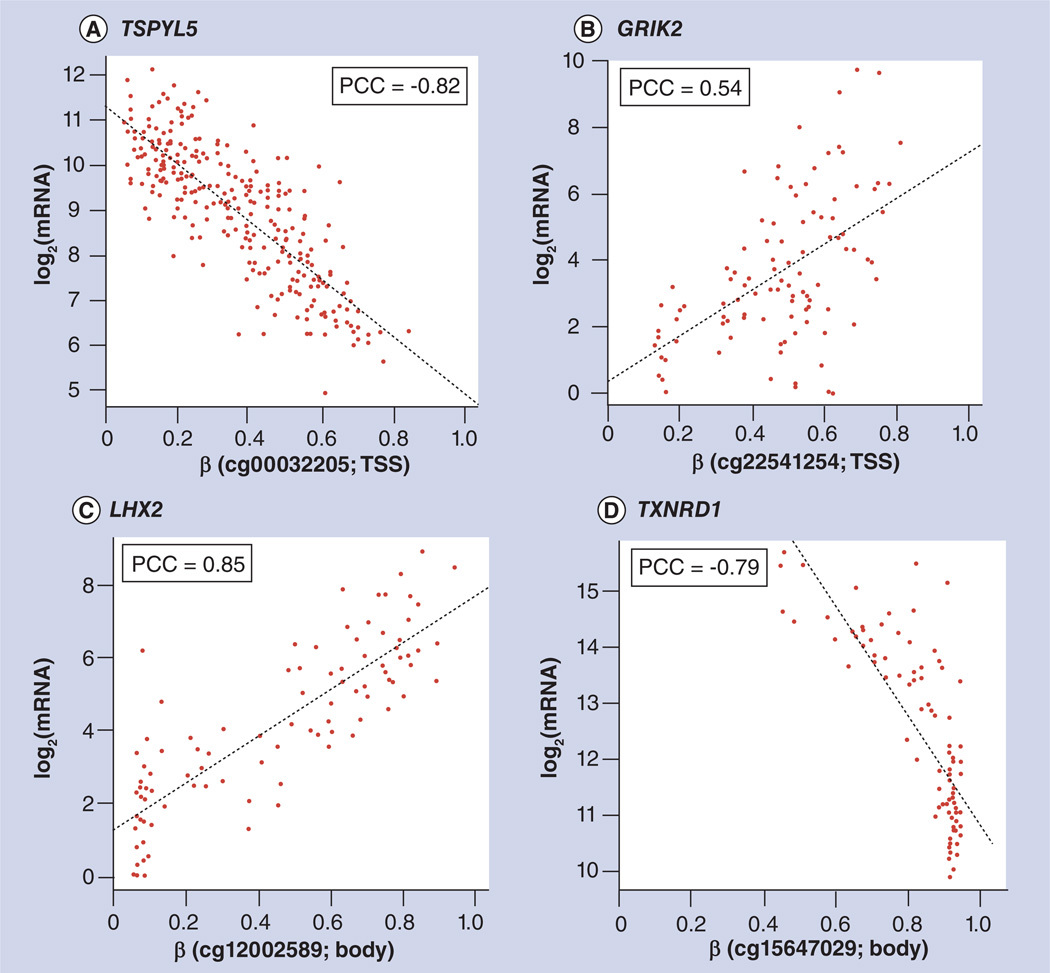
It is generally accepted that DNA hypermethylation in gene promoter regions will repress gene expression. With the available expression profiling and DNA methylation data of matched samples from TCGA, it is also possible to study how DNA methylation contributes to the regulation of gene expression at the genome-wide scale. Figure 3A shows the highly negative correlation (−0.82) between the expression of the TSPYL5 gene and methylation of its promoter, as represented by probe cg00032205, whereas the expression of the GRIK2 gene is positively correlated with the methylation of its promoter, as represented by probe cg2254l254 (Figure 3B). On the other hand, it has been reported that gene body methylation is positively associated with gene expression [13]. Consistently, body methylation of the LHX2 gene, as represented by probe cg12002589 (Figure 3C), is positively correlated with its expression. However, we also observed opposing correlations, such as the expression of TXNRD1, which is negatively correlated with methylation level in its body, as targeted by methylation probe cg15647029 (Figure 3D). In addition, methylation of promoter and body regions may not affect gene expression at all (data not shown). These observations confirm the complexity of the relationship between methylation and gene expression, even within the same genomic regions. Thus, DMRs in a cancer study should be interpreted with caution, as they may not always be correlated with gene expression. One possible explanation for the effect of promoter methylation is that the methylation status affects the binding affinity between transcription factors with cognate DNA sequences (i.e., methylation sensitive or resistant), and the regulatory function of the affected transcription factors might be either positive or negative on their target gene. To fully test this hypothesis, it would be interesting to integrate the abundant DNase I hypersensitive site data and transcription factor binding site data, such as TRANSFAC [30], UniPROBE [31] and JASPAR [32].
Figure 3. Example of genes with both positive and negative correlations between the promoter and gene body methylation levels and expression levels.
The correlations between promoter and gene body methylation levels (β; x-axis) and expression levels (log2 [mRNA] of RNA-seq, quantile-normalized across samples; y-axis) are shown. (A) Expression level of the gene TSPYL5 is negatively correlated with its promoter methylation level (indicated by TSS probe cg00032205) in data from lung adenocarcinoma patients. (B) Expression level of the gene GRIK2 is positively correlated with its promoter methylation (indicated by TSS probe cg22541254) in data from lung squamous cell carcinoma patients. (C) Expression level of the gene LHX2 is positively correlated with its body methylation (indicated by probe cg12002589) in data from lung squamous cell carcinoma patients. (D) Expression level of the gene TXNRD1 is negatively correlated with its body methylation (indicated by probe cg 15647029) in data from lung squamous cell carcinoma patients.
β: Methylation level; PCC: Pearson’s correlation coeffecient; TSS: Transcription start site.
Data taken from The Cancer Genome Atlas [108].
Associating 450k array probes with genes
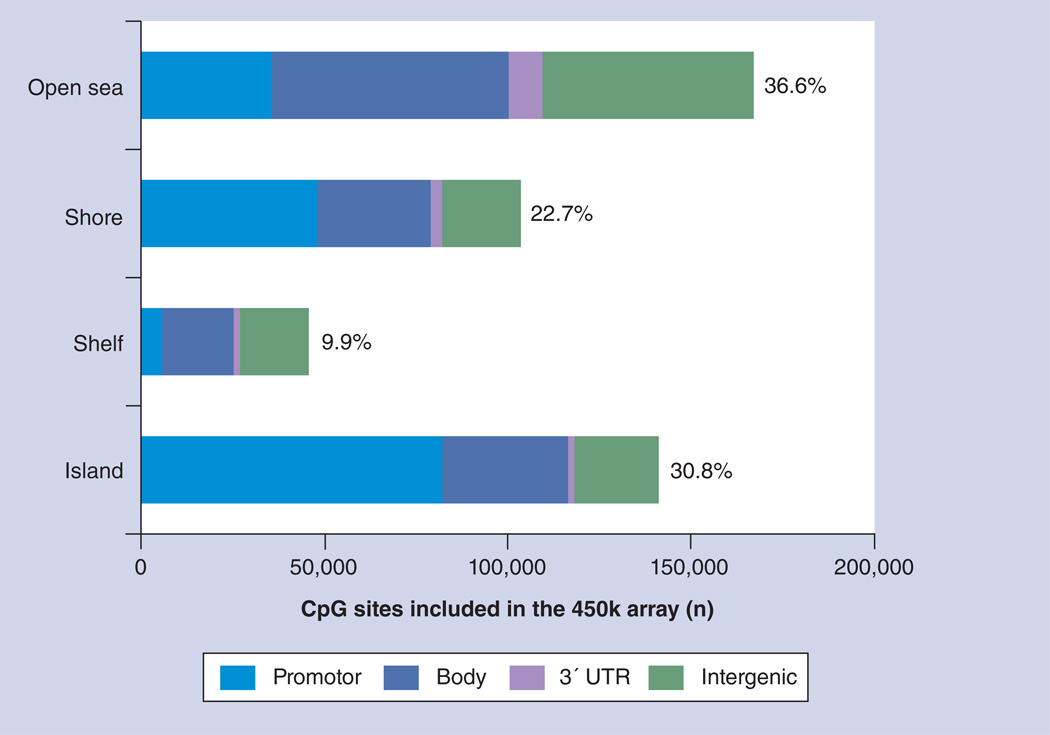
The 450k array is an updated version of the previous 27k array. In total, 485,577 methylation probes are included, of which 482,421 (99.4%) probes are designed to target CpG sites, 3081 (0.6%) probes are designed to target CpA sites, and ten probes are designed to target CpT sites. In fact, a significant portion (150,254; 30.9%) of the probes is designed to target CGIs. Moreover, 112,067 (23.1%) and 47,144 (9.7%) of the probes are designed to target CGI shores (0–2 kb from CGIs) and CGI shelves (2–4 kb from CGIs) [9], respectively, totaling 309,465 (63.7%) CGI-related probes for the whole platform. Clearly, it is crucial to associate individual CpG sites with genes in order to understand possible functions of methylation changes. Illumina annotates CpG sites on the chip relative to RefSeq gene features 105], such as TSS1500 (i.e., upstream 1500 to upstream 200 bp of the transcription start site), TSS200 (upstream 200 bp region of the transcription start site), the 5´ UTR, the first exon and the gene body, as well as the 3´ UTR. As detailed below, some CpG sites cannot be unambiguously mapped to genes as a consequence of alternative promoter usage or alternative splicing. Therefore, it is informative to look at the distribution of probes that can be uniquely mapped to gene regions, such as the promoter (including TSS1500, TSS200, the first exon and the 5´ UTR), gene body, 3´ UTR and intergenic regions. In total, 456,079 (94%) probes can be mapped uniquely to gene regions. As shown in Figure 4, 30.8% of such probes target CGIs, and, of these, 36.6% target open seas. Clearly, promoter probes are most enriched in CGIs, which is consistent with the notion that 50% of human genes have CGIs in their promoters [33]. By contrast, promoter probes are less enriched in open sea regions and CGI shelves, although in CGI shores, approximately 47% of probes are associated with promoters, which is also consistent with the close proximity of CGI shores to CGIs [4,9]. It can also be seen that approximately 37% of 450k array probes specifically target unambiguous gene body regions, irrespective of CGIs, shores, shelves or open seas. While the coverage of gene bodies is much lower than promoter regions, such abundant information already permits researchers to gain insights into the regulatory role of gene body methylation, which will be briefly discussed below.
Figure 4. Distribution of Infinium HumanMethylation450 BeadChip® (lllumina, CA, USA) array probes.
Probes that can be uniquely associated to gene regions, including the promoter (transcription start sites 1500 and 200, 5´ UTR, and first exon), gene body, 3´ UTR and intergenic regions are summarized for CpG island, shore, shelf and open sea.
450k array: Infinium HumanMethylation450 BeadChip array.
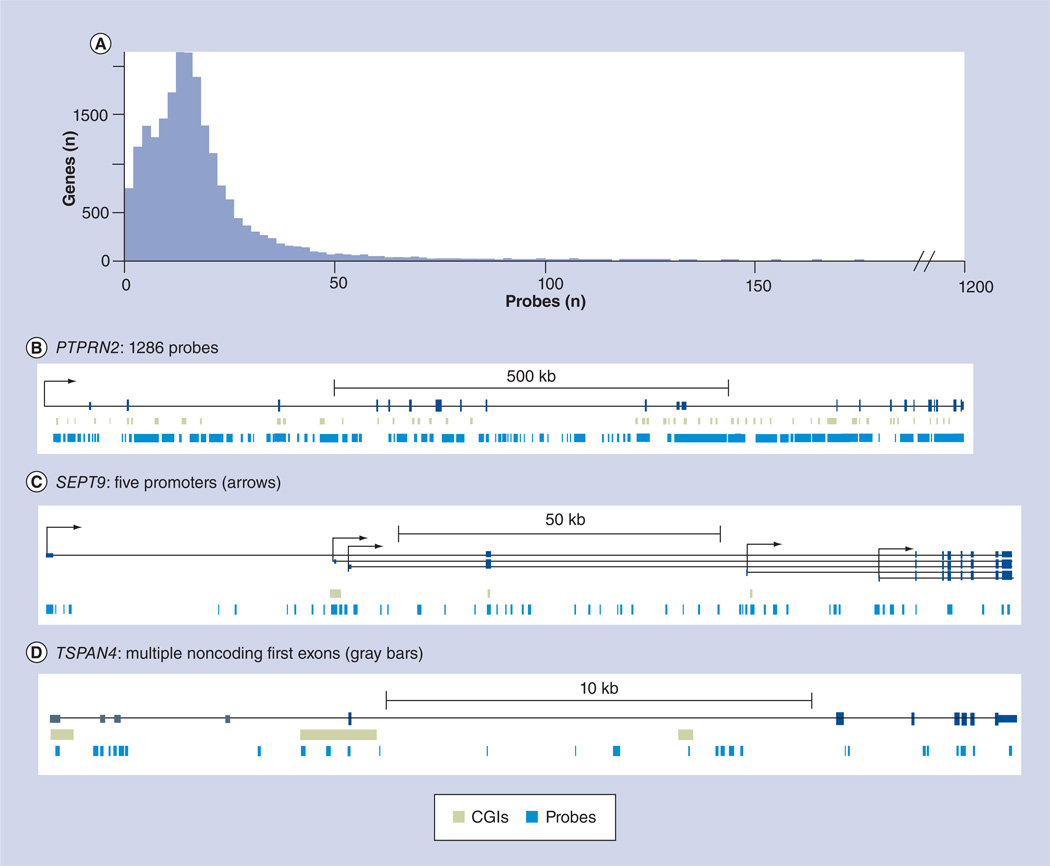
One important way to understand the differential methylation detected in a case–control study is to associate probes with nearby genes. Owing to fluctuation in local GC content, sequence complexity and gene length, the number of probes targeting each gene varies considerably. Among the 21,231 genes with at least one 450k array probe, 71.5% of genes have over ten targeting probes, and the median number of probes per gene is 15 (Figure 5A). The coverage per gene has a wide range from one to over 1000. For example, the PTPRN2 gene, which belongs to the protein tyrosine phosphatase family, is covered by 1286 methylation probes (Figure 5B). Notably, this gene has 22 exons, and its length is over 1 Mb. It should also be noted that this gene contains over 30 CGIs.
Figure 5. Gene coverage by Infinium HumanMethylation450 BeadChip® (lllumina, CA, USA) probes.
(A) Infinium HumanMethylation450 BeadChip coverage at gene level for 21,231 covered genes. Shown on the y-axis is the number of genes as a function of the number of targeting probes shown on the x-axis. (B) PTPRN2 has over 1000 probes. (C) SEPT9 has five promoters; some methylation probes targeting the second, third, fourth and fifth promoters can be regarded as body probes for the first promoter. (D) TSPAN4 has four noncoding 5´ UTR exons; the methylation probes targeting second, third and fourth exons may be regarded as body probes.
CGI: CpG island.
In addition to variations in coverage for different genes by the 450k array, alternative promoter usage, which is an important biological phenomenon owing to its effect on gene expression and level of transcription initiation [34], greatly affects attempts to associate probes with nearby genes and, subsequently, interpretation of the results. For example, there are five alternative promoters for the SEPT9 gene (Figure 5C), which belongs to the septin family involved in cytokinesis and cell cycle control. Therefore, some probes can be regarded as promoter probes for alternative isoforms, while they can also be regarded as body probes for other alternative isoforms.
Another important, but less appreciated, caveat in the attempt to associate probes with nearby genes is the finding that some genes have multiple noncoding first exons, which are collectively called the 5´ UTR. In general, probes falling into the 5´ UTR are called promoter probes. This is appropriate when the coding region starts from the first exon, which is generally short (mean: 348 bp; [35]). However, when the coding region does not start from the first exon (~40% frequency; [35]), one or more introns will significantly increase the distance from the transcription start site and the 450k array probes in question. For example, there are four introns before the coding region of the TSPAN4 gene (Figure 5D), which belongs to the tetraspanin family. These introns cover a distance of over 5 kb between the transcription start sites of TSPAN4, and some methylation probes fall in the 5´ UTR region. Thus, it is less likely that all methylation probes in the 5´ UTR region play a significant role in transcription initiation. In this regard, it may not always be appropriate to categorize 5´ UTR probes as promoter probes. In a similar vein, alternative splicing and alternative polyadenylation also greatly affect gene annotation, and, hence, attempts to associate meth-ylation probes with functional gene regions are complex and may not always be straightforward. Such facts should be considered when significant DMRs are discovered.
Revisiting knowledge on DNA methylation learned in the past: the CDKN2A gene
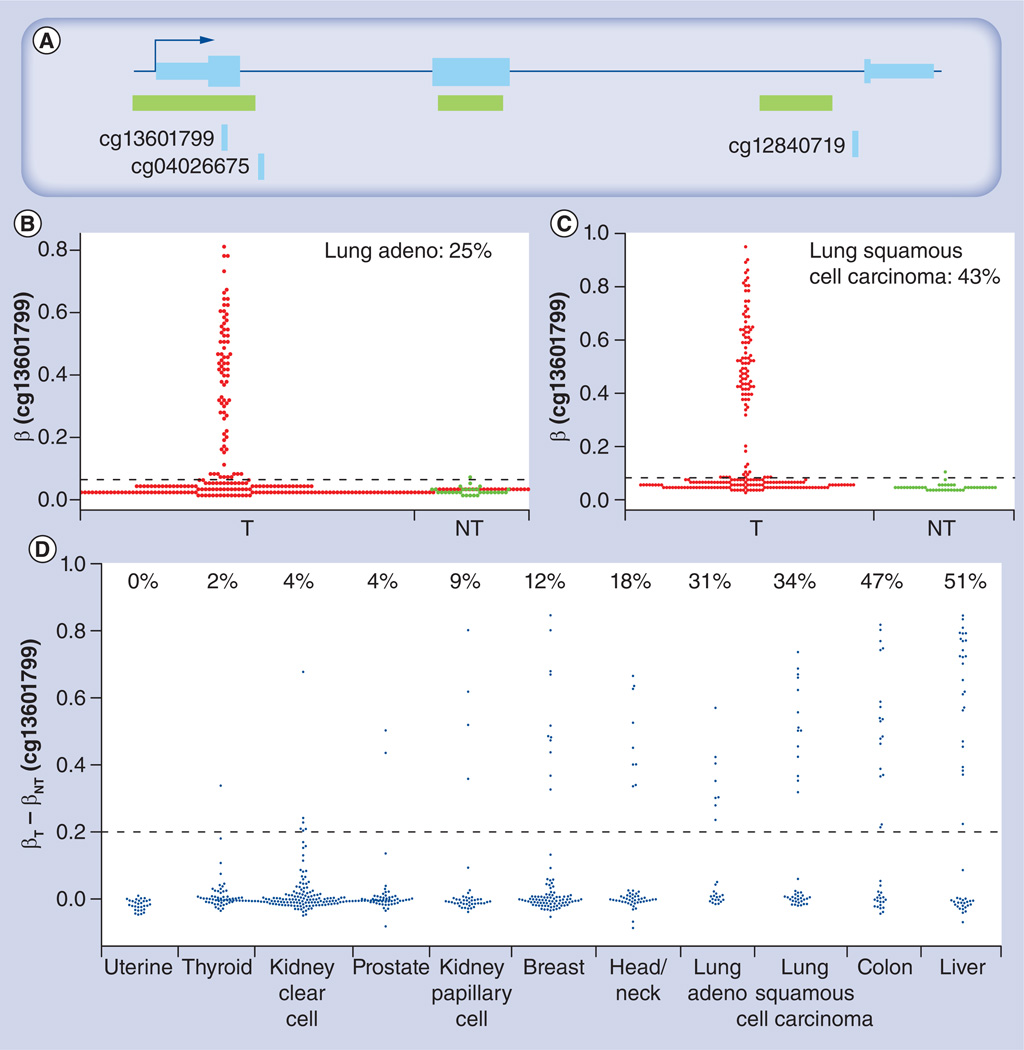
It has been over three decades since it was recognized that DNA methylation may play an important role in cancer [9,36,37]. Since then, many genes have been found to be associated with different cancer types, the CDKN2A gene (also known as p16Ink4A or p16) being one of the most important. The CDKN2A gene (Figure 6A) is located on chromosome 9p21. It was first reported in 1995 that CDKN2A expression is inactivated by methylation of its 5’ CGI in approximately 20% of different primary neoplasms, including non-small-cell lung carcinoma, gliomas, and head and neck squamous cell carcinoma [38]. Similar phenomena were also observed in cell lines from different cancers [39]. Such observations provide new insights into gene inactivation through DNA methylation, in addition to other mechanisms, such as loss of heterozygosity, inactivating point mutations and homozygous gene deletions. Some recent reports indicated that CDKN2A promoter hypermethylation occurs frequently in breast cancers (17%) 4o], lung cancers (31%) [40], colon cancers (51%) [41] and liver cancers (55%) [42], but rarely in uterine cancers (0.7%) [43]. It is, therefore, illustrative to revisit CDKN2A promoter methylation using 450k array data from TCGA. The CGI region of the CDKN2A gene promoter is covered by two 450k array probes, cg13601799 and cg04026675, with cg13601799 being closer to the transcription start site. As can be seen from Figure 6B, approximately 25% of lung adenocarcinoma tumors had elevated methylation levels, as compared with non-malignant lung tissues. In addition, approximately 43% of lung squamous cell carcinomas (Figure 6C) have methylation levels higher than the corresponding non-malignant lung tissue. Since this number is obtained by pooling all tumors or non-malignant samples together, we next asked how the CDKN2A promoter is hypermethylated in the tumor as compared with corresponding non-malignant lung tissues from matched samples of individual patients. Figure 6D shows that 31% of lung adenocarcinoma patients and 34% of lung squamous cell carcinoma patients had elevated CDKN2A promoter methylation levels in their tumors. Interestingly, this percentage is much higher in liver cancer (51%) and colon cancer (47%), which is consistent with previous reports [41,42]. These data not only confirmed our previous knowledge of CDKN2A suppression through promoter hypermethylation, but also indicated the high variability of suppression prevalence in different cancer types.
Figure 6. Methylation pattern of the CDKN2A gene.
(A) Gene structure and Infinium HumanMethylation450 BeadChip® (lllumina, CA, USA) probes for the CDKN2A promoter, where the CpG island overlapping the first exon (indicated by the arrow) is targeted by probe cg13601799. The methylation pattern of the CDKN2A promoter in T and NT samples is shown (B) for lung adeno and (C) lung squamous cell carcinoma, where the percentage of T samples with a methylation level higher than threshold (dashed line) determined using mean + (3 × standard deviation of the methylation level in noncancer samples) is indicated. (D) Elevated methylation level of CDKN2A promoter is seen in matched sample pairs for many cancers. Percentage of tumors with a methylation level increase over 0.2 (dashed line) is indicated.
β: Methylation level; Adeno: Adenocarcinoma; NT: Non-malignant; T: Tumor.
Imprinting
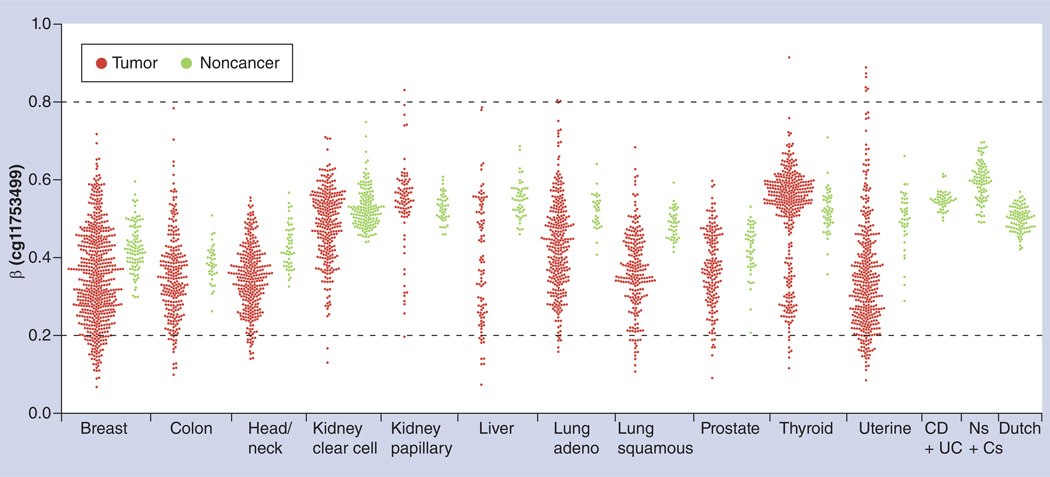
It is well appreciated that DNA methylation is important for mammalian development. While most CGIs are un-methylated in somatic cells, methylated promoter CGIs are usually restricted to genes for which there is a requirement for long-term stabilization of the repressed state [9,44]. Well-studied examples include imprinted genes, genes located on the inactivated X chromosome, and cancer/testis genes that are expressed in germ cells and cancers, but not in most adult tissues [9]. For imprinted genes, there is a parent-of-origin effect on the allelic expression. H19 is one of the well-studied imprinting genes [45]. It can be seen from Figure 7 that H19 promoter probe cg11753499 is intermediately methylated in non-malignant tissues from many organs, suggesting that one of the parental alleles is methylated, while the other parental allele is not methylated in the normal tissue. In most tumors, it can also be seen that the H19 promoter has an intermediate methylation level, although a bigger spread (i.e., variance) is clearly seen [46], possibly suggesting less regulation of the cells. Interestingly, H19 promoter methylation level is decreased in many cancers as compared with the corresponding non-malignant tissues, including breast, head and neck, lung and uterine cancer. In thyroid cancer, it can be seen that the tumors form two clusters: those with a higher H19 methylation level in tumors and those with a lower H19 methylation level in tumors, possibly suggesting the heterogeneous nature of tumor samples. Moreover, with the large deposits of 450k array data in the National Center for Biotechnology Information (NCBI) Gene Expression Omnibus (GEO) database [106], it is possible to study the methylation level of H19 in noncancer subjects. For example, it is clear that H19 promoter methylation level is very close to 0.5 in patients with inflammatory bowel disease (Crohn’s disease and ulcerative colitis) [47], and healthy newborns and centenarians (Figure 7) [48], as well as in schizophrenia patients and healthy subjects of Dutch descent (pooled together since there is no appreciable difference; Dutch in Figure 7; [49]), although it should be noted that tissue samples were taken from the blood of noncancer patients.
Figure 7. Methylation level of imprinted gene H19 (promoter probe cg11753499).
Methylation of H19 is intermediate across cancers, regardless of tumor or noncancer samples from cancer patients. H19 methylation is also intermediate in cancer-free samples, including common inflammatory bowel diseases (CD + UC) [47], blood from Ns + Cs [48], as well as in schizophrenia patients and healthy subjects of Dutch descent (pooled together since there is no appreciable difference; Dutch [49]). Note the larger spread of methylation levels in tumor samples.
β: Methylation level; Adeno: Adenocarcinoma; C: Centenarian; CD: Crohn′s disease; N: Newborn; UC: Ulcerative colitis.
Since H19 methylation level was successfully confirmed as intermediate using the 450k array, it is natural to speculate about the possibility of detecting imprinted genes using data generated by this platform. Similar to the case of the H19 gene, we expect imprinted chromosomal loci to have an intermediate methylation level. A simple search of CGI probes with a mean β-value between 0.4 and 0.6, and a standard deviation less than 0.05 across 17 cancer-free [50] tissues resulted in 14 CGIs (Supplementary Table 1; see online at www.futuremedicine.com/doi/suppl/10.2217/.futuremedicine.com/doi/suppl/10.2217/epi.13.26) with at least four CpG probes. Interestingly, 13 of these 14 CGIs overlap with known imprinted genes [107], including H19, DIRAS3, KCNQ1, PEG3, HM13, GNAS, PLAGL1, FAM50B, MEST and PEG10, suggesting the high accuracy of predicting imprinted genes using 450k array data. We, therefore, predicted that the last CGI, chr22:17516913-17518500, which overlaps a nonprotein-coding gene CECR7, is an imprinted region. However, since the 450k array does not have strand-specific information, we were not able to unanimously validate our prediction. It is clear that base-pair resolution data from multiple tissues and individuals are needed to draw a confident conclusion. Nevertheless, we propose that a shortlist of candidate genes from 450k array data will facilitate the discovery of imprinted genes. An innovative and carefully designed algorithm is needed to optimize this prediction task.
Cancer/testis antigens
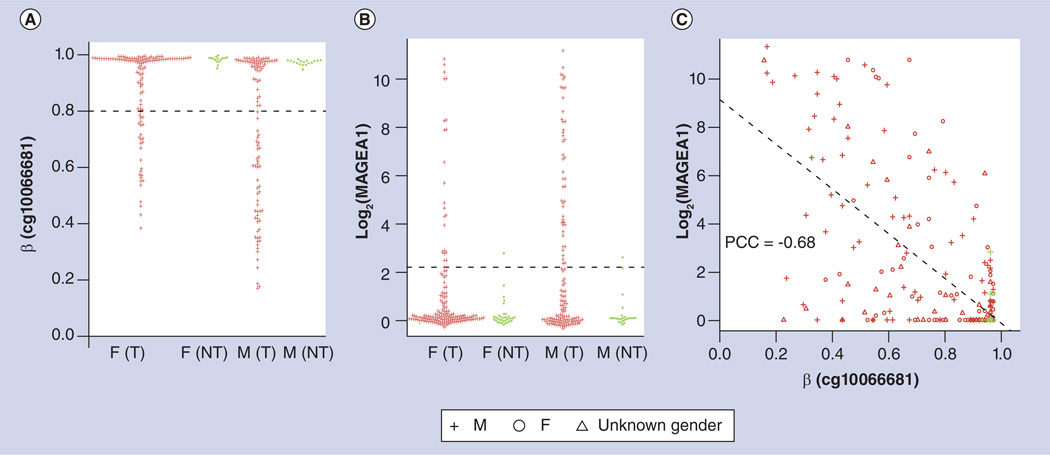
Cancer/testis antigens are expressed in fetal tissues, but mainly in the testis in adult tissues [51,52]. While many of these genes are located on the X chromosome, some are located on somatic chromosomes. DNA methylation is the major mechanism of silencing in adult tissues for these genes, and expression of these genes in tumors is often associated with hypomethylation. To confirm the methylation and expression patterns of cancer/testis antigens, we focused on one of the best-studied genes of this class, MAGEA1, also known as MAGE1 [53]. MAGEA1 is located on chromosome Xq28, and while it was first noted to be upregulated in melanoma, it is also frequently upregulated in many tumor types as a result of loss of methylation. As can be seen from Figure 8A, the MAGEA1 promoter, as represented by probe cg10066681, is fully methylated in non-malignant lung tissues of both sexes, while in 23% of female lung adenocarcinoma tumors and 48% of male lung adenocarcinoma tumors, the promoter of MAGEA1 is hypomethylated or intermediately methylated (i.e., β < 0.8). Correspondingly, MAGEA1 has a negligible expression level in non-malignant lung tissues, but an elevated expression level is present in 14% of female and 36% of male lung adenocarcinomas (Figure 8B). This is fully consistent with the cancer/testis specificity of the MAGEA1 expression pattern (testicular tissue data were not available in TCGA database). Interestingly, we found that the methylation level of the MAGEA1 promoter is highly predictive of the expression level of MAGEA1 mRNA (Figure 8C). These results confirm that MAGEA1 expression may be epigenetically regulated.
Figure 8. Methylation and expression pattern of MAGEA1 on chromosome Xq28.
(A) The promoter region of MAGEA1, as represented by probe cg10066681, is hypermethylated in NT lung tissue, while it is not methylated in some (23% female and 48% male) lung adenocarcinoma tumors. Dashed line: hypermethylation threshold of 0.8. (B) MAGEA1 has a very low expression level in NT lung tissues from lung adenocarcinoma cancer patients, while elevated expression occurs in some (14% female and 36% male) lung adenocarcinoma tumors. Dashed line: elevated expression threshold determined using mean + (3 × standard deviation in NT lung tissues from both female and male patients). (C) Promoter methylation level is highly correlated (PCC = −0.68; R2 = 0.46; p < e−16) with expression level in lung adenocarcinoma tumors for MAGEA1, confirming that tumor expression results from loss of methylation.
β: Methylation level; F: Female; M: Male; NT: Non-malignant; PCC: Pearson correlation coefficient; T: Tumor.
Aside from the relationship between DNA methylation and protein-coding gene expression, there is a tremendous amount of interest in noncoding genes, such as miRNAs, as these genes have been found to play an important role in both cancer and normal cells. However, this topic is beyond the scope of this work, and readers are directed to comprehensive reviews by Suzuki et al. [54].
Dosage effect
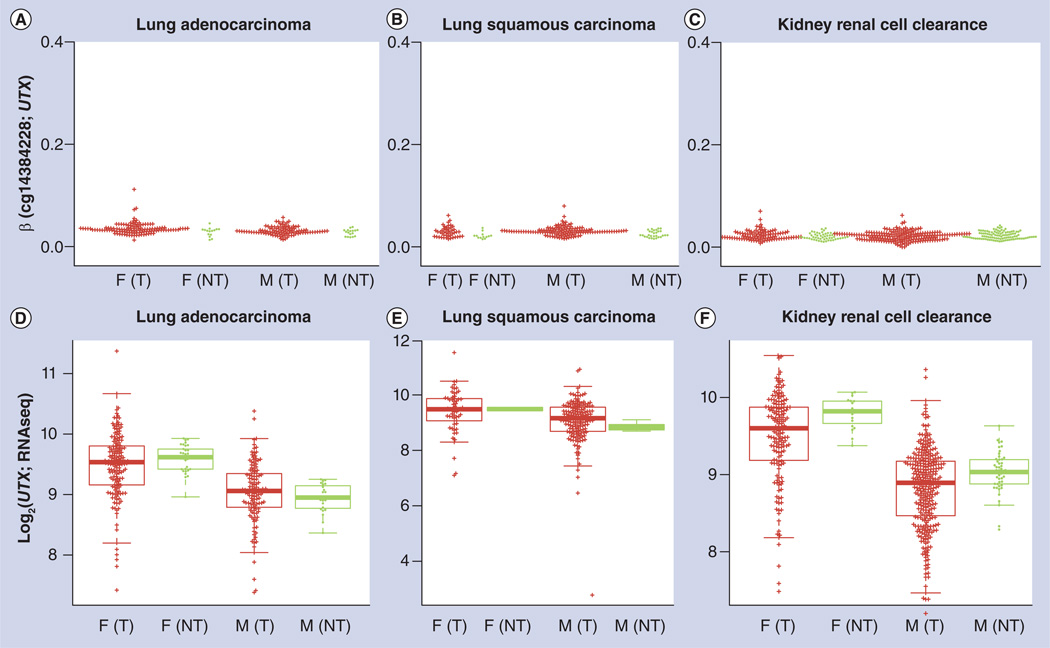
In addition to hypermethylation biomarkers, it is also possible to study the dosage effect on expression of sex chromosomes. Owing to its much larger size, the X chromosome contains many more genes than the Y chromosome, most of which demonstrate inactivation of one allele. The CTX gene, also known as KDM6A, is located on chromosome X, and is not subject to X chromosome inactivation [55]. It is, therefore, interesting to study gender differences relative to gene expression levels of this gene. It can be seen from Figure 9A–C that the UTX gene promoter, as represented by probe cg14384228, is not methylated in tumors or non-malignant tissues. However, while the mean expression levels in tumors and corresponding non-malignant tissues were similar in all samples (p > 0.05), the levels in women were higher than in men (figure 9D–F; p < 0.01), indicating the dosage effect of expression from two alleles in women and one allele in men.
Figure 9. Methylation and expression patterns of the UTX gene, which is not subject to X chromosome inactivation.
The UTX promoter is not methylated, regardless of gender, tumor status for (A) lung adenocarcinoma, (B) lung squamous cell carcinoma an (C) kidney renal clear cell carcinoma. By contrast, expression levels of UTX are higher in females than in males, regardless of tumor or nontumor status for both (D) lung adenocarcinoma, (E) lung squamous cell carcinoma and (F) kidney renal clear cell carcinoma where fold change is between 1.3 and 1.7.
F: Female; M: Male; NT: Non-malignant; T: Tumor.
Classification of cancers
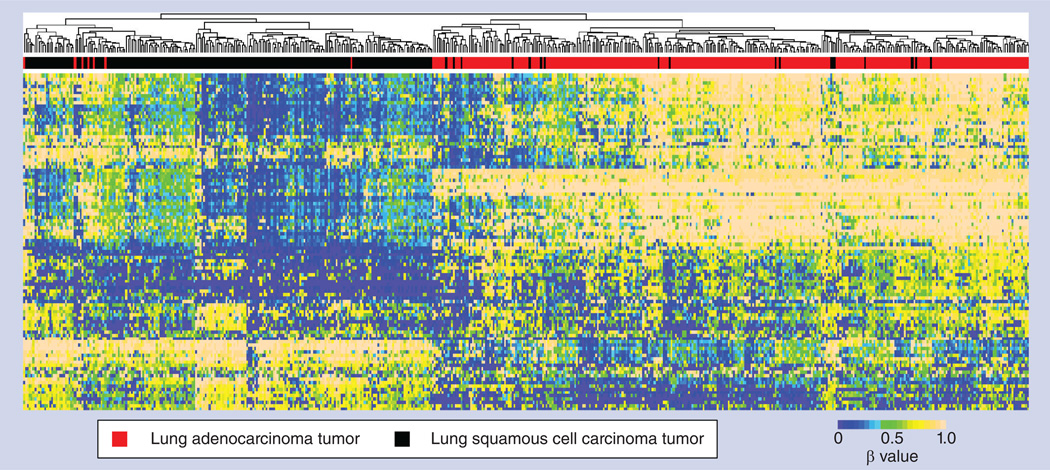
Similar to the classical application of gene expression data to cancer classifications, DNA methylome data hold great promise for classifying cancers, as well as subtyping a specific cancer for the purpose of diagnosis, prognosis, personalized treatment and clinical trials. For example, DNA methylome data have been used by Turcan et al. to group glioma tumors into different subtypes, and the subtypes were found to be highly correlated with the mutation status of a single gene, IDH1 [56]. Similarly, we compared the methylome of lung adenocarcinoma tumors and lung squamous cell carcinoma tumors. For simplicity, we first removed all methylation probes targeting CpG sites on the X and Y chromosomes to exclude possible gender effects. We then selected the top 100 probes with the highest variances in their β-values across tumor samples from both lung adenocarcinoma and lung squamous cell carcinoma patients. Patient data on these top 100 probes were then subjected to hierarchical clustering. As can be seen from Figure 10, lung adenocarcinoma and lung squamous cell carcinoma tumors were separated with high accuracy: 297 (97.7%) out of the 304 lung adenocarcinoma tumors were correctly classified, and 209 (92.1%) out of the 227 lung squamous tumors were correctly classified. Together with the data on IDH1 mutation status, we hypothesize that DNA methylome data will play a significant role in tumor classification tasks. Such tasks range from classification of tumors from corresponding non-malignant tissues, subtyping specific cancer types and identification of sites of origin of metastatic tumors. Clearly, large-scale projects, such as TCGA project and other public databases, are excellent resources to achieve these ambitious goals, which may lead to smaller, more focused studies for specific clinical and laboratory applications.
Figure 10. Classification of lung squamous cell carcinoma and lung adenocarcinoma tumors using methylome data.
The top 100 Infinium HumanMethylation450 BeadChip® (lllumina, CA, USA) array autosomal probes with highest variances across tumors from both lung squamous cell carcinoma and lung adenocarcinoma patients are used to perform hierarchical clustering based on their β-values.
β: Methylation level.
Conclusion & future perspective
It should be obvious that the application of computational biology and bioinformatics to the large and rapidly growing epigenetic databases presently available has provided new opportunities to gain insights from these invaluable resources. However, much of the publicly available data is in the form of a single array technique, such as the 450k array, applied to a single aspect of epigenetic modifications, such as DNA methylation. In addition, the focus of most studies has been on various forms of cancer. Programs such as the ENCODE Consortium and NIH Roadmap Epigenomics Mapping Consortium are attempting to study the main aspects of epigenetics, but, to date, much of their efforts have focused on cell lines and no concentrated effort has been made to study the multiple cancer types covered by the TCGA project. In the not too distant future, we predict that these shortcomings will be addressed and that all aspects of epigenetics will be comprehensively studied. The computational ability to explore the data will provide unprecedented and exciting opportunities for the integration of epigenetics with classic genetics and genomics data, thereby rapidly increasing our comprehensive understanding of cancer.
Supplementary Material
Executive summary.
-
▪
Recent events have greatly impacted upon the scientific approach to the study of epigenetics, especially in the study of cancer.
-
▪
Large publicly available databases are now accessible, in particular those using analyses performed by a bead array. These databases nclude The Cancer Genome Atlas, the Encyclopedia of DNA Elements Consortium and the NIH Roadmap Epigenomics Mapping Consortium. These databases provide an exponentially increasing number of analyzed samples in the public domain. In addition to methylation data, gene expression and other data from matched samples are available for a subset of samples.
-
▪
The publicly available data have only partially been mined. Application of computational biology techniques are required to answer specific questions and discover novel information.
-
▪
Much of the data from the publicly available databases is limited by the use of a single method of determining DNA methylation. Other global approaches to studying methylation and the remainder of epigenetics, including chromatin remodeling, are only sparsely represented. This is a major limitation.
-
▪
These shortcomings will gradually be overcome, providing scientists with previously unavailable opportunities for the interactive exploration of epigenetics and its role in cancer pathogenesis.
Acknowledgments
This work was supported by grants from the Early Detection Research Network (U01 CA086402) and the Texas Specialized Program of Research Excellence in Lung Cancer, the National Cancer Institute (AF Gazdar) and the NIH (HG001696 and U01 ES017166), the National Basic Research Program of China (2012CB316503) and the National Natural Science Foundation of China (91019016 and 31061160497; MQ Zhang).
Footnotes
Financial & competing interests disclosure
The authors have no other relevant affiliations or financial involvement with any organization or entity with a financial interest in or financial conflict with the subject matter or materials discussed in the manuscript apart from those disclosed.
No writing assistance was utilized in the production of this manuscript.
References
Papers of special note have been highlighted as:
▪▪ of considerable interest
- 1.Schena M, Shalon D, Davis RW, Brown PO. Quantitative monitoring of gene expression patterns with a complementary DNA microarray. Science. 1995;270(5235):467–470. doi: 10.1126/science.270.5235.467. [DOI] [PubMed] [Google Scholar]
- 2.Ren B, Robert F, Wyrick JJ, et al. Genome-wide location and function of DNA binding proteins. Science. 2000;290(5500):2306–2309. doi: 10.1126/science.290.5500.2306. [DOI] [PubMed] [Google Scholar]
- 3.Wang DG, Fan JB, Siao CJ, et al. Large-scale identification, mapping, and genotyping of single-nucleotide polymorphisms in the human genome. Science. 1998;280(5366):1077–1082. doi: 10.1126/science.280.5366.1077. [DOI] [PubMed] [Google Scholar]
- 4.Bibikova M, Barnes B, Tsan C, et al. High density DNA methylation array with single CpG site resolution. Genomics. 2011;98(4):288–295. doi: 10.1016/j.ygeno.2011.07.007. [DOI] [PubMed] [Google Scholar]
- 5. Laird PW. Principles challenges of genomewide DNA methylation analysis. Nat. Rev. Genet. 2010;11(3):191–203. doi: 10.1038/nrg2732.▪▪ Excellent review of DNA methylation measurements and analysis.
- 6. Lister R, Pelizzola M, Dowen RH, et al. Human DNA methylomes at base resolution show widespread epigenomic differences. Nature. 2009;462(7271):315–322. doi: 10.1038/nature08514.▪▪ The first base pair-resolution human methylome.
- 7. Fouse SD, Nagarajan RO, Costello JF. Genome-scale DNA methylation analysis. Epigenomics. 2010;2(1):105–117. doi: 10.2217/epi.09.35.▪▪ Excellent review of DNA methylation assay techniques.
- 8.Li M, Wu H, Luo Z, et al. An atlas of DNA methylomes in porcine adipose and muscle tissues. Nat. Commun. 2012;3:850. doi: 10.1038/ncomms1854. [DOI] [PMC free article] [PubMed] [Google Scholar]
- 9.Jones PA. Functions of DNA methylation: islands, start sites gene bodies and beyond. Nat. Rev. Genet. 2012;13(7):484–492. doi: 10.1038/nrg3230. [DOI] [PubMed] [Google Scholar]
- 10.Doi A, Park IH, Wen B, et al. Differential methylation of tissue-and cancer-specific CpG island shores distinguishes human induced pluripotent stem cells, embryonic stem cells, fibroblasts. Nat. Genet. 2009;41(12):1350–1353. doi: 10.1038/ng.471. [DOI] [PMC free article] [PubMed] [Google Scholar]
- 11.Sandoval J, Heyn H, Moran S, et al. Validation of a DNA methylation microarray for 450,000 CpG sites in the human genome. Epigenetics. 2011;6(6):692–702. doi: 10.4161/epi.6.6.16196. [DOI] [PubMed] [Google Scholar]
- 12.Baylin SB. DNA methylation and gene silencing in cancer. Nat. Clin. Pract. Oncol. 2005;2(Suppl. 1):S4–S11. doi: 10.1038/ncponc0354. [DOI] [PubMed] [Google Scholar]
- 13.Jjingo D, Conley AB, Yi SV, Lunyak VV, Jordan IK. On the presence and role of human gene-body DNA methylation. Oncotarget. 2012;3(4):462–474. doi: 10.18632/oncotarget.497. [DOI] [PMC free article] [PubMed] [Google Scholar]
- 14.Felnberg AP. Genome-scale approaches to the epigenetlcs of common human disease. Vir chows Arch. 2010;456(1):13–21. doi: 10.1007/s00428-009-0847-2. [DOI] [PMC free article] [PubMed] [Google Scholar]
- 15.Felnberg AP. Epigenomics reveals a functional genome anatomy and a new approach to common disease. Nat. Biotechnol. 2010;28(10):1049–1052. doi: 10.1038/nbt1010-1049. [DOI] [PMC free article] [PubMed] [Google Scholar]
- 16.Eckhardt F, Lewin J, Cortese R, et al. DNA methylation profiling of human chromosomes 6, 20 22. Nat. Genet. 2006;38(12):1378–1385. doi: 10.1038/ng1909. [DOI] [PMC free article] [PubMed] [Google Scholar]
- 17.The International HapMap Consortium. A haplotype map of the human genome. Nature. 2005;437(7063):1299–1320. doi: 10.1038/nature04226. [DOI] [PMC free article] [PubMed] [Google Scholar]
- 18.Dunham I, Kundaje A, Aldred SF, et al. An integrated encyclopedia of DNA elements in the human genome. Nature. 2012;489(7414):57–74. doi: 10.1038/nature11247. [DOI] [PMC free article] [PubMed] [Google Scholar]
- 19. Meissner A, Mikkelsen TS, Gu H, et al. Genome-scale DNA methylation maps of pluripotent and differentiated cells. Nature. 2008;454(7205):766–770. doi: 10.1038/nature07107.▪▪ The first reduced representation bisulfite sequencing-based methylome profiling report.
- 20.Aryee MJ, Wu Z, Ladd-Acosta C, et al. Accurate genome-scale percentage DNA methylation estimates from microarray data. Biostatistics. 2011;12(2):197–210. doi: 10.1093/biostatistics/kxq055. [DOI] [PMC free article] [PubMed] [Google Scholar]
- 21.Du P, Zhang X, Huang CC, et al. Comparison of beta-value and M-value methods for quantifying methylation levels by microarray analysis. BMC Bioinformatics. 2010;11:587. doi: 10.1186/1471-2105-11-587. [DOI] [PMC free article] [PubMed] [Google Scholar]
- 22.Maksimovic J, Gordon L, Oshlack A. SWAN: subset-quantile within array normalization for Illumina Infinium HumanMethylation450 BeadChips. Genome Biol. 2012;13(6):R44. doi: 10.1186/gb-2012-13-6-r44. [DOI] [PMC free article] [PubMed] [Google Scholar]
- 23. Zhang X, Mu W, Zhang W. On the analysis of the Illumina 450k array data: probes ambiguously mapped to the human genome. Front Genet. 2012;3:73. doi: 10.3389/fgene.2012.00073.▪▪ Important reminder on possible false discoveries due to wrong probe sequences, which necessitates careful validation.
- 24.Mancini D, Singh S, Ainsworth P, Rodenhiser D. Constiutively methylated CpG dinucleotides as mutation hot spots in the retinoblastoma gene (RB1) Am. J. Hum. Genet. 1997;61(1):80–87. doi: 10.1086/513898. [DOI] [PMC free article] [PubMed] [Google Scholar]
- 25.Choe SE, Boutros M, Michelson AM, Church GM, Halfon MS. Preferred analysis methods for Affymetrix GeneChips revealed by a wholly defined control dataset. Genome Biol. 2005;6(2):R16. doi: 10.1186/gb-2005-6-2-r16. [DOI] [PMC free article] [PubMed] [Google Scholar]
- 26.Wang D, Yan L, Hu Q, et al. IMA. An R package for high-throughput analysis of Illumina’s 450K Infinium methylation data. Bioinformatics. 2012;28(5):729–730. doi: 10.1093/bioinformatics/bts013. [DOI] [PMC free article] [PubMed] [Google Scholar]
- 27.Benjamin Y, Hochberg Y. Controlling the false discovery rate: a practical and powerful approach to multiple testing. J. R. Stat. Soc. Series B Stat. Methodol. 1995:289–300. [Google Scholar]
- 28.Selamat SA, Chung BS, Girard L, et al. Genome-scale analysis of DNA methylation in lung adenocarcinoma and integration with mRNA expression. Genome Res. 2012;22(7):1197–1211. doi: 10.1101/gr.132662.111. [DOI] [PMC free article] [PubMed] [Google Scholar]
- 29.Jaffe AE, Feinberg AP, Irizarry RA, Leek JT. Significance analysis and statistical dissection of variably methylated regions. Biostatistics. 2012;13(1):166–178. doi: 10.1093/biostatistics/kxr013. [DOI] [PMC free article] [PubMed] [Google Scholar]
- 30.Matys V, Fricke E, Geffers R, et al. TRANSFAC: transcriptional regulation, from patterns to profiles. Nucleic Acids Res. 2003;31(1):374–378. doi: 10.1093/nar/gkg108. [DOI] [PMC free article] [PubMed] [Google Scholar]
- 31.Newburger DE, Bulyk ML. UniPROBE: an online database of protein binding microarray data on protein-DNA interactions. Nucleic Acids Res. 2009;37(Database issue):D77–D82. doi: 10.1093/nar/gkn660. [DOI] [PMC free article] [PubMed] [Google Scholar]
- 32.Bryne JC, Valen E, Tang MH, et al. JASPAR, the open access database of transcription factor-binding profiles: new content and tools in the 2008 update. Nucleic Acids Res. 2008;36(Database issue):D102–D106. doi: 10.1093/nar/gkm955. [DOI] [PMC free article] [PubMed] [Google Scholar]
- 33.Ioshikhes IP, Zhang MQ. Large-scale human promoter mapping using CpG islands. Nat. Genet. 2000;26(1):61–63. doi: 10.1038/79189. [DOI] [PubMed] [Google Scholar]
- 34.Landry JR, Mager DL, Wilhelm BT. Complex controls: the role of alternative promoters in mammalian genomes. Trends Genet. 2003;19(11):640–648. doi: 10.1016/j.tig.2003.09.014. [DOI] [PubMed] [Google Scholar]
- 35.Davuluri RV, Grosse I, Zhang MQ. Computational identification of promoters and first exons in the human genome. Nat. Genet. 2001;29(4):412–417. doi: 10.1038/ng780. [DOI] [PubMed] [Google Scholar]
- 36.Taylor SM, Jones PA. Multiple new phenotypes induced in 10T1/2 and 3T3 cells treated with 5-azacytidine. Cell. 1979;17(4):771–779. doi: 10.1016/0092-8674(79)90317-9. [DOI] [PubMed] [Google Scholar]
- 37.Baylin SB. The cancer epigenome: its origins contributions to tumorigenesis translational implications. Proc. Am. Thorac. Soc. 2012;9(2):64–65. doi: 10.1513/pats.201201-001MS. [DOI] [PMC free article] [PubMed] [Google Scholar]
- 38. Merlo A, Herman JG, Mao L, et al. 5′ CpG island methylation is associated with transcriptional silencing of the tumour suppressor p16/CDKN2/MTSl inhuman cancers. Nat. Med. 1995;1(7):686–692. doi: 10.1038/nm0795-686.▪▪ One of the very first genes (CDKN2A) discovered to be involved in cancer through DNA methylation suppression.
- 39.Herman JG, Merlo A, Mao L, et al. Inactivation of the CDKN2ip161MTS1 gene is frequently associated with aberrant DNA methylation in all common human cancers. Cancer Res. 1995;55(20):4525–4530. [PubMed] [Google Scholar]
- 40.Esteller M, Corn PG, Baylin SB, Herman JG. A gene hypermethylation profile of human cancer. Cancer Res. 2001;61(8):3225–3229. [PubMed] [Google Scholar]
- 41.Krtolica K, Krajnovic M, Usaj-Knezevic S, Babic D, Jovanovic D, Dimitrijevic B. Comethylation of p16 MGMT genes in colorectal carcinoma: correlation with clinicopathological features and prognostic value World. J. Gastroenterol. 2007;13(8):1187–1194. doi: 10.3748/wjg.v13.i8.1187. [DOI] [PMC free article] [PubMed] [Google Scholar]
- 42.Zang JJ, Xie F, Xu JF, et al. p16 gene hypermethylation and hepatocellular carcinoma: a systematic review and metaanalysis. World J. Gastroenterol. 2011;17(25):3043–3048. doi: 10.3748/wjg.v17.i25.3043. [DOI] [PMC free article] [PubMed] [Google Scholar]
- 43.Salvesen HB, Das S, Akslen LA. Loss of nuclear p16 protein expression is not associated with promoter methylation but defines a subgroup of aggressive endometrial carcinomas with poor prognosis. Clin. Cancer Res. 2000;6(1):153–159. [PubMed] [Google Scholar]
- 44. Reik W, Walter J. Genomic imprinting: parental influence on the genome. Nat. Rev. Genet. 2001;2(1):21–32. doi: 10.1038/35047554.▪▪ Excellent review on gene imprinting and its control.
- 45.Rainier S, Johnson LA, Dobry CJ, Ping AJ, Grundy PE, Felnberg AP. Relaxation of imprinted genes in human cancer. Nature. 1993;362(6422):747–749. doi: 10.1038/362747a0. [DOI] [PubMed] [Google Scholar]
- 46. Hansen KD, Timp W, Bravo HC, et al. Increased methylation variation in epigenetic domains across cancer types. Nat. Genet. 2011;43(8):768–775. doi: 10.1038/ng.865.▪▪ Important report that shows that methylation variance is higher in different cancers.
- 47.Harris RA, Nagy-Szakal D, Pedersen N, et al. Genome-wide peripheral blood leukocyte DNA methylation microarrays identified a single association with inflammatory bowel diseases. Inflamm. Bowel Dis. 2012;18(12):2334–2341. doi: 10.1002/ibd.22956. [DOI] [PMC free article] [PubMed] [Google Scholar]
- 48.Heyn H, Li N, Ferreira HJ, et al. Distinct DNA methylomes of newborns and centenarians. Proc. Natl. Acad. Sci. USA. 2012;109(26):10522–10527. doi: 10.1073/pnas.1120658109. [DOI] [PMC free article] [PubMed] [Google Scholar]
- 49.Horvath S, Zhang Y, Langfelder P, et al. Aging effects on DNA methylation modules in human brain and blood tissue. Genome Biol. 2012;13(10):R97. doi: 10.1186/gb-2012-13-10-r97. [DOI] [PMC free article] [PubMed] [Google Scholar]
- 50.Nazor KL, Altun G, Lynch C, et al. Recurrent variations in DNA methylation in human pluripotent stem cells and their differentiated derivatives. Cell Stem Cell. 2012;10(5):620–634. doi: 10.1016/j.stem.2012.02.013. [DOI] [PMC free article] [PubMed] [Google Scholar]
- 51.Zendman AJ, Ruiter DJ, van Muijen GN. Cancer/testis-associated genes: identification, expression profile putative function. J. Cell. Physiol. 2003;194(3):272–288. doi: 10.1002/jcp.10215. [DOI] [PubMed] [Google Scholar]
- 52.Scanlan MJ, Simpson AJ, Old LJ. The cancer/testis genes: review, standardization, and commentary. Cancer Immun. 2004;4:1. [PubMed] [Google Scholar]
- 53.Kim KH, Choi JS, Kim IJ, Ku JL. Park JGPromoter hypomethylation reactivation of MAGE-A1 and MAGE-A3 genes in colorectal cancer cell lines and cancer tissues. World J. Gastroenterol. 2006;12(35):5651–5657. doi: 10.3748/wjg.v12.i35.5651. [DOI] [PMC free article] [PubMed] [Google Scholar]
- 54.Suzuki H, Maruyama R, Yamamoto E, Kai M. DNA methylation and microRNA dysregulation in cancer. Mol. Oncol. 2012;6(6):567–578. doi: 10.1016/j.molonc.2012.07.007. [DOI] [PMC free article] [PubMed] [Google Scholar]
- 55.Greenfield A, Carrel L, Pennisi D, et al. The UTX gene escapes X inactivation in mice and humans. Hum Mol. Genet. 1998;7(4):737–742. doi: 10.1093/hmg/7.4.737. [DOI] [PubMed] [Google Scholar]
- 56.Turcan S, Rohle D, Goenka A, et al. IDH1 mutation is sufficient to establish the glioma hypermethylator phenotype. Nature. 2012;483(7390):479–483. doi: 10.1038/nature10866. [DOI] [PMC free article] [PubMed] [Google Scholar]
Websites
- 101.Nature. Nature ENCODE explorer. www.nature.com/encode.
- 102.ENCODE Data Coordination Center at UCSC. ENCODE common cell types. http://genome.ucsc.edu/ENCODE/cellTypes.html.
- 103.NIH Roadmap Epigenomics Project. www.roadmapepigenomics.org.
- 104.NIH working definition of bioinformatics and computational biology. www.bisti.nih.gov/docs/CompuBioDef.pdf.
- 105.National Center for Biotechnology Information. RefSeq: NCBI Reference Sequence Database. www.ncbi.nlm.nih.gov/RefSeq/
- 106.National Center for Biotechnology Information. Gene Expression Omnibus. www.ncbi.nlm.nih.gov/geo/
- 107.Genelmprint. www.geneimprint.com.
- 108.The Cancer Genome Atlas. http://cancergenome.nih.gov.
Associated Data
This section collects any data citations, data availability statements, or supplementary materials included in this article.


