Abstract
The AKT/mammalian target of rapamycin (mTOR) pathway is considered as one of the commonly activated and deregulated signaling pathways in human cancer. mTOR is associated with other proteins in two molecular complexes: mTOR complex 1/Raptor and the mTOR complex 2/Rictor. Using the crystal structure of the related lipid kinase PI3Kγ, we built a model of the catalytic region of mTOR. The modeling of the three-dimensional (3D) structure of the mTOR was performed by homology modeling program SWISS-MODEL. The quality and validation of the obtained model were performed using PROCHECK and PROVE softwares. The overall stereochemical property of the protein was assessed by the Ramachandran plot. The model validation was also done by docking of known inhibitors. In this paper, we describe and validate a 3D model for the mTOR catalytic site.
Keywords: mTOR, homology modeling, mTOR kinase-domain, docking
Introduction
The mammalian target of rapamycin (mTOR) is a large 289 kDa (2,549 amino acids) protein expressed ubiquitously in most cells and tissues.1,2 mTOR is a serine-threonine kinase belonging to the PI3K/Akt/mTOR signaling pathway which is involved in several cell functions, including growth, proliferation, apoptosis, and autophagy.3 Referred to as FKBP-rapamycin-associated protein, mTOR was identified in the mid-1990s as the target of the FKBP12–rapamycin complex.4 As a crucial protein in PI3K and Akt pathways, mTOR plays a key role in cell growth and proliferation by controlling the rate of protein synthesis. Cofactors of mTOR include Raptor, which binds to mTOR’s N-terminus, and GβL, which interacts with mTOR’s kinase domain in the C-terminus. While Raptor functions in mediating interactions between mTOR and its substrates, GβL is believed to have relevance in general kinase activity.5
mTOR is the key component of two distinct signaling complexes in cells; these complexes are the mTOR complex 1/Raptor (mTORC1) and the mTOR complex 2/Rictor (mTORC2). Given the importance of these complexes in cellular growth, survival, motility, proliferation, protein synthesis, and transcription, it is not surprising that they are impacted in multiple types of cancer.6
Growth factors, nutrients, ATP energy levels, and stress regulate mTOR signaling through their activation of upstream kinases PDK1 and Akt.7 Activated PDK1 and Akt phosphorylate mTOR, triggering the phosphorylation of mTOR’s endogenous substrates p70/S6 kinase and eIF4E-binding protein.7,8 The downstream processes affected by this signaling cascade are mRNA translation, ribosomal biosynthesis, amino acid import, macroautophagy, transcription, actin organization, metabolism, cell cycle progression, starvation responses, stress response, and longevity.7,8 Therefore, mTOR has clinical implications in several diseases including cancer, hamartoma syndromes, and allograft rejection, as well as autoimmune, cardiovascular, and metabolic disorders.7
In response to changes in the levels of insulin, nutrients, and energy supply, signaling through these complexes affects a variety of processes, including protein translation and cell proliferation. The efficacy of derivatives of the natural product rapamycin (sirolimus), which functions as an allosteric inhibitor of mTORC1, has validated mTOR inhibition as anticancer treatment. More recently, extensive efforts have been focused on the discovery of ATP-competitive inhibitors of mTOR that would inhibit both mTORC1 and mTORC2 and may provide additional clinical benefits.6,9 These studies have suggested that these inhibitors have a therapeutic superiority to rapalogs (rapamycin analogs) in a number of cancers.6,9
A strong interest now exists for ATP-competitive inhibitors as anticancer agents. The rationale for using ATP-competitive mTOR and mTOR/PI3K dual inhibitors is mainly 1) aberrantly hyperactive signaling by PI3K/AKT/mTOR is a prominent feature of a broad spectrum of human cancers; 2) rapalogs cause activation of AKT through a negative feedback loop; and 3) mTORC2 is also involved in cancer cell growth and survival. Not surprisingly, inhibition of mTORC2 and/or PI3K simultaneously with mTORC1 appears to inhibit more robustly the signaling cascades and negating activation of this feedback loop. Several small-molecule ATP-competitive mTOR kinase inhibitors have been identified and developed as targeted anticancer agents. Because mTOR and PI3K kinase domains are closely related to each other, some of the compounds, it transpires, also potently inhibit the catalytic activity of PI3K, and are thus called mTOR/PI3K dual inhibitors. The first set of ATP-competitive mTOR kinase inhibitors has already entered early clinical trials.10–12
Since no crystallized structure exists for mTOR, we constructed a kinase-domain model to facilitate the rational design of clinically significant inhibitors against this biologically relevant kinase. Using homology modeling, we describe a construction and validation of a three-dimensional (3D) model of the kinase domain of mTOR. We propose a hypothetical binding model deduced from docking studies and available co-crystal structures.
Materials and methods
Sequence analysis and template selection
Sequences of mTOR (IDP42345) and PI3K (IDP48736) were obtained from UniProt (www.uniprot.org). mTOR catalytic domain is localized between amino acids 2,181 and 2,516 and the PI3K (Protein Data Bank [PDB] ID: 3L13) was chosen as a template.
To check the % identity and homology, sequences of mTOR kinase domain were compared to PI3K (kinase domain 282 1037 region) by BLAST using Basic Local Alignment Search Tool (http://blast.ncbi.nlm.nih.gov/Blast.cgi) and ClustalW (https://www.ebi.ac.uk/Tools/msa/clustalw2/).
Ligands selection
A group of ligands known as PI3K and mTOR inhibitors are selected and extracted from the PDB. These ligands were used as an assessment tool of the 3D model of mTOR by docking. Table 1 summarizes these ligands.
Table 1.
Ligands used as tool to assess 3D model of mTOR (protein name phosphatidylinositol 4,5-bisphosphate 3-kinase catalytic subunit gamma isoform)
| Ligands ID PDB | Receptor ID PDB | Resolution (Å) |
|---|---|---|
| JZY | 3L17 | 3.00 |
| JZX | 3L16 | 2.90 |
| BYM | 2A4Z | 2.90 |
| LXX | 3L54 | 2.30 |
| QJZ | 3QJZ | 2.90 |
| JZW | 3L13a | 3.00 |
| OTZ | 4FHJ | 2.60 |
| WYE | 3LJ3 | 2.43 |
| WYF | 3MJW | 2.87 |
| ATP | 1E8X | 2.20 |
Note:
3L13 is the template used to generate the model.
Abbreviations: mTOR, mammalian target of rapamycin; PDB, Protein Data Bank; 3D, three-dimensional.
Homology modeling
Manual alignments of human TOR to template were exported in FASTA format to the Swiss-Model Server.13–15 To generate the 3D model of mTOR catalytic domain (http://swissmodel.expasy.org/), we used a DS Viewer Pro 5.0, PyMol (DeLano Scientific, Palo Alto, CA, USA) (www.pymol.org/funding.html), and the MGL Tools 1.5.6 package of programs from Scripps Research Institute.16,17 PyMOL was used for the production of most figures and for preset analyses of ligand sites.18
Model validation and assessment
The predicted model of mTOR was further assessed by Structural Analysis and Verification Server (version3) (http://nihserver.mbi.ucla.edu/SAVES/). This meta server runs six programs for checking and validating protein structures during and after model refinement.
After the first evaluation with Swiss-Model Server, the model was assessed by VERIFY-3D.19 Verify3D analyzes the compatibility of an atomic model (3D) with its own amino acid sequence (1D). Each residue is assigned a structural class based on its location and environment (alpha, beta, loop, polar, nonpolar, etc). A collection of good structures is used as a reference to obtain a score for each of the 20 amino acids in this structural class. The scores (from −1 to +1) were added and plotted for individual residues. The residues falling in the area where the orange line crosses 0.0 have low prediction accuracy and less stable conformation20,21 as shown in Figure 1.
Figure 1.

VERIFY-3D plot analysis of computed mTOR 3D model.
Abbreviations: mTOR, mammalian target of rapamycin; 3D, three-dimensional; 1D, one-dimensional.
Structural validation of the protein model was done by PROCHECK,22 which determines stereochemical aspects along with main chain and side chain parameters with comprehensive analysis. The model was validated using the Ramachandran plot.23
PROVE was also used to calculate the volumes of atoms in macromolecules using an algorithm that treats the atoms like hard spheres and calculates a statistical Z-score deviation for the model from highly resolved (2.0 Å or better) and refined (R-factor of 0.2 or better) PDB-deposited structures.
Docking methodology and docking analyses
MGL tools 1.5.6 with AutoGrid4 and AutoDock vina (Scripps) were used for docking studies.24 PyMol and DS ViewerPro 5.0 were used to visualize the results.
The docking strategy involved two steps: 1) The first is the preparation of elements for docking. The docking by Autodock vina requires inputs into “.pdbqt” format. The Mgltools is used to transform the ligands in.Mol2 format and receptor in.pdb format on.pdbqt format. The same tool (MglTools) was also used to determine the docking box on the receptor. 2) The second step is docking itself followed by visualization by PyMol.
Results
Choice of the template
Many of the monomer crystals with different resolutions were used as templates (Table 1) and the obtained results were comparable (data not shown). We deliberately choose the 3L13 template to present the data.
Sequence analysis
The amino acid sequence of catalytic domain of mTOR protein was retrieved from the Uniprot database. The selected sequence for physiochemical analysis and 3D modeling is given in Figure 2. Sequence alignment by ClustalW and BLAST showed, respectively, a 16.6% identity and 32% identity between a sequence of the mTOR catalytic domain and the template.
Figure 2.

Amino acid sequence of mTOR catalytic domain.
Abbreviation: mTOR, mammalian target of rapamycin.
3D structure prediction and model validation
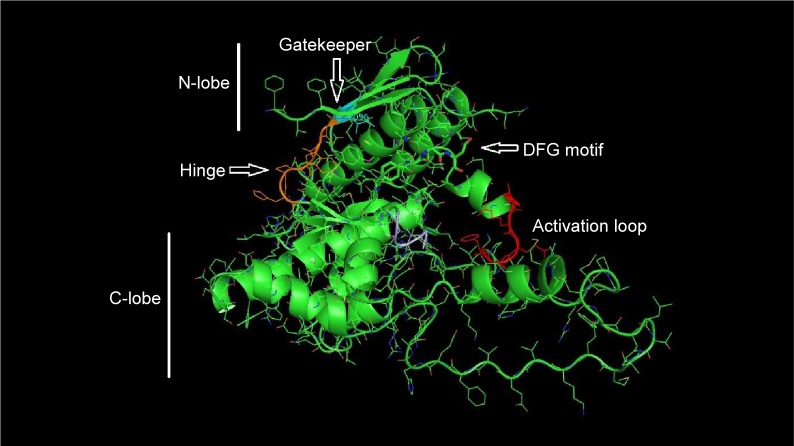
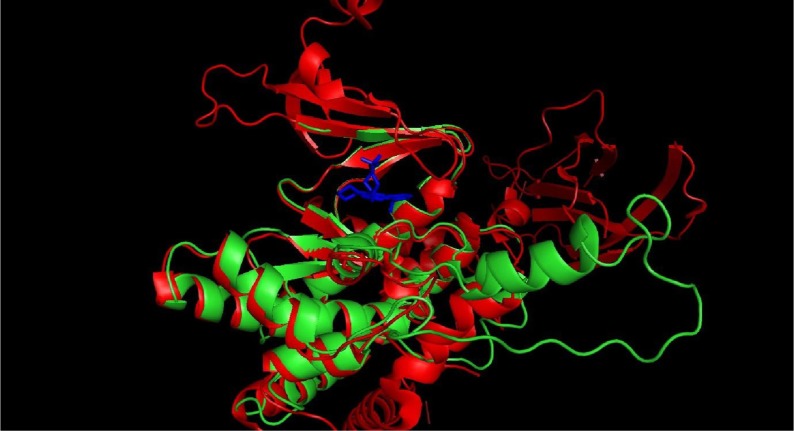
The 3D structure prediction (Figure 3) was carried out by alignment of target sequences with template structures (retrieved from PDB database 3L13), using a Swiss Model Server.13 Figure 4 shows the constructed model and the superposed model with template.
Figure 3.
Constructed 3D model of mTOR catalytic domain.
Notes: The model is oriented with the N-lobe at the top and the hinge is colored in orange. The C-lobe is at the bottom of the figure, the substrate binding loop is in purple and the activation loop in red. The rest of the binding site is represented by the alpha helix C, gatekeeper (ILE-2096), and the residue Lys2046 which is involved in catalysis and the DFG motif on sticks.
Abbreviations: mTOR, mammalian target of rapamycin; 3D, three-dimensional.
Figure 4.
Predictive model aligned to the template (red: template; green: model; blue: ligand).
The quality of the predicted structure of mTOR was further assessed and confirmed by different tools.
Using the VERIFY-3D analysis, Figure 1 shows that most of the residues fall above 0.15–0.4 demonstrating that the model is of good quality.
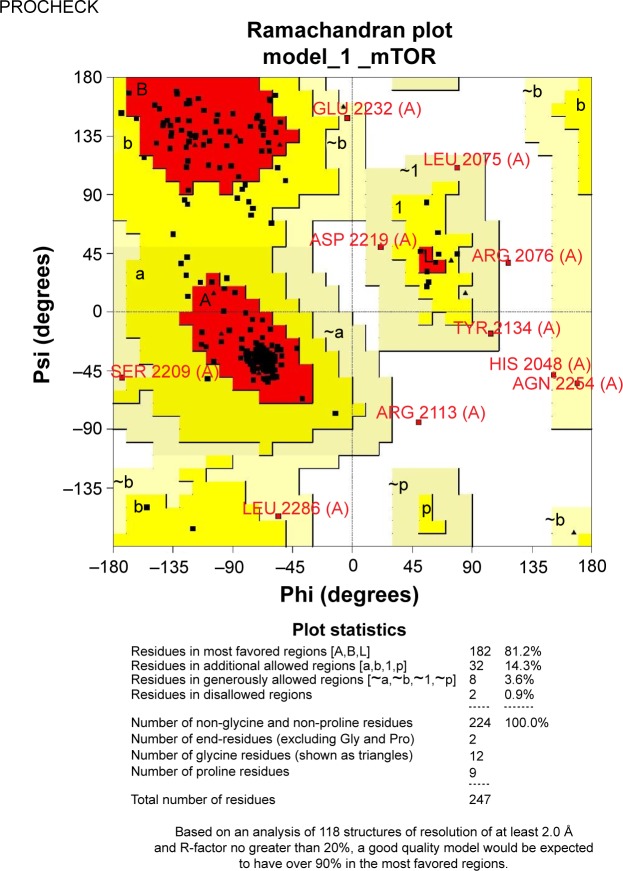
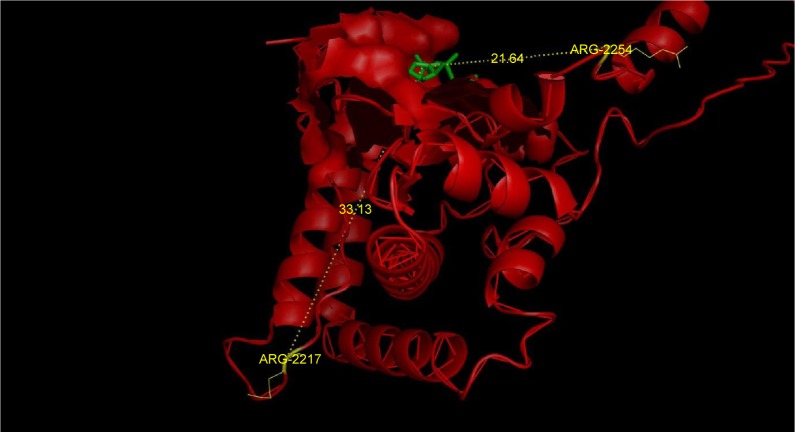
The stereochemical quality and accuracy of the predicted model was evaluated after the refinement process using the Ramachandran Map calculation with the PROCHECK program.22 The structure of catalytic domain of mTOR revealed many segment of helices and the Ramachandran plot showed a tight grouping or clustering of ph~ −50 and ps~ −50. Indeed, in the Ramachandran plot, the residues were classified according to its regions in the quadrangle. The red regions in the graph indicate the most allowed regions, whereas the yellow regions represent allowed regions. Glycine is represented by triangles and other residues are represented by squares in Figure 5. In our case, PROCHECK analysis reveals in the Ramachandran plot (Figure 5) concluding phi and psi angles to contribute in conformation of amino acids excluding glycine and proline with 81.2% (182 amino acids) residue in the most favored region, 14.3% (32 amino acids) in additional allowed region, 3.6% (8 amino acids) in the generously allowed region and 0.9% (2 amino acids) residue in the disallowed region. The two argi-nine residues (Arg2217 and Arg2254) found in the disallowed region are at very long distances from the pocket as shown in Figure 6 suggesting that those amino acids are structurally and functionally irrelevant to the ligand-binding site.
Figure 5.
Ramachandran plot of structural model of mTOR 3D.
Abbreviations: Gly, glycine; mTOR, mammalian target of rapamycin; Pro, proline; 3D, three-dimensional.
Figure 6.
Position of the Arg2217 and Arg2254 found in the disallowed region in Ramachandran plot.
Note: The mTOR model is in red, residues are in yellow, and ligand in green.
Abbreviation: mTOR, mammalian target of rapamycin.
Docking analysis
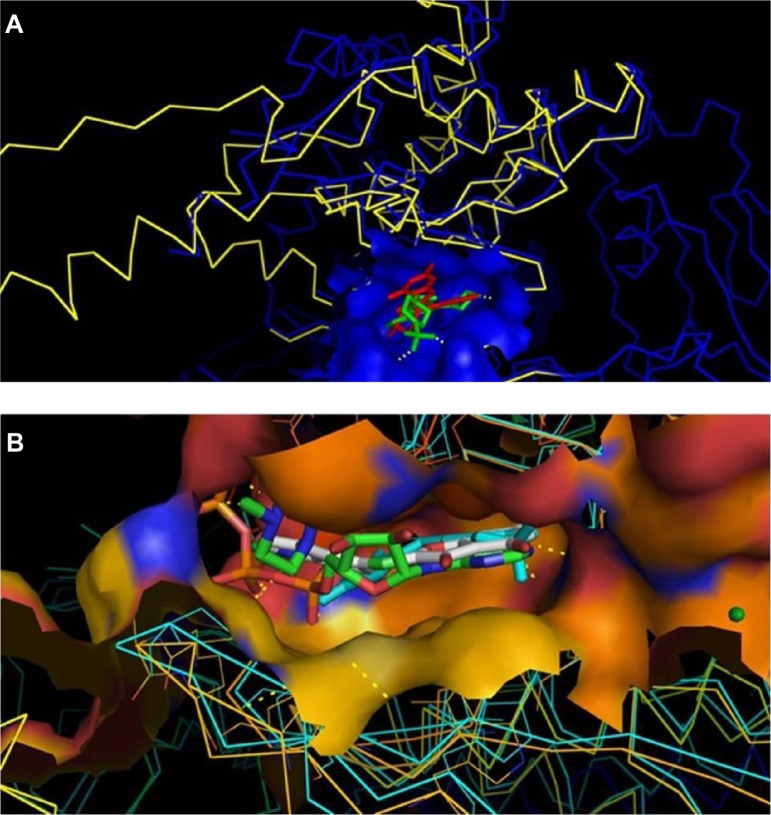
Following the construction and validation of our mTOR kinase-domain model, we employed pharmaceutical drug design approaches to virtually “dock” known mTOR kinase inhibitors into the putative ligand-binding pocket of the kinase domain. Figure 7A shows that the model with docked ligand (WYE) is perfectly superimposed on the template 3L13 with its ligand extracted from PDB.
Figure 7.
Docking of known inhibitors into 3D model construction.
Notes: Panel (A) shows the model built with a docked ligand superposed at the template 3L13 and its ligand. The model is in yellow, the PI3K (3L13) in blue, docked ligand (WYE) in red and the PI3K crystallized ligand (JZW) was in green. Panel (B) shows the superposition of the model of the ligand docked into catalytic site to ATP crystallized PI3K (PDB ID: 1E8X). The docked ligand (WYE) is in white, the ATP complexed into 1E8X in green, the BYM complexed into 2A4Z in Cyan.
Abbreviations: PDB, Protein Data Bank; ATP, adenosine triphosphate.
In Figure 7B, we present the docked ligand superposed at ATP into the catalytic site for two crystal structures of PI3K (1E8X and 2A4Z). Data not shown for docking other ligands show similar results.
Discussion
In this paper, we have chosen the approach of homology modeling to determine the catalytic site of the kinase mTOR. Based on ClustalW alignment of the mTOR kinase domain, PI3K has been selected as a template. Homology modeling was performed using the crystallographic structure of PI3Kγ (PDB ID: 3L13) which is closely related to a dual ATP-competitive PI3K/mTOR inhibitor and has a good crystallographic resolution (3.0 Å). Blast results revealed 32% identity between the two aligned kinases domain sequences. Tools used to assess the generated model show good scores. Indeed, compared to similar works,25–27 our PROCHECK results indicated acceptable quality of the structural model with 99.1% of the model’s torsion angles in favorable positions. Earlier studies using PI3Kγ (PDB ID: 1E7U) as a template25–27 showed 74% (133 amino acids) residues in the most favored regions and 3.4% (9 amino acids) residues in disallowed regions for 179 residues.
Model evaluation by docking gave a good score with ligands that are specific mTOR and dual mTOR/PI3K inhibitors and ATP. Docking analysis showed that the backbone structures of human TOR and PI3KC are comparable.
We are in the process of analyzing all available databases for inhibitors. The validated model will allow us to study different ATP-competitive mTOR inhibitors. These studies will allow us to identify an inhibitor as a drug target.
Acknowledgments
This work was carried out under intramural funding from the University Mohammed the Vth Rabat. We acknowledge support from Volubilis (French-Moroccan Action Intégrée) to AI. This work was also supported by a grant from the NIH for H3Africa BioNet to AI.
Footnotes
Disclosure
The authors report no conflicts of interest in this work.
References
- 1.Brown EJ, Albers MW, Shin TB, et al. A mammalian protein targeted by G1-arresting rapamycin–receptor complex. Nature. 1994;369:756–758. doi: 10.1038/369756a0. [DOI] [PubMed] [Google Scholar]
- 2.Murakami M, Ichisaka T, Maeda M, et al. mTOR is essential for growth and proliferation in early mouse embryos and embryonic stem cells. Mol Cell Biol. 2004;24(15):6710–6718. doi: 10.1128/MCB.24.15.6710-6718.2004. [DOI] [PMC free article] [PubMed] [Google Scholar]
- 3.Sabatini DM, Erdjument-Bromage H, Lui M, Tempst P, Snyder SH. RAFT1: a mammalian protein that binds to FKBP12 in a rapamycin-dependent fashion and is homologous to yeast TORs. Cell. 1994;78(1):35–43. doi: 10.1016/0092-8674(94)90570-3. [DOI] [PubMed] [Google Scholar]
- 4.Kim DH, Sarbassov DD, Ali SM, et al. GbetaL, a positive regulator of the rapamycin-sensitive pathway required for the nutrient-sensitive interaction between raptor and mTOR. Mol Cell. 2003;11(4):895–904. doi: 10.1016/s1097-2765(03)00114-x. [DOI] [PubMed] [Google Scholar]
- 5.Wullschleger S, Loewith R, Hall MN. TOR signaling in growth and metabolism. Cell. 2006;124(3):471–484. doi: 10.1016/j.cell.2006.01.016. [DOI] [PubMed] [Google Scholar]
- 6.Raught B, Gingras A, Sonenberg N. The target of rapamycin (TOR) proteins. PNAS. 2001;98(13):7037–7044. doi: 10.1073/pnas.121145898. [DOI] [PMC free article] [PubMed] [Google Scholar]
- 7.McAuliffe PF, Meric-Bernstam F, Mills GB, Gonzalez-Angulo AM. Deciphering the role of PI3K/Akt/mTOR pathway in breast cancer biology and pathogenesis. Clin Breast Cancer. 2010;10(3):S59–S65. doi: 10.3816/CBC.2010.s.013. [DOI] [PubMed] [Google Scholar]
- 8.Richard DJ, Verheijen JC, Zask A. Recent advances in the development of selective, ATP-competitive inhibitors of mTOR. Curr Opin Drug Discov Dev. 2010;13(4):428–440. [PubMed] [Google Scholar]
- 9.Lv X, Ma X, Hu Y. Furthering the design and the discovery of small molecule ATP-competitive mTOR inhibitors as an effective cancer treatment. Expert Opin Drug Discov. 2013;8(8):991–1012. doi: 10.1517/17460441.2013.800479. [DOI] [PubMed] [Google Scholar]
- 10.Zhang Y-J, Duan Y, Steven Zheng XF. Targeting the mTOR kinase domain: the second generation of mTOR inhibitors. Drug Discov Today. 2011;16(7/8):326–331. doi: 10.1016/j.drudis.2011.02.008. [DOI] [PMC free article] [PubMed] [Google Scholar]
- 11.Feldman M, Apsel B, Uotila A, et al. Active-site inhibitors of mTOR target rapamycin-resistant outputs of mTORC1 and mTORC2. PLoS Biol. 2009;7(2):0371–0383. doi: 10.1371/journal.pbio.1000038. [DOI] [PMC free article] [PubMed] [Google Scholar]
- 12.Zhou H, Huang S. Current development of the second generation of mTOR inhibitors as anticancer agents. Chin J Cancer. 2012;31(1):8–18. doi: 10.5732/cjc.011.10281. [DOI] [PMC free article] [PubMed] [Google Scholar]
- 13.Bordoli L, Kiefer F, Arnold K, Benkert P, Battey J, Schwede T. Protein structure homology modeling using SWISSMODEL workspace. Nat Protoc. 2009;4:1–13. doi: 10.1038/nprot.2008.197. [DOI] [PubMed] [Google Scholar]
- 14.Arnold K, Bordoli L, Kopp J, Schwede T. The SWISS-MODEL workspace: a web-based environment for protein structure homology modelling. Bioinformatics. 2006;22:195–201. doi: 10.1093/bioinformatics/bti770. [DOI] [PubMed] [Google Scholar]
- 15.Kiefer F, Arnold K, Künzli M, Bordoli L, Schwede T. The SWISS-MODEL repository and associated resources. Nucl Acids Res. 2009;37:D387–D392. doi: 10.1093/nar/gkn750. [DOI] [PMC free article] [PubMed] [Google Scholar]
- 16.Morris GM, Huey R, Lindstrom W, et al. AutoDock4 and AutoDock-Tools4: automated docking with selective receptor flexibility. J Comput Chem. 2009;30:2785–2791. doi: 10.1002/jcc.21256. [DOI] [PMC free article] [PubMed] [Google Scholar]
- 17.Morris GM, Huey R, Olson AJ. Using AutoDock for ligand-receptor docking. Curr Protoc Bioinf. 2008 doi: 10.1002/0471250953.bi0814s24. Chapter 8:Unit 8.14. [DOI] [PubMed] [Google Scholar]
- 18.Delano W. The PyMOL Molecular Graphics System 1.01. 2009. Available from: www.pymol.sourceforge.net.
- 19.Eisenberg D, Luthy R, Bowie JU. VERIFY3D: assessment of protein models with three dimensional profiles. Methods Enzymol. 1997;277:396–404. doi: 10.1016/s0076-6879(97)77022-8. [DOI] [PubMed] [Google Scholar]
- 20.Bowie JU, Lüthy R, Eisenberg D. A method to identify protein sequences that fold into a known three-dimensional structure. Science. 1991;12:253. doi: 10.1126/science.1853201. [DOI] [PubMed] [Google Scholar]
- 21.Lüthy R, Bowie JU, Eisenberg D. Assessment of protein models with three-dimensional profiles. Nature. 1992;5:356. doi: 10.1038/356083a0. [DOI] [PubMed] [Google Scholar]
- 22.Laskowski RA, MacArthur MW, Moss DS, Thornton JM. PROCHECK – a program to check the stereochemical quality of protein structures. J Appl Crystallogr. 1993;26:283–291. [Google Scholar]
- 23.Ramachandran GN, Sasisekharan V. Conformation of polypeptides and proteins. Adv Protein Chem. 1968;23:283–437. doi: 10.1016/s0065-3233(08)60402-7. [DOI] [PubMed] [Google Scholar]
- 24.Trott O, Olson AJ. AutoDock Vina: improving the speed and accuracy of docking with a new scoring function, efficient optimization and multithreading. J Comput Chem. 2010;31:455–461. doi: 10.1002/jcc.21334. [DOI] [PMC free article] [PubMed] [Google Scholar]
- 25.Tobak A, et al. PhD thesis. Newark, NJ: Rutgers University; 2007. Construction of the 3D Structure of the mTOR Kinase-Domain and Discovery of Novel mTOR Inhibitors. [Google Scholar]
- 26.Mohammad AK, Majed MA, Saja A, Mutasem OT. Pharmacophore modeling, homology modeling, and in silico screening reveal mammalian target of rapamycin inhibitory activities for sotalol, glyburide, metipranolol, sulfamethizole, glipizide, and pioglitazone. J Mol Graphics Model. 2013;42:39–49. doi: 10.1016/j.jmgm.2013.02.009. [DOI] [PubMed] [Google Scholar]
- 27.Ting R, Tao L, Haoliang Y, et al. A selectivity study on mTOR/PI3Kα inhibitors by homology modeling and 3D-QSAR. J Mol Model. 2012;18(1):171–186. doi: 10.1007/s00894-011-1034-3. [DOI] [PubMed] [Google Scholar]
- 28.Colovos C, Yeates TO. Verification of protein structures: patterns of nonbonded atomic interactions. Protein Sci. 1993;2:1511–1519. doi: 10.1002/pro.5560020916. [DOI] [PMC free article] [PubMed] [Google Scholar]
- 29.Jacinto E, Hall MN. Tor signaling in bugs, brain and brawn. Nat Rev Mol Cell Biol. 2003;4:117–126. doi: 10.1038/nrm1018. [DOI] [PubMed] [Google Scholar]


