Abstract
Background: The relationship between DNA methyltransferase (DNMT) and O6-methylguanine-DNA methyltransferase (MGMT) in mediating tumorigenesis is still poorly understood. This study was carried out to investigate a correlation between DNMT1 and MGMT immunoexpression in astrocytic tumour samples. Methods: Formalin-fixed paraffin embedded tissues of astrocytic tumour patients was obtained from an observational study conducted in Hospital Universiti Sains Malaysia (USM), which was performed from January 1997 until May 2012. Patient’s histological information was retrieved from the accessible Pathology Registry. Immunohistochemistry (IHC) staining was performed to assess DNMT1 and MGMT expressions in patients’ tumours. Results: Our data showed that DNMT1 was highly expressed in high grade astrocytic tumours. A multiple regression analysis demonstrated a significant association of DNMT1 overexpression with tumour grade III and IV (GIII: OR=5.802; 95% CI: 1.059, 31.785; p value=0.043; GIV: OR=40.663; 95% CI=4.069, 406.347; p value=0.002). The MGMT protein was downregulated in tumours with higher grade as evident by a reduction mean H-score for MGMT expression from GI to GIV [28.36 ± 43.88, 28.08 ± 33.67, 26.00 ± 48.70 and 16.20 ± 35.61]. However, a good negative correlation was observed between DNMT1 and MGMT in high grade tumour [Spearman correlation test: r=-0.561, p value≤0.001 in percentage expression and r=-0.576, p value≤0.001 in H score]. Conclusion: DNMT1 overexpression was seen correlated with a reduction of MGMT protein expression in high grade astrocytic tumour. Understanding the role of these markers could be important to overcome astrocytic tumour aggresiveness.
Keywords: DNMT1, MGMT, astrocytic tumour, immunohistochemistry
Introduction
Global hypermethylation and focal specific hypermethylation are another pathway of complex, heterogeneous carcinogenesis in astrocytic tumour [1-3]. Specific hypermethylation or global hypomethylation in gene is seen in many cancers and regulated by DNA methyltransferase (DNMT) [4-7]. There are several major DNMTs and divided into ‘maintenance’ or ‘de novo’ DNMTs [1,8]. DNA Methyltransferase 1 (DNMT1) is a DNMT that plays important role in ‘maintenance’ of methylation in DNA [1,8]. In contrast DNA Methyltransferase 3A (DNMT3A) and DNA Methyltransferase 3B (DNMT3B) are involved in ‘de novo’ methylation [1,8].
O6-methylguanine-DNA methyltransferase (MGMT) is a DNA repair protein that has been widely studied on glioma in the last decade [9]. The main function of this enzyme is to protect against lethal mutation from the effects of simple alkylating agents [10]. This protein’s important role is to remove the alkyl group from O6 position of alkyl guanine and/or in lesser extent, methyl group to cysteine residue [11,12]. Apoptotic pathway and self destruction mechanism will be activated if these processes failed and eventually lead to cell death. The level of MGMT enzyme protein is proportionate with the ability of the cells to repair itself [13].
Promoter hypermethylation on several tumour suppressor genes (MGMT, BLU, NORE1A, PTEN and RASSF1A) are usually found in glioma [3,12,14]. In high grade glioma, promoter hypermethylation of MGMT gene is one of the predictor factors for treatment response. In addition, as we know DNA methylation is negatively correlated with gene expression [15-17]. Furthermore, Temozolomide (TMZ) therapy, an alkylating agent is also proved to prolong overall survival time in newly diagnosed and recurrent glioblastoma [11,18-20]. The correlation between TMZ response and the predictive power of epigenetic silencing of MGMT gene (promoter hypermethylation) to predict treatment response are mainly explained by assumption that gene hypermethylation at promoter gene which is rich with CpG island influence the expression of MGMT enzyme [20]. Even though, both proteins are theoretically interrelated but a correlation study between DNMT1 and MGMT immunoexpression was never been published before. Therefore, the purpose of this study is to explore correlation between DNMT1 and MGMT immunoexpression in astrocytic tumour. The differential protein expression and the potential clinico-pathological association were also explored.
Materials and methods
Tissue sample and patients selection
A total of 71 formalin fixed, paraffin embedded, first biopsy specimens of astrocytic tumour patients diagnosed from January 1997 to May 2012 were retrieved from Pathology Registry, Hospital Universiti Sains Malaysia (USM). Haematoxylin and eosin (H&E) stained were reviewed by 2 pathologists and the astrocytic tumours were graded and classified according to World Health Organization (WHO) [15]. Beside of WHO grade, the tumours were also categorized into tumour grade which consist of low (composed of WHO grade I and II tumour) and high grade tumour (composed of WHO grade III and IV tumour) [21]. This study was approved by Human Research Ethic Committee USM (HREC).
Immunohistochemistry (IHC) staining
Continuous serial sections at 3-4 µm were cut from formalin fixed, paraffin embedded tissue of above patients for immunohistochemical staining. All the slides were deparaffinised and dehydrated. For antigen retrieval, the tissues were heated at 121°C for 30 seconds using decloaking chamber containing Dako Antigen Retrieval solution pH 9.0. Non-specific staining reaction were blocked with Dako REAL peroxidise blocking solution [150 µL] for 5 minutes. The tissue were incubated with primary antibodies against DNMT1 [goat monoclonal antibody (N-16), sc-10219; Santa Cruz, Germany; dilution 1:50] and MGMT [mouse monoclonal antibody (SPM278), sc-56432; Santa Cruz, Germany; dilution 1:75] at 4°C for overnight. Then, the tissue sections were incubated with biotinylated secondary antibodies [polyclonal rabbit anti-goat immunoglobulin/HRP, P0449, Dako; dilution 1:200 for DNMT1 and Dako REAL EnVision for MGMT] for 30 minutes at room temperature. 3.3’-Diaminobenzidine tetrahydrochloride was used as chromogen and counter stained with haematoxylin. Tonsil was used as positive control.
Scoring criteria
500 tumour cells were randomly counted in few hotspots, under 400× magnification using Olympus CX31 microscope by avoiding the perivascular areas that rich with lymphocytes. In very small tissue sections (less than 500 cells), all tumour cells were counted [22]. Lymphocytes infiltration in the tumours served as positive internal control [23,24]. The slides were reviewed by a pathologist, blinded with clinicopathological profile. Degree of DNMT1 nuclear staining intensity was scored as 0 (intensity less than the positive internal control), 1 (intensity is equal to the positive internal control) and 2 (intensity is more than positive internal control) [22]. Meanwhile, perivascular lymphocytes or endothelial cells [25] served as internal positive control in MGMT [17]. Degree of MGMT nuclear staining intensity was scored as 0, 1, 2 and 3 with score 0 was considered as negative [26]. Evaluation of the intensity was done by 2 pathologists individually who blinded to clinicopathological data. The sections that showed score discrepancies were reviewed together again and a consensus score was given during the meeting. Protein percentage was the total positive cells divided by total counted cells and multiplied by 100. The cut-off points used to discriminate DNMT1 protein reduced expression and DNMT1 protein overexpression group (DNMT1 protein expression) were 10% [27,28]. H-score was the protein percentage multiplied by nuclear staining intensity score [29]. The mean H-score for DNMT1 expression (52.0) was used to discriminate the low H-score level and high H-score level (H-score level for DNMT1 expression). For MGMT, only protein percentage and H-score were counted.
Statistical analysis
Descriptive statistics were computed for clinicopathological variables. For numerical variables, the mean and standard deviation (SD) were obtained. While for categorical variables, the frequencies (%) were calculated. The comparison between the categorical variables of interest such as expression of proteins in different tumour grade, race, site and sex were analysed by employing Pearson Chi-Square Test. However, Fisher’s Exact Test was applied when the assumption was not met. Comparison between independent numerical variables such in age and protein percentage for different proteins expression groups were using T test or Mann-Whitney test (depending on the variables distribution pattern). The association between the DNMT1 protein expression (dichotomous outcome) and clinicopathological variables were explored by simple logistic regression test then later by multiple logistic regression test. In simple logistic regression, the regression coefficient (B), crude odd ratio (crude OR) with 95% confidence interval (CI), Wald statistic with degree of freedom (df) and p value were obtained. A preliminary model was built after reviewing the enter selection. The subsequent steps (checking for multicollinearity/interaction and checking for model fitness/outlier) were done for model fitness. Adjusted odd ratio (OR) with 95% CI, Wald statistic and p value from multiple logistic regression (enter selection method) were obtained. The correlation between DNMT1 and MGMT (protein percentage and H-score) in astrocytic tumour (WHO grade and tumour grade) were analysed by Spearman’s correlation test since these markers were not normally distributed. The degrees of linear relationship were measured by correlation coefficient (r) and p value less than 0.05 (<0.05) was considered as significant. A ‘0’ correlation coefficient was equivalent to no correlation and 1 correlation coefficient was equivalent to perfect correlation. Positive or negative correlation coefficient signified positive or negative linear relationship. The rates for correlation coefficient were adopted from statistical book by Norsa’adah et al [Poor≤0.25, Moderate=0.26-0.50, Good=0.51-0.75 and Excellent=0.76-1.00] [30].
Results
Patients’ characteristic
The characteristics of the patients and tumour parameters were listed in Table 1. There were 27 [38.0%] glioblastoma (WHO grade IV), 14 [19.7%] anaplastic astrocytoma (WHO grade III), 17 [23.9%] (WHO grade II) (diffuse astrocytoma 15 and pleomorphic xanthoastrocytoma 2) and 13 [18.3%] pilocytic astrocytoma (WHO grade I). The mean age of the patient was 33 years old.
Table 1.
Demographic Data
| Variables | n=71 | Percentage (%) |
|---|---|---|
| Age (year old) | 33.07 (SD: ± 18.49) | |
| Race | ||
| Malay | 69 | 97.2 |
| Chinese | 2 | 2.8 |
| Indian | 0 | 0.0 |
| Others | 0 | 0.0 |
| Sex | ||
| Male | 38 | 53.5 |
| Female | 33 | 46.5 |
| Site | ||
| Supratentorial | 60 | 84.5 |
| Infratentorial | 11 | 15.5 |
| Tumour Grade | ||
| Low grade | 30 | 42.3 |
| High grade | 41 | 57.7 |
| WHO Grade | ||
| I | 13 | 18.3 |
| II | 17 | 23.9 |
| III | 14 | 19.7 |
| IV | 27 | 38.0 |
(SD): Standard Deviation for numerical variables.
DNMT1 immunoexpression in astrocytic tumour
Figure 1A-D indicated nuclear localisation of DNMT1 immuno-expression in astrocytic tumours. Figure 2A showed the upregulation of DNMT1 immunoexpression which was significantly higher in high grade tumours as compared to low grade tumours (90.2% vs. 53.3%, P<0.001). It was further supported using the H-score criteria that DNMT1 was significantly upregulated in high grade tumour (56.1%) compared to low grade tumour group [16.7%] (P<0.001) (Figure 2B).
Figure 1.
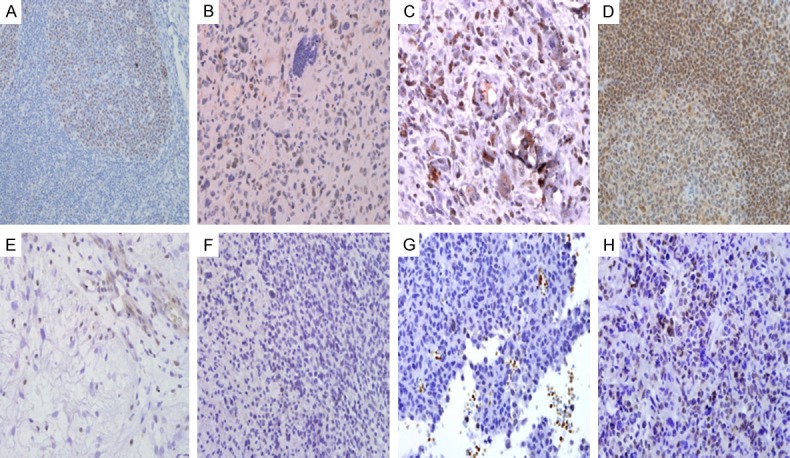
Photomicrographs of DNMT1 nuclear staining of lymphocytes in germinal centre in tissue control (tonsil) (A). DNMT1 nuclear grading score 1. There is also a reactive lymphocyte with DNMT1 nuclear staining positivity at right upper corner for comparison. The lymphocytes are relatively smaller and rounder as compared to neoplastic cells (B). DNMT1 nuclear grading score 2 (C). Photomicrograph of MGMT nuclear staining of lymphocytes in tissue control (tonsil) (D). MGMT nuclear grading score 0. The endothelial cells and lymphocytes are stained positive (E). MGMT nuclear grading score 1 (arrow) (F). MGMT nuclear grade score 2 (arrow) (G). MGMT nuclear grade score 3 (arrow) (H).
Figure 2.
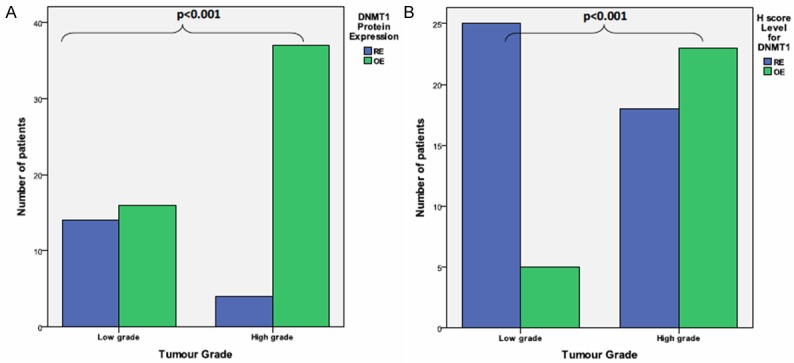
Bar chart show DNMT1 (A) protein expression and (B) H-score level in different tumour grade (low vs. high grade) tumour using Fisher Exact Test. OE: Overexpression, RE: Reduced expression.
From Figure 3A, the mean percentage of DNMT1 expression from WHO grade I to grade IV were increasing [18.53 ± 23.75, 23.12 ± 25.80, 27.45 ± 14.45 and 42.22 ± 22.49, respectively]. A similar observation of DNMT1 was also noted using the H-score method (Figure 3B).
Figure 3.
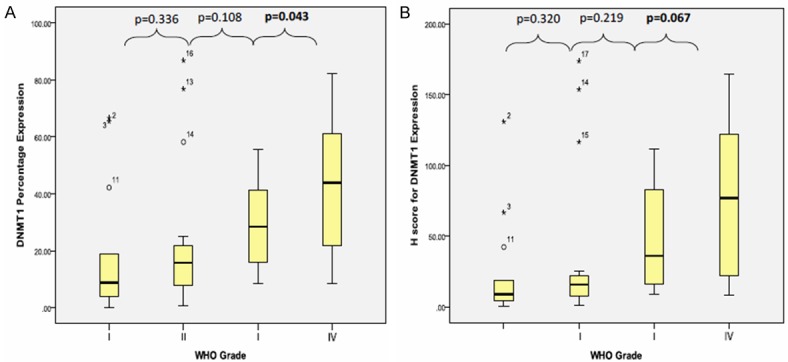
Box plot shows DNMT1 (A) protein percentage expression and (B) H-score association in each WHO grade (I-IV) tumour using Mann Whitney’ test.
The mean percentage of DNMT1 expression for high grade tumour was 37.18% ± 21.14%, which significantly higher than mean percentage of DNMT1 expression for low grade tumour [21.14% ± 24.62%] [P<0.001] (Figure 4A). Following to H-score criteria, there was statistically significant difference between mean H-score for DNMT1 in high grade [67.61 ± 47.72] and low grade [30.71 ± 47.70] tumour group [p value≤0.001] (Figure 4B).
Figure 4.
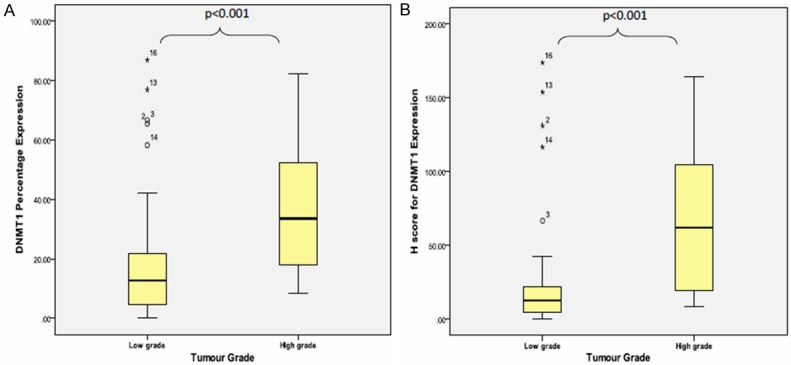
Box plot shows DNMT1 (A) protein percentage expression and (B) H-score association in tumour grade (low vs. high grade) using Mann Whitney’ test.
Association between DNMT1 protein expression and clinicopathological factors in astrocytic tumour
Among 71 patients, the mean age was significantly higher in DNMT1 overexpression [36.36 ± 18.44] than in DNMT1 reduced expression [23.39 ± 15.34] [p value=0.009]. Majority of Malay patients [51 out of 69 patients, 73.9%] and all Chinese patients [2 out of 2 patients, 100%] were in DNMT1 overexpression. Male patients were predominant in DNMT1 overexpression group [29 out of 53 patients, 54.7%]. While in DNMT1 reduced expression tumours, the frequency of patients in each gender groups were levelled [9 patients, 50%]. Supratentorium was the most common location for DNMT1 overexpression tumour [45 out of 53 patients, 84.9%] as well as in DNMT1 reduced expression tumour [15 out of 18 patients, 83.3%]. Among DNMT1 overexpression tumours located in supratentorium, parietal and temporoparietal lobes were the most common sites [18 out of 45 patients, 40%]. While, among the DNMT1 reduced expression tumours located in supratentorium, frontal, frontoparietal and parietal lobes were the most common sites [8 out of 15 patients, 53.3%].
In Simple Logistic Regression analysis, there were few variables (age, WHO grade and tumour grade) significantly associated with DNMT1 protein overexpression (Table 2). The astrocytic tumour patients with an increase in one year of age in this study, will had an increase 1.045 times the odds to get DNMT1 protein overexpression in the tumour cells [95% CI: 1.009, 1.082; p value=0.014]. In tumour grade (high and low grade), the astrocytic tumour patients who had high grade tumour had 8.094 times the odds to get DNMT1 overexpression than low grade tumours [95% CI: 2.304, 10.433; p value=0.001]. Similarly in WHO grade, the astrocytic tumour patients who had WHO grade IV and grade III had 41.600 and 5.867 (respectively) times the odds to get DNMT1 overexpression than WHO grade I tumour patients [95% CI: 4.219, 410.22; p value=0.001 and 95% CI: 1.075, 32.002; p value=0.041, respectively]. The other variables which showed no association were summarized in Table 2. In the final model (Multiple Logistic Regression), the astrocytic tumour patients who had WHO grade IV and grade III had 40.663 and 5.802 (respectively) times the odds to get DNMT1 overexpression than WHO grade I tumour patients [GIV: 95% CI: 4.069, 406.347; p value=0.002 and GIII: 95% CI: 1.059, 31.785; p value=0.043, respectively] (Table 3). Age was statistically significant in univariate analysis but age variable was correlated with tumour grade (Independent T test, P≤0.001) and it was excluded from the model. We regroup the age variable into young and old age group that used mean age as the cut-off point and found that both groups were not associated with tumour grade (Independent T test: <33 year old, p value=0.386 and ≥ 33 years old, p value=0.105). Other variables were not statistically significant in multivariate analysis.
Table 2.
Clinico-pathological factors associated with DNMT1 overexpression in astrocytic tumour patients from simple logistic regression analysis
| Variables | Regression coefficient (B) | Crude OR (CI 95%) | Wald statistic (df) | P-value |
|---|---|---|---|---|
| Age | 0.044 | 1.045 (1.009, 1.082) | 6.086 (1) | 0.014 |
| Race | ||||
| Chinese | 0 | 1 | ||
| Malay | -20.161 | <0.001 | <0.001 (1) | 0.999 |
| Sex | ||||
| Female | 0 | 1 | ||
| Male | 0.189 | 1.208 (0.414, 3.525) | 0.120 | 0.729 |
| Site | ||||
| Infratentorial | 0 | 1 | ||
| Supratentorial | 0.118 | 1.125 (0.264, 4.795) | 0.025 (1) | 0.873 |
| Tumour grade | ||||
| Low grade | 0 | 1 | ||
| High grade | 2.091 | 8.094 (2.304, 10.433) | 10.640 (1) | 0.001 |
| WHO grade | ||||
| I | 0 | 1 | ||
| II | 1.076 | 2.933 (0.657, 13.093) | 1.988 (1) | 0.159 |
| III | 1.769 | 5.867 (1.075, 32.002) | 4.178 (1) | 0.041 |
| IV | 3.728 | 41.600 (4.219, 410.222) | 10.194 (1) | 0.001 |
| MGMT protein | ||||
| Expression | ||||
| OE | 0 | 1 | ||
| RE | -0.151 | 0.860 (0.208, 3.550) | 0.043 (1) | 0.835 |
| Percentage | -0.015 | 0.985 (0.956, 1.015) | 0.937 (1) | 0.333 |
| H-score | -0.002 | 0.998 (0.985, 1.011) | 0.092 (1) | 0.762 |
| H-score level | ||||
| ≥23 (High) | 0 | 1 | ||
| <23 (Low) | 0.206 | 1.229 (0.332, 4.542) | 0.095 (1) | 0.758 |
OE: overexpression, RE: reduced expression, OR: odd ratio, df: degree of freedom, CI: confident interval.
Table 3.
Clinico-pathological factors associated with DNMT1 overexpression in astrocytic tumour patients from multiple logistic regression
| Variable | Crude ORa (CI 95%) | Adjusted ORb (CI 95%) | Wald statisticb (df) | p-valueb |
|---|---|---|---|---|
| WHO grade | ||||
| I | 1 | 1 | ||
| II | 2.933 (0.657, 13.093) | 2.944 (0.659, 13.163) | 1.998 (1) | 0.158 |
| III | 5.867 (1.075, 32.002) | 5.802 (1.059, 31.785) | 4.105 (1) | 0.043 |
| IV | 41.600 (4.219, 410.222) | 40.663 (4.069, 406.347) | 9.953 (1) | 0.002 |
| MGMT percentage | 0.985 (0.956, 1.015) | 0.997 (0.963, 1.032) | 0.420 (1) | 0.863 |
OR: odd ratio, df: degree of freedom, CI: confident interval, RE: reduced expression, OE: overexpression;
simple logistic regression;
multiple logistic regression.
MGMT immunoexpression in astrocytic tumour
The mean percentage of MGMT protein expression was 13.60 ± 15.53% with the minimum percentage expression was 0% and the maximum protein expression was 76.8%. The mean percentage of MGMT protein expression was not showing statistically significant difference between grade I and grade II tumour groups [grade I (mean: 17.15% ± 22.97%) and grade II (mean: 18.08% ± 15.56%)] [p value=0.194]. Even though the mean percentage were in reducing trend from WHO grade II group to 13.14% ± 15.99% in WHO grade III tumour group to 9.31% ± 13.31% in WHO grade IV tumour group, the difference were not statistically significant [GII/GIII p value=0.165; GIII/GIV p value=0.161] (Figure 5A). However, the mean percentage expression for high grade tumour was 10.61% ± 14.21%, which showed significantly lower than mean percentage expression for low grade tumour [17.68% ± 18.76%] [p value=0.038] (Figure 6A).
Figure 5.
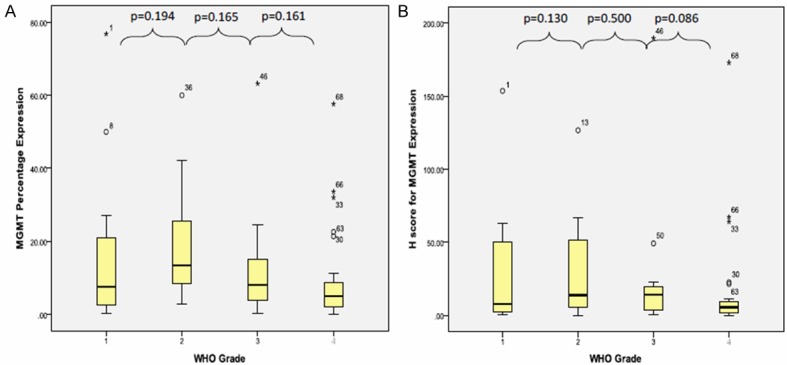
Box plot shows MGMT (A) protein percentage expression and (B) H-score in different tumour grade (low vs. high grade) using Mann Whitney’ test.
Figure 6.
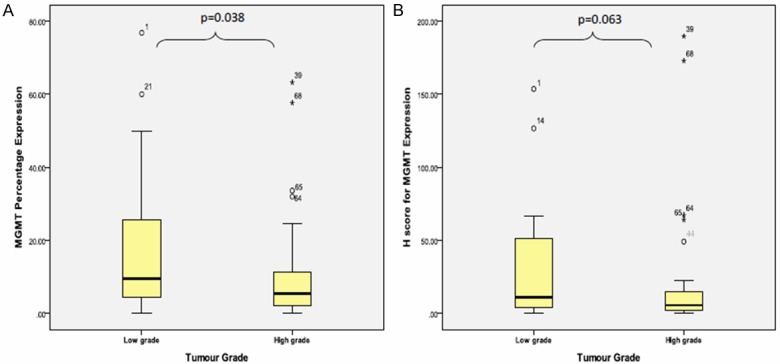
Box plot shows the MGMT (A) protein percentage expression and (B) H-score in different tumour grade (low vs. high grade) using Mann Whitney’ test.
The mean H-score for MGMT expression was 23.20 ± 39.14 with the minimum score was 0.00 and the maximum score was 189.60. In relation to WHO grade, the mean H-score for MGMT expression in WHO grade I to grade IV were reducing trend [28.36 ± 43.88, 28.08 ± 33.67, 26.00 ± 48.70 and 16.20 ± 35.61] but the differences were not statistically significant [GI/GII, p value=0.130; GII/GIII, p value=0.500; GIII/GIV, p value=0.086] (Figure 5B). Similarly, there was no statistically significant difference between mean H-score for MGMT in high grade [19.54 ± 40.21] and low grade [28.20 ± 37.71] tumour group [p value=0.130] even though low grade tumour showed higher mean H-score for MGMT than high grade tumour (Figure 6B).
Correlation between MGMT and DNMT1 in astrocytic tumour
Both MGMT and DNMT1 percentage expression were not normally distributed. The Spearman’s correlation test showed a moderate negative correlation between MGMT and DNMT percentage expression [r=-0.374, p value=0.001]. In subgroup analysis, the Spearman’s correlation test revealed a good negative correlation between these markers in high grade tumours [r=0.561, p value≤0.001] but poor negative correlation in low grade [r=-0.059, p value=0.758]. Among the high grade group, WHO grade IV tumour showed a good negative correlation [r=-0.599, p value=0.001] between these 2 markers. However, other grades showed poor to moderate correlation (Table 4).
Table 4.
Correlation between DNMT1 percentage expression and MGMT percentage expression in astrocytic tumour
| Percentage expression | ||
|---|---|---|
|
|
||
| Correlation coefficient (r)* | p value* | |
| All patients | -0.374 | 0.001 |
| Tumour grade | ||
| High grade | -0.561 | <0.001 |
| Low grade | -0.059 | 0.758 |
| WHO grade | ||
| Grade I | -0.456 | 0.117 |
| Grade II | 0.083 | 0.750 |
| Grade III | -0.490 | 0.075 |
| Grade IV | -0.599 | 0.001 |
Spearman’s correlation test.
The above correlation analyses were solely base on protein expression (in percentage) alone. Therefore, a same Spearman’s correlation tests were performed between H-score for MGMT and DNMT1 expression which include combination of both percentage expression and nuclear intensity component (the data were not normally distributed). The Spearman’s correlation test showed a moderate negative correlation between H-score for MGMT and DNMT1 expression [r=-0.335, p value=0.004]. In subgroup analysis, the Spearman’s correlation test revealed a good negative correlation between these markers in high grade tumours [r=-0.576, p value≤0.001] but a poor negative correlation in low grade tumours [r=-0.009, p value=0.962]. Among the high grade group, WHO grade IV tumour showed a good negative correlation [r=-0.510, p value=0.007] between these 2 markers. However, unlike negative moderate correlation between MGMT and DNMT1 percentage expression in WHO grade III, the tumour H-score for MGMT and DNMT1 expression in WHO grade III showed good negative correlation [r=-0.591, p value=0.026]. Among low grade tumours, WHO grade I tumours showed a moderate negative correlation [r=-0.434, p value=0.138] and WHO grade II tumours showed a poor positive correlation [r=0.213, p value=0.411] between H-score for MGMT and DNMT1 expression (Table 5).
Table 5.
Correlation between H-score for DNMT1 expression and H-score for MGMT expression in astrocytic tumour
| H-score | ||
|---|---|---|
|
|
||
| Correlation coefficient (r)* | p value* | |
| All patients | -0.335 | 0.004 |
| Tumour grade | ||
| High grade | -0.576 | <0.001 |
| Low grade | -0.009 | 0.962 |
| WHO grade | ||
| Grade I | -0.434 | 0.138 |
| Grade II | 0.213 | 0.411 |
| Grade III | -0.591 | 0.026 |
| Grade IV | -0.510 | 0.007 |
Spearman’s correlation test.
Discussion
DNMT1 and MGMT had been explored in many other cancer types and found to play an important role in tumour progression [22,23,27,31,32]. However, limited studies exist to demonstrate the mRNA expression of DNMT1 in glioblastoma and/or anaplastic astrocytoma [14,20,33]. In addition, data on the protein expression of DNMT in astrocytic tumour is still unavailable. To our concern, this is the first report of the immunoexpression study on DNMT1. Our study found that the prevalence of DNMT1 overexpression in astrocytic tumour was 74.6% when we used 10% as a cut-off point [27,28] and the prevalence of DNMT1 overexpression was increasing in trend from WHO grade I to grade IV [GI: 38.5%, GII: 64.7%, GIII: 78.6% and GIV: 96.7%]. The overexpression of DNMT1 was previously shown several other cancers including bladder, renal, liver, pancreas and stomach cancer [23,31,34].
The DNMT1 overexpression was associated with the advanced stage (stage III and IV) in laryngeal carcinoma, muscle-invasive bladder cancer and cervical carcinoma [22,27,28]. However, the association between DNMT1 protein expression and other clinicopathological indicators in astrocytic tumor are still unknown. Initially, our univariate analysis indicated that the overexpression of DNMT1 was significantly associated with patient’s age and tumour grade (Table 2). Unfortunately, the age variable was eliminated from the analysis since the variable’s correlation in univariate analysis was mainly contributed by histological grade. Our study demonstrated that the aberrant DNMT1 protein expression was statistically higher in astrocytic tumour with WHO grade III and IV (Figure 7), suggesting that the DNMT1 may play a role to support late progression of astrocytic tumour. Our finding is in agreement with Gomori et al that observed more DNMT1 hypermethylation in secondary glioblastomas compared to low-grade glioblastomas. In addition, DNMT1 overexpression was regulated by histone modification and it was up-regulated in high grade glioma as compared to normal brain tissue [33]. Since DNMT1 is typically expressed in S-phase of normal proliferative cell [3,22,33] and the fact that high-grade astrocytic tumors have a relatively high proliferative activity as evident by high index of PCNA (proliferating cell nuclear antigen) [35], we suggest a future study is need to be carried out to investigate the role of DNMT1 in mediating proliferation activity to support astrocytic tumour progression.
Figure 7.
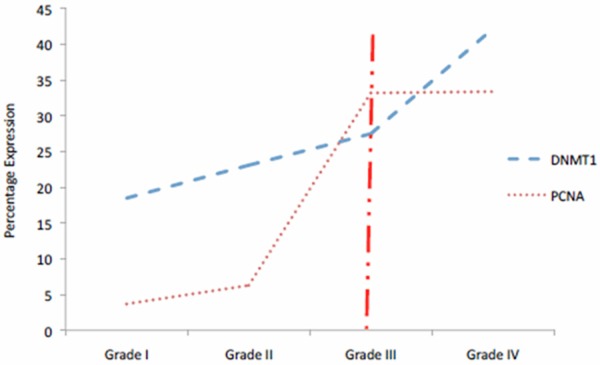
The comparison between DNMT1 immunoexpression in our study and PCNA immunoexpression by M Sawada and colleague [22]. The discordant of expression after WHO grade III (vertical line) postulates the possibility of DNMT1 aberrant expression in astrocytic tumour especially in high grade tumour.
In contrast to DNMT1, our study found that the immunoexpression of MGMT decreases in high-grade astrocytic tumors, suggesting the role of MGMT at an early development of astrocytic tumors. This is in agreement with the finding from Gomori’s study that demonstrated higher distribution of MGMT hypermethylation in low-grade glioblastomas. The MGMT expression was shown as a good prognostic indicator since the expression of this marker was associated with a longer progression-free survival in glioblastomas patients (Felsberg et al., 2011). In addition, MGMT expression predicts treatment response in glioma even though the outcome is variable [21,25,36-42].
Our study noted a significant inverse correlation between the expression of DNMT1 and MGMT in high-grade astrocytic tumors, suggesting that the DNMT1 and MGMT may play a different role during astrocytic tumour progression. We postulated that DNMT1 may partly involved in MGMT regulation i.e. MGMT promoter hypermethylation during tumour development. In glioblastomas, MGMT has been shown to be important at the early phase of tumour progression and DMNT1 plays a role at late stage of tumour progression [43].
In conclusion, the protein expression of DNMT1 and MGMT were different between low-grade to high-grade astrocytic tumors. However, both markers are important to indicate the mechanism occurs during tumourigenesis. Understanding on how DNMT1 and MGMT influence to each other may help to elucidate a strategy to stop tumour aggressiveness.
Acknowledgements
This research was partly supported by a Short-term Grant 304/PPSP/61313011 from Universiti Sains Malaysia.
Disclosure of conflict of interest
None.
References
- 1.Robertson KD. DNA methylation, methyltransferases, and cancer. Oncogene. 2001;20:3139–3155. doi: 10.1038/sj.onc.1204341. [DOI] [PubMed] [Google Scholar]
- 2.Santini V, Kantarjian HM, Issa JP. Changes in DNA methylation in neoplasia: pathophysiology and therapeutic implications. Ann Intern Med. 2001;134:573–586. doi: 10.7326/0003-4819-134-7-200104030-00011. [DOI] [PubMed] [Google Scholar]
- 3.Denis H, Ndlovu MN, Fuks F. Regulation of mammalian DNA methyltransferases: a route to new mechanisms. EMBO Rep. 2011;12:647–656. doi: 10.1038/embor.2011.110. [DOI] [PMC free article] [PubMed] [Google Scholar]
- 4.Herman JG, Baylin SB. Gene Silencing in Cancer in Association with Promoter Hypermethylation. N Engl J Med. 2003;349:2042–2054. doi: 10.1056/NEJMra023075. [DOI] [PubMed] [Google Scholar]
- 5.Feinberg AP, Tycko B. The history of cancer epigenetics. Nat Rev Cancer. 2004;4:143–153. doi: 10.1038/nrc1279. [DOI] [PubMed] [Google Scholar]
- 6.Zingg JM, Jones PA. Genetic and epigenetic aspects of DNA methylation on genome expression, evolution, mutation and carcinogenesis. Carcinogenesis. 1997;18:869–882. doi: 10.1093/carcin/18.5.869. [DOI] [PubMed] [Google Scholar]
- 7.Bestor TH. The DNA methyltransferases of mammals. Hum Mol Genet. 2000;9:2395–2402. doi: 10.1093/hmg/9.16.2395. [DOI] [PubMed] [Google Scholar]
- 8.Momparler RL, Bovenzi V. DNA methylation and cancer. J Cell Physiol. 2000;183:145–154. doi: 10.1002/(SICI)1097-4652(200005)183:2<145::AID-JCP1>3.0.CO;2-V. [DOI] [PubMed] [Google Scholar]
- 9.Wood RD, Mitchell M, Sgouros J, Lindahl T. Human DNA repair genes. Science. 2001;291:1284. doi: 10.1126/science.1056154. [DOI] [PubMed] [Google Scholar]
- 10.Wood RD. DNA repair in eukaryotes. Annu Rev Biochem. 1996;65:135–167. doi: 10.1146/annurev.bi.65.070196.001031. [DOI] [PubMed] [Google Scholar]
- 11.Sadones J, Michotte A, Veld P, Chaskis C, Sciot R, Menten J, Joossens E, Strauven T, D’Hondt L, Sartenaer D. MGMT promoter hypermethylation correlates with a survival benefit from temozolomide in patients with recurrent anaplastic astrocytoma but not glioblastoma. Eur J Cancer. 2009;45:146–153. doi: 10.1016/j.ejca.2008.09.002. [DOI] [PubMed] [Google Scholar]
- 12.Lorente A, Mueller W, Urdangarin E, La¡zcoz P, Lass U, Von Deimling A, Castresana JS. RASSF1A, BLU, NORE1A, PTEN and MGMT expression and promoter methylation in gliomas and glioma cell lines and evidence of deregulated expression of de novo DNMTs. Brain Pathol. 2009;19:279–292. doi: 10.1111/j.1750-3639.2008.00185.x. [DOI] [PMC free article] [PubMed] [Google Scholar]
- 13.Belanich M, Pastor M, Randall T, Guerra D, Kibitel J, Alas L, Li B, Citron M, Wasserman P, White A. Retrospective study of the correlation between the DNA repair protein alkyltransferase and survival of brain tumor patients treated with carmustine. Cancer Res. 1996;56:783. [PubMed] [Google Scholar]
- 14.Fanelli M, Caprodossi S, Ricci-Vitiani L, Porcellini A, Tomassoni-Ardori F, Amatori S, Andreoni F, Magnani M, De Maria R, Santoni A. Loss of pericentromeric DNA methylation pattern in human glioblastoma is associated with altered DNA methyltransferases expression and involves the stem cell compartment. Oncogene. 2007;27:358–365. doi: 10.1038/sj.onc.1210642. [DOI] [PubMed] [Google Scholar]
- 15.Louis DN, Ohgaki H, Wiestler OD, Cavenee WK, Burger PC, Jouvet A, Scheithauer BW, Kleihues P. The 2007 WHO classification of tumours of the central nervous system. Acta Neuropathol. 2007;114:97–109. doi: 10.1007/s00401-007-0243-4. [DOI] [PMC free article] [PubMed] [Google Scholar]
- 16.Esteller M. Cancer epigenomics: DNA methylomes and histone-modification maps. Nat Rev Genet. 2007;8:286–298. doi: 10.1038/nrg2005. [DOI] [PubMed] [Google Scholar]
- 17.Christmann M, Nagel G, Horn S, Krahn U, Wiewrodt D, Sommer C, Kaina B. MGMT activity, promoter methylation and immunohistochemistry of pretreatment and recurrent malignant gliomas: a comparative study on astrocytoma and glioblastoma. Int J Cancer. 2010;127:2106–2118. doi: 10.1002/ijc.25229. [DOI] [PubMed] [Google Scholar]
- 18.Hegi ME, Diserens AC, Gorlia T, Hamou MF, De Tribolet N, Weller M, Kros JM, Hainfellner JA, Mason W, Mariani L. MGMT gene silencing and benefit from temozolomide in glioblastoma. N Engl J Med. 2005;352:997–1003. doi: 10.1056/NEJMoa043331. [DOI] [PubMed] [Google Scholar]
- 19.Stupp R, Hegi ME, Mason WP, van den Bent MJ, Taphoorn MJB, Janzer RC, Ludwin SK, Allgeier A, Fisher B, Belanger K. Effects of radiotherapy with concomitant and adjuvant temozolomide versus radiotherapy alone on survival in glioblastoma in a randomised phase III study: 5-year analysis of the EORTC-NCIC trial. Lancet Oncol. 2009;10:459–466. doi: 10.1016/S1470-2045(09)70025-7. [DOI] [PubMed] [Google Scholar]
- 20.Kreth S, Thon N, Eigenbrod S, Lutz J, Ledderose C, Egensperger R, Tonn JC, Kretzschmar HA, Hinske LC, Kreth FW. O6-Methylguanine-DNA Methyltransferase (MGMT) mRNA Expression Predicts Outcome in Malignant Glioma Independent of MGMT Promoter Methylation. PLoS One. 2011;6:e17156. doi: 10.1371/journal.pone.0017156. [DOI] [PMC free article] [PubMed] [Google Scholar]
- 21.Capper D, Mittelbronn M, Meyermann R, Schittenhelm J. Pitfalls in the assessment of MGMT expression and in its correlation with survival in diffuse astrocytomas: proposal of a feasible immunohistochemical approach. Acta Neuropathol. 2008;115:249–259. doi: 10.1007/s00401-007-0310-x. [DOI] [PubMed] [Google Scholar]
- 22.Sawada M, Kanai Y, Arai E, Ushijima S, Ojima H, Hirohashi S. Increased expression of DNA methyltransferase 1 (DNMT1) protein in uterine cervix squamous cell carcinoma and its precursor lesions. Cancer Lett. 2007;251:211–219. doi: 10.1016/j.canlet.2006.11.023. [DOI] [PubMed] [Google Scholar]
- 23.Arai E, Kanai Y, Ushijima S, Fujimoto H, Mukai K, Hirohashi S. Regional DNA hypermethylation and DNA methyltransferase (DNMT) 1 protein overexpression in both renal tumors and corresponding nontumourous renal tissues. Int J Cancer. 2006;119:288–296. doi: 10.1002/ijc.21807. [DOI] [PubMed] [Google Scholar]
- 24.Zhu YM, Huang Q, Lin J, Hu Y, Chen J, Lai MD. Expression of human DNA methyltransferase 1 in colorectal cancer tissues and their corresponding distant normal tissues. Int J Colorectal Dis. 2007;22:661–666. doi: 10.1007/s00384-006-0224-4. [DOI] [PubMed] [Google Scholar]
- 25.Christmann M, Nagel G, Horn S, Krahn U, Wiewrodt D, Sommer C, Kaina B. MGMT Activity, Promoter Methylation and Immunohistochemistry of Pretreatment and Recurrent Malignant Glioma: a Comparative Study on Astrocytoma and Glioblastoma. Int J Cancer. 2010;127:2106–18. doi: 10.1002/ijc.25229. [DOI] [PubMed] [Google Scholar]
- 26.Neto JC, Carvalho K, Olivieri E, Carraro D, Cunha I, Vassallo J, Kagohara L, Soares F, Rocha R. Evaluation of O6-methylguanine-DNA methyltransferase by immunohistochemistry: Best clinical and research practices. Pathol-Res Pract. 2011;207:492–497. doi: 10.1016/j.prp.2011.06.003. [DOI] [PubMed] [Google Scholar]
- 27.Wang J, Xu Y, Li J, Sun X, Wang LP, Ji WY. The tobacco-specific carcinogen NNK induces DNA methyltransferase 1 accumulation in Laryngeal carcinoma. Oral Oncol. 2012;48:541–6. doi: 10.1016/j.oraloncology.2012.01.007. [DOI] [PubMed] [Google Scholar]
- 28.Wu CT, Wu CF, Lu CH, Lin CC, Chen WC, Lin PY, Chen MF. Expression and function role of DNA methyltransferase 1 in human bladder cancer. Cancer. 2011;117:5221–5233. doi: 10.1002/cncr.26150. [DOI] [PubMed] [Google Scholar]
- 29.Ishibashi H, Suzuki T, Suzuki S, Moriya T, Kaneko C, Takizawa T, Sunamori M, Handa M, Kondo T, Sasano H. Sex steroid hormone receptors in human thymoma. J Clin Endocrinol Metab. 2003;88:2309–2317. doi: 10.1210/jc.2002-021353. [DOI] [PubMed] [Google Scholar]
- 30.Bachok N. Multivariate Analyses Regression. 2011 Universiti Sains Malaysia, Farzwan Enterprise, Kelantan, Malaysia. [Google Scholar]
- 31.Li A, Omura N, Hong SM, Goggins M. Pancreatic cancer DNMT1 expression and sensitivity to DNMT1 inhibitors. Cancer Biol & Ther. 2010;9:321–329. doi: 10.4161/cbt.9.4.10750. [DOI] [PMC free article] [PubMed] [Google Scholar]
- 32.Omisanjo OA, Biermann K, Hartmann S, Heukamp LC, Sonnack V, Hild A, Brehm R, Bergmann M, Weidner W, Steger K. DNMT1 and HDAC1 gene expression in impaired spermatogenesis and testicular cancer. Histochem Cell Biol. 2007;127:175–181. doi: 10.1007/s00418-006-0234-x. [DOI] [PubMed] [Google Scholar]
- 33.Rajendran G, Shanmuganandam K, Bendre A, Mujumdar D, Goel A, Shiras A. Epigenetic regulation of DNA methyltransferases: DNMT1 and DNMT3B in gliomas. J Neurooncol. 2011;104:483–494. doi: 10.1007/s11060-010-0520-2. [DOI] [PubMed] [Google Scholar]
- 34.Saito Y, Kanai Y, Nakagawa T, Sakamoto M, Saito H, Ishii H, Hirohashi S. Increased protein expression of DNA methyltransferase (DNMT) 1 is significantly correlated with the malignant potential and poor prognosis of human hepatocellular carcinomas. Int J Cancer. 2003;105:527–532. doi: 10.1002/ijc.11127. [DOI] [PubMed] [Google Scholar]
- 35.Kordek R, Biernat W, Alwasiak J, Liberski P. Proliferating cell nuclear antigen (PCNA) and Ki-67 immunopositivity in human astrocytic tumours. Acta Neurochir. 1996;138:509–513. doi: 10.1007/BF01411168. [DOI] [PubMed] [Google Scholar]
- 36.Karayan-Tapon L, Quillien V, Guilhot J, Wager M, Fromont G, Saikali S, Etcheverry A, Hamlat A, Loussouarn D, Campion L. Prognostic value of O 6-methylguanine-DNA methyltransferase status in glioblastoma patients, assessed by five different methods. J Neurooncol. 2010;97:311–322. doi: 10.1007/s11060-009-0031-1. [DOI] [PubMed] [Google Scholar]
- 37.Rodriguez FJ, Thibodeau SN, Jenkins RB, Schowalter KV, Caron BL, O’Neill BP, James CD, Passe S, Slezak J, Giannini C. MGMT immunohistochemical expression and promoter methylation in human glioblastoma. Appl Immunohistochem Mol Morphol. 2008;16:59–65. doi: 10.1097/PAI.0b013e31802fac2f. [DOI] [PubMed] [Google Scholar]
- 38.Chinot OL, Barrie M, Fuentes S, Eudes N, Lancelot S, Metellus P, Muracciole X, Braguer D, Ouafik LH, Martin PM. Correlation between O6-methylguanine-DNA methyltransferase and survival in inoperable newly diagnosed glioblastoma patients treated with neoadjuvant temozolomide. J. Clin. Oncol. 2007;25:1470–1475. doi: 10.1200/JCO.2006.07.4807. [DOI] [PubMed] [Google Scholar]
- 39.Mineura K, Izumi I, watanabe K, Kowada M. Influence of O6-methylguanine methyltransferase activity on chloroethylnitrosourea chemotherapy in brain tumors. Int J Cancer. 2006;55:76–81. doi: 10.1002/ijc.2910550115. [DOI] [PubMed] [Google Scholar]
- 40.Nakasu S, Fukami T, Baba K, Matsuda M. Immunohistochemical study for O6-methylguanine-DNA methyltransferase in the non-neoplastic and neoplastic components of gliomas. J Neurooncol. 2004;70:333–340. doi: 10.1007/s11060-004-9170-6. [DOI] [PubMed] [Google Scholar]
- 41.Grasbon-Frodl EM, Kreth FW, Ruiter M, Schnell O, Bise K, Felsberg J, Reifenberger G, Tonn JC, Kretzschmar HA. Intratumoral homogeneity of MGMT promoter hypermethylation as demonstrated in serial stereotactic specimens from anaplastic astrocytomas and glioblastomas. Int J Cancer. 2007;121:2458–2464. doi: 10.1002/ijc.23020. [DOI] [PubMed] [Google Scholar]
- 42.Preusser M, Charles Janzer R, Felsberg J, Reifenberger G, Hamou MF, Diserens AC, Stupp R, Gorlia T, Marosi C, Heinzl H. Anti-O6-Methylguanine-Methyltransferase (MGMT) Immunohistochemistry in Glioblastoma Multiforme: Observer Variability and Lack of Association with Patient Survival Impede Its Use as Clinical Biomarker*. Brain Pathol. 2008;18:520–532. doi: 10.1111/j.1750-3639.2008.00153.x. [DOI] [PMC free article] [PubMed] [Google Scholar]
- 43.Gomori E, Pal J, Kovacs B, Doczi T. Concurrent hypermethylation of DNMT1, MGMT and EGFR genes in progression of gliomas. Diagn Pathol. 2012;7:8. doi: 10.1186/1746-1596-7-8. [DOI] [PMC free article] [PubMed] [Google Scholar]


