Abstract
To study the dynamics of stress fiber components in cultured fibroblasts, we expressed α-actinin and the myosin II regulatory myosin light chain (MLC) as fusion proteins with green fluorescent protein. Myosin activation was stimulated by treatment with calyculin A, a serine/threonine phosphatase inhibitor that elevates MLC phosphorylation, or with LPA, another agent that ultimately stimulates phosphorylation of MLC via a RhoA-mediated pathway. The resulting contraction caused stress fiber shortening and allowed observation of changes in the spacing of stress fiber components. We have observed that stress fibers, unlike muscle myofibrils, do not contract uniformly along their lengths. Although peripheral regions shortened, more central regions stretched. We detected higher levels of MLC and phosphorylated MLC in the peripheral region of stress fibers. Fluorescence recovery after photobleaching revealed more rapid exchange of myosin and α-actinin in the middle of stress fibers, compared with the periphery. Surprisingly, the widths of the myosin and α-actinin bands in stress fibers also varied in different regions. In the periphery, the banding patterns for both proteins were shorter, whereas in central regions, where stretching occurred, the bands were wider.
INTRODUCTION
Stress fibers are prominent bundles of actin filaments seen in many cells in culture as well as in cells in situ that are under shear stress conditions (Gabbiani et al., 1975; White et al., 1983; Wong et al., 1983) or involved in wound healing (Gabbiani et al., 1972). Stress fibers terminate in focal adhesions, transmembrane complexes that mediate cell adhesion to the underlying substrate (Burridge et al., 1988; Yamada and Geiger, 1997; Peterson and Burridge, 2001). Like muscle myofibrils, stress fibers are composed of actin filaments (Lazarides and Weber, 1974; Herman and Pollard, 1979), myosin II (Weber and Groeschel-Stewart, 1974; Fujiwara and Pollard, 1976), and various actin-binding proteins, including α-actinin, a prominent Z-line component in muscle sarcomeres (Lazarides and Burridge, 1975). Many stress fiber components display a periodic, “sarcomeric” organization, although they are less ordered than myofibrils at the ultrastructural level (Gordon, 1978; Byers et al., 1984; Sanger et al., 1986). Nevertheless, their organization suggests a contractile function, and isolated stress fibers or those in permeabilized cells will shorten in response to Mg2+ ATP (Isenberg et al., 1976; Kreis and Birchmeier, 1980; Katoh et al., 1998). Stress fiber shortening in living cells has been observed in quiescent, serum-starved cells stimulated with serum or thrombin (Giuliano and Taylor, 1990; Giuliano et al., 1992), although under most physiological conditions, shortening is rarely seen. This has led to the idea that normally stress fibers are under isometric tension and that shortening is opposed by strong adhesion to the underlying rigid substrate mediated by focal adhesions (Burridge, 1981).
We have used expression of green fluorescent protein (GFP)-tagged α-actinin or GFP-myosin light chain (GFPMLC), to follow the behavior of stress fibers during stimulation of increased actomyosin contractility by treatment with the serine/threonine phosphatase inhibitor, calyculin A or LPA. This has allowed us to observe changes along entire stress fibers as well as in individual sarcomeric units demarcated by the GFP-α-actinin. We have found that whereas some sarcomeres shorten during stress fiber contraction, unexpectedly, others in the same stress fiber elongate. In addition, we observed that both the α-actinin and myosin banding patterns stretch in some stress fiber regions upon stimulation of contractility. These observations lead us to elaborate on earlier models of stress fiber and nonmuscle “sarcomeric” organization (Sanger et al., 1983, 1984a, 1984b, 1986).
MATERIALS AND METHODS
Cells and Cell Culture
Swiss 3T3 fibroblasts stably expressing GFP-α-actinin were generated by Edlund and colleagues and are characterized elsewhere (Edlund et al., 2001). GFP-α-actinin-expressing Swiss cells were maintained in DMEM (GIBCO BRL, Gaithersburg, MD) supplemented with 10% fetal bovine serum (FBS) plus antibiotics (GIBCO BRL) and geneticin selection media. NIH 3T3, Swiss 3T3, and CCL146 gerbil fibroma cells (all ATCC) were maintained in DMEM media supplemented with 10% bovine calf serum (BCS) plus antibiotics (all GIBCO BRL as above). All cells were maintained at 37°C at 10% CO2.
GFP Chimeras
Construction of the GFP-α-actinin chimera is described elsewhere (Edlund et al., 2001). The GFP-MLC chimera was constructed using Genestorm pcDNA3.1/GS (Invitrogen, Carlsbad, CA) containing human myosin II regulatory light chain (J02854) coding sequence as a template for PCR. New restriction sites for XhoI and BamHI were added to the light-chain sequence using the primers, 5′-ttttctcgagggatgtccagcaagcgggcc-3′ and 3′-ttcctatttgtgctgatccctaggccgg-5′, respectively. PCR was performed using standard protocols and a GeneAmp 9700 thermocycler (Applied Biosystems, Foster City, CA). After PCR, the MLC sequence was cloned into the EGFP-C1 vector (Clontech, Palo Alto, CA) using standard protocols. Transient transfections were performed using Lipofectamine Plus and protocols from Invitrogen (Carlsbad, CA). Cells used for transfections were either gerbil fibroma cells or NIH 3T3 fibroblasts (ATCC) at 50-60% confluency. Both cell types were grown in DMEM supplemented with 10% BCS plus antibiotics (all from GIBCO BRL).
Antibodies and Fluorescent Tags
A polyclonal antibody specific for phosphorylated Ser19 of MLC was the generous gift of Dr. Fumio Matsumura (Rutgers University). Dr. Alexey Belkin (American Red Cross) provided the antivinculin mAb. Antibody specific for α-actinin (pAb) was generated previously in this laboratory. Antimyosin, anti-MLC, and antiactin were purchased from Sigma (St. Louis, MO). Fluorescently conjugated secondary antibodies, as well as fluorescently tagged phalloidin, were purchased from Molecular Probes (Eugene, OR).
Time-lapse Microscopy
Swiss 3T3 cells expressing GFP-α-actinin were treated with 5 nM calyculin A (Biomol, Plymouth Meeting, PA), 2 μM LPA or vehicle alone in DMEM culture media buffered with 20 mM HEPES. Fluorescence time-lapse microscopy was performed at room temperature using a Zeiss Axiophot microscope with 100x or 63x oil objective, MicroMAX 5 cooled CCD camera (Princeton Instruments, Princeton, NJ) and MetaMorph Imaging software (Universal Imaging, West Chester, PA). Periodicity or center-to-center spacing was measured using the software's linear measuring tool. Peripheral sarcomeric units were classified as those within 5-7 μm of a focal adhesion, whereas central sarcomeres were considered within 10-μm segment of the midpoint of the stress fiber. The same sarcomeric units were measured in this way in each plane of a time-lapse series of images. Data handling and statistical analyses were performed using Microsoft Excel (Seattle, WA), and Instat/Prism software form Graphpad Software (San Diego, CA). Nonlinear regression analysis and curve fitting were performed using the built-in regression and polynomial curve-fit function within Prism/Graphpad Software. Gerbil fibroma cells transiently transfected with GFP-MLC were used to measure GFP-MLC periodicity and analyzed using the same methods as described for GFP-α-actinin. Measurements of focal adhesion area over time were also performed using the same time-lapse video of GFP-α-actinin. In addition, interference reflection microscopy (IRM) time-lapse video was used to confirm focal adhesion area changes after stimulation with calyculin A. IRM images were taken using a 100× 1.3 NA objective and filter cube with two perpendicularly adjusted polarizers on an Olympus IX81 microscope. The epifluorescence light intensity was attenuated with a 50% transmission ND filter in the epifluorescence light path. IRM images were taken using a Hamamatsu 4880 CCD cooled camera.
Immunofluorescence
Cells were fixed in 3.7% formaldehyde in PBS and permeabilized in 0.5% Triton X-100 in TBS before staining. For localization and quantitation of MLC and phospho-S19-MLC before and after stimulation, gerbil fibroma cells were fixed, and the dorsal membrane removed according to a method modified from Katoh et al. (1998, 2001). Briefly, cells were gently rocked for 30 min at 4°C in 2.5 mM triethanolamine (Sigma) in PBS. Dorsal surfaces were sheared by gentle rocking (4°C) in 0.05% Triton X-100 in PBS. These cells were stained for 1 h at room temperature in humidified chambers with the appropriate primary antibody, followed by fluorescently tagged secondary antibodies (Molecular Probes) under the same conditions. Fluorescent images of these cells were generated as described above for time-lapse imaging.
Fluorescence Quantification and Analyses
Fluorescence intensities were measured using the specialized measurement functions incorporated within MetaMorph imaging software. Fluorescence measurements were performed according to two different procedures depending on the particular experiment. One set of fluorescence intensity measurements quantified the average fluorescence within a standard 50-μm2 circular region. By using a standard 50-μm2 circular region, fluorescence intensities could be compared between regions of the same set of stress fibers and between cells of different treatments. To compare paired data from central and peripheral stress fiber regions, ratios of central fluorescence to peripheral fluorescence were calculated. Fluorescence intensities were also quantified using line scan measurements along a 5-pixel-wide, 5-μm-long line segment drawn along peripheral or central regions of the same stress fibers. Linescan data were graphed by aligning the initial maxima and minima and generating mean fluorescence with regression analysis.
Fluorescence banding and periodicity for both MLC and α-actinin were further analyzed using Fourier analysis and autocorrelation. Power spectra of stress fiber images were calculated to illustrate the frequencies of the pronounced details in the original samples (designated as distinct white regions within the spectrum). Image components of high frequency (shorter periodicity) are represented as peaks toward the periphery of the Fourier spectrum, whereas lower frequency subunits (longer periods) are situated closer to the center. Measuring and interpreting power spectra can be sometimes difficult, especially under circumstances where the details being compared are only slightly different in frequency and/or size. Consequently we also used image autocorrelation analysis to estimate the sizes of structural units within the images. The autocorrelation routine calculates the correlation between a particular density value in the image to other density variations that emphasize the dominant features of the original image (Russ, 1999). The width and decay of the central peak within an autocorrelation map is used to determine the correlation length. 1024 × 1024-pixel sample regions located near the cell center or periphery in fluorescence images of MLC and α-actinin were selected for analysis. Fast Fourier transforms, power spectra, and autocorrelation functions were computed using Gatan's Digital Micrograph image processing software (v. 3.4, Gatan Inc., Pleasanton, CA).
Stress Fiber Induction
Swiss 3T3 cells were starved in serum-free media for 16 h in order to lose organization of stress fibers and focal adhesions. Immunolabelling was performed on these cells as above. To assess calyculin stimulation of contractility, Swiss 3T3 cells were plated on flexible silicone-rubber substrates as described in Chrzanowska-Wodnicka and Burridge (1996).
Immunoblotting
NIH 3T3 cells were plated in 100-mm plastic tissue culture dishes and grown just to confluency. Cells were then treated with 10 nM calyculin A for 5 min, lysed in sample buffer, and collected with a 27-gauge needle to shear DNA. Whole cell lysates were then run on 15% SDS-PAGE and transferred to PVDF membranes (Millipore, Billerica, MA). Membranes were blocked in 5% nonfat dry milk in TBST and probed with a polyclonal antibody specific for phospho-MLC, followed by goat anti-rabbit HRP-conjugated secondary antibody (Sigma). Enhanced chemiluminescence (ECL; Amersham, Piscataway, NJ) was used to develop and visualize labeled protein. Membranes were then stripped of antibody and stained with Coomassie blue to compare lanes for equal loading of protein or reprobed with antiactin antibody for the same purpose.
Fluorescence Recovery After Photobleaching
Gerbil fibroma cells or Swiss 3T3 fibroblasts expressing GFP-MLC or GFP-α-actinin, respectively, were plated in glass-bottomed 35-mm tissue culture dishes (no. 1.5, MatTek, Ashland, MA). When at 50-60% confluency, cells were transfected with GFP-MLC. Swiss 3T3 fibroblasts stably expressing GFP-α-actinin were used at 40-50% confluency. For fluorescence recovery after photobleaching (FRAP) measurements, cells were maintained in 5% CO2 at 37°C in a heated chamber (Harvard Apparatus, Holliston, MA) and mounted on the microscope stage (Axiovert, Carl Zeiss, Jena, Germany). Photobleaching was achieved with a Spectra Physics 164 argon laser (Spectra-Physics Laser, Mountain View, CA) beam at 100 mW (∼8.33 mW at the level of the cell) for 100 msec, focused using a 100× Phase 3 Neofluar objective mounted on a Zeiss Axiovert 10 inverted microscope with MetaMorph Imaging software.
Data analysis was performed using the statistical software from GraphPad/Instat. These data were first normalized to randomly sampled intensity measurements at nonbleached regions within the cell at the appropriate time point and then compared as a ratio to average intensity of the same area before photobleaching according to the equation: It/Rt× R0/I0, where It is average intensity of bleached area at time t, Rt is the average intensity of the cell at time t, R0 is the average intensity of the cell before photobleaching, and I0 is the average intensity of the bleached area before photobleaching. For comparison of recovery curves between the periphery and central regions, data were transformed by taking the natural log for each value (generated as described above) and then performing linear regression analysis followed by a two-tailed, unpaired t test.
To determine fluorescence recovery due to passive diffusion and diffusion coefficients, some FRAP measurements were performed on a custom-built system that used an argon laser light (Spectra Physics) as a light source for spot excitation and photobleaching. The specimen fluorescence and fluorescence recovery after photobleaching were detected with a photomultiplier (EMI) mounted on the Leitz microscope. We used a 40× fluor oil objective to focus a laser beam to a 2.2-μm spot.
RESULTS
Calyculin A Stimulates Contractility in Well-spread Cells
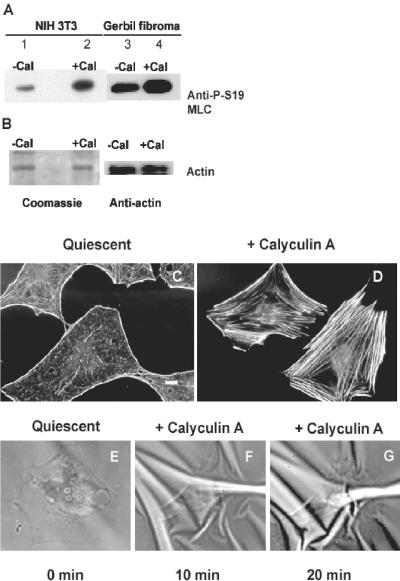
Contractility in nonmuscle cells is dependent on the interaction of myosin II with F-actin and is regulated by phosphorylation of the regulatory myosin light chain (MLC) (Sellers, 1991; Tan et al., 1992). We manipulated MLC phosphorylation by treating cells with calyculin A, a serine/threonine phosphatase inhibitor that enhances MLC phosphorylation on Ser19 (Chartier et al., 1991). Calyculin, 5 nM, stimulated an increase of phospho-Ser19-MLC in NIH 3T3 fibroblasts or gerbil fibroma cells (Figure 1, A and B). Addition of 5 nM calyculin induced the formation of stress fibers in quiescent, serum-starved Swiss 3T3 cells (Figure 1, C and D). Concurrent with stress fiber formation, increased cell contractility developed, as shown by increased wrinkling of flexible rubber substrata on which the cells were plated (Figure 1, E-G). These observations are consistent with actomyosin-based contractility contributing to the assembly of stress fibers (Chrzanowska-Wodnicka and Burridge, 1996).
Figure 1.
Calyculin A, 5 nM, treatment induces stress fiber formation and increased wrinkling of flexible rubber substrates in serum-starved, quiescent Swiss 3T3 fibroblasts. (A) NIH 3T3 fibroblasts (lanes 1 and 2) or gerbil fibroma cells (lanes 3 and 4) were treated with vehicle alone (lanes 1 and 3) or with calyculin A (lanes 2 and 4) and show increased phosphorylation on Ser19 of MLCs by immunoblotting of whole cell lystaes with an antibody specific for P-Ser19 on MLC. (B) After immunoblotting with the phosphospecific antibody, membranes were stripped and either stained with Coomassie blue or reprobed with antiactin antibody to confirm equal protein loading. (C) Quiescent cells have lost stress fibers as shown by fluorescent labeling with FITC-conjugated phalloidin. (D) Ten mintes after addition of calyculin A, stress fibers have reformed. (E-G) Time series images of a single cell shown before stimulation (E), and at 10 (F) and 20 min (G) after stimulation with 5 nM calyculin, which induces wrinkling in the rubber substrate underlying the cell. Bar, 10 μm.
Calyculin A treatment induced cells in the presence of serum to contract. The time course of cell contraction was dose dependent and varied among cell types. Calyculin A concentrations of 5 nM, or less, induced cell contraction over longer than 30 min. These effects of calyculin A were reversible because Swiss 3T3 cells exposed to 5 nM calyculin A for 20 min respread within 10-20 min after calyculin was washed out. Reversible effects in 3T3 cells after exposure of up to 100 nM calyculin A have also previously been reported (Chartier et al., 1991; Hirano et al., 1992).
Stress Fibers in Contracting Cells Exhibit Simultaneous Stretching and Contraction in Different Regions
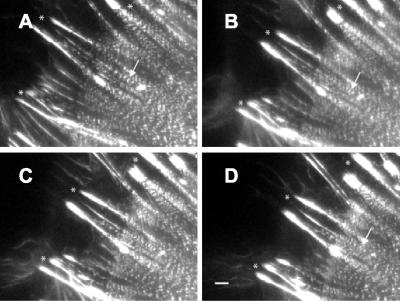
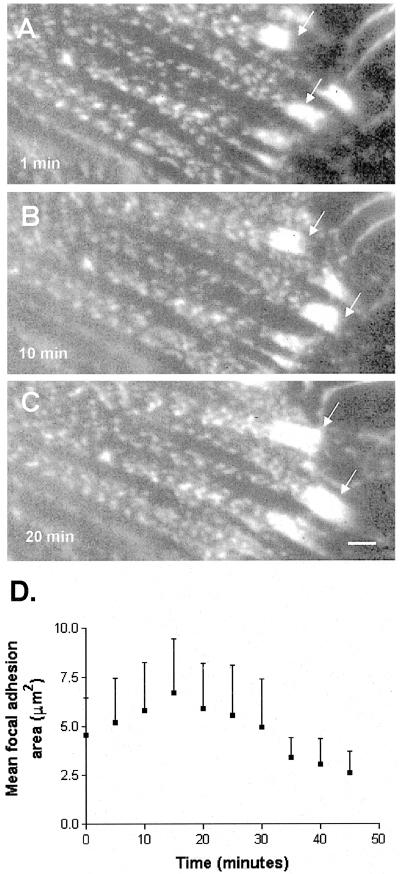
The incorporation of GFP-α-actinin into stress fibers and focal adhesions allowed us to observe both structures during cell contraction induced by treatment with 5 nM calyculin A. In unstimulated well-spread cells, we observed little movement of focal adhesions >40-min periods of observation. Similarly, we did not detect changes over time in the periodicity of GFP-α-actinin along stress fibers in these cells. When we stimulated contractility by treatment with 5 nM calyculin A, stress fibers shortened (∼16% in 30-40 min), and we observed many focal adhesions moved centripetally (Figure 2). In addition, mean focal adhesion area increased by nearly 50% during the first 15-18 min after addition of calyculin A (N = 14, 5 cells; Figure 3), and these then declined over the next 20-25 min (Figure 3D). In some cases, focal adhesions were observed to totally disappear. Time-lapse IRM imaging of gerbil fibroma cells confirmed that mean focal adhesion area increased during the first 5-15 min after stimulation with calyculin A (our unpublished results).
Figure 2.
Stimulation of contractility changes stress fibers and focal adhesions. (A-D) Time-lapse images of Swiss 3T3 cells expressing GFP-α-actinin captured at 0 min, and at 10, 15, and 20 min after addition of 5 nM calyculin A show that GFP-α-actinin bands along stress fibers move closer together (arrows). Contraction of stress fibers and centripetal movement of focal adhesions (marked by asterisks, *) can also be observed in movement of both structures from left (cell periphery) to right (toward cell center) in successive time-lapse images. Bar, 2 μm.
Figure 3.
Focal adhesion area increases in response to increased contraction. (A-C) Time-lapse image series showing growth of focal adhesions marked by GFP-α-actinin expressed in Swiss 3T3 cells treated with 5 nM calyculin A. (D) Graph of focal adhesion area following stimulation with 5 nM calyculin.
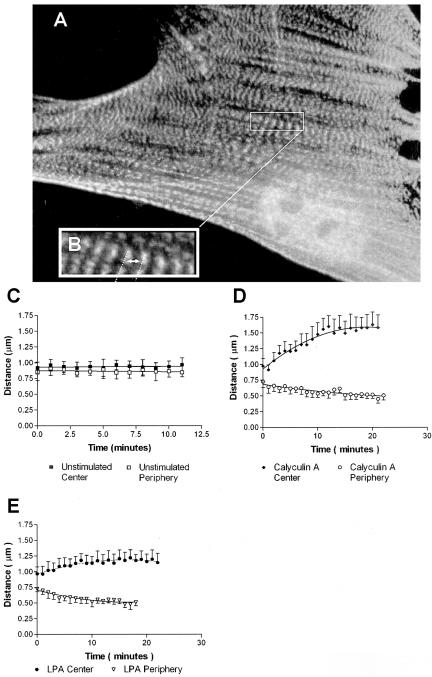
Initial observation of the peripheral regions of stress fibers indicated that the bands of GFP-α-actinin fluorescence moved closer together as the stress fibers shortened (Figure 2, arrows). However, the behavior of the sarcomeric units differed along the length of the stress fibers; sarcomeres in the middle of the cell often appeared to increase in length as the overall length of the stress fibers decreased. To analyze this phenomenon, we categorized sarcomeres according to their position along the stress fiber as being either peripheral (within 5-7 μm of a focal adhesion) or central (within a 10-μm segment either side of the midpoint; Figure 4). Distances between fluorescent bands of GFP-α-actinin (midline to midline or center-to-center spacing; Figure 4B) were measured after exposure to control media or to media plus 5 nM calyculin A for 30-40 min. Only longitudinal stress fibers that passed near the ventral surface of the cell either beneath the nucleus or beside the nuclear region were used. Although the sarcomeric units along stress fibers of unstimulated cells did not change (n = 30, 7 cells; Figure 4C), the sarcomeres in the peripheral regions of cells treated with calyculin shortened by 30-40% (p < 0.0001, n = 40, 7 cells; Figure 4D). During this period, central sarcomeres stretched to >150% of their original length (p < 0.0001, n = 20, 4 cells; Figure 4D). Peripheral sarcomeres shortened at a rate of ∼ 0.017 μm/min in response to 5 nM calyculin A, whereas central sarcomeres lengthened by ∼ 0.024 μm/min (unpublished data). Similar stretching of central sarcomeres and shortening of peripheral sarcomeres were observed in the GFP-α-actinin-expressing Swiss 3T3 cells after stimulation with LPA (Figure 4E). Sarcomeric units in stress fiber regions between the peripheral and central regions were initially measured and found to have no net length change during the same 30-40-min time period (p = 0.9345, n = 52, 5 cells; our unpublished results).
Figure 4.
Simultaneous stretching and shortening of α-actinin periodicity in contracting stress fibers. (A) Well-spread Swiss 3T3 cell maintained in serum showing GFP-α-actinin distribution before stimulation. (B) Enlarged area from (A) illustrating sarcomeric unit of stress fibers and center-to-center spacing used to measure “sarcomere” length. (C-E) Measurements of sarcomere length over time showed no change in unstimulated cells (C), but revealed simultaneous stretching and shortening of sarcomeres in cells stimulated with 5 nM calyculin A (D) or LPA (E).
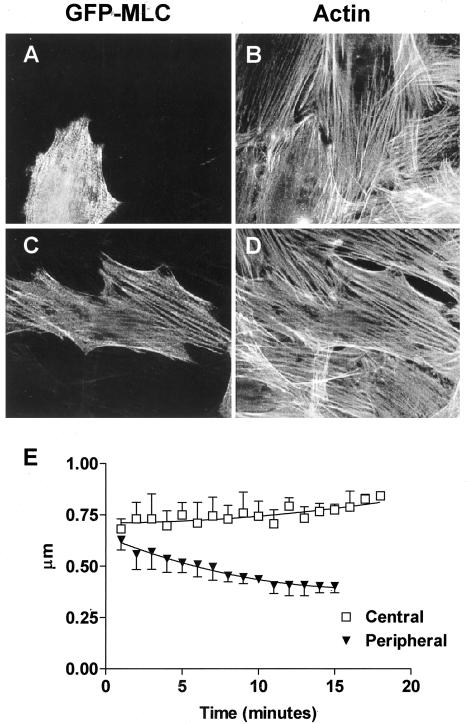
To examine myosin distribution after stimulation of contractility in vivo, we constructed a GFP-tagged myosin light-chain (GFP-MLC) chimera that localizes periodically along stress fibers in a manner similar to endogenous MLC in NIH 3T3 fibroblasts (Figure 5A) and gerbil fibroma cells (Figure 5C). Time-lapse imaging of transfected fibroma cells revealed the behavior of GFP-MLC before and after stimulation with 5 nM calyculin A. Periodicity of GFP-MLC bands in both central and peripheral regions did not change in unstimulated cells (p = 0.2872, n = 45, 4 cells; unpublished data) and averaged 1.1 ± 0.30 μm at the periphery and 1.25 ± 0.35 μm in central regions. After stimulation with 5 nM calyculin A, the periodicity of GFP-MLC bands at the periphery decreased by 30% over time (p < 0.0001, n = 51, 8 cells), whereas the periodicity in central stress fiber regions increased to nearly 125% of their original length (p = 0.0029, n = 15, 5 cells). These data and Figure 5E showing NIH 3T3 cells demonstrate a similar behavior of GFP-MLC bands and GFP-α-actinin bands during stimulation of contractility.
Figure 5.
GFP-MLC expressed in NIH 3T3 fibroblasts or gerbil fibroma cells incorporates into stress fibers. (A) NIH 3T3 or (C) gerbil fibroma cells were transiently transfected with GFP-MLC and double-labeled with fluorescently tagged phalloidin to show filamentous actin (B and D). (E) Center-to-center spacing (periodicity) of GFP-MLC in NIH 3T3 cells decreased in the periphery of stress fibers after stimulation of contractility, whereas the periodicity in the central regions increased.
Myosin and α-actinin Bands Change Width in Response to Stimulation
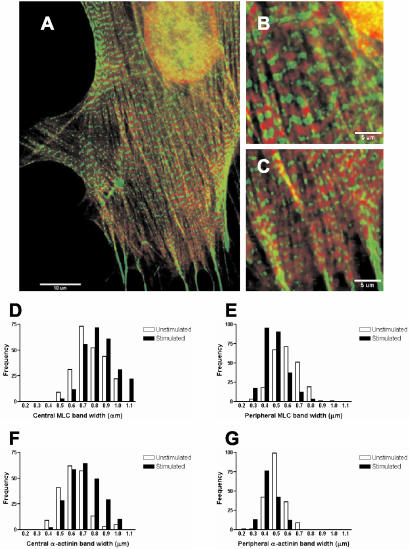
We also measured various spatial characteristics of MLC and α-actinin in unstimulated gerbil fibroma cells and those stimulated with 5 nM calyculin A. Figure 6, A-C, shows a gerbil fibroma cell 5 min after stimulation in which the bands of MLC and α-actinin are particularly striking. The differences in band widths of MLC and α-actinin between the central (Figure 6B) and peripheral (Figure 6C) stress fiber regions are clearly visible. We found that the mean width of the MLC bands was greater in central regions (0.78 ± 0.13 μm) than at the periphery (0.60 ± 0.11 μm) in unstimulated cells (p < 0.0001, n = 483, 5 cells, t test). The mean MLC bandwidth increased to 0.85 ± 0.14 μm in the central stress fiber region (p < 0.0001, n = 252, 5 cells, t test), and decreased in peripheral regions (0.48 ± 0.10 μm; p < 0.0001, n = 231, 5 cells, t test), of cells stimulated for 5 min (Figure 6D). The mean width of α-actinin bands was also different between the center (0.63 ± 0.12 μm) and periphery (0.51 ± 0.08 μm) in unstimulated cells (p < 0.0001, n = 377, 5 cells, t test; Figure 6E). Central α-actinin bands increased width within 5 min (0.71 ± 0.13 μm; p < 0.001, n = 190, 5 cells, t test). In contrast, peripheral α-actinin bands decreased in width (0.43 ± 0.07 μm) within 5 min (p < 0.001, n = 187, 5 cells, t test; Figure 6E).
Figure 6.
Indirect immunofluorescence of myosin light chains (red) and α-actinin (green) shows complementary periodic localization along stress fibers. (A) Stress fiber banding patterns are visible in a gerbil fibroma cell, 5 min after stimulation with 5 nM calyculin. (B) α-actinin and MLC bands are wider in central regions than in peripheral regions (C). (D) Bandwidths of MLC in central regions increase after stimulation with calyculin A shown by a shift in frequency distribution of band-widths. (E) MLC bandwidths at the periphery display a decrease as shown by a shift of the frequency distribution in the opposite direction. (F) α-actinin bandwidths in central regions are increased after stimulation, whereas those at the periphery decrease (G). Bars, 10 μm (A) and 5 μm (B).
Differential Distribution of Myosin in Stress Fibers of Contracting Cells
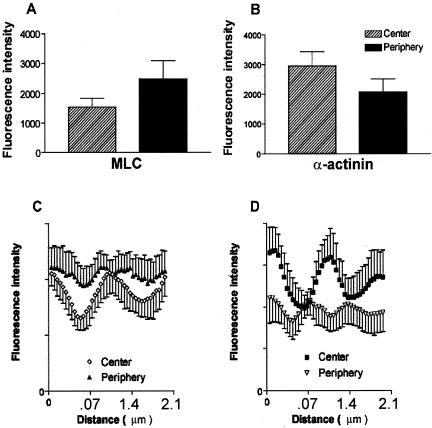
Myosin II is responsible for force generation within stress fibers, and our results suggest that contractile force is generated nonuniformly along stress fibers. Consistent with this idea, the concentration of myosin II has been reported to be higher in the periphery of serum-starved cells (Kolega and Taylor, 1993). Additionally, levels of activating MLC phosphorylation differ between the periphery of the cell at the leading edge and the tail region of migrating cells (Post et al., 1995). To characterize myosin distribution, we stained unstimulated and calyculin-treated gerbil fibroma cells with antibodies against MLC. Cells were gently and briefly permeabilized before fixing and then sheared of dorsal surfaces, leaving mainly stress fibers and focal adhesions adhering to glass coverslips. Processing cells according to these procedures assured that only fluorescence associated with stress fibers was included without interference from fluorescent proteins in the cytosol or dorsal-sheath (Zigmond et al., 1979). Fluorescence intensities per micron2 of MLC in unstimulated cells were different between the center and periphery of the same stress fibers (p < 0.0001, n = 50, 5 cells, paired t test). Peripheral intensity was greater than that in central regions (unpublished data). Thus, a higher concentration of MLC occurs at the stress fiber periphery before stimulation. Similarly, after stimulation with calyculin A, peripheral intensity per micron2 for MLC was greater than that in central regions (p < 0.0001, n = 40, 5 cells, paired t test; Figure 7A). Fluorescence intensities of α-actinin display the opposite trend; higher intensities occur at central regions than in the periphery of stress fibers (Figure 7B). This indicates that more α-actinin localizes in central regions where less MLC is present.
Figure 7.
Fluorescence intensity of antibody-labeled MLC and α-actinin measured in the central and peripheral regions of stress fibers of extracted cells that have been treated with 5 nM calyculin A. (A) Gerbil fibroma cells have higher fluorescence intensity per μm2 and therefore a greater concentration of MLC at the periphery. (B) Fluorescence intensity and concentration of α-actinin is greater in central stress fiber regions. Line scans of fluorescence intensities along stress fiber segments show differences in intensities and periodicities of antibody-labeled MLC and α-actinin between the center and the periphery after calyculin A stimulation. Multiple line scans were aligned as described in the text for MLC (C) or α-actinin (D). MLC is less concentrated and has longer periodicities in central regions than in peripheral regions (C). (D) The average central periodicity between α-actinin peaks is greater than that in the periphery. Fluorescence intensities display the reverse relationship to that found for MLC. Higher α-actinin fluorescence occurs in central regions than in peripheral regions.
An alternative approach to analyzing intensities of both MLC and α-actinin in different regions of stress fibers was to use 5-μm line scans of fluorescence along stress fiber segments. Line scans were obtained for MLC and α-actinin in calyculin-stimulated cells. Because of considerable variation in the periodicity between fluorescent bands of MLC or α-actinin in different stress fibers, multiple line scans were compared by aligning their initial fluorescence maxima. The lack of regularity in spacing between different stress fibers resulted in a rapid smoothing of mean fluorescence such that the periodicity was often difficult to detect after one or two cycles. Line scan analysis after stimulation of contraction confirmed that for both MLC and α-actinin the periodicity between fluorescence peaks at the periphery was ∼0.77 to 0.91 μm, and for the central region was between 1.2 and 1.5 μm (Figure 7, C and D). Additionally, this analysis also confirmed that MLC was more concentrated in the peripheral regions (Figure 7C), whereas α-actinin was more concentrated in the central regions (Figure 7D).
Fourier and Autocorrelation Analysis of Fluorescence Banding and Periodicity
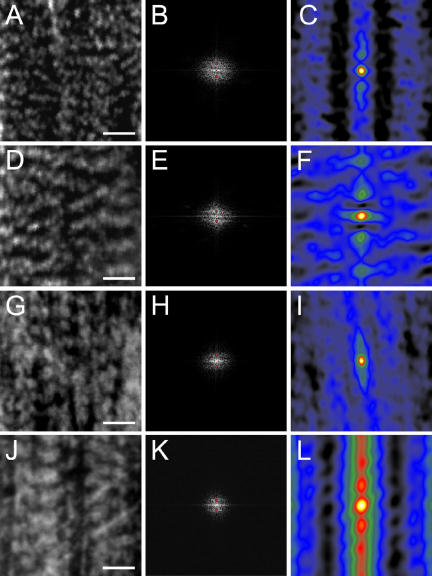
To complement our line scan measurements, images of the stress fibers stained for α-actinin or myosin were sampled at the periphery near the focal adhesions and at the central regions from calyculin-stimulated gerbil fibroma cells (Figure 8) and analyzed using Fourier transform and autocorrelation analyses. The use of Fourier and autocorrelation image-processing techniques to analyze repeating banding patterns in biological systems (such as muscle) has been well documented (e.g., Shah and Lieber, 2003; Mansour et al., 2004). The power spectra for stress fibers at the periphery near the focal adhesions in both α-actinin (Figure 8B) and MLC (Figure 8H) produce peaks (marked with red dots) that are farther from the center of the spectrum image than are the peaks produced from samples in central stress fiber regions (Figure 8, E and K, depicting α-actinin and MLC, respectively). This suggests that the major components within these sample images (i.e., α-actinin and MLC bands) are more closely spaced (higher frequency) at the periphery than those near the center, where the frequency is lower and spacing is greater. Autocorrelation analysis of sample images from central stress fiber regions (Figure 8, F and L, α-actinin and MLC, respectively) reveal larger central peaks than those from regions near the focal adhesions at the periphery (Figure 8, C and I, α-actinin and MLC, respectively). These results correlate with our measured differences in α-actinin and MLC banding frequencies between the central and peripheral stress fiber regions.
Figure 8.
Autocorrelation and Fourier analyses of fluorescence bands of α-actinin and MLC in gerbil fibroma cells 5 min after stimulation with 5 nM calyculin A. Sample images of α-actinin at the periphery (A) and center (D), with their respective power spectra (B and E) and autocorrelation images (C and F). Sample images of MLC at the periphery (G) and center (J), with their respective power spectra (H and K) and autocorrelation images (I and L). The red dots in panels B, E, H, and K represent the location of the computer-measured peaks within the power spectra. Scale bars, 2 μm.
Myosin Light Chains are Differentially Phosphorylated Between Center and Periphery
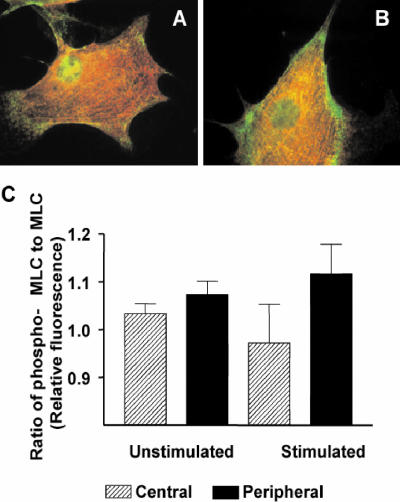
We then measured the fluorescence intensity of the fluorescently labeled MLC and phospho-S19-MLC, at central and peripheral regions of the same stress fibers in unstimulated cells or cells that had been stimulated with 5 nM calyculin A. Fluorescence intensities were normalized to average intensities of the whole cell as measured by random sampling over different cell regions. Previous studies have reported that upon stimulation of cells with LPA or thrombin, increased phosphorylation on Ser19 of MLC precedes reorganization of actin and myosin into stress fibers (Chrzanowska-Wodnicka and Burridge, 1996; Goeckeler and Wysolmerski, 1995). We observed that more phospho-S19-MLC localizes at stress fiber peripheries after stimulation with calyculin A (Figure 9, A and B). To quantify the distribution of active myosin, we generated ratios of fluorescence intensity of phospho-MLC to total MLC at the periphery and central regions. The ratio of fluorescence intensity of phospho-MLC to total MLC was higher at the periphery (p < 0.001, n = 125, 5 cells) than at central regions (p > 0.05, n = 125, 5 cells) in cells stimulated with calyculin A (Figure 9C).
Figure 9.
Distribution of phosphorylated MLC in unstimulated and stimulated gerbil fibroma cells. (A and B) Indirect immunolabelling of fibroma cells with antibodies specific for MLC (red) and phospho-Ser19-MLC (green). Green reveals higher concentrations of phospho-MLC at the periphery of stress fibers in both unstimulated (A) and stimulated cells (B). The ratio of phospho-MLC to MLC increases after stimulation (C).
Dynamics of MLC and α-actinin in the Central and Peripheral Regions of Stress Fibers
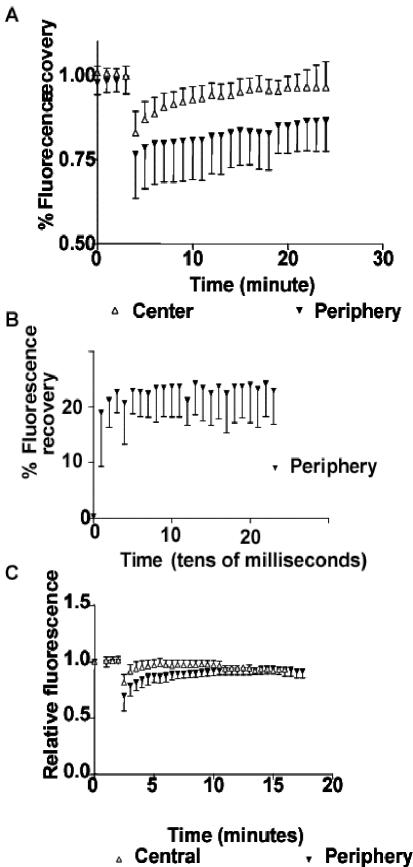
The variation in MLC phosphorylation at different regions along stress fibers could affect not only force generation in the different regions, but also the stability of myosin filaments in these regions. MLC phosphorylation promotes myosin filament assembly and interaction with F-actin (Craig et al., 1983; Trybus, 1991; Kolega and Kumar, 1999; Iwasaki et al., 2001); thus it would be predicted that the more highly phosphorylated myosin filaments should be more stable. To explore the stability differences of myosin along stress fibers, we used transiently transfected GFP-MLC expressed in fibroma cells and measured fluorescence recovery after photobleaching. A 2.2-μm-diameter spot was photobleached and a time-lapse series of images was acquired. The relative fluorescence intensity within the bleached area was measured during recovery. Fluorescence recovery of GFP-MLC in peripheral stress fiber regions showed t1/2 > 21 min (Figure 10A). Fluorescence recovery of GFP-MLC in central stress fiber regions showed t1/2 = 8.5 min, with near total recovery by 21 min (Figure 10A). Half-time recovery periods are significantly different between the central and peripheral regions (p < 0.0001, t test). To separate recovery into a fast phase due to diffusion of individual myosins and a slow phase that reflects association with myosin filaments, we repeated FRAP experiments with a photomultiplier that allowed temporal data collection in a millisecond time scale. Diffusion coefficients for GFP-MLC were not significantly different between central and periphery stress fiber regions (p = 0.1318, n = 10) and the fast phase of fluorescence recovery occurred in both regions within 10-15 milliseconds after photobleaching (Figure 10B). Together this demonstrated that faster exchange of GFP-MLC occurred in central regions than at the periphery and indicated that GFP-MLC is more stably associated with stress fibers in the periphery.
Figure 10.
FRAP of GFP-MLC (expressed in gerbil fibroma cells) or GFP-α-actinin (expressed in Swiss 3T3 fibroblasts). (A) Greater exchange of GFP-MLC occurs in central regions than in peripheral zones. The t1/2 of GFP-MLC in central regions is 8.5 min (n = 14), whereas that for peripheral spots is t1/2 > 21 min after photobleaching (N = 9). (B) Fast phase of fluorescence recovery due to passive diffusion of GFP-MLC shows ∼21% recovery of prebleach fluorescence within the first 10 msec after bleaching before plateauing before beginning the slow phase of active recovery depicted in A. (C) GFP-α-actinin recovers after photobleaching with a t1/2 = 2.5 min in central regions and 4 min in peripheral regions with essentially full recovery by 8-10 min in both regions.
We also performed the same FRAP measurements of GFP-α-actinin exchange at the periphery and central regions of stress fibers. Photobleached spots in central stress fiber regions recovered fluorescence with a half-time of t1/2 = 2.5 min after bleaching and almost completely recovered fluorescence within 7 min (n = 12; Figure 10C). Bleached spots at the periphery recovered at t1/2 = 4.5 min after photobleaching and showed nearly full recovery by 8 min after bleaching (n = 8; Figure 10C). Both of these half-times for recovery fall within values observed previously for α-actinin (Glück and Ben-Ze'ev, 1994; Edlund et al., 2001). Comparison of recovery rates for central and peripheral regions indicates a significant difference in the mean half-time recovery between the two regions (p = 0.0001, two-tailed t test). This suggests that GFP-α-actinin, like GFP-MLC, is more stably associated with stress fibers at the periphery than in more central regions.
DISCUSSION
We have used GFP fusion constructs of α-actinin and the regulatory MLC to examine the dynamics of stress fibers and focal adhesions in living cells as these are induced to contract. Initially, we used LPA, a component of serum, to stimulate contraction, but for most experiments we have used calyculin A, an inhibitor of the serine/threonine phosphatase, PP1, because this was less variable and induced cell contraction at a slow, controlled rate. As with LPA treatment, stimulation of serum-starved cells lacking stress fibers with calyculin A induced contraction and stress fiber assembly, consistent with models that assign a primary role to contractility in the assembly of these structures (Chrzanowska-Wodnicka and Burridge, 1996).
For most experiments we used calyculin A at a concentration (5 nM) that was just above its IC50 for PP1 (∼1-2 nM; Ishihara et al., 1989). However, we suspect that the concentration achieved within cells was well below the concentration we applied, because the rate of contraction was increased at concentrations above 10 nM, indicating that we used a submaximal ED. Using GFP-α-actinin as a marker, we observed growth and centripetal movement of most focal adhesions in response to stimulated contraction. This behavior of focal adhesions was confirmed by IRM. Focal adhesion movement has been reported under a variety of conditions (Smilenov et al., 1999; Pankov et al., 2000; Zamir et al., 2000; Riveline et al., 2001).
The organization of components within stress fibers has been studied for many years by both electron microscopy and immunofluorescence. Many of the components display a periodic distribution along stress fibers reminiscent of the sarcomeric organization within striated muscle, and this has led to a consensus view that stress fibers behave and function like muscle myofibrils. Our work here, however, indicates that stress fibers display unexpected features that distinguish them from typical myofibrils. First, individual “sarcomeric” units within stress fibers can behave independently of each other. In response to stimulation of contraction, stress fibers decrease in overall length, but only a subset of sarcomeres at the periphery shorten, whereas those within the center elongate; sarcomeres in regions between the periphery and center display little net change during this period of stress fiber contraction. Second, whereas the individual filaments in typical striated muscles maintain a constant length during contraction or stretching (Huxley, 1966; Craig, 1994), in stress fibers the dimensions of the myosin and α-actinin bands vary during contraction and do so differently in different regions.
The simultaneous stretching and contraction of sarcomeres in different regions of a single stress fiber suggest that either the resistance to stretching and/or the contractile force generated within a stress fiber vary locally along its length. This contrasts with the behavior of sarcomeres in striated muscles. However, localized stretching has been reported in contracting damaged or diseased muscle tissue in the phenomenon of “Z-line streaming” (Banker and Engel, 1994). For several reasons, we think it unlikely that the behavior of sarcomeric units in stress fibers that we report here is due to calyculin A inducing damage. First, in serum-starved cells lacking stress fibers, calyculin A promoted the assembly of these structures. Second, we restricted our measurements to cells treated with low doses of calyculin A and for time periods in which cell rounding did not occur. Third, even extending the observations to where cell rounding took place, we found that this was reversible, and respreading occurred after washout of the drug. Similarly, previous studies using 10-fold high concentrations of calyculin observed that, after removal of the drug, rounded cells respread and went through mitosis normally (Chartier et al., 1991; Hirano et al., 1992). Together these results suggest that the unexpected behavior of different regions along the stress fiber is not due to some irreversible damage to these structures. Consistent with the force generated along a stress fiber being nonuniform, we observed a higher concentration of myosin in the peripheral regions of stress fibers compared with the central regions and more myosin light chain phosphorylation (i.e., more active myosin) in the periphery following treatment with calyculin A. The lengthening of central sarcomeres during contraction may also indicate less resistance to stretching. Myosin II is a potent, multivalent actin filament cross-linker when the myosin is activated. Consequently, it would be predicted that where it is more active (the periphery), it would provide more resistance to stretching than in regions where it is less active (the central zone). We measured FRAP and found a large difference in the rate of exchange of GFP-MLC between the periphery and center of stress fibers. The increased rate of exchange in the central sarcomeres may reflect the decreased myosin activity in this region, but it may also relate to decreased interactions with other components as well. Together these results suggest that, in response to stimulation of contraction by calyculin A, the central regions of stress fibers are both less contractile and less able to resist stretching than are the peripheral regions.
In response to contraction, we observed changes in the dimensions of the myosin and α-actinin bands in stress fibers. In regions where there was a shortening of the sarcomeres, the individual bands became shorter, whereas in regions where there was stretching, these bands became wider. We noted also that the dimensions of the bands often varied in unstimulated cells, and this has also been noted previously (Sanger et al., 1986). Again, this variation in band width distinguishes the behavior of these structures from the behavior of striated muscle sarcomeres. Myosin-containing A-bands in muscle maintain a constant width during contraction or stretching, as they slide relative to the actin filaments (Huxley 1966). However, an exception is found in Limulus telson muscle in which A-bands are shorter with ragged edges in stretched, activated muscle preparations, and this shortening is attributed to filament degradation (Levine et al., 1991). This change in A-bands is not equivalent to what we have observed because in central, stretched stress fiber regions, the myosin bands increase in width, although the local fluorescence intensity is less than at the periphery.
Nonmuscle myosin II assembles into short bipolar filaments consisting of 10-30 myosin molecules (Svitkina et al., 1989; Verkhovsky and Borisy, 1993). The apparent stretching or contraction of a myosin filament could occur by addition or loss of individual myosins. However, the data from in vitro studies indicates that assembly is promoted by MLC phosphorylation and if filaments were growing by addition of myosins, one would predict the reverse of what we have observed: that the regions of highest MLC phosphorylation would correlate with the longest filaments. The most detailed electron microscopy of myosin II organization in non-muscle cells has been performed by Verkhovsky, Borisy, and their colleagues (Svitkina et al., 1989; Verkhovsky and Borisy, 1993; Verkhovsky et al., 1995). These investigators have observed that the bands (“ribbons” in their nomenclature) of myosin II are composed of many myosin filaments aligned laterally. In some regions, they noted a striking alignment, but in other regions the filaments were less well ordered. In the central regions of stress fibers, misalignment of the myosin filaments may arise from the myosin molecules being less active and less stably associated with stress fibers, resulting in the filaments being pulled relative to each other. At the light microscope level, it has not been possible to discern individual myosin filaments, but a more staggered arrangement would generate the broader bands of fluorescence seen in central stress fiber regions. Fluorescence intensity measurements were consistent with the broader bands arising from misalignment of myosin filaments rather than addition of more myosin subunits within individual filaments, because the intensity was less where the bands were broader than where the bands were narrow.
Like the myosin, α-actinin fluorescent bands appeared narrower in the periphery and broader in the center of stress fibers after a contraction stimulus. However, here the intensity measurements indicated that more α-actinin was being recruited to the wider bands seen in the central regions. In striated muscle, the α-actinin-containing Z-lines come closer together upon contraction but the width of the Z-lines can expand as the muscle sarcomere shortens (Craig, 1994). We observed that the α-actinin bands decreased at the periphery where the sarcomeric units shortened during stress fiber contraction. This suggests that in stress fibers, α-actinin in dense bodies is not strictly equivalent to Z-lines in muscle.
The band that does change its dimensions during muscle contraction is the I-band, which represents the region of nonoverlap between the actin and myosin filaments. With contraction, the I-band shortens and with stretching it lengthens as the overlap between the actin and myosin filaments increases or decreases, respectively (Huxley, 1969). It is striking that the equivalent of an I-band is rarely, if ever, seen in stress fibers. The changes in dimensions of the α-actinin bands during stress fiber contraction resemble the behavior of the I-bands of striated muscle sarcomeres. This leads us to propose an alternative model for the organization of stress fiber sarcomeres. We suggest that α-actinin is not confined to a relatively narrow Z-line structure, but extends into the equivalent of the I-band, binding to regions of actin that do not overlap with myosin. During contraction, α-actinin must be progressively displaced, with the result that the band of α-actinin shrinks in width to a minimum value. Careful EM analysis of α-actinin distribution in contracted vs. stretched regions of stress fibers will be needed to test this model. It will be interesting to look for possible mechanisms by which α-actinin may be displaced by myosin or proteins that are associated with myosin (e.g., caldesmon). It is known that the binding of α-actinin to F-actin is inhibited by tropomyosin (Holmes et al., 1971), and the interaction of nonmuscle α-actinin with F-actin is inhibited by calcium (Burridge and Feramisco, 1981). In addition, the affinity of α-actinin for F-actin is relatively low (Burridge and Feramisco, 1981), and this would be compatible with rapid reorganization.
Acknowledgments
We thank Fumio Matsumura for the gift of affinity-purified antibody specific for phosphorylated Ser19 of MLC and for helpful discussions. We express our appreciation to Mike Schaller, Veronica Gabarra-Neiko, and Michelle King for advice on construction of fluorescent protein MLC chimeras. Many thanks to Ken Jacobson for advice on FRAP experiments. We also thank anonymous reviewers for very helpful suggestions. This work was supported by National Institutes of Health Grants HL-45100, GM-29860, GM-64346, and GM-61743.
Article published online ahead of print. Mol. Biol. Cell 10.1091/mbc.E03-09-0696. Article and publication date are available at www.molbiolcell.org/cgi/doi/10.1091/mbc.E03-09-0696.
References
- Banker, B.Q. and Engel, A.G. (1994). Basic reactions of muscle. In: Myology, vol. 1, 2nd ed., ed. A.G. Engel and C. Franzini-Armstrong, New York: McGraw-Hill, 832-848. [Google Scholar]
- Burridge, K. (1981). Are stress fibres contractile? Nature 294, 691-692. [DOI] [PubMed] [Google Scholar]
- Burridge, K., and Feramisco, J.R. (1981). Nonmuscle α-actinins: calcium-sensitive actin-binding proteins. Nature 294, 565-567. [DOI] [PubMed] [Google Scholar]
- Burridge, K., Fath, K., Kelly, K., Nuckolls, G., and Turner, C. (1988). Focal adhesions: transmembrane junctions between the extracellular matrix and cytoskeleton. Annu. Rev. Cell Biol. 4, 487-525. [DOI] [PubMed] [Google Scholar]
- Byers, H.R., White, G.E., and Fujiwara, K. (1984). Organization and function of stress fibers in cells in vitro and in situ. Cell Muscle Motil. 5, 83-137. [DOI] [PubMed] [Google Scholar]
- Chartier, L., Rankin, L.L., Allen, R.E., Kato, Y., Fusetani, N., Karaki, H., Watabe, S., and Hartshorne, D.J. (1991). Calyculin-A increases the level of protein phosphorylation and changes the shape of 3T3 fibroblasts. Cell Motil. Cytoskel. 18, 26-40. [DOI] [PubMed] [Google Scholar]
- Chrzanowska-Wodnicka, M., and Burridge, K. (1996). Rho-stimulated contractility drives the formation of stress fibers and focal adhesions. J. Cell Biol. 133, 1403-1415. [DOI] [PMC free article] [PubMed] [Google Scholar]
- Craig, R. (1994). The structure of the contractile Filaments. In: Myology, 2nd ed., vol. 1, ed. A.G. Engel and C. Franzini-Armstrong, New York: McGraw-Hill, 134-175. [Google Scholar]
- Craig, R., Smith, R., and Kendrick-Jones, J. (1983). Light-chain phosphorylation controls the conformation of vertebrate non-muscle and smooth muscle myosin molecules. Nature 302, 4336-4439. [DOI] [PubMed] [Google Scholar]
- Edlund, M., Lotano, M., and Otey, C.A. (2001). Dynamics of alpha-actinin in focal adhesions and stress fibers visualized with alpha-actinin-green fluorescent protein. Cell Motil. Cytoskel. 48, 190-200. [DOI] [PubMed] [Google Scholar]
- Fujiwara, K., and Pollard, T. (1976). Fluorescent antibody localization of myosin in the cytoplasm, cleavage furrow, and mitotic spindle of human cells. J. Cell Biol. 71, 848-875. [DOI] [PMC free article] [PubMed] [Google Scholar]
- Gabbiani, G., Badonnel, M.C., and Rona, G. (1975). Cytoplasmic contractile apparatus in aortic endothelial cells of hypertensive rats. Lab. Invest. 32, 227-234. [PubMed] [Google Scholar]
- Gabbiani, G., Hirschel, B.J., Ryan, G.B., Statkov, P.R., and Majno, G. (1972). Granulation tissue as a contractile organ: a study of structure and function. J. Exp. Med. 135, 719-734. [DOI] [PMC free article] [PubMed] [Google Scholar]
- Giuliano, K.A., Kolega, J., DeBiasio, R.L., and Taylor, D.L. (1992). Myosin II phosphorylation and the dynamics of stress fibers in serum-deprived and stimulated fibroblasts. Mol. Biol. Cell 3, 1037-1048. [DOI] [PMC free article] [PubMed] [Google Scholar]
- Giuliano, K.A., and Taylor, D.L. (1990). Formation, transport, contraction, and disassembly of stress fibers in fibroblasts. Cell Motil. Cytoskel. 16, 14-21. [DOI] [PubMed] [Google Scholar]
- Glück, U., and Ben-Ze'ev, A. (1994). Modulation of α-actinin levels affects cell motility and confers tumorigenicity on 3T3 cells. J. Cell Sci. 107, 1773-17782. [DOI] [PubMed] [Google Scholar]
- Goeckeler, Z.M., and Wysolmerski, R.B. (1995). Myosin light chain kinase-regulated endothelial cell contraction: the relationship between isometric tension, actin polymerization, and myosin phosphorylation. J. Cell Biol. 130, 613-627. [DOI] [PMC free article] [PubMed] [Google Scholar]
- Gordon, W.E. (1978). Immunofluorescent and ultrastructural studies of “sarcomeric” units in stress fibers of cultured non-muscle cells. Exp. Cell Res. 117, 253-260. [DOI] [PubMed] [Google Scholar]
- Herman, I.M., and Pollard, T. (1979). Comparison of purified anti-actin and fluorescent-heavy meromyosin staining patterns in dividing cells. J. Cell Biol. 80, 509-520. [DOI] [PMC free article] [PubMed] [Google Scholar]
- Hirano, K., Chartier, L., Taylor, R.G., Allen, R.E., Fusetani, N., Karaki, H., and Hartstone, D.J. (1992). Changes in the cytoskeleton of 3T3 fibroblasts induced by the phosphatase inhibitor, calyculin A. J. Muscle Res. Cell Motil. 13, 341-353. [DOI] [PubMed] [Google Scholar]
- Holmes, G.R., Goll, D.E., and Suzuki, A. (1971). Effect of α-actinin on actin viscosity. Biochim. Biophys. Acta 253, 240-253. [DOI] [PubMed] [Google Scholar]
- Huxley, H.E. (1966). The fine structure of striated muscle and its functional significance. Harvey Lectures 60, 85-118. [PubMed] [Google Scholar]
- Huxley, H.E. (1969). The mechanism of muscular contraction. Science 164, 1356-1365. [PubMed] [Google Scholar]
- Isenberg, G., Rathke, P.C., Hulsmann, N., Franke, W.W., and Wohlfarth-Bottermann, K.E. (1976). Cytoplasmic actomyosin fibrils in tissue culture cells: direct proof of contractility by visualization of ATP-induced contraction in fibrils isolated by laser micro-beam dissection. Cell Tissue Res. 166, 427-443. [DOI] [PubMed] [Google Scholar]
- Ishihara, H. et al. (1989). Calyculin A and okadaic acid: inhibitors of protein phosphatase activity. Biochem. Biophys. Res. Commun. 159, 871-877. [DOI] [PubMed] [Google Scholar]
- Iwasaki, T., Murata-Hori, M., Ishitobi, S., and Hosoya, H. (2001). Diphosphorylated MRLC is required for organization of stress fibers in interphase cells and the contractile ring in dividing cells. Cell Struct. Funct. 26, 677-683. [DOI] [PubMed] [Google Scholar]
- Katoh, K., Kano, Y., Amano, M., Onishi, H., Kaibuchi, K., and Fujiwara, K. (2001). Rho-kinase-mediated contraction of isolated stress fibers. J. Cell Biol. 153, 569-584. [DOI] [PMC free article] [PubMed] [Google Scholar]
- Katoh, K., Kano, Y., Masuda, M., Onishi, H., and Fujiwara, K. (1998). Isolation and contraction of the stress fiber. Mol. Biol. Cell 9, 1919-1938. [DOI] [PMC free article] [PubMed] [Google Scholar]
- Kolega, J., and Kumar, S. (1999). Regulatory light chain phosphorylation and the assembly of myosin II into the cytoskeleton of microcapillary endothelial cells. Cell Motil. Cytoskel. 43, 255-268. [DOI] [PubMed] [Google Scholar]
- Kolega, J. and Taylor, D.L. (1993). Gradients in the concentration and assembly of myosin II in living fibroblasts during locomotion and fiber transport. Mol. Biol. Cell 4, 819-836. [DOI] [PMC free article] [PubMed] [Google Scholar]
- Kreis, T.I., and Birchmeier, W. (1980). Stress fiber sarcomeres of fibroblasts are contractile. Cell Motil. Cytoskel. 22, 555-561. [DOI] [PubMed] [Google Scholar]
- Lazarides, E., and Burridge, K. (1975). Alpha-actinin: immunofluorescent localization of a muscle structural protein in nonmuscle cells. Cell Motil. Cytoskel. 6, 289-298. [DOI] [PubMed] [Google Scholar]
- Lazarides, E., and Weber, K. (1974). Actin antibody: the specific visualization of actin filaments in non-muscle cells. Proc. Natl. Acad. Sci. USA 71, 2268-2272. [DOI] [PMC free article] [PubMed] [Google Scholar]
- Levine, R.J.C., Woodhead, J.L., and King, H.A. (1991). The effect of calcium activation of skinned fiber bundles on the structure of Limulus thick filaments. J. Cell Biol. 113, 573-583. [DOI] [PMC free article] [PubMed] [Google Scholar]
- Mansour, H., de Tombe, P.P., Samarel, A.M., and Russell, B. (2004). Restoration of resting sarcomere length after uniaxial static strain is regulated by protein kinase Cε and focal adhesion kinase. Circ. Res. 94, 642-649. [DOI] [PubMed] [Google Scholar]
- Pankov, R., Cukierman, E., Katz, B.Z., Matsumoto, K., Lin, D.C., Lin, S., Hahn, C., and Yamada, K.M. (2000). Integrin dynamics and matrix assembly: tensin-dependent translocation of alpha(5)beta(1) integrins promotes early fibronectin fibrillogenesis. J. Cell Biol. 148, 1075-1090. [DOI] [PMC free article] [PubMed] [Google Scholar]
- Peterson, L., and Burridge, K. (2001). Focal adhesions and focal complexes. Cell Adhesion 39, 288-323. [Google Scholar]
- Post, P.L., Trybus, K.M., and Taylor, D.L. (1994). A genetically engineered, protein-based optical biosensor of myosin II regulatory light chain phosphorylation. J. Biol. Chem. 269, 12880-12887. [PubMed] [Google Scholar]
- Riveline, D., Zamir, E., Balaban, N.Q., Schwarz, U.S., Ishizaki, T., Narumiya, S., Kam, Z., Geiger, B., and Bershadsky, A.D. (2001). Focal contacts as mechanosensors: externally applied local mechanical force induces growth of focal contacts by an mDia1-dependent and ROCK-independent mechanism. J. Cell Biol. 153, 1175-1186. [DOI] [PMC free article] [PubMed] [Google Scholar]
- Russ, J.C. (1999). The Image Processing Handbook, 3rd ed. Boca Raton, FL: CRC Press LLC.
- Sanger, J.M., Mittal, B., Pochapin, M., and Sanger, J.W. (1986). Observations of microfilament bundles in living cells microinjected with fluorescently labelled contractile proteins. J. Cell Sci. 5(Suppl.), 17-44. [DOI] [PubMed] [Google Scholar]
- Sanger, J.W., Mittal, B., and Sanger, J.M. (1984a). Analysis of myofibrillar structure and assembly using fluorescently labeled contractile proteins. J. Cell Biol. 98, 825-833. [DOI] [PMC free article] [PubMed] [Google Scholar]
- Sanger, J.W., Mittal, B., and Sanger, J.M. (1984b). Interaction of fluorescently-labeled contractile proteins with the cytoskeleton in cell models. J. Cell Biol. 99, 918-928. [DOI] [PMC free article] [PubMed] [Google Scholar]
- Sanger, J.W., Sanger, J.M., and Jockusch, B.M. (1983). Differences in the stress fibers between fibroblasts and epithelial cells. J. Cell Biol. 96, 961-969. [DOI] [PMC free article] [PubMed] [Google Scholar]
- Sellers, J.R. (1991). Regulation of cytoplasmic and smooth muscle myosin. Curr. Opin. Cell Biol. 3, 98-104. [DOI] [PubMed] [Google Scholar]
- Shah, S.B., and Lieber, R.L. (2003). Simultaneous imaging and functional assessment of cytoskeletal protein connections in passively loaded single muscle cells. J. Histochem. Cytochem. 51, 19-29. [DOI] [PubMed] [Google Scholar]
- Smilenov, L.B., Mikhailov, A., Pelham, R.J.J., Marcantonio, E.E., and Gunderson, G.G. (1999). Focal adhesion motility revealed in stationary fibroblasts. Science 286, 1172-1174. [DOI] [PubMed] [Google Scholar]
- Svitkina, T.M., Surguchova, I.G., Verkhovsky, A.B., Gelfand, V.I., Moeremans, M., and De Mey, J. (1989). Direct visualization of bipolar myosin filaments in stress fibers of cultured fibroblasts. Cell Motil. Cytoskel. 12, 150-156. [DOI] [PubMed] [Google Scholar]
- Tan, J.L., Ravid, S., and Spudich, J.A. (1992). Control of nonmuscle myosins by phosphorylation. Annu. Rev. Biochem. 61, 721-759. [DOI] [PubMed] [Google Scholar]
- Trybus, K.M. (1991). Assembly of cytoplasmic and smooth muscle myosins. Curr. Opin. Cell Biol. 3, 105-111. [DOI] [PubMed] [Google Scholar]
- Verkhovsky, A.B., and Borisy, G.G. (1993). Non-sarcomeric mode of myosin II organization in the fibroblast lamellum. J. Cell Biol. 123, 637-652. [DOI] [PMC free article] [PubMed] [Google Scholar]
- Verkhovsky, A.B., Svitkina, T.M., and Borisy, G.G. (1995). Myosin II filament assemblies in the active lamella of fibroblasts: their morphogenesis and role in the formation of actin filament bundles. J. Cell Biol. 131, 989-1002. [DOI] [PMC free article] [PubMed] [Google Scholar]
- Weber, K., and Groeschel-Stewart, U. (1974). Antibody to myosin: the specific visualization of myosin-containing filaments in nonmuscle cells. Proc. Natl. Acad. Sci. USA 71, 4561-4564. [DOI] [PMC free article] [PubMed] [Google Scholar]
- White, G.E., Gimbrone, M.A., and Fujiwara, K. (1983). Factors influencing the expression of stress fibers in vascular endothelial cells in situ. J. Cell Biol. 97, 416-424. [DOI] [PMC free article] [PubMed] [Google Scholar]
- Wong, A.J., Pollard, T., and Herman, I.M. (1983). Actin filament stress fibers in vascular endothelial cells in vivo. Science 219, 867-869. [DOI] [PubMed] [Google Scholar]
- Yamada, K., and Geiger, B. (1997). Molecular interactions in cell adhesion complexes. Curr. Opin. Cell Biol. 9, 76-85. [DOI] [PubMed] [Google Scholar]
- Zamir, E. et al. (2000). Dynamics and segregation of cell-matrix adhesions in cultured fibroblasts. Nat. Cell Biol. 2, 191-196. [DOI] [PubMed] [Google Scholar]
- Zigmond, S.H., Otto, J.J., and Bryan, J. (1979). Organization of myosin in a submembranous sheath in well-spread human fibroblasts. Exp. Cell Res. 119, 205-219. [DOI] [PubMed] [Google Scholar]


