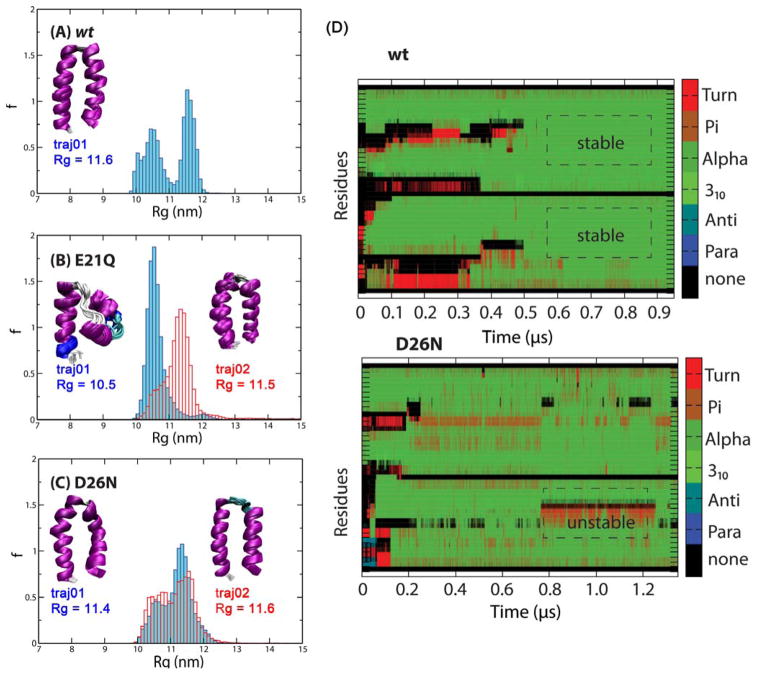
Figure 4.
Normalized histograms of Rg values of the structures obtained from independent aMD trajectories. (A) wt, (B) E21Q and (C) D26N. Clusters of final structures are shown in the insets, with the corresponding Rg value. The helix bundle (left) and helix-turn-helix structure (right) of the E21Q mutant are shown in panel B. (D) Secondary structure propensity of each residue (Turn, π-helix, α-helix, 310-helix, anti-parallel β-sheet, parallel β-sheet) obtained from aMD trajectories of the wt and D26N mutant using the same low boost potentials.

