Abstract
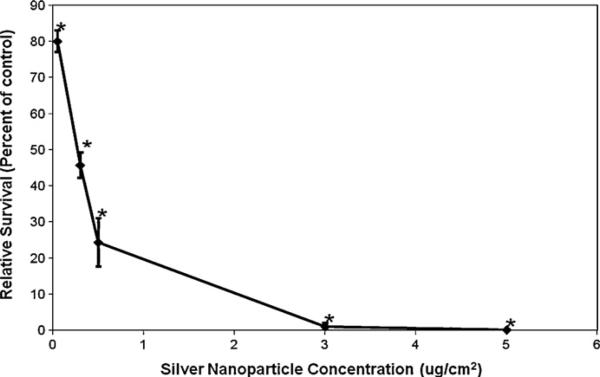
Nanoparticles are being widely investigated for a range of applications due to their unique physical properties. For example, silver nanoparticles are used in commercial products for their antibacterial and antifungal properties. Some of these products are likely to result in silver nanoparticles reaching the aquatic environment. As such, nanoparticles pose a health concern for humans and aquatic species. We used a medaka (Oryzias latipes) cell line to investigate the cytotoxicity and genotoxicity of 30 nm diameter silver nanospheres. Treatments of 0.05, 0.3, 0.5, 3 and 5 μg/cm2 induced 80, 45.7, 24.3, 1 and 0.1% survival, respectively, in a colony forming assay. Silver nanoparticles also induced chromosomal aberrations and aneuploidy. Treatments of 0, 0.05, 0.1 and 0.3 μg/cm2 induced damage in 8, 10.8, 16 and 15.8% of metaphases and 10.8, 15.6, 24 and 24 total aberrations in 100 metaphases, respectively. These data show that silver nanoparticles are cytotoxic and genotoxic to fish cells.
Keywords: Silver, Nanoparticle, Genotoxicity, Medaka
1. Introduction
Nanotechnology is considered to be the next industrial revolution and is expected to become a 1 trillion dollar industry within the next 10 years (Hood, 2004). Nanoparticles are currently in use in commercial products including sunscreen, stain-resistant clothing, semiconductors, tires, and even in sports equipment such as bowling balls (Hood, 2004). Interestingly, the physical properties of nanomaterials often deviate dramatically from the properties of the bulk materials, often exhibiting mechanical, chemical, magnetic, electronic, and optical properties unachievable in the bulk materials. For example, bulk gold and larger gold particles were historically considered to be almost completely inert. However, gold nanoparticles can behave as strong catalysts and are now being investigated for a broad range of commercially and industrially viable chemistries (Haruta, 2005; Hughes et al., 2005). These new properties have resulted in the use of nanoparticles in a number of novel applications which include: printable inks for flexible electronics, biomedical assays, drug delivery, colorants and paints, solar cells, liquid crystal displays, and chemical catalysis, to name a few (Haruta, 2005; Bishop, 2002; Fuller et al., 2002; Maxwell et al., 2002; Shiraishi et al., 2002; Salata, 2004; Law et al., 2005). Consequently, a whole new industry is emerging with vastly significant new products and markets. However, the same properties that make these particles exciting in technology and consumer markets also make them public health concerns. Simply put, it is unknown how these new properties will enhance, diminish or otherwise alter the toxicity of the compounds that they are made from. The toxicity of nanoparticles is unclear and relatively unexplored.
Engineered nanoparticulate materials, such as carbon nanotubes, exhibit toxic effects as rodent studies have shown that inhaled nanoparticles accumulate in the nasal passage, lung, and brain (Oberdorster et al., 2004). In another study it was found that they can cause lesions that interfere with oxygen absorption (Lam et al., 2004) and cause suffocation due to immune system cells clumping around the particles, which then block bronchial passages (Warheit et al., 2004). However, these studies were conducted at very high exposure levels. Recently, it has been shown that lower doses also cause respiratory toxicity including proinflammatory and fibrotic responses (Muller et al., 2005). Cell culture studies confirm the toxicity of engineered nanoparticles reporting cytotoxicity, decreased cell viability, and the production of proinflammatory agents (Shvedova et al., 2003; Sayes et al., 2004; Monteiro-Riviere et al., 2005). These cell culture studies indicate that size and particle composition can dramatically modify toxicity, with some sizes and forms highly toxic and others nontoxic (Sayes et al., 2004; Goodman et al., 2004). There are fewer data for metal-based engineered nanomaterials and only a few reports focusing on genotoxicity. Iron nanoparticles including bare iron particles and polyaspartic acid-modified iron particles were genotoxic, while iron modified with dextran was not (Sadeghiania et al., 2005; Bourrinet et al., 2006). These data suggest that metal nanoparticles may be genotoxic and indicate the need for further study.
The extent to which chemical properties of nanomaterials deviate from that of larger particles is often inversely proportional to size (surface area) and is dependent on composition (surface energy). Accordingly, future studies must accurately and simultaneously correlate the distribution of nanoparticle sizes and geometries present, for each material type, with any observed toxicological effects.
The purpose of this study was to investigate the cytotoxicity and genotoxicity of metal nanoparticles, focusing on silver nanoparticles due to their now widespread use in commercial products such as clothes and washing machines. Because of the potential for environmental exposures from these sources, we have initially focused on cultured cells from medaka, a small, teleost fish that is a well-established model aquatic organism (Hawkins et al., 2003; Shima and Mitani, 2004; Kasahara et al., 2007). Silver nanoparticles have been shown to be toxic to fish inducing death, changes in gene expression and embryotoxicity (Asharani et al., 2008; Griffitt et al., 2008, 2009). However, studies of the genotoxicity of these materials in fish model systems have not been done. Accordingly, we investigated the ability of silver nanoparticles to induce chromosome damage in cultured fish cells. In order to better understand possible correlations between the nanoparticle geometry (and aggregation state) and potential toxicity, we have also characterized the nanoparticle size distributions under all cellular treatment conditions.
2. Materials and methods
2.1. Chemicals and reagents
All plasticware was purchased from Corning, Inc. (Acton, MA). Potassium chloride, crystal violet, and demecolchicine were purchased from Sigma–Aldrich (St. Louis, MO). l-Glutamine, Gurr's buffer, Dulbecco's phosphate buffered saline (PBS), trypsin/EDTA, sodium pyruvate and penicillin/streptomycin were purchased from Invitrogen Corp. (Grand Island, NY). Giemsa stain was purchased from Biomedical Specialties, Inc. (Santa Monica, CA). Methanol and acetic acid were purchased from J.T. Baker (Phillipsburg, NJ). DMEM and Ham's F-12 (DMEM/F12) was purchased from Mediatech Inc. (Herndon, VA). Fetal Bovine Serum (FBS) was purchased from Hyclone (Logan, UT).
2.2. Cell culture
For these studies we used OLHNI2 cells, a medaka cell line established from adult fin tissue (Komura et al., 1988). These cells have a normal (for medaka) chromosome number of 48 and were maintained as adherent subconfluent monolayers in DMEM/F12 medium plus 20% fetal bovine serum, 1% l-glutamine, 1% penicillin/streptomycin and 0.1% sodium pyruvate. Cells were incubated at 33 °C in a 5% CO2-humidified environment.
2.3. Silver nanoparticle preparation
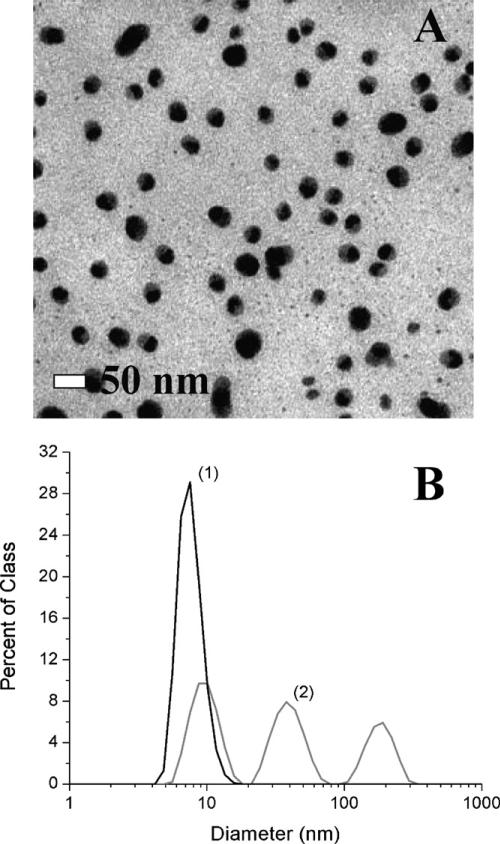
Silver nanospheres were synthesized using single-pot redox solution chemical techniques according to published methods (Turkevich et al., 1951; Pillai and Kamat, 2004). These methods make use of a soluble metal salt (silver nitrate), a reducing agent (sodium citrate) and a stabilizing agent (excess sodium citrate). Following the nucleation and nanoparticle growth, the stabilizing agent caps the particle leaving a negatively charged surface inhibiting aggregation (Rivas et al., 2001). Due to the sensitivity of the growth mechanism to contaminants, all reactants were filtered and monitored for purity prior to use. Briefly, 600 mg of sodium citrate was dissolved in 160 ml of 18 MΩ ultrapure water in a nitric acid cleaned 500 ml round bottom flask. This was brought to a temperature of 95 °C in an oil immersion bath. Simultaneously, 40 mg of silver nitrate was dissolved in 40 ml of 18 ΩM ultrapure water in a clean beaker. This was then heated to the same temperature and added under vigorous stirring. The temperature was maintained until the reaction was complete, usually less than 1 h. The solution was allowed to cool to room temperature. To ensure long-term nanoparticle size stability an excess of stabilizing agent was also used. Just prior to cell application, this excess was removed by dialysis in 18 ΩM ultrapure water, eliminating any unwanted effects of the stabilizing agent on the cell studies. The concentration (mg/L) of the silver dispersions was determined using inductively coupled plasma—atomic emission spectroscopy. In addition to providing an accurate assessment of the silver concentration, together with the particle sizing data, this information is used to determine the nanoparticle number density (# particles/cm3). Following this quantification, concentrations were normalized by dilution before treatment of the cells. Fig. 1A shows a transmission electron micro-graph (TEM) image of the as-prepared silver nanoparticles prior to use. From the image data the average diameter was estimated to be approximately 30 nm.
Fig. 1.
Silver nanosphere size distributions based on transmission electron microscopy and dynamic light scattering. This figure illustrates the typical sizes of the as-prepared silver nanoparticles. (A) Tunneling electron micrograph of filtered as-prepared silver colloids dispersed from water. The particles have an apparent mean diameter of ~30 nm. (B) Comparison of the size distributions of dilute silver colloids in complete media (0.03 μg/cm2) calculated based on number (line 1) and intensity (line 2) averages.
2.4. Characterization of silver nanoparticle in tissue culture media
The nanoparticles were fully characterized for size and dispersity before and after application to media or tissue culture conditions. This was accomplished using dynamic light scattering (DLS), UV–vis spectroscopy and tunneling electron microscopy (TEM). DLS measurements were made using a Malvern NanoZS where particle size distributions were determined on the basis of number, volume and scattering intensity. The same instrument (Malvern NanoZS) was used to determine the zeta-potential of the as-prepared particle solutions. UV–vis absorption spectroscopy (Ocean Optics Inc.) was used primarily to confirm the presence of an absorbance peak centered around 430 nm, consistent with that expected for the plasmon resonance of silver nanoparticles in the 20–30 nm size range (data not shown). Tunneling electron microscopy was used to confirm the particle sizes determined by the Zetasizer.
2.5. Cytotoxicity assay
Cytotoxicity was assessed with a colony forming assay based on our published methods (Wise et al., 2002, Goodale et al., 2008). 90,000 cells per well were seeded into 2.3 ml of cell culture medium per well in 6-well plates (9.5 cm2 surface area per dish) and allowed to resume growth. After 48 h, cells were then treated with 0.05–5 μg/cm2 of 30 nm silver nanoparticles for 24 h. After treatment, cells were reseeded at a density of 600 cells per 60 mm dish with 4 dishes per treatment. Cells were allowed to grow and form colonies, which were stained with crystal violet and counted. At least 3 independent experiments were conducted.
2.6. Genotoxicity assay
Genotoxicity was assessed by measuring chromosomal aberrations according to our published methods (Wise et al., 2002; Goodale et al., 2008). Briefly, 750,000 cells were seeded into 13 ml culture medium in 100 mm dishes (55 cm2 surface area per dish) and allowed to grow. After 48 h, cells were then treated with 0.05–5 μg/cm2 of 30 nm silver nanospheres for 24 h. Two hours before the end of treatment, demecolchicine (0.1 μg/ml) was added to arrest cells in metaphase and the cells were harvested for metaphase analysis. 0.075 M KCl was added to the cells for 23 min to swell the nuclei followed by fixation in 3:1 methanol:acetic acid. Cells were then dropped on clean, wet slides and scored for chromosome aberrations. At least 3 independent experiments were conducted with one hundred metaphases analyzed for each treatment. Chromosome aberrations were scored by standard criteria (Wise et al., 2002; Goodale et al., 2008). Percent damage was defined as the percentage of metaphases with at least one chromosomal aberration. Total damage was defined as the total number of aberrations in 100 metaphases. During the scoring of the chromosome damage the number of aneuploid cells was also tracked.
2.7. Statistical analysis
For each mean value, standard errors were calculated based on the unbiased estimate of variance. Differences among means were evaluated using Student's t-test and 95% confidence limits, based on the approximate t statistic proposed by Cochran and Cox and Satterthwaite's approximate degrees of freedom for unequal variances (Satterthwaite, 1946; Cochran and Cox, 1950). The criterion for statistical significance was p < 0.05. The LC50 for cytotoxicity and its 95% confidence limits were calculated using the SAS procedure PROC PROBIT. All analyses were conducted using the SAS software package (SAS, 2004). Since all comparisons among means were considered to be of substantive interest a priori, no adjustment for multiple comparisons was incorporated into the analysis (Rothman, 1990).
3. Results
3.1. Characterizations of the particles
The size distributions of the nanoparticles in: complete medium (serum-containing), serum-free medium (our controls) and in the extracellular medium (complete) of cells as a function of nanoparticle concentration were compared using dynamic light scattering (DLS). In particular, the extent to which aggregation varied between cellular and control samples was assessed in order to affect meaningful comparisons. While DLS does allow for quantitative assessment of the size distribution of nanoparticles present in solution, these distributions are calculated based on a statistical model and interpretation of the data must be done with care. For example, the size distributions for dilute silver colloids in complete media (0.03 ivg/cm2) calculated based on number and intensity are shown in Fig. 1B. Based solely on the number distribution shown in Fig. 1B(1), one would conclude that the mean nanoparticle diameter is approximately 8 nm, inconsistent with the TEM data presented in Fig. 1A, suggesting that the particle diameter was reduced. However, if one calculates the size distribution based on scattering intensity, as shown in Fig. 1B(2), a mean diameter of ~30 nm is obtained in reasonable agreement with the TEM data. The apparent discrepancy arises due to the differing weighting factors for each distribution. In the former case, the distribution is weighted by the relative number of particles in each size class. In this case, the distribution is biased towards those particles which are most abundant. Hence, the peak at 8 nm is likely a result of other abundant nanoparticulates intrinsic to the media and not representative of the silver nanoparticles present. In contrast, the intensity distribution is weighted by which particles generate the largest scattering intensity (scaled by the volume2 in each size class). In this case, the presence of large particles or aggregates can be assessed despite their small relative population. As shown in Fig. 1B(2), multiple peaks are now evident and a mean diameter of 32 nm is obtained in better agreement with the TEM data. In order to quantitatively compare cellular and control data, an assessment of the extent of aggregation is critical as a small number of aggregates can effectively deplete the available concentration of non-aggregating (and potentially toxic) nanoparticles. A detailed description of the relevant size distribution calculations and their interpretation can be found in the text by Berne and Pecora (1975).
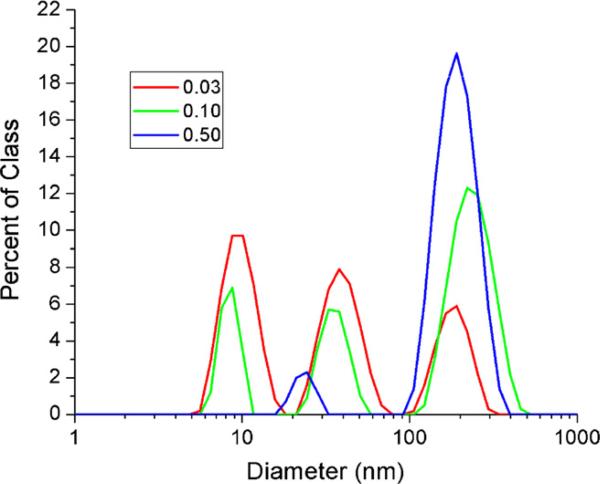
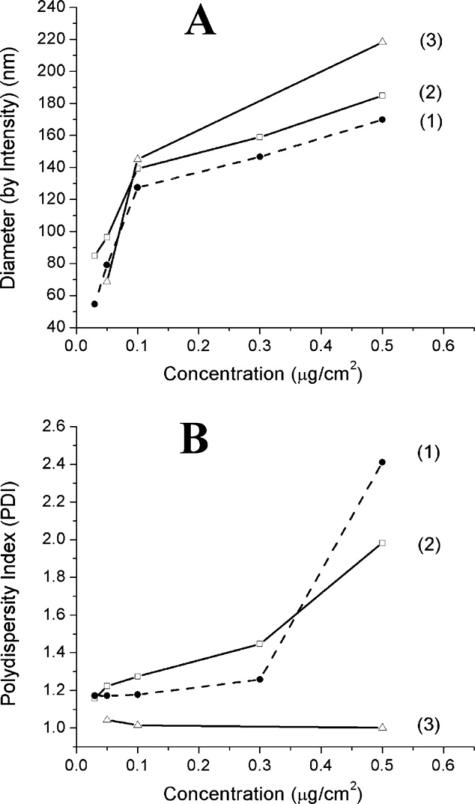
While the first and second peaks in Fig. 1B(2) are likely due to the medium and our original nanoparticle colloid, respectively, the third peak is most likely due to aggregation of silver colloids. It is known that aggregation can be induced by the presence of electrolyte ions or by a shift in the equilibrium surface concentration of citrate ions after the excess citrate is removed via dialysis and the colloid is diluted into media (Enusten and Turkevich, 1963; Evans and Wennerström, 1999). If this peak is indeed due to aggregation of smaller particles then an increase in the initial nanoparticle concentration should result in a larger relative population of aggregates. This is evidenced in Fig. 2 which shows the size distributions, calculated based on intensity, for increasing nanoparticle doses. As expected with increasing dose, the formation of larger (~200 nm) nanoparticle aggregates increases, whereas the contribution of smaller particles decreases monotonically. This concentration-dependent aggregation is observed in all sample types, as shown in Fig. 3A, and is therefore not a result of a cellular mechanism. In fact, of the three samples measured, the resulting aggregates appeared to be slightly smaller (or less abundant) when the particles were incubated with complete media in the presence of cells and largest when the particles were incubated as a control in serum-free media. In fact, this effect has been previously observed, where the presence of serum was shown to inhibit aggregation (Kühnel et al., 2009). According to this work, adsorption of protein from the medium decreased the zeta-potential, reducing the effect of charge stabilization, which resulted in a significant stabilizing effect due to steric repulsion.
Fig. 2.
Silver nanosphere size distributions from dynamic light scattering based on intensity. This figure shows a comparison of nanoparticle size distributions in complete media, without cells present, for 0.03, 0.10 and 0.5 μg/cm2. As expected with increasing concentration, the formation of larger (~200 nm) nanoparticle aggregates increases, whereas the contribution of smaller particles (<10 nm), or media particulates, decreases monotonically.
Fig. 3.
Effect of experimental conditions on silver nanosphere polydispersity. This figure shows how the dispersity of the silver nanoparticle population changes with experimental conditions. The polydispersity index of a colloid is a unitless parameter calculated as the ratio of the volume average diameter to the number average diameter (Dv/Dn), which by definition must be greater than 1. Both cell culture and control samples show increases in polydispersity due to the presence of serum. (A) Intensity weighted size distributions of nanoparticles at various concentrations. (B) Calculated polydispersity for all sample types versus nanoparticle concentration: 1 = nanoparticles in complete extracellular media; 2 = nanoparticles in complete media; 3 = nanoparticles in serum-free media.
Owing to the difficulty in interpreting size distributions, it is often informative to ask how the dispersity of the population is changing with experimental conditions. The polydispersity of a colloidal suspension is a unitless parameter calculated as the ratio of the volume average diameter (volume averaged distributions not shown) to the number average diameter (Dv/Dn), which by definition must be >1. A summary of the calculated polydispersity for all sample types is given in Fig. 3B. It is immediately evident that both the complete extracellular media and complete media (1 and 2, respectively) samples show significant increases in polydispersity. The sample which did not contain serum (3), however, shows almost no change in polydispersity. This appears to be in contrast to the data shown in Fig. 3A. However, the PDI is not a direct measure of the average nanoparticle size, but rather how the nanoparticle sizes within a sample are distributed (see description of Figs. 1 and 2 above). For the serum-free samples, aggregation due to the presence of electrolyte ions in the media appears to result in a relatively narrow size distribution suggestive of Ostwald ripening (Madras and McCoy, 2003). For the serum-containing samples two distinct populations are being measured; proteins found in the serum and the silver nanoparticles. At relatively low silver nanoparticle doses, aggregation is minimal (as described above) and the resulting PDI reflects the average of the large relative population of proteins and the less abundant nanoparticles. At larger relative doses, the relative availability of proteins is lower and nanoparticle aggregation increases. This has the effect of dramatically shifting the volume weighted mean relative to the number weighted mean, increasing the PDI. In all, this suggests that the relative concentrations of nanoparticles, protein from serum, and electrolytes from media dictates the nature of aggregation in a somewhat complicated manner.
In all, some concentration-dependent aggregation appears to be present in all sample types. This is consistent with what one expects for particles carrying relatively small negative surface charge. The zeta-potential of the as-prepared particles was determined to be approximately −20 mV, in good agreement with previously reported results for citrate reduced silver particles in this size range (data not shown). Though not large, this surface charge is sufficient to promote nanoparticle stability by simple charge repulsion. In the presence of electrolyte ions found in the cell culture environment, this charge is at least partially screened and the effective nanoparticle surface potential is consequently reduced. As a result of this charge reduction aggregation is expected. When serum is included, some steric stability against aggregation results, but is ultimately overwhelmed at larger nanoparticle concentrations. Hence, at higher nanoparticle doses the likelihood of observing larger aggregates is expected to increase, as is indicated by both an increase in average particle diameter and polydispersity index. The extent of aggregation and the average nanoparticle diameters, appear to be approximately the same for all samples prepared at similar doses.
3.2. Silver nanoparticles are cytotoxic to medaka cells
Silver nanospheres were cytotoxic to medaka cells in a concentration-dependent manner (Fig. 4). Treatments of 0.05, 0.3, 0.5, 3 and 5 μg/cm2 induced 80, 45.7, 24.3, 1 and 0.1% survival, respectively. Using these values we determined an LC50 for cytotoxicity to be 0.33 μg/cm2 (95% confidence interval: 0.31–0.35).
Fig. 4.
Silver nanospheres are cytotoxic to fish cells. This figure shows that 30 nm diameter silver nanospheres induced concentration-dependent cytotoxicity in medaka cells measured by a colony forming assay. Data represent the mean of a minimum of 3 independent experiments ± standard error of the mean. *Significantly (p < 0.05) different compared to control.
3.3. Silver nanoparticles are genotoxic to medaka cells
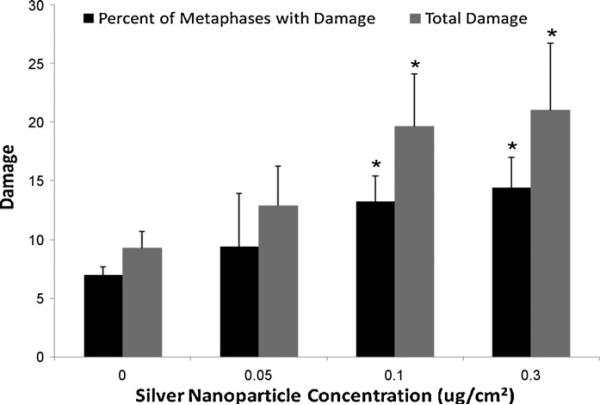
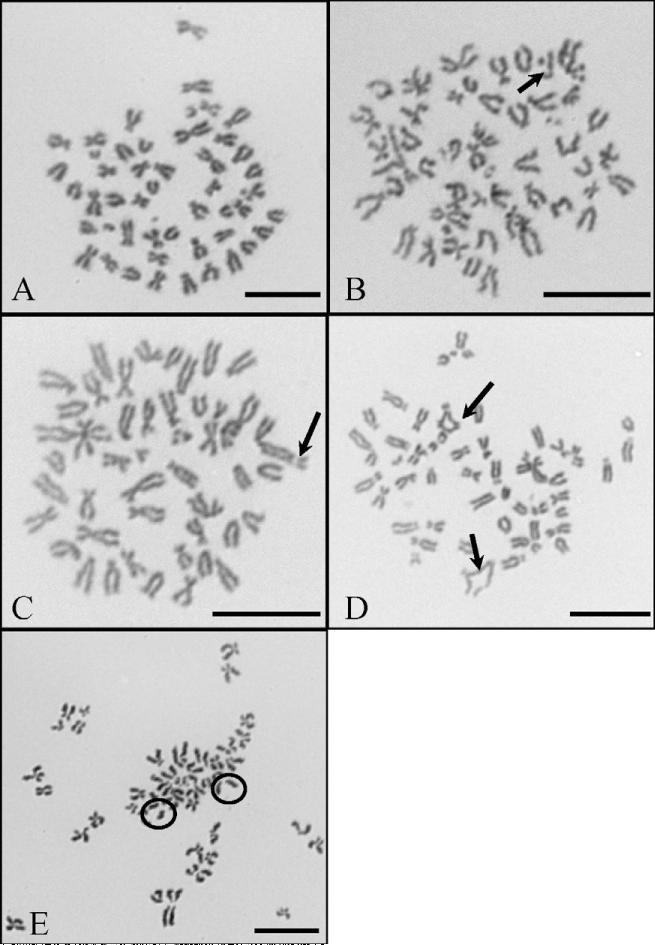
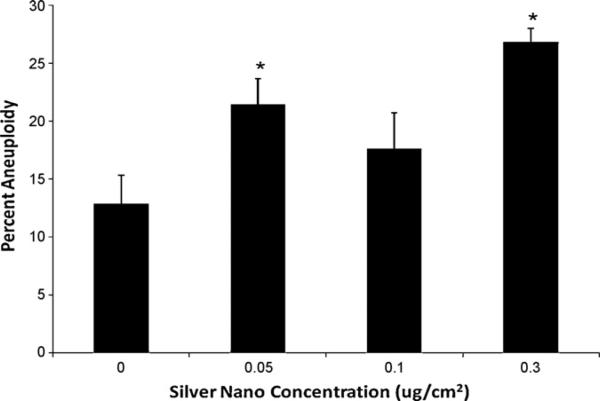
Silver nanospheres induced a concentration-dependent genotoxic effect in OLHNI2 cells considering both the percent of metaphases with damage and the total damage in 100 metaphases (Figs. 5 and 6). Treatments of 0, 0.05, 0.1 and 0.3 μg/cm2 induced 8, 10.8, 16 and 15.8% metaphases with damage and 10.8, 15.6, 24 and 24 total aberrations in 100 metaphases, respectively. Metaphase cells could not be obtained at a concentration of 0.5 μg/cm2, indicating cell cycle arrest was occurring (data not shown). The spectrum of damage included chromatid lesions, isochromatid lesions, chromatid exchanges and centromere spreading (Fig. 6). Chromatid lesions were most common and the only form of damage for which a statistically significant dose–response was observed. Chromatid exchanges, though not statistically significant, were rare in controls and increased in a concentration-dependent manner. Isochromatid lesions and centromere spreading were observed but did not differ significantly from the control. Silver nanospheres also induced a concentration-dependent increase in the percentage of aneuploid cells (Fig. 7).
Fig. 5.
Silver nanospheres are genotoxic to fish cells. This figure shows that 30 nm diameter silver nanospheres induced a concentration-dependent increase in chromosome aberrations in medaka cells, considered as either the percent of metaphases with damage or the total amount of chromosome damage in 100 metaphases. Data represent the mean of at least 3 independent experiments ± standard error of the mean. 100 metaphases were scored per concentration. *Significantly (p < 0.05) different compared to control.
Fig. 6.
Representative silver nanospheres induced chromosome aberrations in fish cells. These pictures are representative examples of silver nanoparticle-induced chromosome damage in OLHNI2 cells analyzed at 1000× magnification. Bars = 10 μm. (A) Normal OLHNI2 metaphase. (B) Chromatid lesion (arrow) after exposure to 0.3 μg/cm2 silver nanoparticles. (C) Isochromatid lesion (arrow) after exposure to 0.3 μg/cm2 silver nanoparticles. (D) Chromatid exchanges (arrows) after exposure to 0.3 μg/cm2 silver nanoparticles. (E) Centromere spreading (circles) after exposure to 0.05 μg/cm2 silver nanoparticles.
Fig. 7.
Silver nanospheres are aneuploidigenic to fish cells. This figure shows that 30 nm diameter silver nanospheres induced an increase in aneuploidy in medaka cells. Data represent the mean of at least 3 independent experiments ± standard error of the mean. 100 hundred diploid metaphases were analyzed for each treatment. *Significantly (p < 0.05) different compared to control.
4. Discussion
Currently, silver nanoparticles are the most commonly used nanomaterial (Woodrow Wilson International Center for Scholar, 2008). They are used extensively in clothing, water purification, baby products (e.g. nipples and bottles) personal care products (e.g. shampoos, toothpastes, deodorants, etc.), bedding and appliances (e.g. washing machines, humidifiers and refrigerators) (Woodrow Wilson International Center for Scholar, 2008). The major reason for their use is their antifungal and antimicrobial effects. However, while they are known to be toxic to microbes and fungi, their toxicity to vertebrates is under-investigated and consequently poorly understood.
Previous reports show that silver nanoparticles can be toxic to fish. One report found that 20–30 nm silver nanopowder induced a 48 h LC50 of 7.07–7.20 μg/ml in zebrafish (Danio rerio) depending on whether the exposure was to an adult or juvenile fish (Griffitt et al., 2008). This treatment also induced changes in gene expression, but did not affect gill filament length (Griffitt et al., 2009). A third study reported that 5–20 nm silver nanoparticles capped with starch or bovine serum albumin induced embryotoxicity (Asharani et al., 2008). Our data are consistent with these reports showing that silver nanospheres are also cytotoxic and clastogenic to fish cells in a concentration-dependent manner. Our data are the first to report that silver nanoparticles induce chromosomal aberrations in medaka cells. They show that silver nanospheres induce a spectrum of chromosome damage that includes chromatid lesions and chromatid exchanges. They are also consistent with a recent report that silver nanoparticles can induce micronuclei in human cells (Asharani et al., 2009).
Our cytotoxicity data are consistent with previous reports of cytotoxicity in other cell lines and extend the cytotoxic measure to include clonogenic cytotoxicity effects. Previously, a 6 h exposure to silver nanoparticles induced apoptosis and inhibited cell growth in hamster kidney and human colon cancer cells (Gopinath et al., 2008). A 24 h exposure to silver nanoparticles induced mitochondrial dysfunction and membrane leakage in immortalized rat liver cells (Hussain et al., 2005). Similarly, a 48 h exposure induced apoptosis and mitochondrial dysfunction in large T-antigen immortalized mouse testes cells (Braydich-Stolle et al., 2005). Finally, a 24 h exposure of human fibrosarcoma (HT-1080) or human skin carcinoma (A431) cells to silver nanospheres induced apoptosis, oxidative stress and cytotoxicity (Arora et al., 2008). Considered all together, the data indicate that silver nanoparticles can be cytotoxic to fish and mammalian cells.
Our study is also consistent with data that indicate silver nanoparticles are genotoxic to mammalian cells (Ahamed et al., 2008). This study reported that silver nanoparticles induced DNA double strand breaks in mouse embryonic cells consistent with our observed chromosomal aberrations. Interestingly, these breaks increased when bare silver nanoparticles were coated with polysaccharide suggesting that surface coating may enhance the genotoxicity of these materials.
Our study reports that silver nanoparticles can be cytotoxic and genotoxic to fish cells. This finding is consistent with previous reports of titanium nanoparticle-induced genotoxicity in rainbow trout cells (Vevers and Jha, 2008; Reeves et al., 2008; Singh et al., 2009). It is also consistent with a report showing that nano-sized tungsten carbide particles induce cytotoxicity in a rainbow trout gill cell line (Kühnel et al., 2009). It is interesting to note that the Vevers and Jha study found no chromosomal damage after titanium nanoparticle exposure in the rainbow trout cells measured by a micronucleus assay, while we did observe such damage after silver nanoparticle exposure in medaka cells using a chromosomal aberration study. The explanation for this difference is uncertain and may reflect either a different genotoxic potential for silver versus titanium nanoparticles or it may simply reflect the greater sensitivity of the chromosomal aberration assay compared to the micronucleus assay. It should be noted that medaka fish have been used extensively as a model for human health (Hawkins et al., 2003; Shima and Mitani, 2004; Kasahara et al., 2007). Thus, these data have implications for the potential effects of silver nanoparticles on aquatic species, and they also imply that there could be a concern for humans as well. Further research is aimed at understanding the mechanism of genotoxicity with respect to particle internalization and dissolution and the impact of modulating size and functionalization of the particles.
Acknowledgements
We thank Christy Gianios Jr. for information technology support and Amie Holmes for technical support.
Funding
This work was supported by a grant from the Munson foundation (JPW), a subcontract from Texas State University—San Marcos NOAA grant NA05NOS4261162 (JPW), the Educational Outreach Award of the Maine EPSCoR FBRI Research Project (JPW) and the Maine Center for Toxicology and Environmental Health (JPW). This work was also supported in part by the Memorial Sloan Kettering Cancer Center (MDM).
References
- Ahamed M, Karns M, Goodson M, Rowe J, Hussain SM, Schlager JJ, Hong Y. DNA damage response to different surface chemistry of silver nanoparticles in mammalian cells. Toxicol. Appl. Pharm. 2008;233:404–410. doi: 10.1016/j.taap.2008.09.015. [DOI] [PubMed] [Google Scholar]
- Arora S, Jain J, Rajwade JM, Paknikar KM. Cellular responses induced by silver nanoparticles: in vitro studies. Toxicol. Lett. 2008;179:93–100. doi: 10.1016/j.toxlet.2008.04.009. [DOI] [PubMed] [Google Scholar]
- Asharani PV, Wu YL, Gong Z, Valiyaveettil S., 1 Toxicity of silver nanoparticles in zebrafish models. Nanotechnology. 2008;19:1–8. doi: 10.1088/0957-4484/19/25/255102. [DOI] [PubMed] [Google Scholar]
- Asharani PV, Mun GLK, Hande MP, Valiyaveettil S. Cytotoxicity and genotoxicity of silver nanoparticles in human cells. ACS Nano. 2009;3:279–290. doi: 10.1021/nn800596w. [DOI] [PubMed] [Google Scholar]
- Berne B, Pecora R. Dynamic Light Scattering: With Applications to Chemistry, Biology, and Physics. Courier Dover Publications; 1975. [Google Scholar]
- Bishop PT. The use of gold mercaptides for decorative precious metal applications. Gold Bull. 2002;35:89–98. [Google Scholar]
- Bourrinet P, Bengele HH, Bonnemain B, Dencausse A, Idee J-M, Jacobs PM, Lewis JM. Preclinical safety and pharmacokinetic profile of ferumoxtran-10, an ultrasmall superparamagnetic iron oxide magnetic resonance contrast agent. Invest. Radiol. 2006;41:313–324. doi: 10.1097/01.rli.0000197669.80475.dd. [DOI] [PubMed] [Google Scholar]
- Braydich-Stolle L, Hussain S, Schlager JJ, Hofmann MC. In vitro cytotoxicity of nanoparticles in mammalian germline stem cells. Toxicol. Sci. 2005;88:412–419. doi: 10.1093/toxsci/kfi256. [DOI] [PMC free article] [PubMed] [Google Scholar]
- Cochran WG, Cox GM. Experimental Designs. John Wiley & Sons, Inc.; New York: 1950. [Google Scholar]
- Enusten BV, Turkevich J. Coagulation of colloidal gold. J. Am. Chem. Soc. 1963;85(21):3317–3328. [Google Scholar]
- Evans DF, Wennerström H. The Colloidal Domain: Where Physics, Chemistry, Biology, and Technology Meet. 2nd ed. Wiley; New York: 1999. pp. 401–538. Chapter 8. [Google Scholar]
- Fuller SB, Wilhelm EJ, Jacobson JM. Ink-jet printed nanoparticle micro-electromechanical systems. J. Microelectromech. Syst. 2002;11:54–60. [Google Scholar]
- Goodale BC, Walter R, Pelsue SR, Thompson WD, Wise SS, Winn RN, Mitani H, Wise JP., Sr. The cytotoxicity and genotoxicity of hexavalent chromium in medaka (Oryzias latipes) cells. Aquat. Toxicol. 2008;87:60–67. doi: 10.1016/j.aquatox.2008.01.014. [DOI] [PubMed] [Google Scholar]
- Goodman CM, McCusker CD, Yilmaz T, Rotello VM. Toxicity of gold nanoparticles functionalized with cationic and anionic side chains. Bioconjug. Chem. 2004;15:897–900. doi: 10.1021/bc049951i. [DOI] [PubMed] [Google Scholar]
- Gopinath P, Gogoi SK, Chattopadhyay A, Ghosh SS. Implications of silver nanoparticle induced cell apoptosis for in vitro gene therapy. Nanotechnology. 2008;19:1–10. doi: 10.1088/0957-4484/19/7/075104. [DOI] [PubMed] [Google Scholar]
- Griffitt RJ, Hyndman K, Denslow ND, Barber DS. Comparison of molecular and histological changes in zebrafish gills exposed to metallic nanoparticles. Toxicol. Sci. 2009;107:404–415. doi: 10.1093/toxsci/kfn256. [DOI] [PubMed] [Google Scholar]
- Griffitt RJ, Luo J, Gao J, Bonzongo J-C, Barber DS. Effects of particle composition and species on toxicity of metallic nanomaterials in aquatic organisms. Environ. Toxicol. Chem. 2008;27:1972–1978. doi: 10.1897/08-002.1. [DOI] [PubMed] [Google Scholar]
- Haruta M. Gold rush. Nature. 2005;437:1098–1099. doi: 10.1038/4371098a. [DOI] [PubMed] [Google Scholar]
- Hawkins WE, Walker WW, Fournie JW, Manning CS, Krol RM. Use of the Japanese medaka (Oryzias latipes) and guppy (Poecilia reticulate) in carcinogenesis testing under national toxicology program protocols. Toxicol. Pathol. 2003;31:88–91. doi: 10.1080/01926230390174968. [DOI] [PubMed] [Google Scholar]
- Hood E. Nanotechnology, diving into the unknown. Environ. Health Perspect. 2004;112:A747–A749. doi: 10.1289/ehp.112-a740. [DOI] [PMC free article] [PubMed] [Google Scholar]
- Hughes MD, Xu YJ, Jenkins P, McMorn P, Landon P, Enache DI, Carley AF, Attard GA, Hutchings GJ, King F, Stitt EH, Johnston P, Griffin K, Keily CJ. Tunable gold catalysts for selective hydrocarbon oxidation under mild conditions. Nature. 2005;437:1132–1135. doi: 10.1038/nature04190. [DOI] [PubMed] [Google Scholar]
- Hussain SM, Hess KL, Gearhart JM, Geiss KT, Schlager JJ. In vitro toxicity of nanoparticles in BRL 3A rat liver cells. Toxicol. In Vitro. 2005;19:975–983. doi: 10.1016/j.tiv.2005.06.034. [DOI] [PubMed] [Google Scholar]
- Kasahara M, Naruse K, Sasaki S, Nakatani Y, Qu W, Ahsan B, Yamada T, Nagayasu Y, Doi K, Kasai Y, Jindo T, Kobayashi D, Shimada A, Toyoda A, Kuroki Y, Fujiyama A, Sasaki T, Shimizu A, Asakawa S, Shimizu N, Hashimoto S, Yang J, Lee Y, Matsushima K, Sugano S, Sakaizumi M, Narita T, Ohishi K, Haga S, Ohta F, Nomoto H, Nogata K, Morishita T, Endo T, Shin-I T, Takeda H, Morishita S, Kohara Y. The medaka draft genome and insights into vertebrate genome evolution. Nature. 2007;477:714–719. doi: 10.1038/nature05846. [DOI] [PubMed] [Google Scholar]
- Kühnel D, Busch W, Meisner T, Springer A, Potthoff A, Richter V, Gelinsky M, Scholz S, Schirmer K. Agglomeration of tungsten carbide nanoparticles in exposure medium does not prevent uptake and toxicity toward a tainbow trout gill cell line. Aquat. Toxicol. 2009;93:91–99. doi: 10.1016/j.aquatox.2009.04.003. [DOI] [PubMed] [Google Scholar]
- Komura J, Mitani H, Shima A. Fish cell culture, establishment of two fibroblast-like cell lines (OL-17 and OL-32) from fins of the medaka, Oryzias latipes. In Vitro Cell Dev. Biol. 1988;24:294–298. [Google Scholar]
- Lam CW, James JT, McCluskey R, Hunter RL. Pulmonary toxicity of single-wall carbon nanotubes in mice 7 and 90 days after intratracheal instillation. Toxicol. Sci. 2004;77:126–134. doi: 10.1093/toxsci/kfg243. [DOI] [PubMed] [Google Scholar]
- Law M, Greene LE, Johnson JC, Saykally R, Yang P. Nanowire dye-sensitized solar cells. Nat. Lett. 2005;4:455–459. doi: 10.1038/nmat1387. [DOI] [PubMed] [Google Scholar]
- Madras G, McCoy BJ. Distribution kinetics of Ostwals ripening at large volume fraction and with coalescence. J. Coll. Interf. Sci. 2003;261(2):423–433. doi: 10.1016/S0021-9797(03)00129-2. [DOI] [PubMed] [Google Scholar]
- Maxwell DJ, Taylor JR, Nie S. Self-assembled nanoparticle probes for recognition and detection of biomolecules. J. Am. Chem. Soc. 2002;124:9606–9612. doi: 10.1021/ja025814p. [DOI] [PubMed] [Google Scholar]
- Monteiro-Riviere NA, Nemanich RJ, Inman AO, Wang YY, Riviere JE. Multi-walled carbon nanotube interactions with human epidermal keratinocytes. Toxicol. Lett. 2005;155:377–384. doi: 10.1016/j.toxlet.2004.11.004. [DOI] [PubMed] [Google Scholar]
- Muller J, Huaux F, Moreau FN, Misson P, Heilier JF, Delos M, Arras M, Fonseca A, Nagy JB, Lison D. Respiratory toxicity of multi-wall carbon nanotubes. Toxicol. Appl. Pharmacol. 2005;207:221–231. doi: 10.1016/j.taap.2005.01.008. [DOI] [PubMed] [Google Scholar]
- Oberdorster G, Sharp Z, Atudorei V, Elder A, Gelein R, Kreyling W, Cox C. Translocation of inhaled ultrafine particles to the brain. Inhal. Toxicol. 2004;16:437–445. doi: 10.1080/08958370490439597. [DOI] [PubMed] [Google Scholar]
- Pillai ZS, Kamat PV. What factors control the size and shape of silver nanoparticles in the citrate ion reduction method? J. Phys. Chem. B. 2004;108:945–951. [Google Scholar]
- Reeves JF, Davies SJ, Dodd NJF, Jha AN. Hydroxyl radicals (OH) are associated with titanium dioxide (TiO2) nanoparticle-induced cytotoxicity and oxidative DNA damage in fish cells. Mutat. Res. 2008;640:113–122. doi: 10.1016/j.mrfmmm.2007.12.010. [DOI] [PubMed] [Google Scholar]
- Rivas L, Sanchez-Cortes S, García-Ramos JV, Morcillo G. Growth of silver colloidal particles obtained by citrate reduction to increase the Raman enhancement factor. Langmuir. 2001;17:574–577. [Google Scholar]
- Rothman KJ. No adjustments are necessary for multiple comparisons. Epidemiology. 1990;1:43–46. [PubMed] [Google Scholar]
- Sadeghiania N, Barbosaa LS, Silvaa LP, Azevedoa RB, Moraisb PC, Lacavaa ZGM. Genotoxicity and inflammatory investigation in mice treated with magnetite nanoparticles surface coated with polyaspartic acid. J. Magn. Magn. Mater. 2005;289:466–468. [Google Scholar]
- Salata O. Applications of nanoparticles in biology and medicine. J. Nanobiotechnol. 2004;2:3–8. doi: 10.1186/1477-3155-2-3. [DOI] [PMC free article] [PubMed] [Google Scholar]
- SAS Institute, Inc. SAS/STAT 9.1 User's Guide. SAS Institute, Inc.; Cary, NC: 2004. [Google Scholar]
- Satterthwaite FW. An approximate distribution of estimates of variance components. Biometrics Bull. 1946;2:110–114. [PubMed] [Google Scholar]
- Sayes CM, Fortner JD, Guo W, Lyon D, Boyd AM, Ausman KD, Tao YJ, Sitharaman B, Wilson LJ, Hughes JB, West JL, Colvin VL. The differential cytotoxicity of water-soluble fullerenes. Nano Lett. 2004;4:1881–1887. [Google Scholar]
- Shima A, Mitani H. Medaka as a research organism, past, present and future. Mech. Dev. 2004;121:599–604. doi: 10.1016/j.mod.2004.03.011. [DOI] [PubMed] [Google Scholar]
- Shiraishi Y, Maeda K, Yoshikawa H, Xu J, Toshima N, Kobayashi S. Frequency modulation response of a liquid-crystal electro-optic device doped with nanoparticles. Appl. Phys. Lett. 2002;81:2845–2847. [Google Scholar]
- Shvedova AA, Castranova V, Kisin ER, Schwegler-Berry D, Murray AR, Gandelsman VZ, Maynard A, Baron P. Exposure to carbon nanotube material, assessment of nanotube cytotoxicity using human keratinocyte cells. J. Toxicol. Environ. Health A. 2003;66:1909–1926. doi: 10.1080/713853956. [DOI] [PubMed] [Google Scholar]
- Singh N, Manshian B, Jenkins GJS, Griffiths SM, Williams PM, Maffeis TGG, Wright CJ, Doak SH. NanoGenotoxicology: the DNA damaging potential of engineered nanomaterials. Biomaterials. 2009;30:3891–3914. doi: 10.1016/j.biomaterials.2009.04.009. [DOI] [PubMed] [Google Scholar]
- Turkevich J, Stevenson PC, Hillier J. A study of the nucleation and growth processes in the synthesis of colloidal gold. Discuss Faraday Soc. 1951;11:55. [Google Scholar]
- Vevers WF, Jha AN. Genotoxic and cytotoxic potential of titanium dioxide (TiO2) nanoparticles on fish cells in vitro. Ecotoxicology. 2008;17:410–420. doi: 10.1007/s10646-008-0226-9. [DOI] [PubMed] [Google Scholar]
- Warheit DB, Laurence BR, Reed KL, Roach DH, Reynolds GAM, Webb TR. Comparative pulmonary toxicity assessment of single-wall carbon nanotubes in rats. Toxicol. Sci. 2004;77:117–125. doi: 10.1093/toxsci/kfg228. [DOI] [PubMed] [Google Scholar]
- Wise JP, Sr., Wise SS, Little JE. The cytotoxicity and genotoxicity of particulate and soluble hexavalent chromium in human lung cells. Mutat. Res. 2002;517:221–229. doi: 10.1016/s1383-5718(02)00071-2. [DOI] [PubMed] [Google Scholar]
- Woodrow Wilson International Center for Scholars The Project on Emerging Nanotechnlogies. Consumer Products. [2008 May 31];An Inventory of Nanotechnology-Based Consumer Products Currently on the Market. 2008 http://www.nanotechproject.org/inventories/consumer/


