Abstract
Background & Aims
FOXP3+ regulatory T cell (Tregs) prevent inflammation, but are paradoxically increased in ulcerative colitis (UC). Local T cell activation has been hypothesized to account for increased FOXP3 expression in colon lamina propria (LP) T cells.
Methods
To see if human FOXP3+ LP T cells are an activated fraction of otherwise FOXP3− effector T cells (Teff) and explore their clonal diversity in health and disease, we deep sequenced clonally unique T cell receptor (TCR) hypervariable regions of FOXP3+ and FOXP3− CD4+ T cell subpopulations from inflamed versus non-inflamed colon LP or mesenteric lymph nodes (MLN) of patients with or without UC.
Results
The clonal diversity of each LP T cell population was no different between patients with versus without UC. Repertoire overlap was only seen between a minority of FOXP3+ and FOXP3− cells, including recently activated CD38+ cells and Th17-like CD161+ Teff, but this repertoire overlap was no different between patients with versus without UC, and was no larger than the overlap between Helios− and Helios+ FOXP3+ cells.
Conclusions
Thus, at steady state, only a minority of FOXP3+, and particularly Helios+, T cells share a TCR sequence with FOXP3− effector populations in the colon LP, even in UC, revealing distinct clonal origins for LP Tregs and effector T cells in humans.
Keywords: Helios, Th17, CD38, CD161
Introduction
CD4+CD25+FOXP3+ regulatory T cells (Tregs) have been the subject of intense investigation for over a decade now, due to their central role in maintaining immune tolerance (4). This role is particularly evident in the gastrointestinal (GI) tract, as mice engineered to lack Tregs, or humans born with mutations in the FOXP3 gene, develop severe GI inflammation (3;20;25). Thus, defects in Tregs have been proposed to underlie the pathogenesis of the human inflammatory bowel diseases (IBDs), Crohn’s disease and ulcerative colitis (UC). However, a paradoxically increased frequency of FOXP3+ Tregs exists in the inflamed GI mucosa of patients with these conditions (14). Furthermore, Tregs isolated from the blood, mesenteric lymph nodes (MLN) or GI lamina propria (LP) of IBD patients demonstrate intact suppressive activity against other T cells in response to polyclonal in vitro stimulation (15;19;27).
It has become evident in recent years that FOXP3 does not identify a monomorphic Treg population, but rather distinct subpopulations. In particular, the finding that FOXP3 expression can be induced in peripheral FOXP3−CD4+ T cells upon activation (23;24) has led to the term “induced” Tregs (iTregs), to distinguish such cells from thymically-derived, “natural” Tregs (nTregs). Whether iTregs possess the same suppressive activity as nTregs is controversial (2;7), but iTregs appear to be enriched within the GI tract (6;17;21), making an understanding of iTregs critical to interpretation of existing data on mucosal FOXP3+ Tregs in IBD. Indeed, a paradoxically increased number of FOXP3+ cells observed in the intestinal mucosa of IBD patients (14–16;19;27) has been hypothesized to simply be a reflection of rampant T cell activation resulting in an increased number of iTregs which may lack stable suppressor function. The transcription factor Helios has been proposed as a convenient marker with which to distinguish nTreg (Helios+) from iTregs (Helios−) at the single-cell level (22), although the reliability of this marker has proven controversial in a number of experimental systems (1;9;10).
Like other T cells, Tregs each express a unique T cell receptor (TCR), which is central to their function. However, unlike conventional T cells, Tregs inhibit rather than promote inflammation when their TCR is ligated by a peptide antigen (4). The TCR repertoire of a population of Tregs thus determines their ability to respond to antigens. Because existing data on Tregs in IBD has been obtained from polyclonal populations, without knowledge of their TCR repertoire, it is possible that defects or skewing in the antigen-specificity of these cells may prevent them from suppressing inflammation in IBD in vivo. Furthermore, because T cells can clonally expand or be deleted upon activation, the presence of over-represented or under-represented TCR’s within a TCR repertoire may suggest that certain antigen-specific clones are being selectively expanded or eliminated, respectively. Furthermore, because the TCR sequence of a mature T cell is unique and immutable, its appearance in multiple phenotypically distinct T cell populations indicates plasticity of a given clone’s phenotype across multiple cell types.
To determine if UC is associated with abnormal skewing of the TCR repertoire in intestinal Treg populations, we sequenced and compared the TCR Vβ hypervariable domain repertoires of Helios+ and Helios− FOXP3+ CD4+, as well as FOXP3− CD4+ non-Tregs, from the LP of patients with and without UC. Among UC patients, the repertoires of such cells were compared between both inflamed and non-inflamed segments of colon, as well as MLN. In so doing, we were able to accurately quantify the clonal diversity and repertoire overlap of CD4+ FOXP3+ and FOXP3− subsets in healthy and diseased mucosa, making comparisons across both anatomically and phenotypically distinct T cell populations. While an excess frequency of FOXP3+ Tregs was confirmed in the inflamed UC LP specimens, the ratio of Helios+ to Helios− FOXP3+ T cells was similar in all specimens. Furthermore, there was more TCR repertoire overlap between Helios+ and Helios− FOXP3+ T cells than between any FOXP3+ and FOXP3− cells, arguing that FOXP3+ cells in the intestine are derived from populations clonally distinct from effector T cells, regardless of Helios expression or inflammation. Taken together, this data indicates that the paradoxically increased FOXP3+ T cells observed in the inflamed LP of UC patients are not simply activated effector T cells.
Materials and Methods
Patients
Seven patients (four with UC, three with familial adenomatous polyposis) undergoing total proctocolectomy consented to have surplus tissue from their resections used for research through a research protocol authorized under the institutional review board of Virginia Mason Medical Center. A decision was made to not remove blood for research from these patients, as the volumes necessary for described experiments would have reduced the safety margin for intraoperative blood loss. The colon from one of the UC patients (a 62 year old man) was used only for experiments involving biopsied tissue in figure 1. This patient had longstanding UC, but developed a medication-refractory flare requiring colectomy in the setting of adalimumab and systemic glucocorticoid therapy, having previously failed sulfasalazine, infliximab, and azathioprine.
Figure 1.
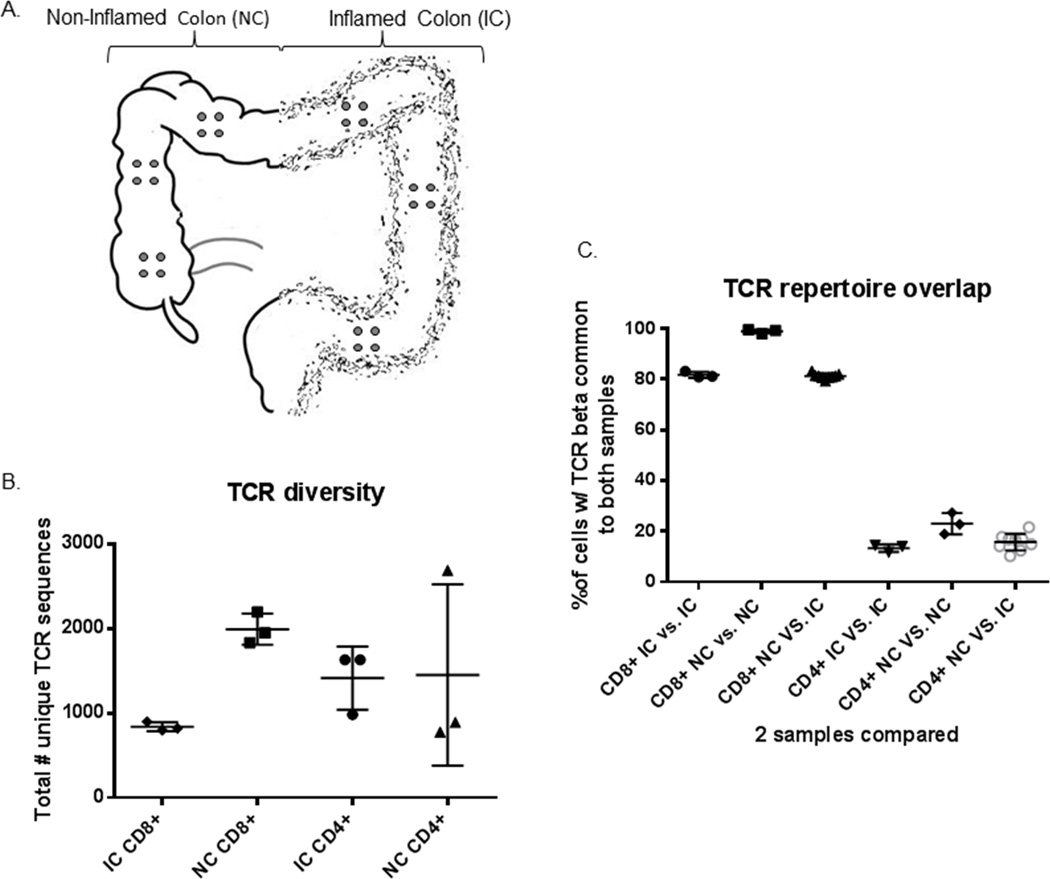
Anatomic sequestration of CD4+ and CD8+ T cell clones: (a) Three clusters of four 3mm punch biopsies (grey circles) each were obtained from locations at least 10cm apart in the surgically resected inflamed or non-inflamed half of the colon of a patient with ulcerative colitis. (b) CD3+ T cells from these quartets of biopsies were sorted into CD4+ and CD8+ TCRγδ− (presumably TCRαβ+) fractions and the TCR Vβ hypervariable domain was sequenced to reveal the total number of unique clonotypes present in a given specimen from inflamed (IC) or normal (NC) colon. (c) The total number of CD8+ or CD4+ TCR transcripts from any two locations that had a sequence common to both locations was calculated for all possible pairings of locations, and the clonal overlap between locations was compared for pairings of any two locations in IC or NC, or of one location from each.
Experiments using homogenized lamina propria cells in figures 2–5 involved the remaining six subjects, each trio of which contained one man and two women. The trio without IBD were undergoing surgery for familial adenomatous polyposis (FAP)—a non-inflammatory indication for proctocolectomy—and were 18, 28, and 40 years old at the time of surgery. None of their resected specimens contained any high grade dysplasia or cancer. The trio with UC, aged 20, 27 and 41 years old, were all undergoing surgery for medication-refractory inflammation, after a disease duration of 3 years, 8 months, and 9 years, respectively. All had been exposed to systemic glucocorticoids and anti-TNF biological agents prior to surgery. One was on infliximab and two on adalimumab (having previously lost response to infliximab) at the time of surgery, but only one remained on systemic steroids, the other two having discontinued prednisone at least 4 months prior to surgery. None of the patients were on thiopurines or other immunomodulators at the time of surgery, one having stopped 6-mercaptopurine years prior, one having tried azathioprine for only 2 weeks and then stopped it a month prior to surgery, and one having never been exposed to thiopurines. None of the resected specimens contained any high grade dysplasia, cancer, or signs of Crohn’s disease, such as granulomas or fistulas.
Figure 2.
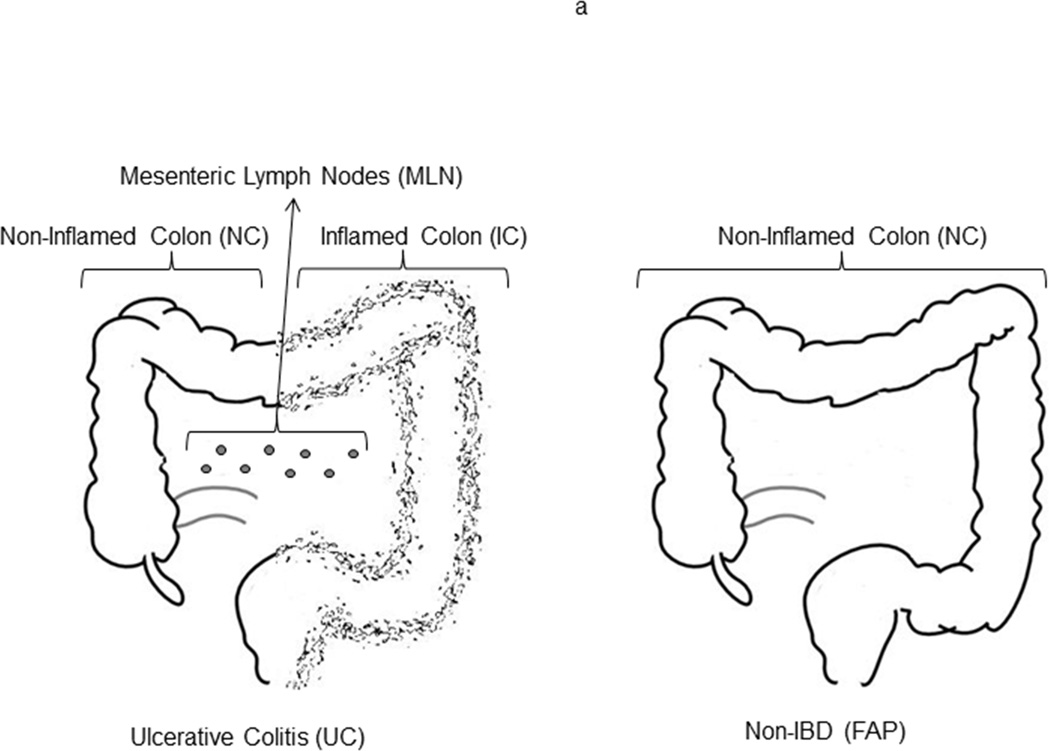
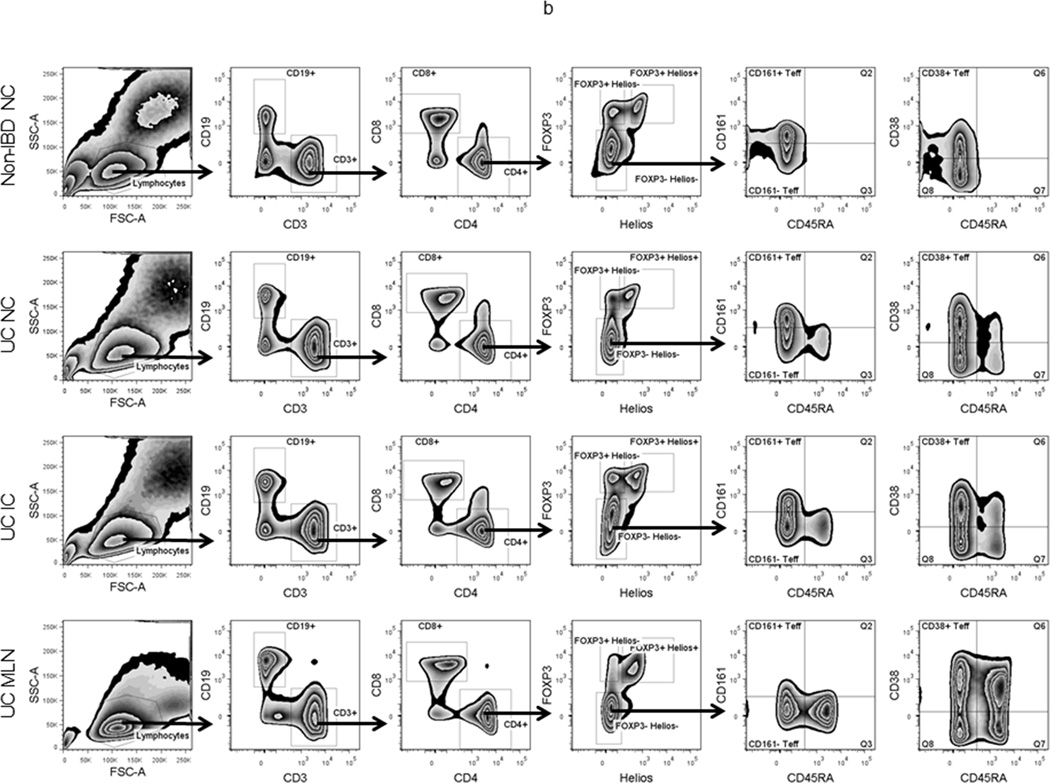
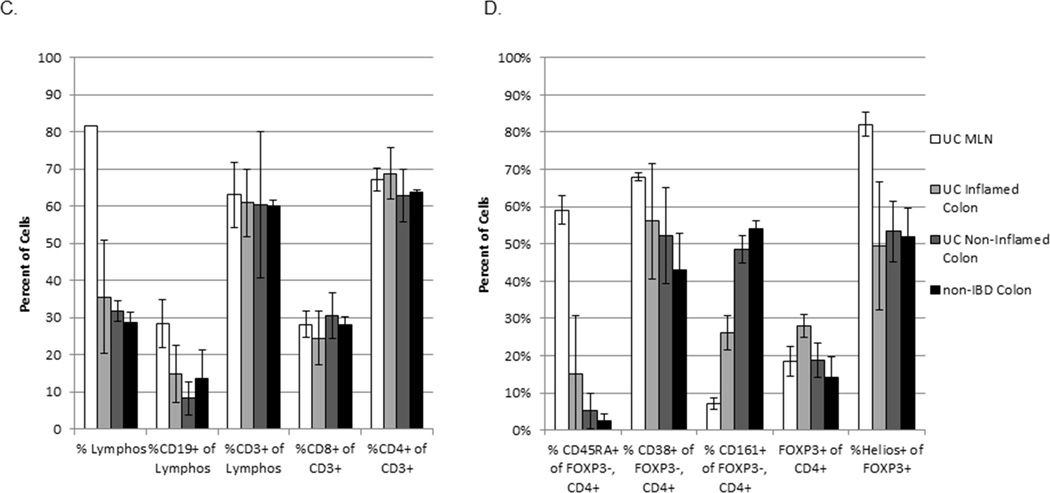
Flow cytometry profiles of LP and MLN lymphocytes: (a) Thawed, homogenized MLN cells from UC patients (white bars in c and d) or LP cells from inflamed (IC, light grey bars) or non-inflamed (NC, dark grey bars) colon from UC patients (n=3) or patients without IBD (black bars, n=3) were characterized and sorted by flow cytometry. (b) Representative FACS data is shown for each sample type. (c) The percent of live cells within the lymphocyte gate (by forward and side scatter), the fraction thereof represented by B cells (CD19+) or T cells (CD3+), and the fraction of the latter expressing CD8 or CD4 are shown. (d) Among FOXP3−negative, CD4+ T cells, the percent expressing CD45RA (naïve cells), and the percent of CD45RA−negative cells expressing CD38 (activated cells) or CD161 (including Th17 cells) is shown. The percent of total CD4+ cells expressing FOXP3 and the percent thereof expressing Helios is also shown. Bars reflect the means and standard deviations of the three independent donors for each specimen type.
Specimen processing
Surgically resected tissue was promptly transported to the lab in cold PBS and washed of blood, mucous and stool in HBSS. Each UC specimen had grossly more inflammation in the distal (left) half of the colon than proximal (right) half, and so UC colon specimens were bisected at a transition point where inflammation grossly appeared to decrease or disappear, and each half was processed independently. For FAP specimens, only non-polypoid, normal-appearing mucosa was harvested. For experiments in figure 1, a tight cluster of four 3mm punch biopsies was obtained from several mucosal locations at least 10 cm apart along the length of the left or right colon (figure 1a). For all other experiments, colonic mucosa was sharply dissected away from underlying fat and muscle and subjected to three washes of HBSS containing EDTA and DTT to remove mucous and epithelium. Residual lamina propria (LP) was then rinsed with RPMI, chopped into fine pieces, and digested for 90 minutes with collagenase and DNAse in RPMI supplemented with MgCl2 and CaCl2. The fluid phase of this digest was then filtered through a 100 µm screen, centrifuged, and washed in PBS. Mesenteric lymph nodes (MLN) were removed from mesenteric fat accompanying UC specimens and crushed through a 100 µm screen to liberate lymphocytes, which were then washed in PBS. LP and MLN cells were frozen in 7% DMSO in fetal calf serum (FCS) in a Mr. Frosty freezer jar placed at −70° C, and then transferred to liquid nitrogen.
T cell isolation
Upon thawing, intact biopsies were immediately subjected to a 30 minute incubation in collagenase and DNAse in RPMI supplemented with MgCl2 and CaCl2. The fluid phase was then filtered through a 100 µm screen and centrifuged, and pelleted cells were then stained with antibodies against γδ TCR, CD4, and CD8 (BD Bioscience). Cells were sorted into γδ TCR−/CD4+ and γδ TCR−/CD8+ T cell populations, which were promptly frozen as cell pellets.
Homogenized LP and MLN cells were thawed and stained extracellularly with antibodies to CD4(BD Bioscience), CD8(eBioscience), CD19(BD Bioscience), CD45RA(BD Bioscience), CD161(eBioscience), and CD38(eBioscience), and then fixed and permeabilized with a kit (eBiosciences) to be stained intracellularly with antibodies to FOXP3 (eBioscience) and Helios (Biolegend). Cells were sorted to exclude CD8+ and CD19+ lymphocytes while including CD4+ T cells. The latter were sorted into Helios+ and Helios− FOXP3+ cells, while FOXP3−, CD45RA− effector T cells were sorted into CD161+ and CD161− fractions, and into a CD38+ fraction. 100,000 cells were collected in each fraction and frozen as cell pellets.
TCR analysis
Amplification and Sequencing CDR3 regions: Genomic DNA was extracted from sorted cells using Qiagen DNeasy Blood extraction Kit (Qiagen,). TCRB CDR3 regions were amplified and sequenced from 400 ng gDNA, or in a subset of cases using all available extracted DNA, from all samples. Amplification and sequencing of TCRB CDR3 regions was carried out on the ImmunoSEQ platform at Adaptive Biotechnologies as previously described (Robins et al, 2009). The sequences for both TCRB CDR3 regions were delineated according to the definition established by the International ImMunoGeneTics collaboration (24). Sequences that did not match CDR3 sequences were removed from the analysis. A standard algorithm was used to identify which V, D, and J segments contributed to each TCRB CDR3 sequence (24). Rearranged CDR3 sequences were classified as non-productive if insertions or deletions that resulted in frame-shifts or premature stop-codons were identified.
We quantified the amount of clonal overlap between any two sorted T cell populations from different specimens from a given patient by adding together the total number of productive transcripts (correlating with cell counts) sequenced of TCR sequences common to both samples, and dividing by the total number of productive transcripts seen in both samples. This was presumed to reflect the following formula to provide an estimate of clonal overlap which would be weighted for clonal copy number:
This analysis was performed using either primary productive DNA sequence data or the amino acid sequence data deduced from it, and both analyses yielded nearly identical results (data not shown), so hereafter, data will reflect analyses based upon primary DNA sequence.
Ethical Considerations
The submitted manuscript is an original contribution not previously published, and is not under consideration for publication elsewhere. Each person listed as an author has participated in the study to a significant extent. All human subjects provided written consent according to an IRB-approved protocol, as described above.
Results
Heterogeneous anatomic distribution of CD4+ versus CD8+ T cell clones in the colon
To determine the feasibility of using colonoscopic biopsies versus surgical resections to study T cell clonal diversity, tight clusters of four 3mm biopsies each were taken from distinct locations along the inflamed or non-inflamed length of the colon of one UC patient (figure 1a), similar to what could be performed colonoscopically. These were subsequently thawed and sorted into total CD4+ and CD8+ T cell populations, excluding γδTCR+ cells. For CD4+ T cells, the number of unique TCR beta sequences per cluster of four biopsies was quite variable, particularly in the non-inflamed colon (NC) (figure 1b). The clonal overlap between any two biopsy clusters was fairly small, particularly if only inflamed colon (IC) clusters were compared (<15% overlap), becoming slightly but significantly larger when clusters from NC were compared (<30% overlap) (p=0.0073 by unpaired ANOVA, figure 1c). <5% of the CD4+ cells from any given IC biopsy cluster bore a TCR sequence common to all three IC clusters, and <1% of the CD4+ cells from any given IC biopsy cluster bore such a common IC TCR sequence that was seen in no NC clusters. Thus, there did not appear to be a dominant CD4+ clone associated with colon inflammation. Conversely, <15% of the CD4+ cells from any given NC biopsy cluster bore a TCR sequence common to all three NC clusters, and <2% of the CD4+ cells from any given NC biopsy cluster bore such a common NC TCR sequence that was seen in no IC clusters. Thus, there did not appear to be a dominant CD4+ clone preventing colon inflammation, either. Furthermore, this pilot analysis demonstrated that CD4+ T cell clones are much too heterogeneously arrayed throughout the mucosa to be effectively sampled by colonoscopic biopsies.
The clonal diversity of CD8+ T cells isolated from anatomically distinct biopsy clusters was less variable than that of CD4+ cells, with 800–900 unique TCR beta sequences identified in each IC cluster and 1800–2200 in each NC cluster (figure 1b). Overlap of this repertoire between biopsy clusters was much higher for CD8+ T cells than it was for CD4+ cells (p<0.0001 by unpaired two-way t-test, figure 1c). The TCR beta repertoire of CD8+ cells from any one cluster of biopsies from IC overlapped about 80% with the CD8+ repertoire of any other cluster. An even higher, and almost complete, repertoire overlap was seen between any two biopsy clusters from NC, where >98% of CD8+ T cells expressed TCR sequences common to both locations (p<0.0001 by unpaired ANOVA, figure 1c), despite NC biopsy clusters having over twice the diversity of IC biopsies (p=0.0005 by unpaired two-way t-test, figure 1b). Consequently, 60–75% of all TCR beta sequences in a given NC cluster were seen in all three NC clusters, with the remaining, unshared sequences expressed by only a few cells each. 71% of these shared sequences were unique to NC, being absent in all biopsies from IC, but they were relatively low copy-number sequences, being expressed by only 8.3–10.2% of CD8+ cells in any given NC cluster. In contrast, only 25–30% of TCR beta sequences in a given IC cluster were common to all three IC clusters, 71% of which were also common to all the NC clusters, and only 10% of which were not seen in any NC clusters. However, <2.5% of CD8+ cells per quartet expressed the sequences unique to inflamed colon, revealing these to be low copy-number clones.
CD4+ T cell subsets from homogenized lamina propria
The heterogeneity with which we found CD4+ T cell clones to be distributed through the colonic mucosa made it prohibitively difficult to study their clonality with focal biopsies, as might be obtained by colonoscopy. Therefore, we instead obtained surgical colectomies and homogenized of a strip of colon mucosa running the length of the entire colon to eliminate any regional variability with which clones would be distributed along its length, although colon was again divided into an inflamed (left, distal) and non-inflamed (right, distal) segment in UC patients. H&E-stained sections from segments confirmed their inflammatory activity histologically, as inflamed segments demonstrated expanded lamina propria, crypt architectural distortion and microabscesses, while non-inflamed segments were histologically normal (supplemental figure 1). From UC patients, but not controls, MLN were also available (figure 2a). Cells were stained for flow cytometry, and CD3+, CD4+ T cells were sorted into Helios+ or Helios− FOXP3+ Treg and CD38+, CD161+, or CD161− FOXP3− CD45RA− Teff populations, as shown (figure 2b). CD38 was used to identify recently activated T cells, while CD161 has been described as a marker for Th17 cells in the gut(12).
Although a far greater percentage of MLN than LP cells were, as expected, in a lymphocyte gate by forward and side-scatter characteristics, there was no difference in the percent of lymphocytes that were T cells (CD3+), or the fraction of T cells that were CD4+, between proximal (non-inflamed) versus distal (inflamed) colon from UC patients, colon from UC versus non-IBD patients, or colonic LP versus MLN cells from UC patients (figure 2c). Naive CD45RA+ cells were more common in MLN, as they were rare in colonic LP, although CD45RA+ cells were consistently a two to five-fold greater fraction of FOXP3− CD4+ Teff from the inflamed than non-inflamed half of a given colon (figure 2d and data not shown). There was also a nonsignificant trend towards more activated (CD38+) Teff in UC compared to controls (figure 2d). Although Th17 cells have been implicated in the pathogenesis of autoimmunity, there were paradoxically fewer Teff expressing the Th17 marker CD161 in the inflamed than non-inflamed colon LP of UC patients (p=0.0037 by paired t-test), with the CD161+ fraction of Teff from non-inflamed UC colon resembling that of patients without UC (figure 2d).
A larger fraction of CD4+ T cells were found to express FOXP3 in the inflamed segments of UC colon (mean 28%) relative to control colon (mean 14%), or autologous non-inflamed colon (mean 19%) or MLN (mean 18%) (p=0.033 by one-way ANOVA, figure 2d), as has been described previously(14–16;19;27). However, the fraction of inflamed colonic FOXP3+ LP cells expressing Helios (mean 49%), while lower than MLN (mean 83%, p=0.011 by paired t-test), was no different from that of autologous non-inflamed colon (mean 53%) or control colon LP cells (mean 52%) (figure 2d). Therefore, the excess FOXP3+ cells paradoxically present in the inflamed colon segments of UC patients are not disproportionately of the Helios−negative phenotype proposed to reflect acutely activated “induced” iTregs(22). However, the accuracy of Helios as a reliable marker for constitutively FOXP3+ “natural” nTregs in the human colon is unclear.
The TCR repertoires of colonic FOXP3+ T cells from UC patients have a normal diversity
To characterize the clonal diversity of tissue T cell populations, fixed, intracellularly stained cells analyzed above were sorted into subpopulations, and found to produce good quality DNA for deep sequencing of the TCRvβ hypervariable domain. The specific sequence of this region is believed to be so variable during T cell ontogeny that no two nascent T cells are likely to produce the same sequence, and yet so stable outside the thymus that it can be used to identify clonally expanded T cells with a common progenitor. Thus, the TCRvβ hypervariable domain sequence distinguishes between T cell clones with distinct progenitors, and can accurately quantify the clonal diversity of a population.
The distribution curve of specific TCR sequence copy numbers in each specimen of 105 sorted cells predictably revealed a small number of unique sequences with high copy numbers and a high number of unique sequences with low copy numbers (figure 3a). Although samples varied in their total number of unique TCR sequences and the maximum copy numbers per sequence, the shapes of these curves were generally similar. The exception to this was among the activated (CD38+) Teff, whose curves were more arched to reflect a smaller diversity of unique TCR’s, with a generally greater copy number per TCR, as one might expect within a clonally expanded population. A strong inverse relationship was observed between the total number of unique sequences and the average copy numbers of the 100 most common sequences in a given specimen (Pearson’s coefficient −0.89). These parameters bore no relationship to how large a fraction of CD4+ cells a given sorted subset represented (data not shown).
Figure 3.
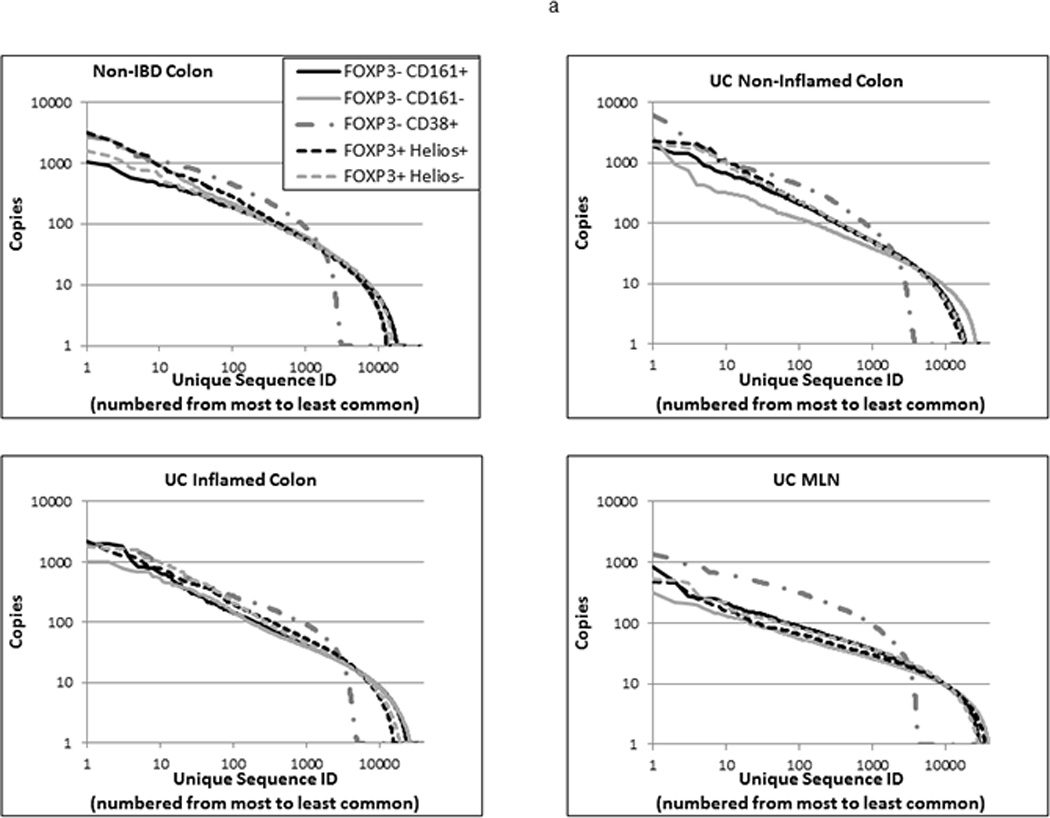
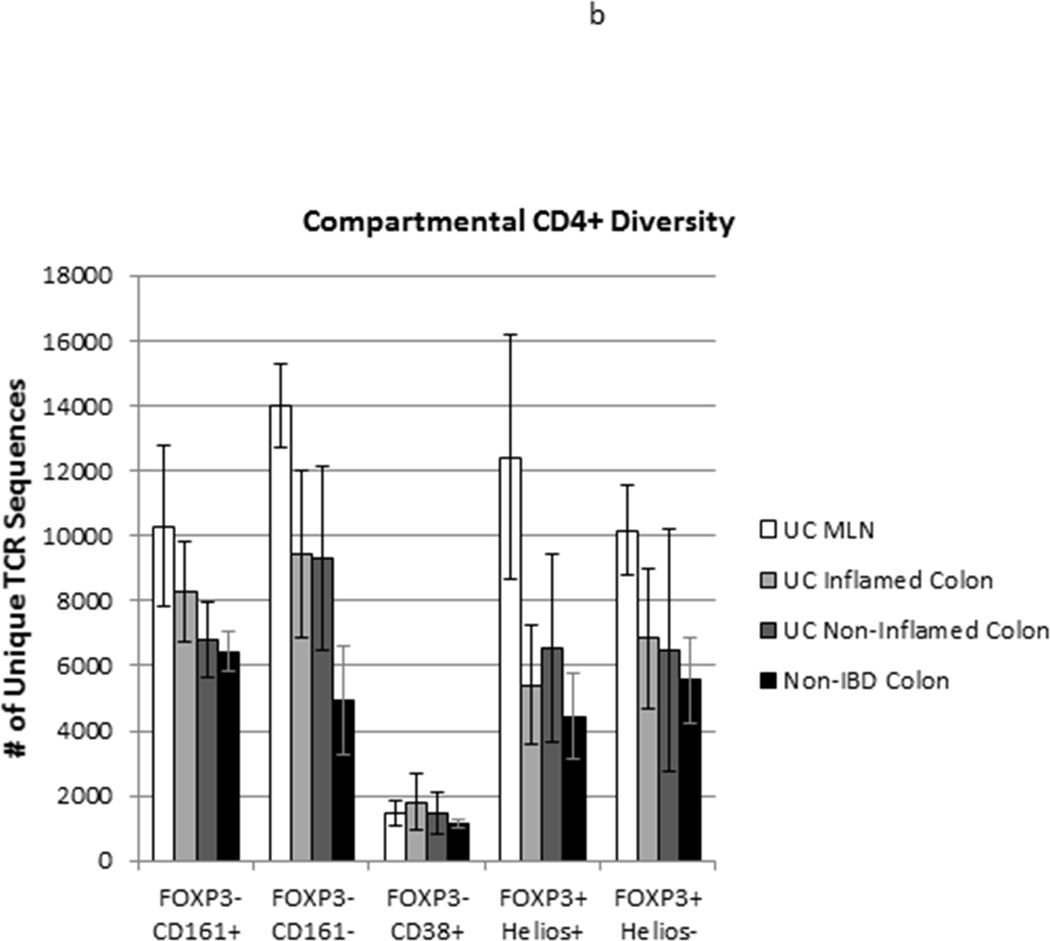
TCR repertoire diversity of T cell populations from anatomically distinct sites: TCR Vβ hypervariable domains were deep sequenced from 105 Helios+ or Helios− FOXP3+ Tregs, and CD38+, CD161+, or CD161− FOXP3− CD45RA− Teff sorted from specimens in Figure 2. (a) Sequence data from the three donors used for each cell and specimen type was pooled, and each unique sequence within a given pool was assigned a rank, based upon its copy number, which was then plotted against its copy number on a log scale to reflect the overall distribution of clonal diversity of a cell type within each of the specimen types shown. (b) The total number of unique TCR sequences (regardless of copy number) for each cell type in MLN (white bars), inflamed (light grey bars) or non-inflamed colon LP (dark grey bars) from 3 UC patients or colon LP from 3 patients without UC (black bars) is shown. Bars reflect the means and standard deviations of the three independent donors for each specimen type.
Therefore, the total number of unique TCR sequences identified in each sample of 105 sorted cells was used as a reflection of its overall clonal diversity. As reflected above in their distribution curves, diversity was much lower among activated (CD38+) FOXP3−, CD45RA−, CD4+ Teff than among the other sorted T cell populations (p<0.0001 by one-way ANOVA), likely reflecting the clonal expansion of a limited repertoire of T cell clones (figure 3b). However, no difference in the diversity of CD38+ cells was seen between the colonic LP of non-IBD patients or the inflamed or non-inflamed LP or MLN of UC patients (p=0.74 by one-way ANOVA). In all other CD4+ T cell subsets of UC patients, clonal diversity was higher in the MLN than in the colon (p=0.0011 by one-way ANOVA).
No differences in the total number of unique TCR sequences of FOXP3+ Treg subsets were found between inflamed or non-inflamed colonic LP specimens from UC patients (p=0.82 by paired t-test), or between colonic LP from patients with or without UC (p=0.32 by unpaired t-test), regardless of their Helios expression. Furthermore, the total number of unique TCR sequences identified in 105 Helios+ versus 105 Helios− FOXP3+ cells from any given sample was no different (p=0.92 by paired t-test) (figure 3b). The distribution curve of copies per unique TCR sequence was similar between FOXP3+ cells from the colons of patients with versus without UC, regardless of inflammation (figure 3a). Thus UC was not associated with an unusually diverse or homogeneous clonal diversity within the LP FOXP3+ Treg populations. Although the distribution curve of copies per TCR sequence was slightly flatter for Helios− than Helios+ FOXP3+ cells from the colons of patients without UC, in all UC specimens, this distribution was nearly superimposable between Helios+ and Helios− FOXP3+ cells (figure 3a).
Among FOXP3−negative cells, the diversity of LP CD161+ Teff, presumed to include Th17 cells, showed little difference between inflamed or non-inflamed colon from UC patients and colon from patients without IBD, although a trend towards higher clonal diversity in samples from inflamed colon was paradoxically seen (figure 3b) despite the lower frequency of CD161+ T cells in the inflamed colon (figure 2b). Furthermore, among CD161− LP Teff, a strong, but not quite significant (p=0.055 by unpaired t-test) trend towards greater clonal diversity was seen in samples from patients with UC than without IBD, regardless of whether they came from inflamed segments of colon or not. This argues against a pauciclonal CD4+ Teff population driving inflammation, and thus agrees with early studies of mucosal CD4+ T cell clonality in IBD, using lower resolution technologies than are currently available (5;11;18).
Colonic Helios− FOXP3+ cells show no more clonal overlap with FOXP3− cells than with Helios+ FOXP3+ cells
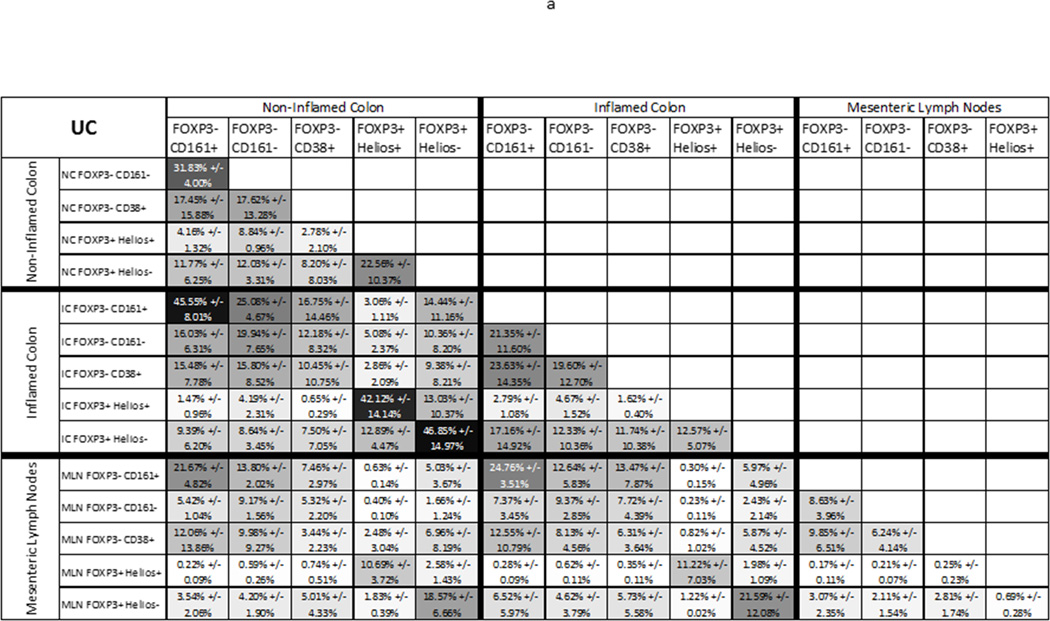
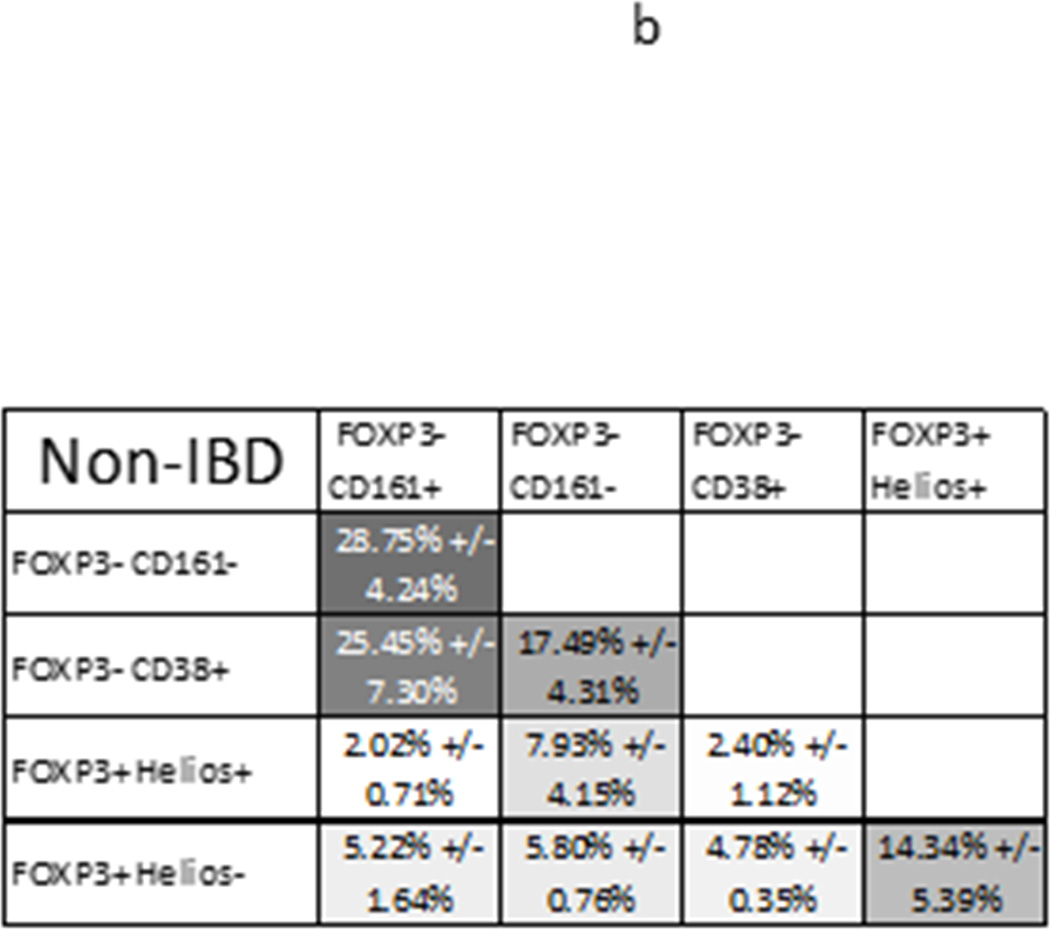
To determine if FOXP3+ T cells are more clonally related to, and thus likely derived from, FOXP3− Teff in the LP of patients with than without UC, we compared the clonal overlap between populations of FOXP3+ and FOXP3− cells from each specimen. For each UC patient, the amount of autologous clonal overlap was quantified between any two anatomic sites and/or CD4+ T cell types, and the average overlap for the three UC patients for each comparison is shown (figure 4a). Similar comparisons were made between any two CD4+ T cells types in the colons of the three non-IBD control patients, averages of which are also shown (figure 4b).
Figure 4.
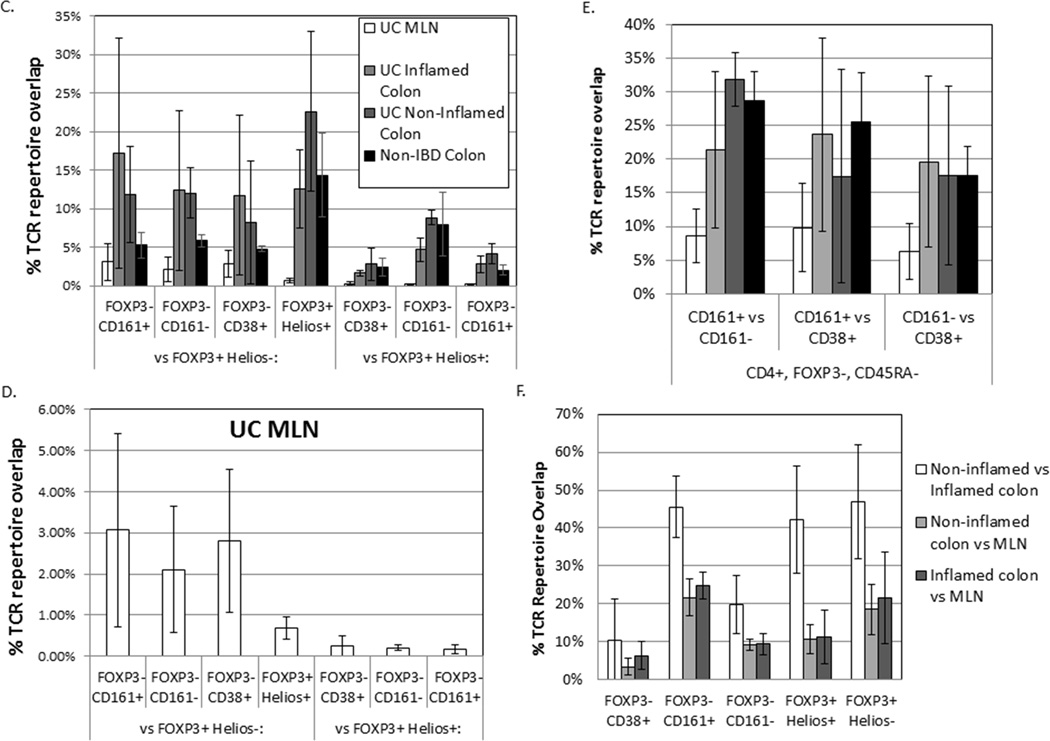
TCR repertoire overlap between T cell subsets from the same anatomic site: The average percent of TCR transcripts in any two autologous samples (x and y axes) with a sequence common to both samples is shown for each anatomic site and T cell population sampled from 3 UC patients (a), or 3 donors without UC (b), greyscaled from lowest (white) to highest (black) percent overlap. The mean percent overlap +/− standard deviation for the three donors represented by each figure is shown. (c) These means and standard deviations of overlap between FOXP3− Teff populations and either Helios− (left half of graph) or Helios+ (right half) FOXP3+ Tregs are plotted alongside the overlap between these two FOXP3+ populations (middle bars) for T cells from MLN (open bars), inflamed (light grey) or non-inflamed colon LP (dark grey) from UC patients or non-inflamed colon LP from donors without IBD (black bars). (d) For MLN, data from (c) is shown with an expanded Y axis scale to improve visibility. (e) TCR repertoire overlap between FOXP3− Teff populations from a given anatomic specimen is shown, as in (c). (f) For each sorted T cell type indicated on the x-axis, TCR repertoire overlap is shown between inflamed and non-inflamed colon (white bars), non-inflamed colon and MLN (light grey bars) or inflamed colon and MLN (dark grey bars) from 3 UC patients. Bars reflect the means and standard deviations of the three independent donors for each specimen type.
Within a given LP specimen (IC or NC from a single donor), regardless of diagnosis or inflammation, only a minority of FOXP3+ cells showed TCR repertoire overlap with any Teff populations, including CD38+, recently activated Teff. This argues that the excess mucosal FOXP3+ Tregs in UC are not “induced” from locally activated Teff cells. Indeed, Helios+ FOXP3+ Tregs showed more clonal overlap with Helios−FOXP3+ cells than with any FOXP3− population (p= 0.0022 by paired one-way ANOVA, figure 4c). In non-IBD colon, Helios− FOXP3+ cells also showed numerically more overlap with Helios+ FOXP3+ Tregs, on average, than with any FOXP3− population (figure 4b). In any given LP specimen, the TCR repertoires of Helios− Tregs overlapped more than those of Helios+ Tregs with FOXP3− Teff repertoires, but no more so than they overlapped with the Helios+ Tregs themselves, and there was actually a nonsignificant trend towards greater TCR repertoire overlap of Helios− Tregs with Helios+ Tregs than with any FOXP3− Teff (p=0.11 by paired one-way ANOVA, figure 4c), particularly among non-IBD samples. Thus, there appears to be some plasticity between Helios+ and Helios− FOXP3+ cells in the colon, providing proof in humans that Helios expression is not a reliable means of distinguishing nTregs and iTregs in the colon, while at the same time revealing Helios+ and Helios− Tregs to be largely distinct populations. More importantly, this data demonstrates that, even in UC, the excess numbers of FOXP3+ cells in the colon are not simply an activated fraction of local effector T cells.
The overlap of TCR repertoires between T cell populations isolated from the MLN of UC patients was markedly lower than that of colon cells (figure 3c), presumably reflecting the increased overall diversity of MLN T cell clones, described above, despite exclusion of naïve (CD45RA+) FOXP3− T cells from analysis. Helios+ FOXP3+ T cells showed <1% overlap with Helios− FOXP3+ cells in the MLN, and even less overlap with FOXP3− effector T cell populations, with which they had almost no TCR sequences in common. The latter serves as a strong negative control to demonstrate that any repertoire overlap seen between populations from a sort is not an artifact of poor sorting or other technical caveats. In contrast, Helios−FOXP3+ MLN T cells showed numerically more overlap with each of the FOXP3− effector T cell populations than with Helios+ FOXP3+ cells, albeit nonsignificantly (p=0.29 by paired one-way ANOVA, figure 4d). This suggests that much less plasticity exists between Helios+ and Helios− FOXP3+ T cells in the MLN than the LP, with the Helios− Tregs being more commonly derived from effector T cells than from Helios+ FOXP3+ cells. Thus, Helios may distinguish distinct “natural” and “induced” Treg populations more effectively in the MLN than it does in the colonic LP.
As none of the subjects were HLA-matched, all of the above comparisons were necessarily performed only between populations sorted from the same donor. When compared between donors, only a few (<10 for any given cell type) unique TCR sequences were present in all 3 donors for a given tissue type, and usually at a low copy number (<30), although occasionally just one of three donors had a higher copy number (>1000) for a shared TCR. Thus our data did not identify “public” TCR’s as a substantial component of any colonic CD4+ T cell populations in UC. When compared to the substantial overlap in TCR sequences seen with autologous clones, such a negligible overlap between different donors also confirms that little or none of the repertoire overlap data, even for low copy-number events, can be attributed to artifacts intrinsic to the sequencing and analysis techniques used for these studies.
In UC, more clonal overlap exists between FOXP3+ cells from inflamed and non-inflamed colon than between colon and MLN
Assuming that T cells traffic asynchronously, and their anatomic distribution at the time of colectomy reflects a steady state of cells trafficking between sites, the presence of a given T cell clone’s TCR sequence at multiple anatomic sites was considered to reflect trafficking of said clone between sites. To determine the degree to which FOXP3+ clones traffic, we therefore compared the TCR repertoire of Helios+ or Helios− FOXP3+ cells sorted from the inflamed versus non-inflamed segments of colon verses MLN from each UC patient (figure 4f). In both Treg populations, nearly half of the cells, on average (range 23.3%–65.1%), expressed a TCR sequence found in both inflamed and non-inflamed segments of bowel, indicating that many Treg clones are spread throughout the colon. In contrast, on average only about 10% (3.67%–20.6%) of Helios+ and about 20% (11.2%–38.5%) of Helios− FOXP3+ cells expressed TCR sequences common to both MLN and colon, regardless of whether the latter was inflamed or not. Thus, only a minority of Treg clones appear to be circulating between the bowel and MLN, with the majority sequestered predominantly to one site or the other.
Clonal overlap between inflamed and non-inflamed colon segments was similar for CD161− Teff cells sorted from homogenized colon segments (12.2–30.4%, figure 4f) as that described in figure 1 for total CD4+ T cells from biopsies (10.3–21.7%). A greater overlap between inflamed and non-inflamed colon was seen among CD161+ T cells (35.1–54.6%), suggesting that they are more homogenously distributed throughout the colon than other CD4+ Teff, resembling the distribution of Tregs. The overlap among CD38+ T cells was less consistent (1.95–25.6%), but lower on average than other T cells, suggesting that different T cell clones tend to become activated by antigen (and thus become CD38+) at different locations in the colon, or at least differ between the diseased and healthy bowel of UC patients. Regardless of whether or not LP came from an inflamed colon segment, the clonal overlap between colonic LP and MLN CD4+ T cells was lower than between two colonic specimens for a given T cell type, but again more overlap in the CD161+ (14.9–29.3%) and less overlap in the CD38+ (0.91–9.88%) populations was seen than in the CD161− population (6.46–13.2%) of FOXP3− CD45RA− CD4+ Teff (ANOVA p< 0.0001). Thus, there is anatomic compartmentalization of CD4+ T cell clones, particularly within the CD38+ population of activated Teff, with less compartmentalization of Tregs and the Th17-like CD161+ Teff.
Repertoire overlap of CD161+ Teff or Helios+ or Helios− Tregs between different anatomic sites in UC (IC versus NC versus MLN) was higher if the T cell type was the same in both compared specimens (eg: CD161+ from NC vs. CD161+ from IC) than if one of the two specimens was of a different T cell type (eg: CD161+ from NC vs. CD161− from IC) (figure 4a), indicating that Tregs and Th17-like clones tend to maintain their phenotype between different anatomic locations. However, this phenomenon was not seen with CD161− or CD38+ cells, which tended to have numerically greater overlap between anatomic sites when compared with other Teff populations than their own (figure 4a). For CD38+ cells, this emphasizes that T cell activation appears to be anatomically compartmentalized, with a different subset of Teff becoming activated in the IC than in the NC or the MLN.
Discussion
The described results, for the first time, use TCR Vβ hypervariable domain sequencing to comprehensively reveal the clonal diversity of human intestinal CD4+ regulatory T cell subpopulations in the presence or absence of inflammation, and compare them to effector CD4+ T cell populations. This data shows that colonic FOXP3+ Tregs, while less diverse than those in the MLN, are nonetheless still quite clonally diverse, with thousands of unique TCR sequences represented in a sample of 105 cells, regardless of whether inflammation was present or not, and regardless of whether or not they express Helios. As there was little difference in the distribution of clonal copy numbers between inflamed and non-inflamed colon or between patients with or without UC, there does not appear to be an oligoclonal population of Tregs selectively enriched or depleted in the setting of inflammation. This corroborates and extends existing data from traditional TCR spectratyping, which did not show individual clones to be over-represented within the entire, unfractionated CD4+ population(5). Thus, even when analyses are focused on specific Treg and Teff populations, UC does not appear to be driven by a selective outgrowth of a few specific T cell clones, or a narrowing of total Treg diversity that could limit the ability of Tregs to respond to diverse antigens.
A paradox we set out to address was how the uncontrolled inflammation of UC could be associated with an enrichment of FOXP3+ Tregs in the colon, when the genetic condition IPEX and several animal models of intestinal inflammation are caused by a defiiciency of Tregs. The observation that FOXP3− negative Teff cells can up-regulate FOXP3 upon activation in a TGF-β-rich environment has led to the hypothesis that the FOXP3+ cells observed in IBD are actually just activated T cells, or “induced” iTregs, obscuring any dearth of constitutively FOXP3+ “natural” nTregs which may actually exist in IBD. Unfortunately, other markers of Tregs, such as CD25 expression, or down-regulation of CD127, have also been associated with T cell activation, leaving few, if any, good markers for distinguishing nTregs from iTregs at the single-cell level. The transcription factor Helios was proposed as an nTreg-specific marker by which this may be accomplished, but we found no increase in Helios− cells nor, more importantly, any decrease in Helios+ cells to be associated with UC. However, the reliability of Helios as an nTreg marker has recently come into question, so we additionally used TCR Vβ hypervariable domain sequencing to identify the degree to which FOXP3+ T cells share TCR repertoire, and hence clonal origin, with FOXP3− effector T cell populations. Although some overlap in repertoire was observed between FOXP3+ and FOXP3− T cell populations in the colon, most T cells appeared to contain a TCR unique to their population, particularly when Helios+ FOXP3+ T cells were compared with FOXP3− T cells, including recently activated CD38+ FOXP3− T cells. Thus, the increased number of FOXP3+ T cells, and particularly Helios+ FOXP3+ T cells, seen in inflamed UC colon cannot be explained by local transient up-regulation of FOXP3 in activated effector T cells, the latter having been reported in humans to make cytokines and lack suppressive function(2). Intestinal FOXP3+ Tregs from IBD patients have been shown to have suppressive function when placed in artificial in vitro suppression assays, but whether they do suppress in vivo would be difficult to measure. It is possible that local factors in the intestinal microenvironment limit the suppressive potential of otherwise normal, functional Tregs in IBD.
While this report represents the first analysis of human intestinal TCR diversity of FOXP3+ Tregs, studies in TCRβ transgenic mice have demonstrated that FOXP3+ Tregs in the colon have TCRα repertoires that are largely distinct from colonic FOXP3− Teff, and distinct from Tregs in other organs, perhaps being shaped by exposure to commensal intestinal flora(13). Additionally, using neuropilin-1 as a marker to divide murine TCRβ transgenic Tregs into thymically derived (nTreg) and peripherally derived (iTreg) populations reveals these populations to have TCRβ repertoires that are largely distinct from one another, and from FOXP3− Teff, but with a degree of clonal overlap that is similar to what we observed in the human colon when using Helios to differentiate nTregs from iTregs(26). While we found human Helios+ and Helios− Treg populations to have TCR repertoires that were predominantly distinct, especially in the MLN, there was still considerable overlap between them in the colon, indicating that there is plasticity between these populations, and thus revealing Helios to be an imperfect discriminator between intestinal iTregs and nTregs. However, more overlap was observed between Teff and Helios− Tregs than between Teff and Helios+ Tregs, so we conclude that colonic Helios−FOXP3+ cells represent a mixture of acutely activated Teff, which have up-regulated FOXP3, and constitutively FOXP3+ Tregs which have down-regulated Helios.
In contrast to the colon, MLN had CD4+ T cell subsets with a more diverse TCR repertoire, with less overlap between Helios+ and Helios− FOXP3+ T cells, and almost no overlap between Helios+ FOXP3+ cells and FOXP3− cells, demonstrating less plasticity between populations in the MLN. MLN T cells had a TCR repertoire that was largely distinct from that found in the LP of colon they drained, especially among activated (CD38+) T cells. The latter suggests that the antigens to which CD4+ T cells respond are different between lymph node and intestinal mucosa, and the CD38+ cells present in the MLN are not simply T cells that migrated from the colon to the MLN upon activation. In contrast, there was numerically more clonal overlap between MLN and colon among CD161+ Teff than other Teff cells, despite far fewer CD161+ T cells being present in the MLN than the colon. Thus the CD161+ Teff population, within which Th17 cells reside, may be particularly migratory populations, whose clones can transit more freely between LP and MLN than other Teff cell subsets.
Although Th17 effector T cells have been hypothesized to play a central role in IBD pathogenesis, we found little evidence to support the existence of potentially pathogenic clones expanding in the CD161+ population, within which Th17 cells are reported to reside (12). There was no less clonal diversity among CD161+ than CD161− T cells from UC colon to suggest the outgrowth of a pathogenic clone, or oligoclonal population, of Th17 cells. If anything, there was a trend towards increased TCR repertoire diversity in the CD161+ T cells from the inflamed colons of UC patients, despite CD161+ cells representing a smaller fraction of total LP Teff. As clonal expansion increases the size of a population while decreasing the diversity of its repertoire (per 105 cells), this would also argue that less clonal expansion is occurring in the CD161+ than the CD161− Teff population. The comparable clonal overlap with activated (CD38+) T cells between CD161+ and CD161− effector T cells in all patients and anatomic sites suggests that neither population is preferentially triggered by cognate antigen in the inflamed or non-inflamed colon or MLN of UC patients, or the colons of patients without IBD. Given the increased repertoire overlap between UC MLN and colon we observed in CD161+ cells, it is possible that the reduced CD161+ population we observed in the inflamed colon is due to egress of these cells from the LP to the MLN. However, CD161+ cells represented a smaller fraction of MLN than colonic T cells in UC. Furthermore, colonic CD161+ overlap with MLN cells was similar regardless of whether colonic T cells were sorted from inflamed or non-inflamed colon. Complicating these observations was the finding of considerable overlap between the TCR repertoires of CD161+ and CD161− effector T cells, suggesting that there is plasticity between these two populations. If so, the CD161+ Th17 phenotype is not a terminally differentiated T cell fate, which may confound interpretation of existing data on mucosal Th17 cells.
A significant increase in diversity per 105 cells was seen in the CD161− effector T cell compartment in UC, in both inflamed and non-inflamed colon, relative to controls. This suggests that the increased T cell mass in the LP of UC patients does not result from local expansion of an oligoclonal fraction of CD4+ T cells activated by a few antigens, but rather from either a nonspecific, polyclonal expansion of effector T cells, or the recruitment of circulating T cells to the LP. The efficacy of integrin α4β7 (a gut-homing receptor on circulating lymphocytes) blockade in UC (8) supports the latter hypothesis as being central to disease pathogenesis. It is also possible that the clonal diversity of effector T cells is being increased in UC by the polyclonal local conversion of a clonally diverse naïve (CD45RA+) T cell population into effector T cells. However, unless the CD45RA+ population is somehow being replaced in the LP faster than it is being converted to CD45RA− effector T cells, it would be difficult to reconcile the latter hypothesis with the observation that an increased CD45RA+ population of T cells is seen in the inflamed LP of UC patients.
Some limitations exist with the reported data. First, to standardize our experiments, we limited our analyses to 105 sorted cells for each T cell population from each specimen, which could be small enough to under-represent clonal overlap in a profoundly diverse T cell population. Indeed, the greater diversity of cells in the MLN was associated with lower overlap in any comparisons involving MLN cells. However, the fact that we were, on average, able to detect TCR overlap in almost half of the FOXP3+ or CD161+ cells sorted from the inflamed versus non-inflamed segment of a UC patient’s colon, despite sequence data coming from two completely independent sorts, serves as an excellent positive control to demonstrate that the lower levels of overlap between T cell subsets from the same sort, such as Helios+ and Helios− Tregs, reflect their distinct clonal origins rather than undersampling.
Another caveat is that our data was generated on a very small cohort, with just three patients in each arm for most experiments, and just one patient used to determine the heterogeneity of T cell clone distribution throughout the colon. A larger cohort may have revealed differences not evident in the presented data, but we found a reasonable degree of consistency in measured parameters within each cohort, which identified a number of significant comparisons between patient and cellular populations. Also, because we used FOXP3 (a nuclear transcription factor) as a marker for regulatory T cells, these cells were necessarily fixed and permeabilized, precluding functional analyses of their inhibitory function. Likewise, CD161 was used to identify Th17 cells, but is at best only a surrogate marker for these IL-17-producing cells, and other CD4+ Teff subsets were not specifically evaluated in our studies. A future experiment, in which in vitro stimulated T cells may be intracellularly stained for and sorted by the cytokines they produce, would more clearly define the TCR repertoire of CD4+ Th subsets, but would require a large number of fresh LPL, which were not available. Third, MLN analyses were restricted to UC patients because the risk of colon cancer in our FAP controls was deemed too high for their MLN to be released for research. Although it is more removed from the intestine than MLN, contemporaneous blood could have served as an alternative to MLN to estimate the migration of Tregs outside the mucosa. However, to minimize risk of anemia complicating their operations, our subjects were not approached for large-volume phlebotomy. A future experiment could define and compare the repertoire of Tregs and other T cell subsets in the blood of IBD patients, and perhaps align this data with the profiles of unfractionated T cells from biopsies to identify repertoire overlap with blood T cell subsets. Finally, our analyses were restricted to UC, and findings may not reflect what is happening in Crohn’s disease. Because Crohn’s is a more heterogeneous disease than UC, with transmural and often patchy mucosal inflammation, the techniques used above might be insufficient to capture its intestinal T cell repertoire. Although it thus remains to be seen whether the excess intestinal FOXP3+ T cells also seen in Crohn’s disease have an abnormal clonal diversity or are derived from FOXP3− effector T cells, we conclude from the data presented above that in UC this is not the case.
Supplementary Material
Acknowledgements
This research was supported by NIH Grant K08DK081659-6. We would like to thank Sandhya Mishra and Kassidy Benoscek for facilitating subject recruitment, K. "Aru" Arumuganathan for assistance with cell sorting, Thien "Son" Nguyen for specimen management, Jane Buckner and Elisa Boden for manuscript review, and Wendy Kliment for manuscript preparation and formatting. A. Sherwood and C. Carlson are paid employees and shareholders of Adaptive Biotechnologies, whose proprietary technology was used in the preparation of this manuscript. J. Lord has worked as a collaborator and consultant for Novo Nordisk on projects unrelated to this manuscript.
Footnotes
The authors have no additional financial interests.
Reference List
- 1.Akimova T, Beier UH, Wang L, et al. Helios expression is a marker of T cell activation and proliferation. PLoS One. 2011;6:e24226. doi: 10.1371/journal.pone.0024226. [DOI] [PMC free article] [PubMed] [Google Scholar]
- 2.Allan SE, Crome SQ, Crellin NK, et al. Activation-induced FOXP3 in human T effector cells does not suppress proliferation or cytokine production. Int Immunol. 2007;19:345–354. doi: 10.1093/intimm/dxm014. [DOI] [PubMed] [Google Scholar]
- 3.Bennett CL, Christie J, Ramsdell F, et al. The immune dysregulation, polyendocrinopathy, enteropathy, X-linked syndrome (IPEX) is caused by mutations of FOXP3. Nat Genet. 2001;27:20–21. doi: 10.1038/83713. [DOI] [PubMed] [Google Scholar]
- 4.Benoist C, Mathis D. Treg cells, life history, and diversity. Cold Spring Harb Perspect Biol. 2012;4:a007021. doi: 10.1101/cshperspect.a007021. [DOI] [PMC free article] [PubMed] [Google Scholar]
- 5.Chott A, Probert CS, Gross GG, et al. A common TCR beta-chain expressed by CD8+ intestinal mucosa T cells in ulcerative colitis. J Immunol. 1996;156:3024–3035. [PubMed] [Google Scholar]
- 6.Coombes JL, Siddiqui KR, Arancibia-Carcamo CV, et al. A functionally specialized population of mucosal CD103+ DCs induces Foxp3+ regulatory T cells via a TGF-beta and retinoic acid-dependent mechanism. J Exp Med. 2007;204:1757–1764. doi: 10.1084/jem.20070590. [DOI] [PMC free article] [PubMed] [Google Scholar]
- 7.Dons EM, Raimondi G, Cooper DK, et al. Induced regulatory T cells: mechanisms of conversion and suppressive potential. Hum Immunol. 2012;73:328–334. doi: 10.1016/j.humimm.2011.12.011. [DOI] [PMC free article] [PubMed] [Google Scholar]
- 8.Feagan BG, Rutgeerts P, Sands BE, et al. Vedolizumab as induction and maintenance therapy for ulcerative colitis. N Engl J Med. 2013;369:699–710. doi: 10.1056/NEJMoa1215734. [DOI] [PubMed] [Google Scholar]
- 9.Gottschalk RA, Corse E, Allison JP. Expression of Helios in peripherally induced Foxp3+ regulatory T cells. J Immunol. 2012;188:976–980. doi: 10.4049/jimmunol.1102964. [DOI] [PubMed] [Google Scholar]
- 10.Himmel ME, Macdonald KG, Garcia RV, et al. Helios+ and Helios− Cells Coexist within the Natural FOXP3+ T Regulatory Cell Subset in Humans. J Immunol. 2013 doi: 10.4049/jimmunol.1201379. [DOI] [PubMed] [Google Scholar]
- 11.Kaulfersch W, Fiocchi C, Waldmann TA. Polyclonal nature of the intestinal mucosal lymphocyte populations in inflammatory bowel disease. A molecular genetic evaluation of the immunoglobulin and T-cell antigen receptors. Gastroenterology. 1988;95:364–370. doi: 10.1016/0016-5085(88)90492-1. [DOI] [PubMed] [Google Scholar]
- 12.Kleinschek MA, Boniface K, Sadekova S, et al. Circulating and gut-resident human Th17 cells express CD161 and promote intestinal inflammation. J Exp Med. 2009;206:525–534. doi: 10.1084/jem.20081712. [DOI] [PMC free article] [PubMed] [Google Scholar]
- 13.Lathrop SK, Bloom SM, Rao SM, et al. Peripheral education of the immune system by colonic commensal microbiota. Nature. 2011;478:250–254. doi: 10.1038/nature10434. [DOI] [PMC free article] [PubMed] [Google Scholar]
- 14.Lord JD, Valliant-Saunders K, Hahn H, et al. Paradoxically increased FOXP3+ T cells in IBD do not preferentially express the isoform of FOXP3 lacking exon 2. Dig Dis Sci. 2012;57:2846–2855. doi: 10.1007/s10620-012-2292-3. [DOI] [PMC free article] [PubMed] [Google Scholar]
- 15.Makita S, Kanai T, Oshima S, et al. CD4+CD25bright T cells in human intestinal lamina propria as regulatory cells. J Immunol. 2004;173:3119–3130. doi: 10.4049/jimmunol.173.5.3119. [DOI] [PubMed] [Google Scholar]
- 16.Maul J, Loddenkemper C, Mundt P, et al. Peripheral and intestinal regulatory CD4+ CD25(high) T cells in inflammatory bowel disease. Gastroenterology. 2005;128:1868–1878. doi: 10.1053/j.gastro.2005.03.043. [DOI] [PubMed] [Google Scholar]
- 17.Mucida D, Kutchukhidze N, Erazo A, et al. Oral tolerance in the absence of naturally occurring Tregs. J Clin Invest. 2005;115:1923–1933. doi: 10.1172/JCI24487. [DOI] [PMC free article] [PubMed] [Google Scholar]
- 18.Qiao L, Golling M, Autschbach F, et al. T cell receptor repertoire and mitotic responses of lamina propria T lymphocytes in inflammatory bowel disease. Clin Exp Immunol. 1994;97:303–308. doi: 10.1111/j.1365-2249.1994.tb06085.x. [DOI] [PMC free article] [PubMed] [Google Scholar]
- 19.Saruta M, Yu QT, Fleshner PR, et al. Characterization of FOXP3+CD4+ regulatory T cells in Crohn's disease. Clin Immunol. 2007;125:281–290. doi: 10.1016/j.clim.2007.08.003. [DOI] [PubMed] [Google Scholar]
- 20.Singh B, Read S, Asseman C, et al. Control of intestinal inflammation by regulatory T cells. Immunol Rev. 2001;182:190–200. doi: 10.1034/j.1600-065x.2001.1820115.x. [DOI] [PubMed] [Google Scholar]
- 21.Sun CM, Hall JA, Blank RB, et al. Small intestine lamina propria dendritic cells promote de novo generation of Foxp3 T reg cells via retinoic acid. J Exp Med. 2007;204:1775–1785. doi: 10.1084/jem.20070602. [DOI] [PMC free article] [PubMed] [Google Scholar]
- 22.Thornton AM, Korty PE, Tran DQ, et al. Expression of Helios, an Ikaros transcription factor family member, differentiates thymic-derived from peripherally induced Foxp3+ T regulatory cells. J Immunol. 2010;184:3433–3441. doi: 10.4049/jimmunol.0904028. [DOI] [PMC free article] [PubMed] [Google Scholar]
- 23.Walker MR, Carson BD, Nepom GT, et al. De novo generation of antigen-specific CD4+CD25+ regulatory T cells from human CD4+ Proc Natl Acad Sci U S A. 2005;102:4103–4108. doi: 10.1073/pnas.0407691102. [DOI] [PMC free article] [PubMed] [Google Scholar]
- 24.Walker MR, Kasprowicz DJ, Gersuk VH, et al. Induction of FoxP3 and acquisition of T regulatory activity by stimulated human CD4+ J Clin Invest. 2003;112:1437–1443. doi: 10.1172/JCI19441. [DOI] [PMC free article] [PubMed] [Google Scholar]
- 25.Wildin RS, Ramsdell F, Peake J, et al. X-linked neonatal diabetes mellitus, enteropathy and endocrinopathy syndrome is the human equivalent of mouse scurfy. Nat Genet. 2001;27:18–20. doi: 10.1038/83707. [DOI] [PubMed] [Google Scholar]
- 26.Yadav M, Stephan S, Bluestone JA. Peripherally induced tregs - role in immune homeostasis and autoimmunity. Front Immunol. 2013;4:232. doi: 10.3389/fimmu.2013.00232. [DOI] [PMC free article] [PubMed] [Google Scholar]
- 27.Yu QT, Saruta M, Avanesyan A, et al. Expression and functional characterization of FOXP3+ CD4+ regulatory T cells in ulcerative colitis. Inflamm Bowel Dis. 2007;13:191–199. doi: 10.1002/ibd.20053. [DOI] [PubMed] [Google Scholar]
Associated Data
This section collects any data citations, data availability statements, or supplementary materials included in this article.


