Abstract
Acoustic radiation force impulse (ARFI) imaging has shown promise for visualizing structure and pathology within multiple organs; however, because the contrast depends on the push beam excitation width, image quality suffers outside of the region of excitation. Multi-focal zone ARFI imaging has previously been used to extend the region of excitation (ROE), but the increased acquisition duration and acoustic exposure have limited its utility. Supersonic shear wave imaging has previously demonstrated that through technological improvements in ultrasound scanners and power supplies, it is possible to rapidly push at multiple locations prior to tracking displacements, facilitating extended depth of field shear wave sources. Similarly, ARFI imaging can utilize these same radiation force excitations to achieve tight pushing beams with a large depth of field. Finite element method simulations and experimental data are presented demonstrating that single- and rapid multi-focal zone ARFI have comparable image quality (less than 20% loss in contrast), but the multi-focal zone approach has an extended axial region of excitation. Additionally, as compared to single push sequences, the rapid multi-focal zone acquisitions improve the contrast to noise ratio by up to 40% in an example 4 mm diameter lesion.
I. Introduction
Acoustic radiation force impulse (ARFI) imaging is a well established ultrasonic elasticity imaging modality that has been used to image structure, pathology, and medical procedures in the breast, prostate, liver, heart, and peripheral vessels [1], [2], [3], [4], [5], [6], [7], [8], [9]. By visualizing the mechanical properties of tissue, ARFI imaging provides adjunctive information to B-mode imageing, often with higher contrast. However, ARFI image contrast suffers outside of the region of excitation (ROE) of the push beam due to lower displacement and broader radiation force excitations [10].
To overcome the loss in contrast outside of the ROE, previous studies have acquired multiple separate ARFI images with the push beam focused at different depths, blending the data in post-processing to generate a single image [11], [12]. Although these multi-focal zone sequences can improve overall image quality, there are certain issues with the published implementations. One primary drawback is the significant increase in acquisition duration, which can cause misregistration of the individual focal zone images. ARFI images can require hundreds of milliseconds to acquire one plane [6], thus acquiring multi-focal zone ARFI images can take well over one second, during which cardiac and pulmonary motion could introduce artifacts. Another deficiency of multi-focal zone sequences is increased acoustic exposure and resulting off-time required to maintain FDA-approved acoustic output levels (i.e., the thermal index and temporal average intensity). This increased exposure is due to both the additional long-duration pushing pulses as well as the increased number of tracking pulses required, which can account for upwards of 30% of the total acoustic output.
Shear wave elasticity imaging (SWEI) [13] has previously been implemented using multiple pushes in rapid succession prior to tracking displacements, creating an extended depth of field in the images [14], [15], [16]. However, these radiation force excitations have not been explored for ARFI imaging and can potentially allow for multi-focal zone imaging without any increase in acquisition duration. Additionally, since the processing and display capabilities of graphics processing unit (GPU) cards now available on many ultrasound systems enable real-time ARFI image generation, multi-focal zone pushes facilitate higher frame rates due to the reduction in acquisition time [17]. In this paper, an analysis of the jitter, noise, contrast, and contrast to noise ratio (CNR) is performed to compare single- to rapid multi-focal zone ARFI imaging.
II. Background
Acoustic radiation force (ARF) arises from a transfer of momentum from an ultrasonic wave to the medium through which it is traveling due to both absorption and scattering of the wave and is described by [1], [18]
| (1) |
where α is the acoustic attenuation, I⃗ is the acoustic intensity, c is the speed of sound, and F⃗ is the force applied to the medium. ARF-based ultrasound elasticity imaging utilizes this acoustic radiation force by applying focused ultrasound pushing pulses that displace the tissue on the order of microns to oberseve the on-axis displacement (ARFI imaging) [1] or the off-axis shear wave propagation (SWEI imaging) [13].
The focus of this work is ARFI imaging, which uses a beam sequence that begins with acquiring at least one conventional reference A-line in the region of interest, then applying the pushing pulse, and finally acquiring additional tracking A-lines. ARFI images are then generated by repeating the beam sequence over the lateral field of view. The response of the tissue is determined by estimating the displacement of the tissue between the pre-push reference and the post-push tracks within the region of excitation [1]. Stiffer tissues displace less and recover more quickly than softer tissues; thus, ARFI images typically show stiffer tissues as regions of lower displacement.
This dynamic tissue response can be observed since it is relatively slow as compared to acoustic wave propagation; thus, by repeatedly transmitting acoustic waves and monitoring the changes in the phase of the received signal, tissue displacement can be estimated. Additionally, based on the time scale of the tissue dynamics, it is possible to repeatedly excite with radiation force before tracking the tissue displacement, which has been termed a ’supersonic’ excitation [14], [15]. For example, typically each radiation force excitation is less than 100μs and the first observation of tissue motion does not occur until 0.5 ms after force cessation, allowing for up to 5 pushes prior to tracking the resulting motion.
It is also possible, however, that by rapidly applying radiation force excitations, interactions between individual pushes can occur, resulting in pushing on tissue that was not originally located at the desired focus of the excitation beam. For example, if the tissue translates significantly between the pushes, either due to the prior radiation force excitations or due to physiological motion, the radiation force from the later pushes would be applied in the incorrect region, and the resulting ARFI image may be confounded. For the imaging system to be considered spatially invariant, there should be no significant interaction between the pushes [19].
Although this rapidly repeated excitation is possible, previous studies utilizing multi-focal zone ARFI images generated the images in the same fashion as sequential focus B-mode images due primarily to power supply limits [11], [12]. Each focal depth was interrogated individually by acquiring all of the lateral locations with a single focal depth before moving to the next focal depth; the resulting data were then blended in post-processing to create a single image.
III. Theory
To determine the impact of the multi-focal zone acquisitions on contrast of a target, a derivation is performed assuming two different focal depths (A and B), where the target is centered at one of the focal depths (A). It has previously been demonstrated that the maximum contrast in an ARFI image is achieved in the region where the push beam is narrowest [10]. Thus, for the target located at focal depth A, the image contrast from focal depth A would be higher than focal depth B, i.e.,
| (2) |
where μo is the mean displacement outside the target, μi is the mean displacement inside the target, and the superscript represents the focal zone.
Additionally, assuming small displacements relative to the target size, linear systems applies; thus, it follows that the displacement of the multi-focal zone acquisition will be the sum of the appropriately time-delayed displacements of each focal zone. Therefore, the contrast of the target in the multi-focal zone sequence is given by:
| (3) |
| (4) |
Thus, based on equation 2, it can be shown that:
| (5) |
| (6) |
Therefore, by combining equations 4, 5, and 6, we have demonstrated that the contrast of the multi-focal zone acquisition is bounded by the contrast of the individual focal zones.
IV. Methods
A. Finite Element Method (FEM) Simulations
To investigate whether or not the imaging system is spatially invariant while utilizing rapid multi-focal zone ARFI imaging, previously validated finite element method (FEM) simulations were performed using a model for a prototype Siemens linear array transducer [20]. These simulations were performed to determine the interactions between the different pushing pulses in a uniform medium. A three-dimensional, rectangular, solid mesh was created using LS-PREPOST2 (Livermore Software Technology Corp., Livermore, CA), and the FEM simulations were performed using an explicit time-domain finite element algorithm available in LS-DYNA (Livermore Software Technology Corp., Livermore, CA). A typical high resolution ARFI sequence was simulated: three push beam configurations were defined (5 MHz center frequency, 60μs duration, F/1.5 focal geometry, focused individually at 15, 20, 25 mm) such that the depth of field, computed as 8F2λ, overlapped by 1 mm [10].
For each push configuration, Field II was used to determine the three-dimensional radiation force distribution, which was then utilized as the force input to the FEM simulations [21], [22]. Each of the three push configurations was simulated independently in addition to two multi-focus simulations (15 → 20 → 25 mm or 25 → 20 → 15 mm). The multi-focus simulations simulated the pushes with temporal spacing such that there was 40μs between the cessation of one push and the beginning of the next one, simulating a 10 kHz pulse repetition frequency (PRF). The tissue displacement was then monitored for 5 ms after force cessation.
B. Experimental Phantom Acquisitions
Experimental phantom data were obtained in a custom designed, calibrated CIRS tissue-mimicking phantom (CIRS, Norfolk, VA) to verify the simulation results as well as analyze the impact of rapid multi-focal zone ARFI imaging on four image quality metrics: displacement jitter, image noise, contrast, and CNR. The phantom has a nominal background stiffness of 8 kPa Young’s modulus and attenuation of 0.5 dB/cm/MHz; it contains a 4 mm diameter cylindrical rod, which is 4x stiffer than the background material, with the center located at 20 mm in depth.
Five different push focal depths were investigated (10, 15, 20, 25, 30 mm), with each push consisting of 300 cycles at 5 MHz with a F/1.5 focal geometry. Single focal zone sequences were designed such that data were acquired with a single push at each focal depth and with three pushes at each focal depth. Rapid multi-focal zone sequences were also designed to acquire data for each combination of 3 adjacent focal depths.
Displacement tracking was performed with a 9 MHz, F/3.0 transmit, focused with F/0.5 dynamic receive and 4:1 parallel at a 10 kHz pulse repetition frequency. Raw in-phase and quadrature (IQ) data were recorded using a prototype Siemens linear array and a modified Siemens Acuson SC2000™ ultrasound scanner (Siemens Healthcare, Ultrasound Business Unit, Mountain View, CA, USA). Displacements were estimated using a phase shift algorithm [23], [24].
C. Image Analysis
To analyze the jitter, contrast, CNR, and image noise, ARFI images of both uniform regions and the cylindrical target were acquired. After the displacement was estimated, multiple pre-processing algorithms were applied; the data were low pass filtered in time with a cutoff frequency of 1000 Hz, depth dependent gain was applied to normalize for the force distribution due to focusing of the push beam, and a 0.25 mm axial and 0.50 mm lateral median filter was applied [25].
After the pre-processing of the data, the mean displacement across the lateral field of view in the uniform region of the phantom was computed. The average displacement through time profiles for the individual foci were then time-delayed according to the timing of the multi-focal zone cases and summed to compare to the combined foci measurements. To estimate the jitter, the standard deviation of the displacement in 2 mm axial regions was computed over the entire acquisition depth and divided by the mean displacement at that depth; thus, the jitter is given in units of decibels relative to the mean displacement and quantified as a function of time after force cessation and depth in the phantom.
The contrast was computed as 1 − (Di/Do), where Di is the displacement inside the target and Do is the displacement outside the target at the same depth in a 4 mm diameter region of interest. The contrast to noise ratio (CNR) was computed in the same region of interest as where σi is the standard deviation of the displacement inside the target and σo is the standard deviation of the displacement outside the target; the overall image noise is therefore defined as . Analyses are performed with comparisons between the single push, single focal zone, triple push, single focal zone, and rapid multi-focal zone sequences.
V. Results
A. Displacement Dynamics
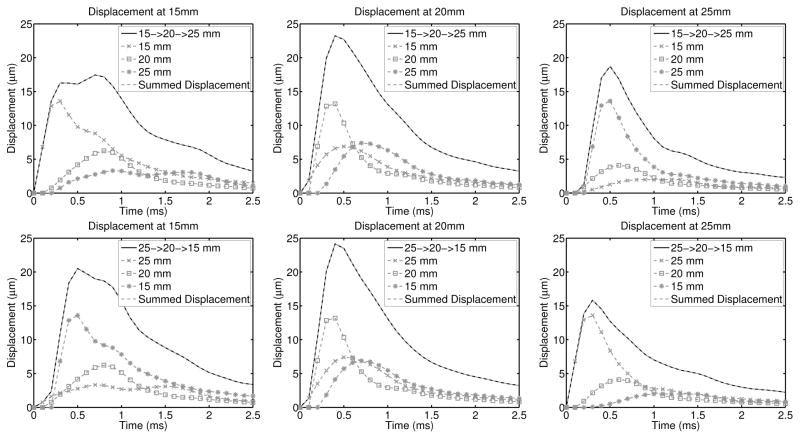
Finite element method (FEM) simulations were performed per the methods detailed in section IV-A to determine whether or not rapid multi-focal zone ARFI imaging is spatially invariant. Figure 1 displays the displacement through time curves for each of the simulations at the individual focal depths (15mm, 20mm, and 25mm), and compares the time-delayed and summed displacement data from each of the 3 individual focal zone simulations to the rapid multi-focus simulation. The RMS difference between the rapid multi-focal zone simulation and the time-delayed and summed displacement data was computed over the entire simulated region (5–30mm depth) and for each time step independently. As expected for a linear system, the rapid multi-focal zone and summed single zone approaches are effectively the same, with a maximum RMS difference less than 0.01μm.
Fig. 1.
Simulated displacement though time profiles (without simulated ultrasonic tracking) are shown for each focal configuration and at each focal depth, with the appropriate time delays applied according to when the pushes started in the multi-focal zone configurations. The top row of images compares the profiles when pushing at the shallowest focal depth first and the bottom row of images utilized the deep-to-shallow configuration. In each plot, the dashed gray line indicates the time-delayed and summed output of the three individual focal zone simulations and is nearly identical to the solid black line, which is the multi-focal zone simulation. As expected for a linear system, the RMS difference between the time-delayed and summed displacement profiles and the multi-focal zone simulations is less than 0.01μm in all configurations.
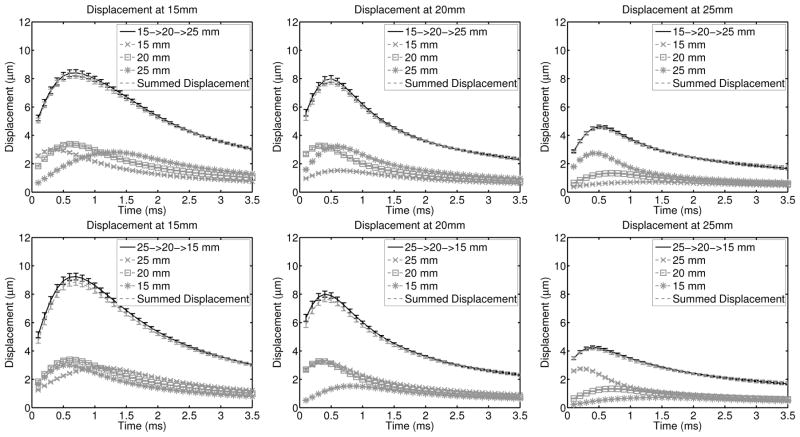
To incorporate the effects of ultrasonic tracking, matched experimental data were acquired and are shown in figure 2, where for each of 9 acquisitions, the displacements were averaged across the field of view and the error bars indicate the standard deviation over the speckle realizations. The multi-focal zone displacement (black line) was compared to the time-delayed and summed single-push individual focal zone data (dashed gray line) with a maximum RMS error of 0.2 μm over all of the configurations.
Fig. 2.
Experimentally acquired displacement though time profiles in a uniform region of the phantom are shown for each focal configuration and at each focal depth in the same configuration as figure 1. The error bars indicate the standard deviation over 9 independent speckle realizations. In each plot, the solid black line (the multi-focal zone data) is in agreement with the dashed gray line (the sum of the individual focal zone acquisitions). The RMS difference through time between the time-delayed and summed displacement profiles and the multi-focal zone acquisitions is less than 0.2μm in all configurations, which is consistent with the simulations results in figure 1.
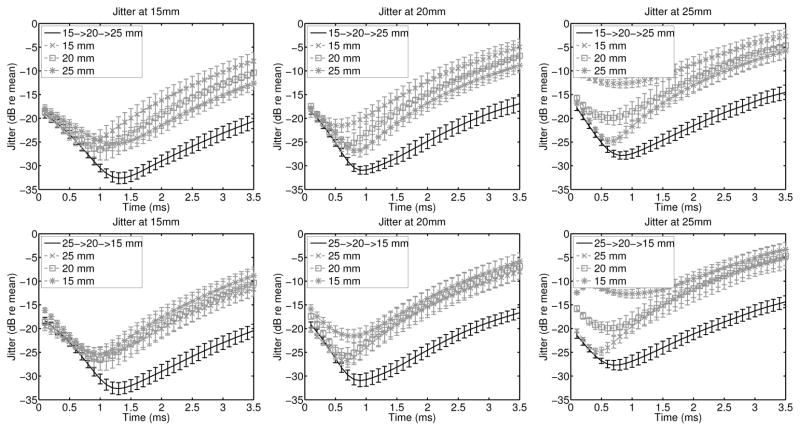
To evaluate the impact of the multi-focal zone acquisitions on displacement noise, the jitter magnitude was estimated for each focal configuration and is given in figure 3 in units of decibels relative to the mean displacement. Viewing the jitter relative to the displacement, it is necessary to interpret figures 3 and 2 together, such that a high jitter magnitude can correspond to high noise as well as low displacement magnitude, such as late in time. Overall, the multi-focal zone acquisitions have equivalent or lower jitter than any of the single push, single focal zone acquisitions, indicating that there is minimal negative impact on the displacement signal to noise ratio by utilizing the rapid multi-focal zone acquisitions.
Fig. 3.
The jitter magnitude relative to the mean displacement of the experimentally acquired data from figure 2 is shown here for each focal depth. For each of the 9 speckle realizations, the jitter was computed independently, and the error bars indicate the standard deviation of the jitter magnitude. Since the jitter magnitude is computed relative to the displacement, a high jitter magnitude is expected whenever the displacement magnitude is low, such as late in time.
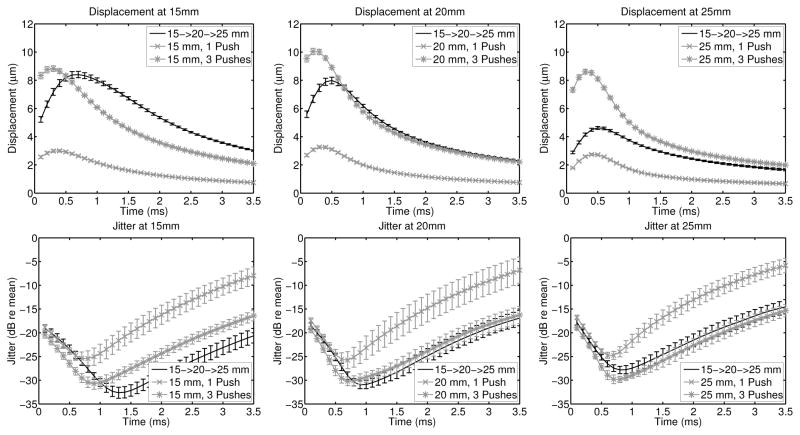
Although the previous comparisons demonstrated the linear combination of the single push, single focal zone sequences into the rapid multi-focal zone sequences, to compare image quality, triple push, single focal zone sequences were also acquired. Example displacement and jitter plots are given in figure 4, where each column is a different image and focal depth for the single focal zone sequences, which are then compared to the same rapid multi-focal zone acquisition. In all cases, the triple push sequence has the highest overall displacement; the peak displacement also occurs earlier in time for the single focal zone sequences as compared with the multi-focal zone sequence. The triple push sequences also have lower jitter than the single push sequences. For the two deeper focal depths, the jitter magnitude of both the triple push, single focal zone and the multi-focal zone sequences is similar, however for the shallowest focal depth, after the peak displacement occurs, the jitter magnitude is lower for the multi-focal zone sequence.
Fig. 4.
The experimental displacement amplitude jitter magnitude relative to the mean displacement comparing single push, single focal zone, triple push, single focal zone, and rapid multi-focal zone imaging sequences. For each of the 9 speckle realizations, the displacement magnitude and jitter was computed independently, and the error bars indicate the standard deviation of the jitter magnitude. The triple push sequence has the highest overall displacement and its peak displacement occurs earlier in time as compared with the multi-focal zone sequence.
B. Experimental Results
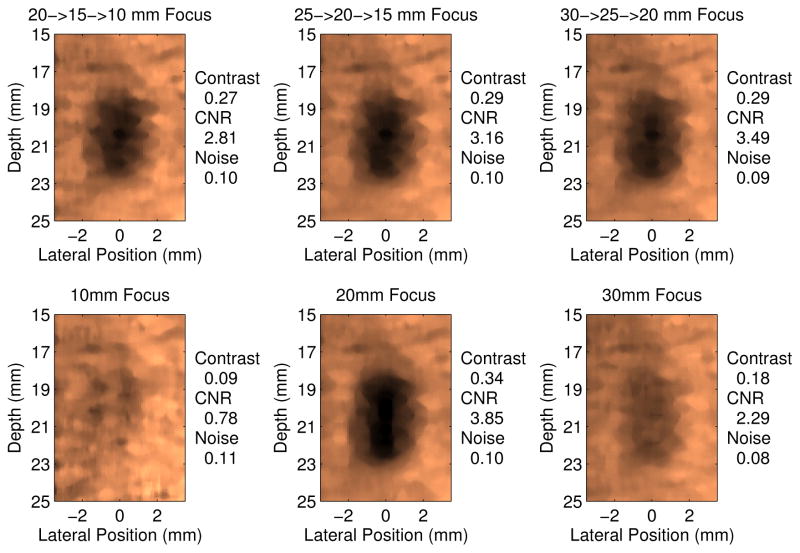
To evaluate the impact of the rapid multi-focal zone approach on CNR, experimental data were collected and processed per the methodology detailed in section IV-B. Figure 5 shows the typical ARFI image quality achieved with these sequences in the phantom. As expected, the lesion, which is centered at 20 mm, is best visualized in the 20 mm focus and combined focal zone configurations. The single focal zone acquisitions at 10 and 30 mm do not contain the target within their depth of field, so the target is poorly visualized.
Fig. 5.
Experimentally acquired ARFI images of the 4 mm cylindrical target, displayed 0.6 ms after force cessation. The top row of images shows 3 different multi-focal zone sequences and the bottom row displays the triple push, single focal zone acquisitions. Comparable image quality is achieved in all of the multi-focal zone sequences since each configuration included the 20 mm focal depth, which is centered on the lesion. Conversely, as demonstrated by the 10 mm and 30 mm single focal zone acquisitions, when the push is only focused away from the target, the image quality is severely degraded.
After the center of the lesion was identified in each image, the contrast, image noise, and CNR were computed by comparing two 4 mm circular regions at the same depth separated by 8 mm laterally. The image quality metrics were computed for each time step after the push, and an example of the temporal evolution of the contrast, noise, and CNR is given in figure 6 for the triple push, single focal zone sequence, where the error bars indicate the standard deviation over 9 speckle realizations. In figure 6, the peak contrast occurs early in time using the 20 mm focus sequence, however because the noise decreases later in time, when the contrast of the 25 mm focus sequence is peaking, the maximum CNR is achieved later in time using the 25 mm focus sequence.
Fig. 6.
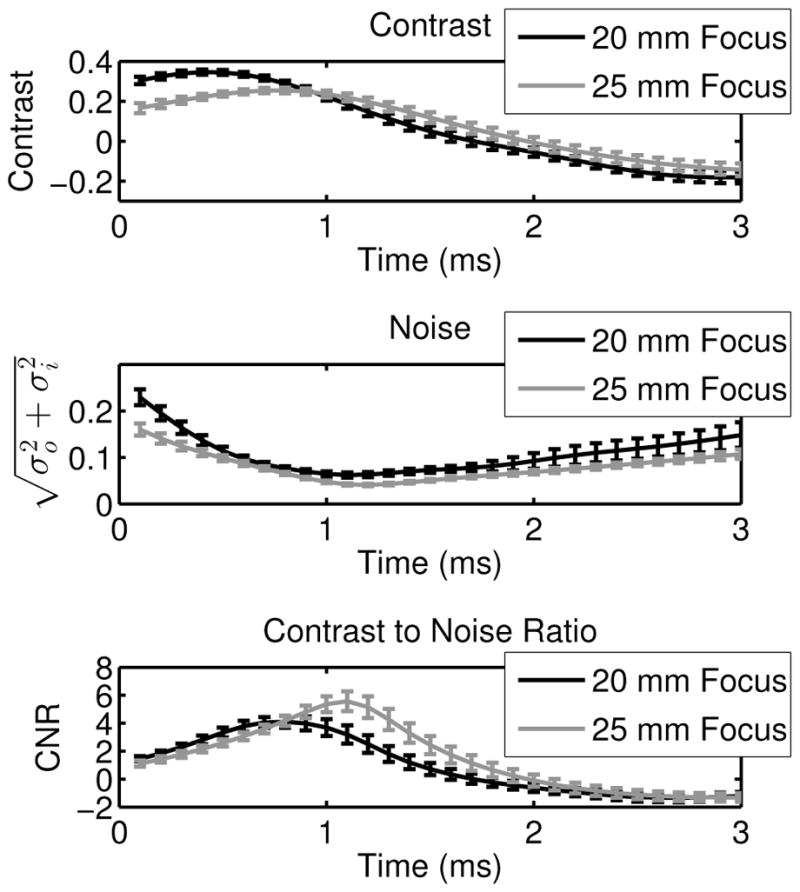
Contrast, noise, and CNR of the 4 mm cylindrical target are given, where the error bars indicate the standard deviation over 9 independent speckle realizations. The data are shown as a function of time for the triple push, single focal zone sequences at 20 mm and 25 mm. The 20 mm focus has the highest contrast, but the 25 mm focus sequence has the highest CNR due to the temporal evolution of both the contrast and the image noise.
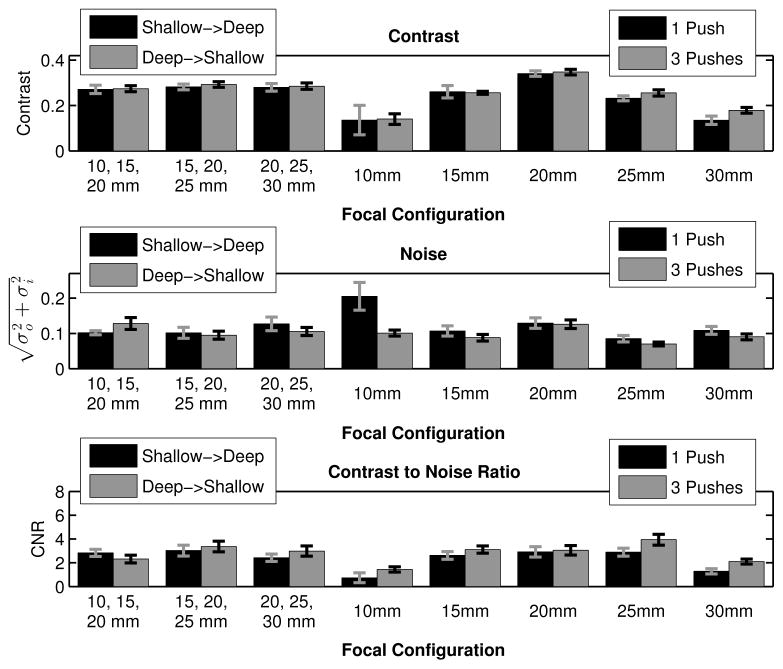
Given the temporal evolution of both contrast and CNR, to evaluate both of these image metrics, the maximum values through time were extracted, along with the image noise at those time steps. Figure 7 shows the mean and standard deviation of the contrast, noise, and CNR over 9 independent speckle realizations for the time step associated with the maximum image contrast. For the multi-focal zone sequences, the black bars indicate pushing at the shallowest focal depth first, then the middle focal depth, and finally at the deepest focal depth; the gray bars indicate pushing in the opposite order. For the single focal zone sequences, the black bars display the data associated with the single push sequences and the gray bars indicate the data for the triple push sequences. Using the data from figure 7, paired Student’s two-tailed t-tests were performed between the contrast values for the 20 mm triple push, single focal zone acquisition and all of the other focal configurations, which showed statistically significantly higher contrast (p < 0.01, top plot, figure 7). However, by limiting the comparison to only the rapid multi-focal zone and single push sequences, the 20 mm, single push sequence had the highest contrast (p < 0.01, top plot, figure 7).
Fig. 7.
Contrast, noise, and CNR of the 4 mm cylindrical target are given, where the error bars indicate the standard deviation over 9 independent speckle realizations. The bar plots portray the data from the time step where the maximum contrast through time was observed. As expected per the derivation in III, the 20 mm push focal configuration yields the highest contrast (paired Student’s two-tailed t-test, p < 0.01).
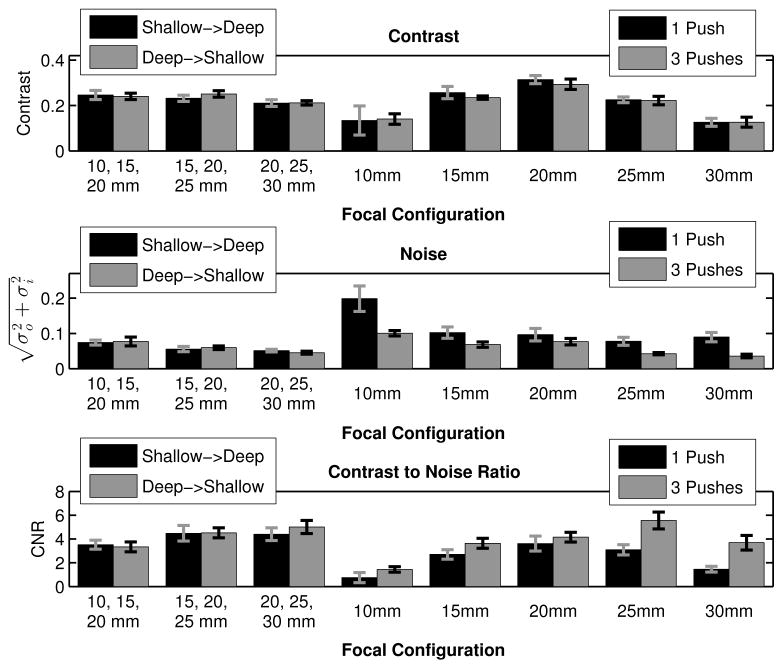
Constructed in the same manner as figure 7, figure 8 displays the contrast, noise, and CNR for each sequence from the time step associated with the maximum CNR. As shown in figure 6, this time step is usually different than the one used for the maximum contrast. Paired Student’s two-tailed t-tests were again performed, yielding that the triple push, 25 mm focal zone had the highest CNR of all of the sequences. However, comparing the rapid multi-focal zone sequences to only the single push sequences, the 30 → 25 → 20 mm combined focal zone acquisition had the highest CNR (p < 0.01, bottom plot, figure 8).
Fig. 8.
Contrast, noise, and CNR of the 4 mm cylindrical target are given, where the error bars indicate the standard deviation over 9 independent speckle realizations. The bar plots portray the data form the time step where the maximum CNR through time was observed. In many of the focal configurations, by looking later in time after force cessation, the noise decreases, increasing the CNR of the target. The triple push, 25 mm focus sequence had the highest CNR (paired Student’s two-tailed t-test, p < 0.01), but comparing the multi-focal zone sequences to the single push, single focal zone sequences, the 20 → 25 → 30 mm combined focal zone acquisition had the highest CNR (p < 0.01).
VI. Discussion
Through the development of technological improvements in ultrasound scanners and power supplies, rapid multi-focal zone ARFI imaging is now possible, allowing extended regions of interest without any increase in acquisition time. Additionally, depending on the relative positions of the focal zones and the target being imaged, there is either minimal degradation or improvement of image quality based on the CNR of target as compared to a single push, single focal zone images.
By rapidly pushing at multiple focal depths, the displacements sum linearly at each depth as shown in figures 1 and 2. In the FEM simulations, the match between the summed individual profiles and the simulated multi-focal zone pushes was nearly perfect (RMS error < 0.01μm), indicating that multi-focal zone pushes maintain spatial invariance since the displacements induced are small compared to the distance between the focal depths. In the experimental data, the time-delayed and summed displacement data had slightly lower displacement magnitude early in time as compared to the multi-focal zone acquisitions. We hypothesize that this discrepancy arises from underestimation of the tissue motion due to ultrasonic tracking and resulting shearing under the point spread function (PSF) [20], [26]. The single focal zone acquisitions have relatively higher shearing under the PSF near the focus of each push as compared to the multi-focal zone pushes, which have a slightly broadened push beam due to the superposition of the focal geometries of all of the pushes [20], [26].
Although the displacement magnitude sums linearly when using multi-focal zone configurations, the relative jitter magnitude is similar early in time to the single focal zone acquisitions, as demonstrated in figure 3. This result is expected since the only primary source of jitter that is impacted by the multi-focal zone acquisitions is the correlation coefficient, which is related to shearing under the point spread function [27], [22]. The multi-focal zone acquisitions increase the displacement magnitude, but they do not increase the shearing of the tissue due to the relatively broader pushes. As discussed earlier, it is hypothesized that the rapid multi-focal zone pushes slightly decrease the shearing under the PSF; however, for the jitter magnitude early in time, there are no significant differences since the error bars overlap.
Given the increased quantity of acoustic energy used in the multi-focal zone sequences, the larger displacement magnitudes for all of the focal depths were expected. However, to analyze the results assuming a finite amount of acoustic energy, the rapid multi-focal zone sequences were compared to the triple push, single focal zone sequences in figure 4. In all cases, it is apparent that the triple push, single focal zone sequences have the highest displacement and lowest jitter early in time. However, since the peak displacement for the rapid multi-focal zone sequences occurs later in time, the relative jitter magnitude can be lower, as demonstrated in 15 mm subfigure (bottom left plot, figure 4).
The comparison between sequences was then extended to the image quality metrics of contrast, noise, and CNR. Figure 6 demonstrates the temporal evolution of these metrics after force cessation, which indicates that the maximum contrast and the maximum CNR are achieved both with different sequences and at different times. The maximum CNR consistently occurs later in time than the maximum contrast due to the reduction in image noise that occurs as the shearing under the tracking PSF decreases with time, while the displacement at the target is still high.
The contrast, noise, and CNR were then evaluated for all of the different sequences, looking at data from the time step associated with the maximum contrast or the maximum CNR. For the maximum contrast data (figure 7), the triple push, 20 mm focus had the highest target contrast (p < 0.01, top plot, figure 7), and if the triple push sequences are removed from the analysis, the single push, 20 mm focus has the highest contrast (p < 0.01, top plot, figure 7). These results are consistent with the derivation presented in section III (equation 5), confirming that the use of multi-focal zone ARFI imaging degrades the maximum contrast achievable in a ARFI image.
However, figure 7 (bottom plot) also demonstrates that the maximum CNR is highly dependent on the noise level, which decreases later in time and can be reduced by utilizing either the triple push sequences or multi-focal zone ARFI imaging. Specifically, figure 8 displays the data from the time step associated with the maximum CNR for each sequence. Overall, the triple push sequence focused at 25 mm has the highest CNR (p < 0.01, bottom plot, figure 8), and if the triple push sequences are removed from the analysis, the CNR when using the 30 → 25 → 20 mm combined focal zone is highest (p < 0.01, bottom plot, figure 8).
Analyzing the data in figures 7 and 8, two primary conclusions can be drawn: to achieve maximum contrast, the radiation force excitation should be focused at the center of the target, but to achieve maximum CNR, the push should focused slightly below the target using the maximum amount of available energy. Generally, CNR is a better indicator of image quality than contrast since it incorporates target conspicuity, however, it is also noteworthy that the maximum CNR occurs later in time than the maximum contrast, at which point the lesion size may be incorrect [10].
As compared to the single focal zone sequences, the rapid multi-focal zone sequences yield consistent image quality throughout a much larger excitation depth, which would result in overall better image quality for targets larger than the single focal zone depth of field or if the exact depth of the target was unknown. Additionally, as compared to the single push, single focal zone sequences, the rapid multi-focal zone sequences can have a higher CNR (bottom plot, figure 8), and all of the sequences have less than 20% loss in the target contrast (top plot, figure 7) as compared to the 20 mm focus sequence.
An alternative interpretation of rapid multi-focal zone imaging is as an optimization parameter since it extends the depth of field of the ARFI image, while not increasing the acquisition duration. Thus, if a certain depth of field for the image is desired, the F-number for a single focal zone sequence can be computed, but multiple rapid multi-focal zone sequences could also be designed, which would have narrower excitation beams and therefore potentially improved image quality [10], which is similar to the advantage that arises from the use of the ’supersonic’ excitations for SWEI [14].
Lastly, comparing the rapid multi-focal zone approach to previously published multi-focal zone ARFI imaging methods, any potential motion artifact is reduced since the data is acquired in 1/N amount of time, where N is the number of focal zones. Additionally, the overall acoustic exposure is reduced since fewer tracking pulses are required, which can consist of over 30% of the total acoustic energy output.
VII. Conclusions
In this paper, we have performed an analysis of the displacement magnitude, noise, contrast, and CNR to compare single- and rapid multi-focal zone ARFI imaging. By utilizing rapid multi-focal zone ARFI imaging, the depth of field in the images is extended beyond that of a single focal zone without decreasing frame rate, the CNR of targets within the region of excitation can increase by upwards to 40%, and the acquisition duration is significantly lower compared to conventional blended images, reducing potential motion artifacts. Thus, we conclude rapid multi-focal zone acquisitions can improve overall image quality, depending on the imaging conditions and the size of the target being image, but the implementation of rapid multi-focal zone imaging is contingent upon an adequate power supply and sufficiently low acoustic energy exposure.
Acknowledgments
This work has been supported by NIH grants EB001040, EB002132, and CA142824. We thank the Ultrasound Division at Siemens Medical Solutions, USA, Inc. for their technical and in-kind support.
References
- 1.Nightingale KR, Palmeri M, Nightingale R, Trahey G. On the feasibility of remote palpation using acoustic radiation force. J Acoust Soc Am. 2001;110:625–634. doi: 10.1121/1.1378344. [DOI] [PubMed] [Google Scholar]
- 2.Nightingale KR, Soo M, Nightingale R, Trahey GE. Acoustic radiation force impulse imaging: In vivo demonstration of clinical feasibility. Ultrasound Med Biol. 2002;28:227–235. doi: 10.1016/s0301-5629(01)00499-9. [DOI] [PubMed] [Google Scholar]
- 3.Sharma AC, Soo MS, Trahey GE, Nightingale KR, Congdon AN. Acoustic Radiation Force Impulse (ARFI) imaging of in vivo breast masses. IEEE Ultrasonics, Ferroelectrics and Frequency Control Joint Symposium. 2004;(1):728–731. [Google Scholar]
- 4.Zhai L, Polascik TJ, Foo WC, Rosenzweig S, Palmeri ML, Madden J, Nightingale KR. Acoustic radiation force impulse imaging of human prostates: initial in vivo demonstration. Ultrasound in medicine & biology. 2012 Jan;38(1):50–61. doi: 10.1016/j.ultrasmedbio.2011.10.002. [DOI] [PMC free article] [PubMed] [Google Scholar]
- 5.Rosenzweig S, Palmeri M, Rouze N, Lipman S, Kulbacki E, Madden J, Polascik T, Nightingale K. Comparison of Concurrently Acquired In Vivo 3D ARFI and SWEI Images of the Prostate. IEEE Ultrasonics Symposium. 2012:97–100. [Google Scholar]
- 6.Fahey BJ, Nelson RC, Bradway DP, Hsu SJ, Dumont DM, Trahey GE. In vivo visualization of abdominal malignancies with acoustic radiation force elastography. Physics in Medicine and Biology. 2008;53(1):279. doi: 10.1088/0031-9155/53/1/020. [DOI] [PMC free article] [PubMed] [Google Scholar]
- 7.Eyerly SA, Bahnson TD, Koontz JI, Bradway DP, Dumont DM, Trahey GE, Wolf PD. Intracardiac acoustic radiation force impulse imaging: a novel imaging method for intraprocedural evaluation of radiofrequency ablation lesions. Heart rhythm : the official journal of the Heart Rhythm Society. 2012 Nov;9(11):1855–62. doi: 10.1016/j.hrthm.2012.07.003. [DOI] [PMC free article] [PubMed] [Google Scholar]
- 8.Doherty JR, Dahl JJ, Trahey GE. Harmonic tracking of acoustic radiation force-induced displacements. IEEE transactions on ultrasonics, ferroelectrics, and frequency control. 2013 Nov;60(11):2347–58. doi: 10.1109/TUFFC.2013.6644738. [DOI] [PMC free article] [PubMed] [Google Scholar]
- 9.Dahl JJ, Dumont DM, Allen JD, Miller EM, Trahey GE. Acoustic radiation force impulse imaging for noninvasive characterization of carotid artery atherosclerotic plaques: a feasibility study. Ultrasound in medicine & biology. 2009 May;35(5):707–16. doi: 10.1016/j.ultrasmedbio.2008.11.001. [DOI] [PMC free article] [PubMed] [Google Scholar]
- 10.Nightingale KR, Palmeri ML, Trahey GE. Analysis of contrast in images generated with transient acoustic radiation force. Ultrasound Med Biol. 2006;32:61–72. doi: 10.1016/j.ultrasmedbio.2005.08.008. [DOI] [PubMed] [Google Scholar]
- 11.Sharma A, Trahey G, Frinkley K, Soo MS, Palmeri M, Nightingale K. Image processing and data acquisition optimization for Acoustic Radiation Force Impulse imaging of in vivo breast masses. In: Walker WF, Emelianov SY, editors. SPIE Proceedings: Medical Imaging. International Society for Optics and Photonics; Apr, 2005. pp. 205–215. [Google Scholar]
- 12.Palmeri ML, Dahl JJ, MacLeod DB, Grant SA, Nightingale KR. On the feasibility of imaging peripheral nerves using acoustic radiation force impulse imaging. Ultrasonic imaging. 2009 Jul;31(3):172–82. doi: 10.1177/016173460903100303. [DOI] [PMC free article] [PubMed] [Google Scholar]
- 13.Sarvazyan AP, Rudenko OV, Swanson SD, Fowlkes JB, Emelianov SY. Shear wave elasticity imaging: a new ultrasonic technology of medical diagnostics. Ultrasound in medicine & biology. 1998 Nov;24(9):1419–35. doi: 10.1016/s0301-5629(98)00110-0. [DOI] [PubMed] [Google Scholar]
- 14.Bercoff J, Tanter M, Fink M. Supersonic shear imaging: a new technique for soft tissue elasticity mapping. Ultrasonics, Ferroelectrics and Frequency Control, IEEE Transactions on. 2004 Apr;51(4):396–409. doi: 10.1109/tuffc.2004.1295425. [DOI] [PubMed] [Google Scholar]
- 15.Tanter M, Bercoff J, Athanasiou A, Deffieux T, Gennisson JL, Montaldo G, Muller M, Tardivon A, Fink M. Quantitative Assessment of Breast Lesion Viscoelasticity: Initial Clinical Results Using Supersonic Shear Imaging. Ultrasound in medicine & biology. 34(9):1373–1386. doi: 10.1016/j.ultrasmedbio.2008.02.002. [DOI] [PubMed] [Google Scholar]
- 16.Bercoff J, Tanter M, Fink M. Sonic boom in soft materials: The elastic Cerenkov effect. Applied Physics Letters. 2004;84(12):2202. [Google Scholar]
- 17.Rosenzweig S, Palmeri M, Nightingale K. GPU-based real-time small displacement estimation with ultrasound. IEEE transactions on ultrasonics, ferroelectrics, and frequency control. 2011 Feb;58(2):399–405. doi: 10.1109/TUFFC.2011.1817. [DOI] [PMC free article] [PubMed] [Google Scholar]
- 18.Torr GR. The Acoustic Radiation Force. Am J Phys. 1984;52:402–408. [Google Scholar]
- 19.Miller JV, Farison JB, Shin Y. Spatially invariant image sequences. ”IEEE” transactions on image processing : a publication of the IEEE Signal Processing Society. 1992 Jan;1(2):148–61. doi: 10.1109/83.136592. [DOI] [PubMed] [Google Scholar]
- 20.Palmeri ML, Sharma AC, Bouchard RR, Nightingale RW, Nightingale KR. A finite-element method model of soft tissue response to impulsive acoustic radiation force. Ultrasonics, Ferroelectrics and Frequency Control, IEEE Transactions on. 2005;52(10):1699–1712. doi: 10.1109/tuffc.2005.1561624. [DOI] [PMC free article] [PubMed] [Google Scholar]
- 21.Jensen JA, Svendsen NB. Calculation of pressure fields from arbitrarily shaped, apodized, and excited ultrasound transducers. IEEE transactions on ultrasonics, ferroelectrics, and frequency control. 1992 Jan;39(2):262–7. doi: 10.1109/58.139123. [DOI] [PubMed] [Google Scholar]
- 22.Palmeri ML, McAleavey Sa, Trahey GE, Nightingale KR. Ultrasonic tracking of acoustic radiation force-induced displacements in homogeneous media. IEEE transactions on ultrasonics, ferroelectrics, and frequency control. 2006 Jul;53(7):1300–13. doi: 10.1109/tuffc.2006.1665078. [DOI] [PMC free article] [PubMed] [Google Scholar]
- 23.Loupas T, Powers JT, Gill RW. An axial velocity estimator for ultrasound blood flow imaging, based on a full evaluation of the Doppler equation by means of a two-dimensional autocorrelation approach. Ultrasonics, Ferroelectrics and Frequency Control, IEEE Transactions on. 1995 Jul;42(4):672–688. [Google Scholar]
- 24.Pinton GF, Dahl JJ, Trahey GE. Rapid tracking of small displacements with ultrasound. IEEE Trans Ultrason, Ferroelect, Freq Contr. 2006;53:1103–1117. doi: 10.1109/tuffc.2006.1642509. [DOI] [PubMed] [Google Scholar]
- 25.Dahl J, Pinton G, Palmeri M, Agrawal V, Nightingale K, Trahey G. A parallel tracking method for acoustic radiation force impulse imaging. IEEE Transactions on Ultrasonics, Ferroelectrics and Frequency Control. 2007 Feb;54(2):301–312. doi: 10.1109/tuffc.2007.244. [DOI] [PMC free article] [PubMed] [Google Scholar]
- 26.McAleavey S, Nightingale K, Trahey G. Estimates of echo correlation and measurement bias in acoustic radiation force impulse imaging. IEEE Transactions on Ultrasonics, Ferroelectrics and Frequency Control. 2003 Jun;50(6):631–641. doi: 10.1109/tuffc.2003.1209550. [DOI] [PubMed] [Google Scholar]
- 27.Walker W, Trahey G. A Fundamental Limit on Delay Estimation Using Partially Correlated Speckle Signals. IEEE Trans Ultrason, Ferroelec, Freq Contr. 1995;42(2):301–308. [Google Scholar]


