

Abstract
Frataxin is required for maintenance of normal mitochondrial iron levels and respiration. The mature form of yeast frataxin (mYfh1p) assembles stepwise into a multimer of 840 kDa (α48) that accumulates iron in a water-soluble form. Here, two distinct iron oxidation reactions are shown to take place during the initial assembly step (α → α3). A ferroxidase reaction with a stoichiometry of 2 Fe(II)/O2 is detected at Fe(II)/mYfh1p ratios of ≤0.5. Ferroxidation is progressively overcome by autoxidation at Fe(II)/mYfh1p ratios of >0.5. Gel filtration analysis indicates that an oligomer of mYfh1p, α3, is responsible for both reactions. The observed 2 Fe(II)/O2 stoichiometry implies production of H2O2 during the ferroxidase reaction. However, only a fraction of the expected total H2O2 is detected in solution. Oxidative degradation of mYfh1p during the ferroxidase reaction suggests that most H2O2 reacts with the protein. Accordingly, the addition of mYfh1p to a mixture of Fe(II) and H2O2 results in significant attenuation of Fenton chemistry. Multimer assembly is fully inhibited under anaerobic conditions, indicating that mYfh1p is activated by Fe(II) in the presence of O2. This combination induces oligomerization and mYfh1p-catalyzed Fe(II) oxidation, starting a process that ultimately leads to the sequestration of as many as 50 Fe(II)/subunit inside the multimer.
The two major iron-utilizing processes in the cell, production of heme by ferrochelatase and the iron-sulfur cluster biosynthetic pathway, reside in the mitochondrial matrix. Mitochondria contain micromolar concentrations of chelatable iron (1), i.e. iron that is not yet complexed in heme or iron-sulfur clusters and is bioavailable (2). Keeping this iron pool in soluble and nontoxic form represents a remarkable biological challenge given the alkaline pH (3) and the high production of and H2O2 (4) within mitochondria. Thus, the existence of proteins capable of handling iron safely within mitochondria was first postulated several decades ago (5). Recent studies have identified a handful of inner mitochondrial membrane proteins involved in mitochondrial iron transport (6 – 8) as well as a mitochondrial matrix ferritin involved in iron storage (9). The mitochondrial matrix protein frataxin has been implicated in mitochondrial iron homeostasis (10, 11), but its precise function is still not known. Frataxin was first identified as the protein deficient in Friedreich ataxia, a neuro- and cardio-degenerative disease (12). Studies in Saccharomyces cerevisiae have shown that defects in yeast or human frataxin are associated with the accumulation of iron in mitochondria and oxidative damage to both mitochondrial and nuclear DNA as well as to the iron-sulfur centers of mitochondrial aconitase and other respiratory enzymes (10, 14, 15, 34). Similarly, mouse models in which the frataxin gene is selectively inactivated in neuronal or cardiac tissue present multiple respiratory enzyme deficits and accumulate iron in mitochondria in a time-dependent manner (16). In agreement with these observations, evidence of abnormal cellular iron homeostasis, increased oxidative damage, and respiratory enzyme deficits has been reported for the human disease (reviewed in Ref. 17). It has been shown that frataxin defects result in impaired mitochondrial iron efflux (18), defective biosynthesis of iron-sulfur clusters (19, 20), loss of ATP synthesis (21), and/or disabled antioxidant defenses (22), all conditions that could ultimately lead to mitochondrial iron accumulation and increased oxidative damage. We have proposed that the apparent involvement of frataxin in so many diverse processes could be explained if the basic function of this protein were to provide an iron storage mechanism to keep iron in a bioavailable and nontoxic form (17). Indeed, titration of the mature form of yeast frataxin (mYfh1p) with Fe(II) under aerobic conditions results in stepwise assembly of a 48-subunit multimer with a molecular mass of 840 kDa and a hydrodynamic radius of 11 nm that sequesters 50 atoms of iron/subunit and forms iron-rich cores with a diameter of 2– 4 nm (23, 24). Similarly, the mature form of human frataxin assembles naturally during expression in Escherichia coli yielding regular multimers of ~1 MDa and ordered polymers of these multimers that sequester ~10 atoms of iron/subunit (25). Frataxin can be detected in a high molecular mass complex under native conditions in yeast or mouse heart, and both the yeast and the human protein bind stoichiometric amounts of 55Fe in metabolically labeled yeast cells (23, 25). In this study, we investigate the iron oxidation reaction of yeast frataxin. Our results support a direct role for frataxin in iron metabolism.
EXPERIMENTAL PROCEDURES
Reagents and Solutions
HEPES, ferrous ammonium sulfate, 2-de-oxyribose, thiobarbituric acid, and α-α′-bipyridine were from Sigma, and beef liver catalase was from Roche Molecular Biochemicals. All of the buffers and solutions were made with milli-Q deionized water. Stock solutions of ferrous ammonium sulfate (2–10 mM; pH 3.6) were freshly prepared in water previously deaerated by purging with argon gas (<0.2 ppm O2). Recombinant mYfh1p was expressed in E. coli (23) and purified as previously described (24). The protein concentration was determined from the absorbance and extinction coefficient of mYfh1p monomer (ε280 = 20,000 M−1 cm−1). Iron concentration measurements were carried out by inductively coupled plasma emission spectroscopy at the Metals Laboratory, Department of Laboratory Medicine and Pathology, Mayo Clinic, Rochester, MN.
Electrode Oximetry
Measurements of dissolved O2 concentration were performed with a MI-730 micro-O2 electrode connected to an O2-ADPT adapter (Microelectrodes, Inc., NH). A TBX-68T isothermal terminal block connected to a NI 4350 high precision voltage meter and a personal computer with the LabVIEW Base Package (National Instruments, Austin, TX) were used for data acquisition. The electrode was calibrated with HEPES-KOH buffer at each experimental pH and temperature, using buffer deaerated by extensive purging with argon gas (<0.2 ppm O2) (0% standard) and air-saturated buffer (21% standard). To determine the O2 electrode response time, the electrode was equilibrated in air-saturated water and then quickly plunged into a rapidly stirred 100 mM dithionite solution or a deaerated solution, and the electrode output was measured versus time (26). The electrode response followed first order kinetics with a half-life of 6 s. The drift of the O2 electrode was not significant (~1 μM O2/40 min). O2 consumption was monitored in a 0.6-ml cell. After addition of buffer with or without protein, the cell was sealed with a rubber stopper fitted with the O2 microelectrode described above and a cone-shaped capillary (height, 4.5 cm; volume, 200 μl) with the vertex toward the inside of the cell. The capillary was partially filled with buffer and used as a port to eliminate empty air space and air bubbles. The final volume of the sample in the cell was 0.465 ml. During measurements, the sample was rapidly stirred with a microspin bar, and the temperature was maintained constant by use of a water jacket connected to a circulating water bath. The diffusion of O2 to and from the cell was determined to be insignificant over a period of 40 min. The reactions were started by adding anaerobically prepared Fe(II) stock solution (5–15 μl of total volume added) to the sample using a gas-tight syringe with a 22-gauge needle that was inserted into the cell through the buffer-filled capillary. HEPES is known to retard Fe(II) oxidation, albeit to a much lower degree compared with other Good’s buffers (27). To minimize this effect, a relatively low concentration (10 mM) of HEPES-KOH buffer was used for O2 consumption measurements, which was sufficient to maintain the pH at 7.0 – 6.97 at all iron concentrations tested.
Ultrafiltration Assays and Gel Filtration
An aliquot of Fe(II) stock solution was directly added to 10 mM HEPES-KOH, pH 7.0, with or without protein present. The samples (500 μl) were incubated at 30 °C for different times and immediately transferred to a Ultrafree-0.5 cell (nominal molecular weight limit = 5,000) (Millipore, Bedford, MA) and centrifuged for 5 min at 14,000 × g at 4 °C. The concentrate and the filtrate were transferred to Eppendorf tubes, a few crystals of dithionite and α-α′-bipyridine (final concentration, 2 mM) were added to each sample, and the concentration of Fe[α-α′-bipyridine]32+ (ε520 = 9,000 M−1 cm−1) was determined in a DU640B spectrophotometer (Beckman, Fullerton, CA) (28). After removal of the concentrate, insoluble iron was stripped from the Ultrafree membrane by adding 500 μl of buffer containing a few crystals of dithionite and 2 mM α-α′-bipyridine and by mixing vigorously for 1 min, followed by absorbance measurements at 520 nm as described above. For gel filtration analysis of assembly reaction products, the samples (1 ml) were centrifuged for 5 min at 20,800 × g at 4 °C and loaded onto a Superdex 200 column (23). In anaerobic experiments, the buffer and the protein stock solution were made anaerobic by purging with moisturized argon gas (<0.2 ppm O2). Protein and Fe(II) were added to 2-ml vials sealed with a rubber septum (Sherwood Medical, St. Louis, MO) (final volume, 100 μl) by a gas-tight syringe, and the assembly reaction was incubated for 1 h at 30 °C (23). After cooling of the sample at 4 °C to stop any ongoing assembly reaction (24), a 50-μl aliquot was loaded onto a TSK-GEL G4000SW column (7.5 mm × 30 cm) (Tosoh Biosep, Montgomeryville, PA) using a 50-μl loop and a gas-tight syringe. The column was equilibrated with 10 mM HEPES-KOH, pH 7.3, 100 mM NaCl, previously deaerated by purging with research grade nitrogen gas (<0.5 ppm O2). The protein was eluted with 19 ml of the same buffer at a flow rate of 0.6 ml/min at 4 °C.
Detection of H2O2, Protein Carbonyls, and Malondialdehyde
To determine the production of H2O2 by electrode oximetry, catalase (2,600 – 3,900 units) was added to 0.465 ml of 96 μM mYfh1p in 10 mM HEPES-KOH, pH 7.0, either before or after the addition of Fe(II), and the O2 consumption and Fe(II)/O2 stoichiometry for the completed reaction were measured (29). Production of H2O2 was further measured by the Amplex Red hydrogen peroxide/peroxidase assay kit from Molecular Probes, Inc. (Eugene, OR) (29). All of the reactions (1 ml) were performed in vials sealed with a rubber septum according to the manufacturer’s protocol except that 50 mM HEPES-KOH, pH 7.0, was used instead of 50 mM phosphate pH 7.4 buffer (29). The fluorescence intensity of samples in which Fe(II) was added to mYfh1p in the presence of Amplex Red and horseradish peroxidase (Amplex Red/HRP)1 was not significantly different from that of samples in which Amplex Red/HRP was added after the addition of Fe(II). In subsequent experiments, Fe(II) was therefore added to mYfh1p in the presence of Amplex Red/HRP. For standard curves, known concentrations of H2O2 were added to buffer in the presence of Amplex Red/HRP. Both H2O2 standards and unknown samples were incubated for 30 min at 30 °C and treated identically. Fluorescence emission was measured in a QuantaMaster fluorimeter (Photon Technology International, Ontario, Canada) from 570 to 610 nm with excitation at 530 nm. The concentration of H2O2 was calculated from the area under each fluorescence emission curve. Background fluorescence was determined with buffer containing Amplex Red/HRP for H2O2 standards, and with buffer containing Amplex Red/HRP and the appropriate Fe(II) concentration for unknown samples. The absorbance at 530 nm was <0.02 for all samples. OxyBlot kit (Intergen, Purchase, NY) was used to detect protein oxidation. The reactions (25 μl) containing mYfh1p in the absence or presence of Fe(II) were incubated under the experimental conditions used in the Amplex Red/HRP assays described above, after which carbonyl groups were derivatized to 2,4-dinitrophenylhydrazone (DNP) by reaction with an equal volume of 2,4-dinitrophenylhydrazine for 25 min at room temperature and neutralized according to the manufacturer’s protocol. The samples were analyzed by 12% SDS/PAGE and Western blotting (30) using a polyclonal anti-DNP antiserum. Following immunodetection of carbonyls, the proteins were detected by SYPRO Ruby staining of the membrane (Molecular Probes, Inc.). In oxidative degradation assays, different combinations of 48 μM Fe(II), 24 μM H2O2, and/or 5 mM 2-deoxyribose were incubated in 10 mM HEPES-KOH, pH 7.0, in the absence or presence of 96 μM mYfh1p (final volume, 200 μl) for 30 min at 30 °C. Phosphoric acid (4%) and thiobarbituric acid (1%) were added (200 μl each), and each sample was boiled for 15 min. After cooling of the samples on ice for 3 min, 75 μl of 10% SDS was added, and a malondialdehyde-thiobarbituric acid adduct (ε532 = 1.54 × 10⁵ M−1 cm−1) was measured as described by Halliwell and Gutteridge (31).
RESULTS
Yeast Frataxin Catalyzes Fe(II) Oxidation at Low Fe(II)/mYfh1p Ratios
Electrode oximetry was used to study the iron oxidation reaction of mYfh1p at low Fe(II)/mYfh1p ratios. We showed previously that these conditions result in the assembly of an oligomeric species, α3, predicted to represent the building unit of the mYfh1p multimer (23). Fig. 1A shows the O2 consumption curves recorded when 24, 48, or 144 μM Fe(II) was incubated in 10 mM HEPES-KOH, pH 7.0, at 30 °C, in the absence or presence of 96 μM mYfh1p. At 24 or 48 μM Fe(II), O2 consumption was facilitated in the presence of mYfh1p (Fig. 1A). The stoichiometric Fe(II)/O2 ratios at the end of these two reactions were 2.2 and 2.4 (Fig. 1A). Stoichiometric Fe(II)/O2 ratios of 3.5 and 3.2 were otherwise measured when 24 or 48 μM Fe(II), respectively, was incubated in buffer without mYfh1p (Fig. 1A). At 144 μM Fe(II), similar stoichiometric Fe(II)/O2 ratios of 3.9 and 4.0 were determined in the presence or absence of mYfh1p, respectively (Fig. 1A). A Fe(II)/O2 stoichiometry of ~2 was consistently observed in repeated measurements at 24, 36, or 48 μM Fe(II) in the presence of 96 μM mYfh1p, corresponding to a Fe(II)/mYfh1p ratio of ≤0.5 (Fig. 1B). A Fe(II)/O2 stoichiometry of 2.3 ± 0.4 (n = 4) was similarly determined in the presence of 30 μM Fe(II) and 60 μM mYfh1p (Fe(II)/mYfh1p = 0.5) (data not shown). However, the Fe(II)/O2 stoichiometry progressively increased to a maximum value of ~4 at a Fe(II)/mYfh1p ratio of >0.5 (Fig. 1B). In contrast, an average Fe(II)/O2 stoichiometry of ~3.6 was consistently obtained in buffer without protein at different Fe(II) concentrations (Fig. 1B). This was also the case when 30 μM Fe(II) was incubated at 20 °C in the absence or presence of 96 μM mYfh1p (Fe(II)/mYfh1p = 0.3), yielding a Fe(II)/O2 stoichiometry of 4.3 ± 0.9 (n = 3) and 2.5 ± 0.4 (n = 2), respectively (data not shown).
Fig. 1. Ferroxidase activity of mYfh1p.

A, O2 consumption curves in the presence of 96 μM mYfh1p or buffer without protein added. The conditions were 10 mM HEPES-KOH, pH 7.0, at 30 °C in the presence of 24, 48, or 144 μM Fe(II). B, O2 consumption curves were recorded in the presence of 96 μM mYfh1p and the indicated Fe(II) concentrations. The Fe(II)/O2 stoichiometry determined for each completed reaction is plotted versus the Fe(II) concentration (bottom x axis) and the Fe(II)/mYfh1p subunit ratio (top x axis). The bars represent the means ± S.D. in 2–5 (mYfh1p; red plot) or 1–11 (buffer only; black plot) independent measurements. The pH remained between 7.00 and 6.97 throughout the reactions both in the absence and the presence of mYfh1p.
A Fe(II)/O2 stoichiometry of 2 is typical of the ferroxidation reaction of H-ferritin (26, 32). The results reported above are therefore consistent with the presence of ferroxidase activity when ≤0.5 Fe(II) equivalents are added to mYfh1p, with autoxidation overriding ferroxidation at higher Fe(II)/mYfh1p ratios. In addition, at a Fe(II)/mYfh1p ratio ≤0.5, we have detected production of H2O2 (see below). These results together support a ferroxidation site similar to that of H-ferritin, in which H2O2 is produced from two-electron reduction of O2 at a binuclear iron center (27). During iron deposition in vertebrate ferritins, autoxidation overrides ferroxidation when the Fe(II) concentration exceeds 2 Fe(II)/ferroxidation site (27). This threshold corresponds to ≤2 Fe(II)/H-subunit, because each H-subunit contains one binuclear iron ferroxidation site (27). Therefore, we have assumed a binuclear iron site for mYfh1p and have estimated the number of ferroxidation sites per subunit using the following equation.
| (Eq. 1) |
where “0.5– 0.6 Fe(II)/subunit” is the smallest interval determined in Fig. 1B within which autoxidation overcomes the ferroxidation reaction of mYfh1p, and “2 Fe(II)/ferroxidation site” is the threshold that cannot be exceeded to observe ferroxidase activity, as described for H-ferritin (27). The equation yields a value of 0.25– 0.30, suggesting a ferroxidation site formed by four or three subunits. A three-subunit site would be consistent with the progression, α→ α3 → α6 → α12 → α24 → α48, determined previously by gel filtration analysis of the iron-dependent stepwise assembly of mYfh1p (23, 24). Importantly, α3, not α, was the smallest iron-containing species detected in this progression (23).
Oligomerization of mYfh1p Initiates Fe(II) Binding and Oxidation
To identify the form of mYfh1p responsible for iron oxidation, monomer (96 μM) was incubated with Fe(II) at a Fe(II)/mYfh1p ratio of 0.25, 0.5, or 1.5 at 30 °C for 25 min, which is the average time required for the iron oxidation reaction to be completed under these experimental conditions (Fig. 1A). Immediately afterward, each reaction was subjected to ultrafiltration at 14,000 × g for 5 min at 4 °C with a molecular mass cut-off of ≤5 kDa. In controls containing buffer without mYfh1p, most iron was recovered in the flow-through and/or in insoluble form (Table I). In all reactions containing mYfh1p, however, most iron was recovered in the concentrate (Table I), indicating that it was bound to the protein. The Fe(III)/mYfh1p ratios in the concentrate from the three reactions analyzed in Table I were 0.21, 0.43, and 1.2. These ratios are close to the initial Fe(II)/mYfh1p ratio of 0.25, 0.5, and 1.5, respectively, indicating that most added iron was bound to mYfh1p at the end of the oxidation reaction.
Table I.
Analysis of iron binding by mYfh1p oligomer (α3)
| Fe2+/mYfh1p ratioa
|
|||
|---|---|---|---|
| 0.25/1 at 24 μM Fe2+ |
0.5/1 at 48 μM Fe2+ |
1.5/1 at 144 μM Fe2+ |
|
| Buffer | |||
| Concentrate | 0.6 ± 0.1b | 2.7 ± 0.7 | 1.9 ± 1.4 |
| Flow-through | 11.2 ± 0.5 | 16.0 ± 1.0 | 5.1 ± 0.7 |
| Insoluble iron | 7.5 ± 0.9 | 23.9 ± 1.0 | 90.5 ± 8.0 |
| mYfh1p | |||
| Concentrate (protein-bound iron) | 20.5 ± 0.3 | 41.6 ± 0.1 | 114.1 ± 2.4 |
| Flow-through (free iron) | 0.5 ± 0.2 | 1.1 ± 0.2 | 1.2 ± 0.1 |
| Insoluble iron | 1.0 ± 0.4 | 2.7 ± 0.3 | 3.9 ± 0.5 |
A fixed concentration of mYfh1p (96 μM) was incubated with 24, 48, and 144 μM Fe(II) for 25 min under the conditions used for electrode oximetry in Fig. 1. Iron was measured in the three indicated fractions as described under “Experimental Procedures.”
Mean ± S.D. from three independent experiments (μM iron). The total recovery at 144 μM Fe(II) was only ~83% in the presence of mYfh1p and 67% in buffer without protein due to incomplete solubilization of the precipitated ferric oxides by addition of dithionite.
To identify the iron-binding species, duplicates of reactions Fe(II)/mYfh1p = 0.5 and Fe(II)/mYfh1p = 1.5 were incubated at 30 °C for 2 or 25 min and immediately analyzed by Superdex 200 gel filtration. In all four samples, most protein was recovered in peak α, corresponding to mYfh1p monomer (Fig. 2). Inductively coupled plasma emission spectroscopy analysis demonstrated that peak α did not contain any significant levels of iron as previously reported (23, 24). An iron-containing peak with an apparent molecular mass of ~50 kDa, corresponding to the α3 oligomer (23), was observed in both reactions at each time point analyzed (Fig. 2). At 25 min, the Fe(III)/mYfh1p ratio in peak α3 was 0.6 for reaction Fe(II)/mYfh1p = 0.5 and 1.7 for reaction Fe(II)/mYfh1p = 1.5. These ratios are close to those determined by ultrafiltration (see above), suggesting that α3 is the iron-binding species present at the end of the iron oxidation reaction. Consistent with this interpretation, in Fig. 2 there is a small decrease in the A280 of peak α from 2 to 25 min, and a concomitant increase in the A280 of peak α3 that is not completely accounted for by the decrease in peak α. Nearly identical chromatograms were obtained in two independent gel filtration analyses, one of which is shown in Fig. 2, indicating that these results are reproducible. The time-dependent increase in peak α3 intensity can therefore be explained by progressive conversion of monomer to α3 and, consistent with the time course of O2 consumption in Fig. 1A, by progressive de α3. These data support the conclusion that α3 forms during, and represents the main iron-binding species at the completion of, reactions Fe(II)/mYfh1p = 0.5 and Fe(II)/mYfh1p = 1.5. However, when the completed reactions are analyzed by gel filtration, peak α3 accounts for only a small fraction of the total iron and protein, whereas most protein is eluted from the Superdex 200 column as iron-free monomer (Fig. 2). This suggests that α3 disassembles during gel filtration because it is not stable.
Fig. 2. Oligomerization of mYfh1p at low Fe(II)/mYfh1p ratios.

Two sets of reactions containing 96 μM mYfh1p and 48 (A) or 144 (B) μM Fe(II) were incubated at 30 °C for 2 min (black chromatogram) or 25 min (red chromatogram) and immediately analyzed by Superdex 200 gel filtration. Peaks α and α3 denote mYfh1p monomer and trimer, respectively. Fractions corresponding to the peaks of interest were analyzed for iron concentration by inductively coupled plasma emission spectroscopy. The protein concentration in fractions corresponding to peak α3 was estimated from the decrease in peak α from 2 to 25 min (ΔA280 = A280 (2 min) − A280 (25 min)). The elution profiles for mYfh1p are superimposed on that of molecular mass standards (dashed chromatogram). V, vitamin B12 (1.4 kDa); M, myoglobin (17 kDa); O, ovalbumin (44 kDa); G, gammaglobulin (158 kDa); T, thyroglobulin (669 kDa). The A280 of mYfh1p and molecular mass standards is shown on the left- and right-hand y axes, respectively. V0 denotes void volume as determined by the elution volume of blue dextran (2 MDa). As reported previously, mYfh1p monomer is eluted from gel filtration columns and migrates on SDS/PAGE (see Fig. 3C) with an apparent molecular weight of ~20,000 (23, 24), higher than the actual molecular weight of ~14,000 (23). A subunit molecular weight of 20,000 was used to estimate the number of subunits present in the ~50-kDa peak (α3) (23). Previous gel filtration analysis of mYfh1p assembly showed that coalescence of α3 into higher order intermediates to yield multimer requires concentrations of Fe(II) that exceed the iron-loading capacity of α3 (23), which is higher than the iron/subunit ratio used in Fig. 2B. This explains why no further assembly occurred under these conditions.
Production of H2O2 during mYfh1p-catalyzed Fe(II) Oxidation
By analogy with H-ferritin (26, 32), the observed stoichiometry of 2 Fe(II)/O2 implies that H2O2 is produced during the ferroxidase reaction catalyzed by mYfh1p, according to the following equation (26).
| (Eq. 2) |
This possibility was initially tested by electrode oximetry, measuring O2 evolution in the presence of catalase, as described in Ref. 29. We could not detect any O2 evolution when catalase was added to 96 μM mYfh1p 5 min after the addition of Fe(II) (48 μM) nor any increase in the final Fe(II)/O2 stoichiometry when Fe(II) was added to mYfh1p in the presence of catalase (data not shown). However, we were able to detect some H2O2 production using a more sensitive assay (29) based on the reaction of H2O2 with 10-acetyl-3,7-dihydroxyphenoxazine (Amplex Red) in the presence of HRP, which yields a fluorescent compound with an emission maximum at 583 nm. Fig. 3A shows the fluorescence intensity spectra obtained from representative reactions in which 24 or 48 μM Fe(II) was incubated for 30 min at 30 °C in the absence or presence of 96 μM mYfh1p, conditions similar to those used for electrode oximetry in Fig. 1. There is a net increase in H2O2 production in the presence of mYfh1p (Fig. 3A). However, the levels of H2O2 detected correspond to only ~1.5% of the expected levels (178 ± 25 nM (n = 2) versus 12 μM and 362 ± 37 nM (n = 2) versus 24 μM). One possible explanation is that most H2O2 is rapidly consumed inside the protein and only low amounts of H2O2 are released into the solution where they can be detected by the Amplex Red/HRP assay. The possibilities that mYfh1p has catalase activity or that mYfh1p uses H2O2 as an oxidant for Fe(II) are inconsistent with the stoichiometry of 2 Fe(II)/O2 observed when 24 or 48 μM Fe(II) was incubated with 96 μM mYfh1p (Fig. 1). On the other hand, the slow rate of the mYfh1p ferroxidase reaction (Fig. 1A) could favor reaction of H2O2 with the protein. Some of the H2O2 produced during the ferroxidase reaction of horse spleen ferritin has been shown to react with the protein (29, 33). This possibility was therefore investigated for mYfh1p by use of a protein oxidation detection assay (13). Reactions containing 96 μM mYfh1p were incubated in the absence or presence of 48 μM Fe(II) as described above, and after derivatization to DNP, protein carbonyls were detected by Western blotting with anti-DNP antibodies (13). The mYfh1p band was detected in all derivatized samples, but its intensity was ~3-fold higher if the protein had been incubated in the presence of Fe(II) prior to derivatization (Fig. 3B, compare lanes 2 and 4). Degradation products of mYfh1p were barely detected by Coomassie Blue staining of purified monomer (Fig. 3C, lane 5), but they were much more intensely decorated than the full-length protein by anti-DNP antibodies (Fig. 3B, lanes 2 and 4). These results indicate that mYfh1p is prone to oxidative degradation, which is enhanced after incubation with Fe(II), possibly because the H2O2 produced during the ferroxidase reaction of mYfh1p reacts with the protein. The protein concentration used in these experiments (96 μM) is in excess of the expected concentration of H2O2, i.e. 24 μM, corresponding to only 0.25 H2O2/mYfh1p. This is consistent with the results shown in Fig. 3D. Here, protein staining of the blot following immunodetection of carbonyls shows that the oxidative damage that occurred to mYfh1p in the presence of 48 μM Fe(II) (Fig. 3B, lane 4) did not result in a measurable decrease in the levels of full-length protein (Fig. 3D, compare lanes 2 and 4). To further investigate the possibility that H2O2 reacts with mYfh1p, 48 μM Fe(II) and 24 μM H2O2 were added to 5 mM 2-deoxyribose in the absence or presence of 96 μM mYfh1p for 30 min at 30 °C. We then measured oxidative degradation of 2-deoxyribose to malondialdehyde (31). We detected 2.6 ± 0.3 versus 0.7 ± 0.5 (n = 4) μM malondialdehyde in the absence versus the presence of mYfh1p (Fig. 3E, bars 3 and 4), indicating that mYfh1p can attenuate Fenton chemistry. This effect could be achieved by the protein via sequestration of Fe(II) and/or reaction with H2O2. The relative degree of damage observed in the presence of mYfh1p with addition of Fe(II) only (39%; bar 2/bar 1) does not increase with addition of Fe(II) and H2O2 (27%; bar 4/bar 3) (Fig. 3E). This is consistent with the possibility that mYfh1p not only sequesters Fe(II) but also reacts with H2O2.
Fig. 3. Production of H2O2 during Fe(II) oxidation in mYfh1p.

A, reactions containing 96 μM mYfh1p and 24 or 48 αM Fe(II) were incubated in 50 mM HEPES-KOH, pH 7.0, for 30 min at 30 °C in the presence of Amplex Red/HRP reagent. Immediately afterward, fluorescence intensity was recorded from 570 to 610 nm. The fluorescence intensity curves before background correction are shown (bottom graph). For the standard curve (top graph), H2O2 standards (50 – 600 nM) were incubated in 50 mM HEPES-KOH, pH 7.0, for 30 min at 30 °C in the presence of Amplex Red/HRP reagent. The fluorescence intensity curves were recorded, and samples containing buffer plus Amplex Red/HRP were used for background corrections. The corrected fluorescence intensity curves were integrated, and a standard curve was constructed. The correlation coefficient of the fitted line to the data is 0.999. To determine the concentration of H2O2 produced in the presence of mYfh1p (see “Results”), samples containing buffer plus 24 or 48 μM Fe(II) and Amplex Red/HRP were used as blanks for background corrections. The corrected fluorescence intensity curves for mYfh1p were integrated, and the H2O2 concentration was calculated from the standard curve. A.U., arbitrary units. B, reactions containing 96 μM mYfh1p were incubated for 30 min at 30 °C in the absence or presence of 48 μM Fe(II) under the experimental conditions used in the Amplex Red/HRP assays described above. Following incubation with 2,4-dinitrophenylhy-drazine (DNPH) to derivatize carbonyl groups to DNP, the samples (7.5 μg of total protein) were analyzed by SDS/PAGE and Western blotting using a polyclonal anti-DNP antiserum. C, 2 μg of the purified mYfh1p monomer used in the experiments described above was analyzed by SDS/PAGE and Coomassie Blue staining (lane 5). D, following immunodetection, the membrane was subjected to SYPRO Ruby protein blot staining. Arrows d, degradation products of mYfh1p; lane MW, molecular mass standards. E, a mixture of 48 μM Fe(II), 24 μM H2O2, and 5 mM 2-deoxyribose (DOR) was incubated in 10 mM HEPES-KOH, pH 7.0, in the absence or presence of 96 μM mYfh1p for 30 min at 30 °C, and production of malondialdehyde-thiobarbituric acid (MDA-TBA) (ε532 = 1.54 × 10⁵ M−1 cm−1) was measured (31). The indicated controls were analyzed at the same time and treated identically. The bars represent the means ± S.D. of four independent measurements.
Fe(II) and O2 Are Both Required for mYfh1p Assembly
To assess the role of O2 in mYfh1p assembly, monomer was made anaerobic by purging with argon gas. Then monomer (80 μM) was anaerobically incubated with Fe(II) (3.2 mM) at a Fe(II)/mYfh1p ratio of 40/1, expected to result in formation of multimer (23). The assembly reaction was anaerobically analyzed by gel filtration in a TSK-GEL column. This column has a much smaller volume than the Superdex 200 column used above, which facilitated maintenance of nearly anaerobic conditions during sample loading and gel filtration. Most protein was eluted in peak α corresponding to iron-free monomer (Fig. 4). To exclude the possibility that the argon treatment might have denatured the protein, making it unable to assemble, argon-treated monomer was also aerobically incubated with Fe(II) and analyzed by TSK-GEL filtration. In this case, most protein was eluted as iron-loaded α48 (Fig. 4). This result indicates that both Fe(II) and O2 are required for the activation of mYfh1p.
Fig. 4. Inhibition of mYfh1p multimer assembly under anaerobic conditions.

TSK-GEL G4000SW gel filtration of 80 μM argon-treated monomer without any added Fe(II) (light blue chromatogram) or 80 μM argon-treated monomer incubated aerobically (red chromatogram) or anaerobically (black chromatogram) in the presence of 3.2 mM Fe(II) (Fe(II)/mYfh1p = 40/1) (23) as described under “Experimental Procedures.” Peaks α and α48 represent mYfh1p monomer and multimer, respectively. The A280 of peak α48 is much higher than that of peak α because of the absorbance of iron oxides (23). The molecular weight markers (dashed chromatogram) are as in the legend of Fig. 2. The A280 of mYfh1p and the molecular weight standards is shown by the left- and right-hand y axes, respectively. V0 denotes void volume as determined by the elution volume of blue dextran (2 MDa).
DISCUSSION
Our results support the following mechanism of mYfh1p function (Fig. 5). The protein is activated by Fe(II) in the presence of O2 and forms an oligomeric species that contains a ferroxidation site and catalyzes Fe(II) oxidation. When the Fe(II) concentration exceeds that of the ferroxidase sites on the protein, autoxidation progressively overcomes ferroxidation. Coalescence of α3 to yield higher order intermediates and finally multimer occurs at concentrations of Fe(II) that exceed the iron-loading capacity of α3.
Fig. 5. Postulated assembly and Fe(II) oxidation pathway of mYfh1p multimer.
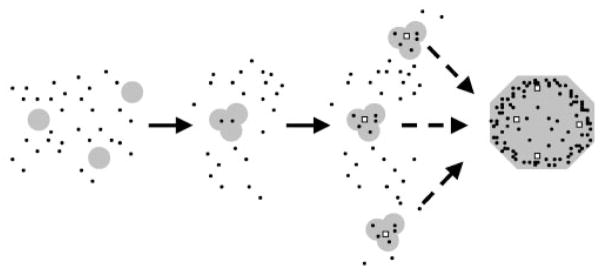
The black dots symbolize free and protein-bound Fe(II) that is progressively oxidized to Fe(III) inside the protein. Because Fe(II) is in large excess of mYfh1p, ferroxidation is expected to be rapidly overcome by autoxidation. The open squares symbolize the nucleation sites upon which autoxidation may occur (see text for details).
Several lines of evidence support this model. A stoichiometry of 2 Fe(II)/O2 was determined at a Fe(II)/mYfh1p ratio of ≤0.5, which increased to a limiting maximum value of 4 at Fe(II)/mYfh1p ratios between 0.5 and 1.5 (Fig. 1). Iron was nearly quantitatively bound to mYfh1p at the end of these reactions as determined by ultrafiltration (Table I). Although mostly iron-free monomer was recovered upon gel filtration of these reactions, an iron-containing oligomer was also identified (Fig. 2). This species, however, appears to largely disassemble during gel filtration, probably because it is not stable, unlike the multimer (23, 24). The oligomer has been estimated by Superdex 200 gel filtration to consist of three subunits (α3) (Fig. 2), which is in agreement with the independent estimate that three to four mYfh1p subunits are required to form one ferroxidation site (see “Results”). Moreover, these findings are in agreement with the sequence, α→ α3 → α6 → α12 → α24 → α48, obtained previously by titration of mYfh1p with increasing Fe(II) concentrations (23, 24), where α3, not α, was the smallest iron-containing species identified (23).
These data support the idea that an oligomeric form of mYfh1p is responsible for Fe(II) binding and oxidation at the low Fe(II)/mYfh1p ratios analyzed in this study. Future investigations will be required for a more accurate determination of the molecular mass of the oligomer and the number of mYfh1p subunits forming its ferroxidation site and to establish the presumed dinuclear iron nature of this site. Nevertheless, the identification of a oligomeric species with ferroxidase activity represents an important initial step toward understanding the mechanism of frataxin function. For example, an iron-binding site formed by multiple subunits can explain the apparent absence of any obvious iron-coordinating motifs in the amino acid sequence of mYfh1p, despite the presence of several histidine and carboxylate residues that could be involved in iron coordination. In addition, the presence of ferroxidase activity is consistent with our proposal that frataxin has an iron storage role (17). Our previous gel filtration analysis of the stepwise assembly of mYfh1p indicates that the sequence α3 → α6 → α12 → α24 → α48 is accompanied by a progressive increase in iron-loading capacity reaching a maximum of 50 atoms/subunit in the multimer (α48) (23, 24). Iron cores of 2– 4 nm have been clearly visualized by scanning transmission electron microscopy and energy-dispersive x-ray spectroscopy of mYfh1p multimer (24). In addition, high resolution extended x-ray absorption fine structure to 18 K Å−1 shows that the iron core of the mYfh1p multimer resembles 6-line ferrihydrite, the principal biomineral found in ferritin.2 On the basis of these findings, we conclude that coalescence of α3 oligomers into higher order intermediates to yield multimer increases the Fe(II)-loading capacity of the protein and at the same time provides nucleation sites upon which further Fe(II) autoxidation can occur (Fig. 5).
The observed stoichiometry of 2 Fe(II)/O2 (Fig. 1) implies that H2O2 is produced (26, 32) during the ferroxidase reaction catalyzed by α3. However, given that a change in stoichiometry, from 2 to 4 Fe(II)/O2, occurs at a relatively low Fe(II)/mYfh1p ratio (≤0.5/1) (Fig. 1B), H2O2 is expected to be produced only transiently at the beginning of the assembly reaction. Moreover, three independent assays measuring H2O2 production (Fig. 3A), oxidative degradation of mYfh1p (Fig. 3, B–D), and Fenton chemistry (Fig. 3E) suggest that H2O2 is not readily released into the solution but may instead react with the protein, as has been shown for at least some of the H2O2 produced during the ferroxidase reaction of H-ferritin (29). By use of the OxyBlot assay, we could not precisely determine whether the degree of protein oxidation accounts for all of the missing H2O2. Two alternative explanations could be that mYfh1p has catalase activity or that mYfh1p uses H2O2 as an oxidant for Fe(II). These possibilities, however, are not consistent with the stoichiometry of 2 Fe(II)/O2 we observed at the Fe(II)/mYfh1p ratio used in Amplex Red/HRP and OxyBlot assays. On the other hand, given that the protein concentration in these experiments was in a 4-fold excess of the expected concentration of H2O2, it could have been possible for most H2O2 to react with the protein. The attenuation of Fenton chemistry observed when both Fe(II) and H2O2 were added to mYfh1p is also consistent with this view. Future studies will be required to determine the mechanism and stoichiometry of the reaction of H2O2 with mYfh1p.
The complete inhibition of multimer assembly that we have observed under anaerobic conditions (Fig. 4) indicates that mYfh1p senses the presence of Fe(II) and O2. This mixture might cause a conformational change that enables mYfh1p to oligomerize, bind Fe(II), and catalyze its oxidation in a protein-protected compartment. In this way, the presence of redoxactive iron triggers a safety mechanism mediated by frataxin that can ultimately result in the sequestration of as many as 50 Fe(II)/subunit in the multimer (Fig. 5). In Fig. 1A, the O2 consumption curves at 144 μM Fe(II) (Fe(II)/mYfh1p = 1.5) show that mYfh1p decreases the rate of Fe(II) autoxidation compared with buffer. The data in Table I further suggest that this is due to binding of Fe(II) to mYfh1p, at sites that are presumably different from the ferroxidation sites. The iron concentration used in these experiments was not in excess of the iron-loading capacity of α3 (approximately four or five iron atoms/subunit; Ref. 23). Thus, based on the data in Fig. 1A and Table I, it appears that when the Fe(II) concentration exceeds that of the ferroxidase sites on α3, a slow autoxidation reaction progressively overcomes ferroxidation. We showed previously that when the Fe(II) concentration exceeds the iron-loading capacity of α3, higher order intermediates and multimer are formed (23). Ongoing studies further reveal that Fe(II) is slowly oxidized inside the multimer and can be readily donated to a ferrous iron chelator or the mitochondrial enzyme ferroche-latase to synthesize heme.3 Therefore, by virtue of its ferroxidase activity, frataxin assembles into a macromolecule that is likely to play a direct and central role in mitochondrial iron metabolism.
Acknowledgments
We thank F. Rusnak, P. Arosio, and P. Rinaldo for critical reading of the manuscript and T. Burghardt for sharing of equipment.
Footnotes
This work was supported by Grant AG15709 from the NIA, National Institutes of Health.
The abbreviations used are: HRP, horseradish peroxidase; DNP, 2,4-dinitrophenylhydrazone; mYfh1p, mature form of yeast fretaxin.
H. Nichol, I. Pickering, O. Gakh, G. Isaya, and G. George, manuscript in preparation.
S. Park, O. Gakh, J. Adamec, A. Mangravita, G. C. Ferreira, and G. Isaya, unpublished results.
References
- 1.Petrat F, de Groot H, Rauen U. Biochem J. 2001;356:61–69. doi: 10.1042/0264-6021:3560061. [DOI] [PMC free article] [PubMed] [Google Scholar]
- 2.Tangeras A. Biochim Biophys Acta. 1985;843:199–207. doi: 10.1016/0304-4165(85)90140-0. [DOI] [PubMed] [Google Scholar]
- 3.Darnell J, Lodish H, Baltimore D. Molecular Cell Biology. Scientific American Books; New York: 1990. pp. 583–616. [Google Scholar]
- 4.Halliwell B, Gutteridge JMC. Free Radicals in Biology and Medicine. Oxford University Press; Oxford, UK: 1999. pp. 1–34. [Google Scholar]
- 5.Flatmark T, Romslo I. J Biol Chem. 1975;250:6433–6438. [PubMed] [Google Scholar]
- 6.Kispal G, Csere P, Guiard B, Lill R. FEBS Lett. 1997;418:346–350. doi: 10.1016/s0014-5793(97)01414-2. [DOI] [PubMed] [Google Scholar]
- 7.Lange H, Kispal G, Lill R. J Biol Chem. 1999;274:18989–18996. doi: 10.1074/jbc.274.27.18989. [DOI] [PubMed] [Google Scholar]
- 8.Foury F, Roganti T. J Biol Chem. 2002;277:24475–24483. doi: 10.1074/jbc.M111789200. [DOI] [PubMed] [Google Scholar]
- 9.Corsi B, Cozzi A, Arosio P, Drysdale J, Santambrogio P, Campanella A, Biasiotto G, Albertini A, Levi S. J Biol Chem. 2002;277:22430–22437. doi: 10.1074/jbc.M105372200. [DOI] [PubMed] [Google Scholar]
- 10.Babcock M, de Silva D, Oaks R, Davis-Kaplan S, Jiralerspong S, Montermini L, Pandolfo M, Kaplan J. Science. 1997;276:1709–1712. doi: 10.1126/science.276.5319.1709. [DOI] [PubMed] [Google Scholar]
- 11.Foury F, Cazzalini O. FEBS Lett. 1997;411:373–377. doi: 10.1016/s0014-5793(97)00734-5. [DOI] [PubMed] [Google Scholar]
- 12.Campuzano V, Montermini L, Molto MD, Pianese L, Cossee M, Cavalcanti F, Monros E, Rodius F, Duclos F, Monticelli A, et al. Science. 1996;271:1423–1427. doi: 10.1126/science.271.5254.1423. [DOI] [PubMed] [Google Scholar]
- 13.Levine RL, Williams JA, Stadtman ER, Shacter E. Methods Enzymol. 1994;233:346–357. doi: 10.1016/s0076-6879(94)33040-9. [DOI] [PubMed] [Google Scholar]
- 14.Cavadini P, Gellera C, Patel PI, Isaya G. Hum Mol Genet. 2000;9:2523–2530. doi: 10.1093/hmg/9.17.2523. [DOI] [PubMed] [Google Scholar]
- 15.Karthikeyan G, Lewis LK, Resnick MA. Hum Mol Genet. 2002;11:1351–1362. doi: 10.1093/hmg/11.11.1351. [DOI] [PubMed] [Google Scholar]
- 16.Puccio H, Simon D, Cossee M, Criqui-Filipe P, Tiziano F, Melki J, Hindelang C, Matyas R, Rustin P, Koenig M. Nat Genet. 2001;27:181–186. doi: 10.1038/84818. [DOI] [PubMed] [Google Scholar]
- 17.Patel PI, Isaya G. Am J Hum Genet. 2001;69:15–24. doi: 10.1086/321283. [DOI] [PMC free article] [PubMed] [Google Scholar]
- 18.Radisky DC, Babcock MC, Kaplan J. J Biol Chem. 1999;274:4497–4499. doi: 10.1074/jbc.274.8.4497. [DOI] [PubMed] [Google Scholar]
- 19.Foury F. FEBS Lett. 1999;456:281–284. doi: 10.1016/s0014-5793(99)00961-8. [DOI] [PubMed] [Google Scholar]
- 20.Muhlenhoff U, Richter N, Gerber J, Lill R. J Biol Chem. 2002;277:29810–29816. doi: 10.1074/jbc.M204675200. [DOI] [PubMed] [Google Scholar]
- 21.Ristow M, Pfister MF, Yee AJ, Schubert M, Michael L, Zhang CY, Ueki K, Michael MD, II, Lowell BB, Kahn CR. Proc Natl Acad Sci U S A. 2000;97:12239–12243. doi: 10.1073/pnas.220403797. [DOI] [PMC free article] [PubMed] [Google Scholar]
- 22.Chantrel-Groussard K, Geromel V, Puccio H, Koenig M, Munnich A, Rotig A, Rustin P. Hum Mol Genet. 2001;10:2061–2067. doi: 10.1093/hmg/10.19.2061. [DOI] [PubMed] [Google Scholar]
- 23.Adamec J, Rusnak F, Owen WG, Naylor S, Benson LM, Gacy AM, Isaya G. Am J Hum Genet. 2000;67:549–562. doi: 10.1086/303056. [DOI] [PMC free article] [PubMed] [Google Scholar]
- 24.Gakh O, Adamec J, Gacy MA, Twesten RD, Owen WG, Isaya G. Biochemistry. 2002;41:6798–6804. doi: 10.1021/bi025566+. [DOI] [PubMed] [Google Scholar]
- 25.Cavadini P, O’Neill HA, Benada O, Isaya G. Hum Mol Genet. 2002;33:217–227. doi: 10.1093/hmg/11.3.217. [DOI] [PubMed] [Google Scholar]
- 26.Yang X, Chen-Barrett Y, Arosio P, Chasteen ND. Biochemistry. 1998;37:9743–9750. doi: 10.1021/bi973128a. [DOI] [PubMed] [Google Scholar]
- 27.Yang X, Chasteen ND. Biochem J. 1999;338:615–618. [PMC free article] [PubMed] [Google Scholar]
- 28.Richards TD, Pitts KR, Watt GD. J Inorg Biochem. 1996;61:1–13. doi: 10.1016/0162-0134(95)00029-1. [DOI] [PubMed] [Google Scholar]
- 29.Zhao G, Bou-Abdallah F, Yang X, Arosio P, Chasteen ND. Biochemistry. 2001;40:10832–10838. doi: 10.1021/bi011052j. [DOI] [PubMed] [Google Scholar]
- 30.Branda SS, Yang ZY, Chew A, Isaya G. Hum Mol Genet. 1999;8:1099–1110. doi: 10.1093/hmg/8.6.1099. [DOI] [PubMed] [Google Scholar]
- 31.Halliwell B, Gutteridge JM. FEBS Lett. 1981;128:347–352. doi: 10.1016/0014-5793(81)80114-7. [DOI] [PubMed] [Google Scholar]
- 32.Waldo GS, Theil EC. Biochemistry. 1993;32:13262–13269. doi: 10.1021/bi00211a039. [DOI] [PubMed] [Google Scholar]
- 33.Lindsay S, Brosnahan D, Watt GD. Biochemistry. 2001;40:3340–3347. doi: 10.1021/bi001981v. [DOI] [PubMed] [Google Scholar]
- 34.Foury F. FEBS Lett. 1999;456:281–284. doi: 10.1016/s0014-5793(99)00961-8. [DOI] [PubMed] [Google Scholar]