

Abstract
Drug treatment may alter the metabolism of cancer cells and may alter the mitochondrial redox state. Using the redox scanner that collects the fluorescence signals from both the oxidized flavoproteins (Fp) and the reduced form of nicotin-amide adenine dinucleotide (NADH) in snap-frozen tumor tissues, we investigated the effects of chemotherapy on mouse xenografts of a human diffuse large B-cell lymphoma cell line (DLCL2). The mice in the treatment group were treated with CHOP – cyclophosphamide (C) + hydroxydoxorubicin (H) + Oncovin (O) + prednisone (P) using the following regimen: CHO administration on day 1 followed by prednisone administration on day 1–5. On day 5 the mitochondrial redox state of the treated group was slightly more reduced than that of the control group (p = 0.049), and the Fp content of the treated group was significantly decreased (p = 0.033).
33.1 Introduction
Lymphoma is the most common hematological cancer in the USA. It occurs in two forms, Hodgkin’s disease (HD) and non-Hodgkin’s lymphoma (NHL), the latter being the fifth most common cancer in the USA and far more common than HD. For decades, first line standard therapy of NHL has consisted of 6–8 cycles of CHOP treatment [1, 2], where cyclophosphamide is an alkylating agent that cross-links DNA, hydroxydoxorubicin (doxorubicin or Adriamycin) intercalates between DNA bases and in coordination with iron generates reactive oxygen species (ROS), Oncovin (vincristine) binds to tubulin to prevent cells from duplicating, and prednisone is a corticosteroid. Our previous 1H-MRS study of DLCL2 xenografts in mice (models of diffuse large B-cell lymphoma [2], the most common form of NHL) demonstrated a significant decrease in lactate in the tumor after one cycle of CHOP chemotherapy, where the therapeutic effectiveness was based on tumor volume and decreased proliferation rate measured by Ki67 staining [3].
Optical imaging has much higher spatial resolution than MRS and can detect changes in metabolic heterogeneity following therapeutic intervention. Mitochondrial NADH is intrinsically fluorescent and is the main source of reducing equivalents for the mitochondrial respiratory chain. Mitochondrial metabolism is reflected in the redox state of the NAD system, which is in tight equilibrium with the flavin system. The oxidized flavoproteins (Fp) including FAD are also intrinsically fluorescent. Previously, we showed that fluorescence imaging of the mitochondrial redox state was sensitive to metabolic alterations in tumors [4, 5] and tissue metaplasia [6] and that this method has the potential ability to detect therapeutic effects on cellular metabolism. Here we present preliminary redox scanning results on CHOP-treated DLCL2 xenografts.
33.2 Materials and Methods
As previously described [3], WSU-DLCL2 cells were subcutaneously inoculated in the flanks of 5–7-week-old female nude mice to induce tumor xenografts. Tumor- bearing mice were randomly chosen and divided into the treatment group and the control group. CHOP treatment is as follows: cyclophosphamide, 40 mg/kg i.v., day 1; hydroxydoxorubicin, 3.3 mg/kg i.v., day 1; Oncovin, 0.5 mg/kg i.v., day 1; and prednisone, 0.2 mg/kg p.o., day 1–5. Sham treatment (saline) was performed on the control group. All animal studies were performed in accordance with the guidelines of the University of Pennsylvania Institutional Animal Care and Use Committee (IACUC).
Anesthetized tumor-bearing mice were snap-frozen in liquid N2 1 day after the last treatment. The frozen tumors (three from the treated group and three from the control group) were quickly removed from the mouse body with a handsaw and embedded in homemade mounting media followed by redox scanning as previously described [5, 7]. The PC-collected scanning data were analyzed with a customized MATLAB® program that uses the reference standards to convert the intensity-based images into concentration-based images and generates redox ratio images.
Each xenograft was scanned with three to five sections spacing 800–1,000 μm with the first section approximately starting at about 1,000–1,500 μm beneath the skin. Three tumors in each group of a total of six tumors were scanned. The redox indices (Fp, NADH, and Fp redox ratio, i.e., Fp/(Fp + NADH)) were averaged for each tissue section. Univariate analysis was conducted on these redox indices using IBM SPSS Statistics (version 20) with tissue depth as the covariate and p < 0.05 taken as statistically significant. Data were finally reported as mean ± standard error of mean (SEM).
33.3 Results
As shown in Table 33.1, after one cycle of CHOP administration, one tumor in the treated group exhibited volume reduction, while the other two kept growing at a slower rate compared to the control group. No significant changes were found in the tumor volume between the two groups on either day 1 (treated 1,001 ± 50 mm3 vs. control 1,204 ± 728 mm3) or day 5 (treated 1,188 ± 504 mm3 vs. control 1,671 ± 1,025 mm3) nor is the volume ratio of day 5 to day 1 significantly different between the two groups (p > 0.05).
Table 33.1.
Tumor volume change
| Mouse # | V_ratio (day 5/day 1) | Mouse # | V_ratio (day 5/day 1) |
|---|---|---|---|
| Treated | Control | ||
| 444 | 1.32 | 422 | 1.19 |
| 446 | 1.9 | 449 | 2.08 |
| 448 | 0.37 | 450 | 0.77 |
p (unpaired t-test) = 0.82
The redox scanning results are summarized in Table 33.2. The Fp redox ratio, Fp/(NADH + Fp) of treated group was 0.45 ± 0.02, while that of the control group was 0.53 ± 0.03, indicating that the treatment caused the tumors to become slightly more reduced compared to the control group (p = 0.049). The Fp content of the treated group was significantly decreased (p = 0.033). No significant change was detected in NADH. The typical redox images of the two groups are shown in Figs. 33.1 and 33.2. We did not detect significant changes in the standard deviation of any of the redox indices (Fp redox ratio, Fp, and NADH).
Table 33.2.
Redox indices ± SEM averaged across tissue sections within each group
| Ctrl | CHOP-treated | P-value | |
|---|---|---|---|
| Fp redox ratio | 0.53 ± 0.03 | 0.45 ± 0.02 | 0.049 |
| Fp (μM) | 560 ± 67 | 349 ± 60 | 0.033 |
| NADH (μM) | 446 ± 48 | 403 ± 43 | 0.52 |
Fig. 33.1.
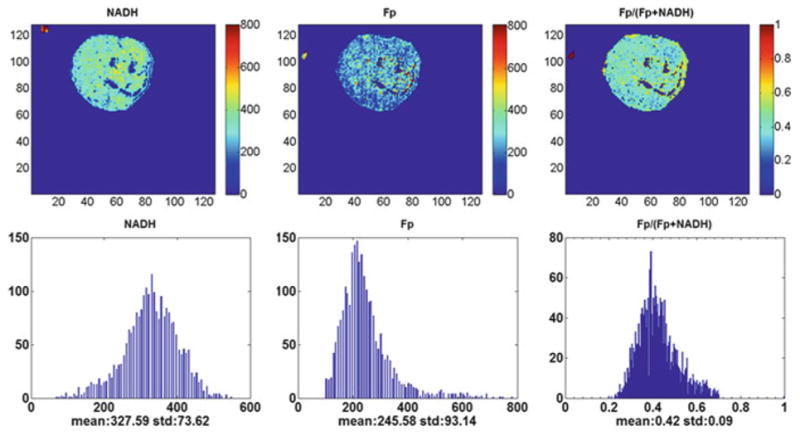
Typical pseudo-color images of the redox indices (top row) and their corresponding histograms (bottom row) of a tumor in CHOP-treated group (1,500 μm under the skin). From left to right: NADH nominal concentration (μm), Fp nominal concentration (μm), and the Fp redox ratio (0–1). The mean value and SD are shown below the x-axes on each histogram. Image resolution: 200 μm
Fig. 33.2.
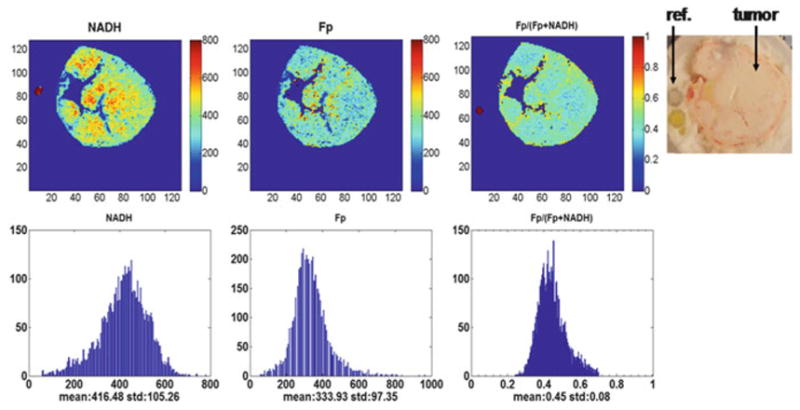
Typical pseudo-color redox images (top row) and their corresponding histograms of a tumor in the control group (3,500 μm under the skin). Image resolution: 200 μm
33.4 Discussions
Since mitochondria are targets of many anticancer drugs due to their central roles in cellular energy metabolism and apoptotic signalling pathways [8, 9], they might also provide early biomarkers for therapeutic response. Studies on therapeutic effects on mitochondria isolated from human cancer cells showed that doxorubicin acts on DNA independent of microtubules and does not induce the release of cytochrome c even at very high dosage [10]. Investigations based on cell culture models revealed that short-term (<30 min) treatment with doxorubicin rendered some human cancer cell lines more oxidized with respect to their mitochondrial redox state (more Fp and less NADH) with a large amount of ROS production, whereas long-term (48 h) treatment induced cell cycle arrest and cell death [11]. On the other hand, as an antitubulin agent and one of the vinca alkaloids, vincristine is a cell-cycle-specific drug that inhibits cell growth exclusively during metaphase by inhibiting microtubule dynamics and assembly leading to cell cycle arrest [12–14]. Investigations also showed that a substantial amount of tubulin inherently existed in the mitochondria with a role in apoptosis via interaction with the permeability transition pore, whereas antitubulin agents induce the release of cytochrome c from isolated mitochondria [15]. It was shown that the apoptotic cells have significantly higher Fp redox ratios [16].
All these studies were performed in vitro on isolated mitochondria or cell culture. It is not clear how the tissue mitochondrial redox state is modified by therapy under in vivo condition.
Our previous MRS study showed that successive three cycles of CHOP treatment caused decreased proliferation closely matched by the reduced lactate concentrations [3]. In this study, we examined the therapeutic effect of CHOP on DLCL2 xenografts by mapping the mitochondrial NADH and Fp fluorescent signals and thus the mitochondrial redox state of the tumors across multiple tissue sections. Our preliminary results show that one 5-day cycle of CHOP treatment causes these tumors to become slightly more reduced in their redox state. As there has not been a calibration procedure available at the tissue level to determine the exact mitochondrial redox state [17, 18], we can only speculate that these lymphomas are likely to be mainly in either State 3 (active proliferation) or State 4 (at rest). State 2 under starvation is unlikely due to relatively uniformly strong NADH signals observed in the majority of tumor regions. The decrease in Fp after treatment indicate suppression of mitochondrial metabolism. This is further supported by increased PME/βNTP ratio [3] and decreased βNTP concentration (CHOP 2.0 ± 0.1 vs. sham 3.4 ± 0.1 μmole/g wet weight, unpublished data by SC Lee) after three cycles of CHOP treatment as measured by 31P-MRS on tissue extracts. It appears that CHOP treatment may decrease both glycolysis and mitochondrial metabolism in DLCL2 tumors. Although we are not certain about the exact mechanism, this result is consistent with a significant decrease of cell proliferation index Ki67 staining that was observable after one cycle of CHOP treatment [3].
Our previous metastatic potential studies of melanoma and breast cancer mouse models indicated that aggressive tumors had more oxidized tumor cores, whereas indolent tumors were relatively homogenous and less oxidized [4, 5]. Although the fluorescence intensity of both NADH and Fp depends on cell density, it was shown that cell density changes between the CHOP-treated and the control groups were insignificant [3]. Thus, decreased Fp content and Fp redox ratio in CHOP-treated tumors should not be due to cell density differences, and the treatment appeared to have induced a cellular metabolic change towards less malignancy.
Individual differences in treatment response occur frequently. In the current study, one tumor in the treated group exhibited a large reduction in volume and higher Fp redox ratio compared to the other two. Additional histological investigations are needed to determine whether one cycle of CHOP treatment induced apoptosis in this tumor.
33.5 Conclusions
We report preliminary redox scanning data on CHOP treatment effects on DLCL2 xenografts. One cycle of treatment caused the tumors to become slightly more reduced in their mitochondrial redox state. To our knowledge, this study is the first to explore the therapeutic effect of CHOP on the mitochondrial redox state of lymphoma. We plan to conduct more in-depth studies with a larger sample size and more cycles of treatment.
Acknowledgments
Many thanks to Dr. Huaqing Zhao for valuable discussions about statistical analysis. This work was supported by the Center of Magnetic Resonance and Optical Imaging (CMROI) – an NIH-supported research resource P41RR02305 (R. Reddy), the Small Animal Imaging Resources Program (SAIR) 2U24-CA083105 (J.D. Glickson & L. Chodosh), 2R01-CA101700 (J.D. Glickson), and NIH k99/R00-CA126187 (R. Choe).
Footnotes
This article is dedicated to the memory of late Dr. Britton Chance who participated in the study with extraordinary scientific enthusiasm at the age of 97.
Contributor Information
He N. Xu, Department of Radiology, University of Pennsylvania, Philadelphia, PA, USA. Britton Chance Laboratory of Redox Imaging, Johnson Research Foundation, Department of Biochemistry and Biophysics, University of Pennsylvania, Philadelphia, PA, USA
Tahreem A. Mir, Department of Radiology, University of Pennsylvania, Philadelphia, PA, USA. Britton Chance Laboratory of Redox Imaging, Johnson Research Foundation, Department of Biochemistry and Biophysics, University of Pennsylvania, Philadelphia, PA, USA
Seung-Cheol Lee, Department of Radiology, University of Pennsylvania, Philadelphia, PA, USA.
Min Feng, Department of Radiology, University of Pennsylvania, Philadelphia, PA, USA. Britton Chance Laboratory of Redox Imaging, Johnson Research Foundation, Department of Biochemistry and Biophysics, University of Pennsylvania, Philadelphia, PA, USA.
Namisa Farhad, Department of Radiology, University of Pennsylvania, Philadelphia, PA, USA. Britton Chance Laboratory of Redox Imaging, Johnson Research Foundation, Department of Biochemistry and Biophysics, University of Pennsylvania, Philadelphia, PA, USA.
Regine Choe, Department of Biomedical Engineering, University of Rochester, Rochester, NY, USA.
Jerry D. Glickson, Department of Radiology, University of Pennsylvania, Philadelphia, PA, USA
Lin Z. Li, Email: linli@mail.med.upenn.edu, Department of Radiology, University of Pennsylvania, Philadelphia, PA, USA. Britton Chance Laboratory of Redox Imaging, Johnson Research Foundation, Department of Biochemistry and Biophysics, University of Pennsylvania, Philadelphia, PA, USA. Abramson Cancer Center, University of Pennsylvania, Philadelphia, PA, USA. Institute of Translational Medicine and Therapeutics, University of Pennsylvania, Philadelphia, PA, USA
References
- 1.Fisher RI, Gaynor ER, Dahlberg S, et al. Comparison of a standard regimen (CHOP) with three intensive chemotherapy regimens for advanced non-Hodgkin’s lymphoma. N Engl J Med. 1993;328(14):1002–1006. doi: 10.1056/NEJM199304083281404. [DOI] [PubMed] [Google Scholar]
- 2.Mohammad RM, Al-Katib A, Aboukameel A, Doerge DR, Sarkar F. Kucuk O Genistein sensitizes diffuse large cell lymphoma to CHOP (cyclophosphamide, doxorubicin, vincristine, prednisone) chemotherapy. Mol Cancer Ther. 2003;2(12):1361–1368. [PubMed] [Google Scholar]
- 3.Lee S-C, Huang MQ, Nelson DS, et al. In vivo MRS markers of response to CHOP chemotherapy in the WSU-DLCL2 human diffuse large B-cell lymphoma xenograft. NMR Biomed. 2008;21(7):723–733. doi: 10.1002/nbm.1250. [DOI] [PubMed] [Google Scholar]
- 4.Li LZ, Zhou R, Xu HN, et al. Quantitative magnetic resonance and optical imaging biomarkers of melanoma metastatic potential. Proc Natl Acad Sci USA. 2009;106(16):6608–6613. doi: 10.1073/pnas.0901807106. [DOI] [PMC free article] [PubMed] [Google Scholar]
- 5.Xu HN, Nioka S, Glickson JD, et al. Quantitative mitochondrial redox imaging of breast cancer metastatic potential. J Biomed Opt. 2010;15(3):036010. doi: 10.1117/1.3431714. [DOI] [PMC free article] [PubMed] [Google Scholar]
- 6.Xu HN, Nioka S, Chance B, Li LZ. Heterogeneity of mitochondrial redox state in premalignant pancreas in a PTEN null transgenic mouse model. Adv Exp Med Biol. 2011;701:207–213. doi: 10.1007/978-1-4419-7756-4_28. [DOI] [PMC free article] [PubMed] [Google Scholar]
- 7.Xu HN, Wu B, Nioka S, Chance B, Li ZL. Quantitative redox scanning of tissue samples using a calibration procedure. J Innov Opt Health Sci. 2009;2:375–385. doi: 10.1142/S1793545809000681. [DOI] [PMC free article] [PubMed] [Google Scholar]
- 8.Fulda S, Galluzzi L, Kroemer G. Targeting mitochondria for cancer therapy. Nat Rev Drug Discov. 2010;9(6):447–464. doi: 10.1038/nrd3137. [DOI] [PubMed] [Google Scholar]
- 9.D’Souza GG, Wagle MA, Saxena V, Shah A. Approaches for targeting mitochondria in cancer therapy. Biochim Biophys Acta. 2011;1807(6):689–696. doi: 10.1016/j.bbabio.2010.08.008. [DOI] [PubMed] [Google Scholar]
- 10.Andre N, Braguer D, Brasseur G, et al. Paclitaxel induces release of cytochrome c from mitochondria isolated from human neuroblastoma cells. Cancer Res. 2000;60(19):5349–5353. [PubMed] [Google Scholar]
- 11.Kuznetsov AV, Margreiter R, Amberger A, Saks V, Grimm M. Changes in mitochondrial redox state, membrane potential and calcium precede mitochondrial dysfunction in doxorubicin-induced cell death. Biochim Biophys Acta. 2011;1813(6):1144–1152. doi: 10.1016/j.bbamcr.2011.03.002. [DOI] [PubMed] [Google Scholar]
- 12.Lobert S, Vulevic B, Correia JJ. Interaction of vinca alkaloids with tubulin: a comparison of vinblastine, vincristine, and vinorelbine. Biochemistry. 1996;35(21):6806–6814. doi: 10.1021/bi953037i. [DOI] [PubMed] [Google Scholar]
- 13.Owellen RJ, Hartke CA, Dickerson RM, Hains FO. Inhibition of tubulin-microtubule polymerization by drugs of the Vinca alkaloid class. Cancer Res. 1976;36(4):1499–1502. [PubMed] [Google Scholar]
- 14.Owellen RJ, Owens AH, Jr, Donigian DW. The binding of vincristine, vinblastine and colchicine to tubulin. Biochem Biophys Res Commun. 1972;47(4):685–691. doi: 10.1016/0006-291x(72)90546-3. [DOI] [PubMed] [Google Scholar]
- 15.Carre M, Andre N, Carles G, et al. Tubulin is an inherent component of mitochondrial membranes that interacts with the voltage-dependent anion channel. J Biol Chem. 2002;277(37):33664–33669. doi: 10.1074/jbc.M203834200. [DOI] [PubMed] [Google Scholar]
- 16.Ranji M, Jaggard DL, Chance B. Observation of mitochondrial morphology and biochemistry changes undergoing apoptosis by angularly resolved light scattering and cryoimaging. Biophotonics and immune responses. Proc SPIE. 2006;6087:60870K. [Google Scholar]
- 17.Chance B, Baltscheffsky H. Respiratory enzymes in oxidative phosphorylation. VII. Binding of intramitochondrial reduced pyridine nucleotide. J Biol Chem. 1958;233(3):736–739. [PubMed] [Google Scholar]
- 18.Chance B, Williams GR. A method for the localization of sites for oxidative phosphorylation. Nature. 1955;176(4475):250–254. doi: 10.1038/176250a0. [DOI] [PubMed] [Google Scholar]