

Abstract
Recent studies have shown that in addition to the transcriptional circadian clock, many organisms, including Arabidopsis, have a circadian redox rhythm driven by the organism’s metabolic activities1–3. It has been hypothesized that the redox rhythm is linked to the circadian clock, but the mechanism and the biological significance of this link have only begun to be investigated4–7. Here we report that the master immune regulator NPR1 (non-expressor of pathogenesis-related gene 1) of Arabidopsis is a sensor of the plant’s redox state and regulates transcription of core circadian clock genes even in the absence of pathogen challenge. Surprisingly, acute perturbation in the redox status triggered by the immune signal salicylic acid (SA) does not compromise the circadian clock but rather leads to its reinforcement. Mathematical modelling and subsequent experiments show that NPR1 reinforces the circadian clock without changing the period by regulating both the morning and the evening clock genes. This balanced network architecture helps plants gate their immune responses towards the morning and minimize costs on growth at night. Our study demonstrates how a sensitive redox rhythm interacts with a robust circadian clock to ensure proper responsiveness to environmental stimuli without compromising fitness of the organism.
Life on Earth has evolved the circadian clock to anticipate diurnal and seasonal changes8. This “scheduling” mechanism coordinates biological processes to reduce random energy expenditures and increase fitness. In Arabidopsis, the daily time-keeping is driven by three interlocked transcription-translation feedback loops (TTFLs): the core loop, the morning loop, and the evening loop. The core loop consists of three transcription factors (TFs): two partially redundant morning-phased CIRCADIAN CLOCK ASSOCIATED 1 (CCA1) and LATE ELONGATED HYPOCOTYL (LHY), and the evening-phased TIMING OF CAB2 EXPRESSION 1 (TOC1). CCA1/LHY and TOC1 are repressors of each other’s expression9,10. Besides the TTFL circadian clock, non-transcriptional redox oscillations exist in all domains of life, including Arabidopsis3. Even though redox rhythm was shown to influence the TTFL clock3, how these two oscillatory systems are linked molecularly and what the biological significance of having two oscillatory systems is remain largely unknown.
To begin addressing these questions, we examined the daily changes in the reduction-oxidation coenzymes NADPH and NADP+ in Arabidopsis under constant light and found them to display circadian rhythms (P < 10−4), with NADPH peaking before subjective dawn and NADP+ peaking before subjective dusk (Fig. 1a, b). Moreover, their ratio also oscillated in a circadian manner (Extended Data Fig. 1). These data support the existence of widespread metabolic and redox rhythms in plants beyond the previously reported oscillations of oxidized peroxiredoxin, H2O2 and catalases3,7,11. It is known that the plant immune-inducing signal salicylic acid (SA) can alter the cellular redox to trigger defence gene expression12. We found that under constant light, treating plants with SA could significantly perturb NADPH and NADP+ rhythms as well as their ratio (Fig. 1a, b and Extended Data Fig. 1), indicating that the redox rhythm is sensitive to external perturbations.
Figure 1. SA disrupts redox rhythm but boosts TOC1 expression without changing its period.

a–c, NADPH (a), NADP+ (b) and TOC1 mRNA (c) in plants after application of water (CK) or SA at 0 h under constant light (LL). White and grey bars represent subjective days and nights, respectively. Data are mean ± s.e.m. (n = 3; t-test; ***, P < 0.001). d, e, TOC1p:LUC activity rhythms in plants treated with water (CK) or SA at subjective dawn (d) and dusk (e) (mean ± s.e.m.; n = 6). Arrows indicate treatment time. a.u., arbitrary unit. Bar graphs represent mean ± s.e.m. (Holm-Sidak test; **, P < 0.01; ****, P < 0.0001).
We next examined whether this SA-triggered redox rhythm perturbation could be transduced to the circadian clock by first focusing on the evening-phased TOC1, which is responsive to many environmental factors13. Using quantitative PCR (qPCR), we observed significant increases in amplitude and average expression of TOC1 upon SA treatment (Fig. 1c). Similar results were observed using a transgenic line carrying a reporter of the TOC1 promoter fused to luciferase (TOC1p:LUC)14 (Fig. 1d, e and Extended Data Fig. 2a). Strikingly, the period of the TOC1p:LUC expression rhythm did not change regardless of whether SA was applied at subjective dawn (Fig. 1d) or dusk (Fig. 1e).
To study the effect of endogenous SA, which oscillates in a circadian manner15, on the clock, we crossed the TOC1p:LUC reporter into the SA biosynthesis mutant, sid2 (SA induction–deficient 2)16. We found that the amplitude and the average expression of TOC1 were significantly reduced in sid2 and this phenotype was rescued upon exogenous SA treatment (Extended Data Fig. 2b). Our results indicate that endogenous SA plays a part in the redox rhythm that modulates the amplitude and average expression of the circadian clock.
SA-induced redox changes can lead to reduction of the master immune regulator, NPR1, the release of NPR1 monomer for nuclear translocation, defence gene induction12 and subsequent degradation mediated by the nuclear SA receptors NPR3 and NPR417. To test whether the SA-mediated regulation of TOC1 is through NPR1, we crossed TOC1p:LUC into the npr1 mutant18. We found that the mutation not only dampened the basal expression of TOC1 but also abolished the SA-triggered increases in expression regardless of the time of treatment (Fig. 2a and Extended Data Fig. 3a–c).
Figure 2. SA-regulation of TOC1 depends on nuclear NPR1.

a, c, TOC1p:LUC activity rhythms in wild-type (WT) and npr1-3 (a) or trx-h3 trx-h5 (trx-h3 h5, c) treated with water (CK) or 1 mM SA at subjective dawn (arrow) under constant light (mean ± s.e.m.; n = 6). Bar graphs show mean ± s.e.m. (two-way ANOVA; *, P < 0.05; ***, P < 0.001; ****, P < 0.0001). b, NPR1 monomer (arrow) quantified using the non-specific bands (*) as a loading control. Data are mean ± s.e.m. (n = 3). d, Beta-galactosidase reporter activities shown as fold changes over the vector control. Mut1 and Mut2, mutants of two TGA-binding sites (TBSm). Data are mean ± s.e.m. (n = 3). e, Luciferase activity rhythms of TOC1p:LUC and TOC1p(TBSm):LUC (mean ± s.e.m., n = 20 T1-transformants). f, ChIP experiments were performed using 35S:NPR1-GFP (in npr1-1) plants. Data are mean ± s.e.m. (n = 3; Tukey’s multiple comparisons test; P < 0.0001).
We hypothesized that NPR1 is an intrinsic regulator of TOC1 in response to the rhythmic accumulation of the endogenous SA15. Through western blotting, we indeed found a circadian oscillatory pattern for the NPR1 monomer (P < 0.01) with a peak at night (Fig. 2b and Extended Data Fig. 4a). Therefore, oscillation in the endogenous SA level may drive the rhythmic nuclear translocation of NPR1 to regulate the circadian clock genes. To test this hypothesis, we used mutants of cytoplasmic-localized thioredoxins (TRX), trx-h3 and trx-h5, in which NPR1 nuclear translocation is largely impaired19. We found that both the basal rhythm of TOC1p:LUC and its responsiveness to SA were diminished in trx-h3 trx-h5 (Fig. 2c and Extended Data Fig. 5a), suggesting the requirement of NPR1 nuclear translocation in regulating TOC1 expression. Besides SA, glutathione reduced ethyl ester (GSHmee), a redox-altering reagent20, could also enhance TOC1 expression in an NPR1-dependent manner (Extended Data Fig. 5b), suggesting that NPR1 is a general redox sensor in modulating this clock gene.
NPR1 is a transcription cofactor of the TGA class of TFs in SA-induced defence gene expression21. Using yeast one-hybrid assay, six Arabidopsis TGAs were found to have strong binding affinities to the TOC1 promoter at the two TGA-binding sites (TBS) (Fig. 2d). To confirm this in planta, we mutated TBS in the TOC1p:LUC reporter (TOC1p (TBSm):LUC) and transformed it into Arabidopsis. We found that these mutations significantly inhibited transcription of the reporter (P < 0.001), indicating that TGAs are transcription activators of TOC1 (Fig. 2e). A direct role that NPR1/TGA plays in regulating TOC1 expression was further confirmed through chromatin immunoprecipitation (ChIP) in which association of NPR1 to TBS in the TOC1 promoter was significantly enhanced upon SA induction (Fig. 2f).
TOC1 is unlikely the only clock gene regulated by NPR1, because lowering the TOC1 level shortens the clock period while elevating the level lengthens the period22,23. However, no such perturbation was observed in npr1 (Extended Data Fig. 3d) or after SA treatment (Fig. 1d, e). Moreover, SA treatment at dawn should have caused an immediate induction in TOC1 expression instead of a 12-hour delay (Fig. 1d). To systematically search for other NPR1-targeted clock genes, we performed mathematical modelling using the P2012 circadian model13 under the assumption that NPR1 is also a transcriptional activator of other clock genes (X and Y in Fig. 3a) (see Methods and Extended Data Figs. 6 and 9 for details).
Figure 3. NPR1 regulates transcription of multiple clock genes.

a, NPR1 regulates transcription of genes in the P2012 version of Arabidopsis TTFL clock13. “X”, “Y”, query genes for mathematical modelling. Arrows, transcriptional activation. Block arrows, repression. Dashed lines, post-translational interactions or regulation. b, d, The least squares fitting results of different query genes (X,Y) to the npr1 data (b) and the SA-treated wild-type data (d) in Fig. 2a. The colour bars indicate the least squares residual for each gene combination. Lower residual indicates a better fit. c, PRR7 mRNA in WT and npr1. Data are mean ± s.e.m. (n = 3; t-test; **, P < 0.01). e, LHYp:LUC activity rhythms in plants treated with water (CK) or SA at subjective dawn (arrow) (mean ± s.e.m.; n = 6). Bar graphs represent mean ± s.e.m. (t-test; *, P < 0.05; ****, P < 0.0001).
We first optimized the P2012 model to fit the TOC1 expression in npr1 (Fig. 2a), which was a single parameter fit (i.e., basal expression in the absence of functional NPR1). The heat map of the best least-squares fit showed a characteristic “crosshair” pattern centred on PSEUDO-RESPONSE REGULATOR 7 (PRR7) (Fig. 3b), indicating that the basal regulation of PRR7 by NPR1 best explains the unchanged TOC1 period in npr1 (Extended Data Fig. 6a, b). This prediction was verified using qPCR in which PRR7 transcript levels in npr1 were found to be significantly lower compared to wild type (Fig. 3c). The second fitting for SA-induction data involved multiple parameters. We used our fixed basal expression parameter and NPR1 western data (Fig. 2b and Extended Data Fig. 4) to fit the TOC1 expression from Fig. 2a. The resulting heat map showed a “crosshair” pattern for LHY/CCA1 (Fig. 3d), suggesting that either one or both of these genes is responsive to SA through the function of NPR1. Using qPCR, we found that while CCA1 and EARLY FLOWERING 3 (a negative control) did not respond to SA, the amplitude of LHY expression was significantly elevated by SA (P < 0.05) (Extended Data Fig. 6c–e) as predicted by our model. This result was further confirmed using the LHYp:LUC reporter (Fig. 3e). Consistently, the amplitude of basal LHY expression was reduced in npr1 (P < 0.05) while that of CCA1 remained unchanged (Extended Data Fig. 6f, g). Because LHY is an antagonist of TOC1 in the clock, induction of LHY by SA explains the delayed increase in TOC1 after SA treatment at dawn (Extended Data Fig. 6i, j) when LHY has its highest expression. This balanced network architecture of NPR1 regulating both the morning-phased LHY and the evening-phased TOC1 (Fig. 3a) strengthens the clock when the redox rhythm is perturbed.
To investigate the effect of reinforced circadian clock on plant immunity, we examined SA-induced resistance against bacteria in a toc1 mutant and found it to be more sensitive to induction than wild type and npr1 (Fig. 4a). While TOC1 negatively regulates resistance against bacteria, CCA1 and LHY have been reported to positively regulate resistance against bacteria and oomycetes24,25, timing immunity for the morning when temperature and humidity are the most favourable for infection25. We hypothesized that SA/NPR1-mediated induction of both morning and evening components of the circadian clock plays a major role in maintaining this diurnal difference in plant sensitivity to pathogen challenge.
Figure 4. SA reinforces the circadian clock to gate immune response.

a, Pseudomonas syringae pv. maculicola ES4326 growth in plants pre-treated with water (−) or SA (+) (24 hours) 3 days post infection. c.f.u., colony-forming units. Data are mean ± 95% confidence intervals (n = 8; two-way ANOVA; *, P < 0.05; ***, P < 0.001). b, WRKY40 and PR1 expression in plants 0 or 3 hours (h) after SA treatment. Data are mean ± s.e.m. (n = 3; two-way ANOVA; **, P < 0.01; ****, P < 0.0001). c, Time-of-day-specific transcriptome changes in response to SA treatment. d, Enriched gene ontology categories. e, g, TOC1p:LUC (e), CAB2p:LUC, CAT3p:LUC and CAT2p:LUC (g) activity rhythms in water (CK)- or SA-treated plants (mean ± s.e.m.; n = 11 in e and n = 6 in g). DD, constant dark. Darker and lighter bars represent subjective days and nights, respectively. f, Symptom (left) and fresh/dry weight (right) of plants treated with water (CK) or SA under constant dark (DD) or diurnal conditions (LD) (mean ± s.e.m.; n = 6; t-test; ****, P < 0.0001; n.s., non-significant). h, A model showing the interactions between redox and the circadian clock in gating defence.
To test this, we first examined induction of WRKY40, a direct target of TOC126, and PR1, a direct target of NPR127, 3 hours after SA application either in the subjective morning (ZT24) or evening (ZT36) under constant light. Both defence genes had higher induction after the morning treatment (Fig. 4b). We next performed microarray to investigate this time-of-day-specific sensitivity globally (GSE61059) (Patterns of representative genes verified by qPCR shown in Extended Data Fig. 7a, b). We found more genes showing higher induction by morning SA treatment than the evening treatment (like PR1) (Fig. 4c). They are mainly defence-related genes (Fig. 4d). In contrast, a larger number of genes appeared to be more repressed after the evening treatment and they are enriched in plant growth and development (Fig. 4d). Furthermore, promoter analysis of the differentially induced genes in the morning showed significant enrichments for both cis-elements bound by CCA1/LHY and TOC1, and those of the differentially repressed genes in the evening had significantly enriched cis-elements bound by CCA1/LHY (Extended Data Fig. 7c, d). Collectively, these data strongly support our hypothesis that acute perturbation in redox rhythm caused by SA treatment leads to increased expression of both positive and negative regulators of defence, but with the former in the morning and the latter in the evening (Fig. 3a and Extended Data Fig. 7c, d). This may increase the diurnal differences in sensitivity to pathogen challenge in plants.
Gating defence towards the morning may also be a mechanism for plants to minimize interference on growth at night28,29. We observed that SA treatment of dark-grown plants could help sustain a more robust circadian rhythm (P < 10−15) than mock treatment (P < 0.001) (Fig. 4e), but induced a severe loss in fresh weight (Fig. 4f). This is consistent with our hypothesis that untimely induction of immunity at night is detrimental to plant growth. Besides gating immune response, reinforcement of the clock may also help increase photosynthesis and negate the redox perturbation through enhanced expression of CHLOROPHYLL BINDING PROTEIN 2 (CAB2) and evening-phased CATALASE 3 (CAT3) but not the morning-phased CAT2 (Fig. 4g).
We propose that in Arabidopsis, the daily redox rhythm is intrinsically linked with the basal expression of the circadian clock through NPR1 (Fig. 4h and Extended Data Fig. 8). Perturbation in redox rhythms caused by SA during pathogen challenge is sensed by NPR1 to trigger defence gene expression and to reinforce the circadian clock. The wiring of NPR1 to defence genes as well as to the clock shows how plants gate their immune responses towards the morning to anticipate infection while minimizing fitness costs on plant growth which occurs mainly at night30.
Methods
Plant materials
The TOC1p:LUC (Col-0), LHYp:LUC (Col-0)14 and CAB2p:LUC (Col-0) seeds were provided by Dr. Robertson McClung and the toc1-101 mutant31 by Dr. Shu-Hsing Wu. Mutants of npr1-318, sid216, trx-h319 and trx-h519 were used to cross with the luciferase reporter lines. 35S:NPR1-GFP (in npr1-1)12 plants were used in ChIP experiment. To generate CAT3p:LUC, CAT2p:LUC homozygous lines and different T1 lines of TOC1p:LUC and TOC1p(TBSm):LUC (TOC1 promoter with mutated TGA-binding sites), wild-type CAT3, CAT2 and TOC1 promoters and mutated TOC1 promoter (amplified using QuikChange Lighting Multi Site-directed mutagenesis kit, Agilent Technologies) were cloned into the pDONR207 vector (Invitrogen) through the Gateway BP reaction (Invitrogen) and then transferred to the destination vector pGWB23532 through the Gateway LR recombination reaction (Invitrogen). Agrobacterium-mediated transformation of Arabidopsis was performed as previously described using wild-type plants33. Homozygous T3 lines of CAT2p:LUC, CAT3p:LUC and different T1 lines of TOC1p:LUC and TOC1p(TBSm):LUC were selected and used for the luciferase imaging experiment. All primer sequences used for making the transgenic constructs are listed in Extended Data Table 1.
NADP+ and NADPH measurement
Three-week-old wild-type (Col-0) plants grown in soil under diurnal condition (12 h light/12 h dark) were treated with water or 1 mM SA at subjective dawn and samples were collected every 4 h for two days under constant light conditions. NADP+ and NADPH were measured according to Queval and Noctor34 with modifications. Briefly, 50 mg of 3-week-old leaves were pulverized in liquid nitrogen using Genogrinder and extracted using 10 mM Tris-HCl (pH 8.0, 1 ml Tris-HCL per 100 mg tissue). The homogenate was centrifuged at 16,000 g for 10 min at 4 °C. The supernatant was separated into two 0.2 ml aliquots. To extract NADP+, 50 μl 1 M HCl was added to one 0.2 ml aliquot. The mixture was heated in boiling water for 1 min. Then 25 μl MES (pH 5.6) was added and the pH of the extract was adjusted to 5–6 using 0.2 M NaOH. To extract NADPH, 50 μl 1 M NaOH was added to the other 0.2 ml aliquot. The mixture was heated in boiling water for 1 min. Then 25 μl MES (pH 5.6) was added and the pH of the extract was adjusted to 7–8 using 0.2 M HCl. Three 20 μl aliquots of the NADP+ and the NADPH extracts were used as technical replicates. Samples containing only the extraction buffer were used as blank. The measurement of the samples and the derivation of the standard curves were performed according to Queval and Noctor34.
RNA extraction and quantitative PCR
Three-week-old plants grown in soil under diurnal conditions (12 h light/12 h dark) were treated with water or 1 mM SA at subjective dawn and samples were collected every 4 h for two days under constant light conditions. RNA extraction was performed as previously described18. cDNA synthesis (SuperScript III, Invitrogen) and quantitative PCR (SYBR Green, Roche) were performed according to the manufacturer’s protocols. All primer sequences used for qPCR are listed in Extended Data Table 1.
Luciferase activity measurement
Plants grown in soil with under 12 h light/12 h dark cycles for three weeks were sprayed with 2.5 mM luciferin (Gold Biotechnology) in 0.02% Triton X-100 (Sigma) to activate and deplete pre-existing luciferase due to its instability in the presence of the substrate. Then the plants were transferred into constant light condition. 1 mM SA (Sigma) or water (as control) was sprayed 24 hours later (ZT24). The fifth and sixth leaves were harvested and rinsed three times in 50 ml water. Luciferase was extracted and relative activity was measured according to the manufacturer’s protocol (Luciferase Assay System, Promega).
Luciferase imaging
Plants grown in soil under 12 h light/12 h dark cycles for three weeks were sprayed with 2.5 mM luciferin (Gold Biotechnology) in 0.02% Triton X-100 (Sigma) one day before luciferase imaging. Plants were then placed into the imaging system (Nightshade LB985) under either constant light or dark conditions and assayed for bioluminescence by acquiring images with exposure time of 20 min. To test the effect of SA or GSHmee, 1 mM SA (Sigma)/3 mM GSHmee (Sigma) or water (as control) was sprayed at different indicated times. Subsequent quantifications of bioluminescence intensity were performed using Image J.
Analysis of circadian rhythms
The quantified time course bioluminescence data were decomposed into a line and a sine wave with exponentially decaying amplitude: using GraphPad Prism 6. The intercept of the line at the y-axis (“b”) was considered as the average expression level. The period and amplitude were inferred from the sine wave. The exponential decay was used to account for the dampening of bioluminescence over time. The best fitted value, standard error and degrees of freedom were used for statistical analysis.
Western blot
Three-week-old wild-type (Col-0) plants grown in soil under diurnal condition (12 h light/12 h dark) were treated with water or 1 mM SA at subjective dawn and samples were collected every 4 h for two days under constant light. Detection of the NPR1 monomer protein on a non-reducing SDS-PAGE gel was performed as previously described using an antibody against NPR112.
Yeast one-hybrid assay
The TOC1 promoter was first cloned into the pDONR P4-P1R vector (Invitrogen) through the Gateway BP reaction. The entry clones were recombined into destination vectors pMW#2 (Invitrogen) and pMW#3 (Invitrogen). Mutagenesis of the TOC1 promoter was performed using QuikChange Lighting Multi Site-directed mutagenesis kit (Agilent Technologies) according to the instruction manual. TOC1p_Mut1 (the TOC1 promoter mutated in the 1st TGA-binding site), TOC1p_Mut2 (the TOC1 promoter mutated in the 2nd TGA-binding site) and TOC1p_Mut1+2 (the TOC1 promoter mutated in both TGA-binding sites) were cloned into destination vectors pMW#2 and pMW#3 through the Gateway cloning kit (Invitrogen). The coding sequences of TGAs were cloned into pDONR207 and subsequently transferred into pDEST-AD by the Gateway LR reactions. Transformation of constructs into the yeast strain YM4271 was performed as previously described35. Beta-galactosidase reporter activities were measured using ONPG as the substrate36 and normalized to the control with an empty vector pDEST-AD. All primer sequences used for yeast one-hybrid assay (Y1H) are listed in Extended Data Table 1.
Chromatin immunoprecipitation
Three-week-old soil-grown 35S:NPR1-GFP (in npr1-1)12 plants were treated with either water (CK) or 1 mM SA at dusk and samples were collected 3 hours after treatment. Chromatin immunoprecipitation (ChIP) was performed as described previously37. Immunoprecipitation was performed using a polyclonal antibody against GFP (Ab290, Abcam) and Dynabeads Protein G (Invitrogen). The purified ChIP samples were subject to qPCR using primer pairs for the promoter region (−639 to −589 bp upstream of the start codon) and the coding region (+753 to +803 bp downstream of the start codon) of TOC1. Fold of enrichment was calculated using the comparative Ct method38 using the input samples as normalizers. All primer sequences used for ChIP are listed in Extended Data Table 1.
The mathematical model of the Arabidopsis circadian clock
We applied the P2012 plant circadian model from the Plant Systems Modelling portal13 to elucidate new connections between SA signalling through NPR1 and known plant circadian genes. This numerical ordinary differential equation (ODE) model in MATLAB consists of 32 ODEs and includes transcription terms for 10 genes, which are LHY/CCA1, PSEUDO-RESPONSE REGULATOR 9, 7, 5 (PRR9, PRR7, PRR5), TOC1, EARLY FLOWERING 4, 3 (ELF4, ELF3), LUX ARRHYTHMO (LUX), GIGANTEA (GI) and ABA receptor (ABAR). The 133 parameters in P2012 were previously fitted to multiple datasets in various light-dark photoperiods, different genetic backgrounds, and ABA signalling. It is important to note that the P2012 model was designed to understand and predict changes in period and phase when perturbed by genetic or environmental variations. The model does not aim to reflect the exact transcriptional profiles or the absolute protein concentrations.
It was recently shown that plant circadian models exhibit a ‘period overshoot’ when transitioning from LD to LL cycles39. This period overshoot introduced a constant phase delay in the LL data relative to the LD data. Since this phenomenon was not observed in the experimental data, it is an artefact of the mathematical model. For example, the P2012 model predicts that TOC1 mRNA peaks at ZT18 (i.e., 6 h after subjective light-to-dark transition) under LL conditions13 instead of the real peak time at ZT12. Moreover, our experiments indirectly measured TOC1 expression via the luciferase reporter, which is known to exhibit delays40,41. This delay was deduced to be 2 h because the luciferase reporter peaked at ZT14 (Fig. 1d) whereas the TOC1 mRNA peaked at ZT12 (Fig. 1c).
To take this 2-h delay and the ‘period overshoot’ in the model into consideration, we empirically measured a 4-h delay between simulation TOC1 mRNA levels and our luminescence data. This total 4-h delay was inferred by aligning the second peak after the LD to LL transition in our luciferase experiments (38 h) and TOC1 mRNA in the model (42 h). We subsequently used this 4-h delay to correctly align and fit the P2012 simulation TOC1 mRNA to our experimental luciferase data.
Addition of NPR1 regulation to the circadian clock model
While keeping the original P2012 parameters fixed, we added NPR1 as a transcriptional activator of TOC1, as it has been shown experimentally. We also added NPR1 as a transcriptional activator of two additional clock genes (“query pair”). Our goal was to systematically determine which query pair best fitted our measured TOC1p:LUC expression in wild type and npr1-3 in mock- and SA-treated plants. We multiplied the P2012 transcriptional synthesis term of TOC1 and each gene in the query pair by their own NPR1-dependent regulatory function F(t) (i.e., non-competitive activation). Each regulatory function F has the form:
where [NPR1(t)] is the NPR1 monomer concentration over time, nb is the basal, NPR1-independent transcription level of the gene of interest, na is the maximum NPR1-activated transcription level of the gene and Kd is the effective DNA-binding dissociation constant for the gene. The [NPR1(t)] monomer levels for mock-treated and SA-treated plants were taken from western blot data in Fig. 2b and Extended Data Fig. 4. The NPR1 data for the mock-treated and SA-treated plants were then averaged, normalized, and linearly interpolated to serve as an input function for modelling (Extended Data Fig. 9a, b).
Least squares fitting of the TOC1p:LUC data
For every query pair and the TOC1 gene, we optimized nb, na, Kd parameters (among the 9 parameters, 6 are independent; see below) to give the best least squares fit of the TOC1 mRNA in the model to the patterns of TOC1p:LUC expression in wild-type and npr1-3 with mock- or SA-treated plants over several circadian cycles (Fig. 2a).
Because the time of sampling and the waveforms were different between our experiments and the P2012 model, our luciferase data could not be fitted directly to the model. To solve the sampling time discrepancy, data points from our experiments and the P2012 datasets were interpolated (via cubic spline) to a time resolution of 0.1 h. To circumvent the waveform issue, we first calculated the ratio (R) of npr1-3/WT and SA-treated/mock-treated WT in experimental TOC1p:LUC data:
where TOC1WT, TOC1npr1 and TOC1SA are interpolated experimental data for TOC1p:LUC in (1) mock-treated wild type, (2) mock-treated npr1 mutant, (3) SA-treated wild type, respectively. We then created target P2012 simulation of TOC1npr1 or TOC1SA mRNA data by multiplying the TOC1WT mRNA data in the simulation by Rnpr1 or RSA. We optimized the regulatory function parameters (nb, na, Kd) for each combination of query genes and TOC1. The parameter optimization used nonlinear least squares fitting to minimize the sum of squared residual of TOC1 expression (i.e., squared difference between the model and the target TOC1 mRNA profile). To account for the 4-h delay inherent to ‘period-overshoot’ in the P2012 model and the use of the reporter, we started fitting at 28 h, which corresponds to 24 h in our experiments. We fitted 3-day-long npr1-3 mutant data and 2-day-long WT and SA treatment data.
Fitting of the npr1-3 mutant data
For the first part of the fitting process, we set [NPR1] = 0, which resulted in a single parameter (nb) fit for each candidate gene. Because we coupled NPR1-activation to TOC1 and two other query genes, 3 parameters in total were fitted for each query pair. The optimal parameters were restricted to a value between 0 and 1, where 0 represents no transcription in absence of NPR1 and 1 represents the absence of any regulation by NPR1. We used the function fmincon in MATLAB (2013b, MathWorks, Natick, MA, USA) with sequential programming algorithm without restrictions. We found the 3 parameters that minimized the least squares residual of TOC1 model output to target P2012 TOC1npr1 data. Because nonlinear least squares fitting uses a deterministic algorithm that can become trapped in a local minimum, we ran the simulations from 15 different random starting points to find the global minimum. We confirmed that nonlinear least squares fitting of most query pairs converged to the same global minimum when started from random parameters (Extended Data Fig. 9c, d).
A plot of the best least squares fit for each query gene showed a cross-hair pattern centred on PRR7 in Fig. 3b. The npr1 data (reduced TOC1 amplitude, no change in phase or period) are mostly explained by including PRR7 as an additional target of NPR1 regulation (Extended Data Fig. 6a, b), such that PRR7 levels are reduced in the npr1 mutant (Fig. 3c).
A role for NPR1 in regulating basal expression of PRR7 is consistent with previous genetic data showing that lowering TOC1 expression shortens the circadian period23, whereas lowering PRR7 expression lengthens the circadian period42. Analytical work has previously shown how mutations in opposing components in the clock can lead to unchanged period43. We used our best-fit P2012 model to verify that lowered PRR7 expression lengthens the period by ~2 h, whereas lowered TOC1 expression shortens the period by ~2 h in npr1. Thus, the simultaneous, balanced reduction in expression of two opposing nodes (i.e., TOC1 and PRR7) explains why the period of TOC1p:LUC expression is not altered in npr1.
Mock-treated WT data constrain the parameters
During our fitting procedure for mock-treated WT data, we discovered that optimal always exhibited a simple relationship (Extended Data Fig. 9e). The constraint that explains this empirical relationship is that our final choice of should not alter clock expression in mock-treated WT. Mathematically, should have no effect, on average, on gene expression in mock-treated WT. This condition restricts to depend on because the time-averaged <[NPR1]> in WT is normalized to 1, such that
Thus, we recovered the simple empirical relationship observed in Extended Data Fig. 9e as
Fitting of the SA treatment data
By using the best-fit value for from Step 1 and the constraint from Step 2 to fix , we only needed to fit a single parameter (kd). We restricted kd to lie between 0 (i.e., always maximum expression, insensitive to SA treatment and NPR1 monomer levels) and 5. We verified that allowing kd to be as high as 50 did not significantly improve the least squares fit. For each query pair, we ran nonlinear least squares fit from 15 random starting points. We found that again, in general, they converged to the same global optimum (Extended Data Fig. 9f, g). Fig. 3d shows a cross-hair pattern centred on LHY/CCA1 suggesting that LHY/CCA1 activation by the induced, arrhythmic NPR1 levels during SA treatment should counteract the effect of TOC1 induction. We noted that the best-fit solution from a TOC1-only case shows immediate TOC1 induction after SA treatment (Extended Data Fig. 6i) instead of the observed delay until dusk. However, if we added LHY as an NPR1 target in addition to TOC1, the modelling results best fit our experimental data (Extended Data Fig. 6j). Consistently, LHY expression was found to be induced by SA (Fig. 3e), but reduced in the npr1 mutant (Extended Data Fig. 6g).
Limitations of the model
There are limitations to our model. First, our model was only fitted to the expression of one gene (TOC1p:LUC) under 3 conditions (i.e., wild-type with and without SA treatment, and npr1). Second, our model combines LHY/CCA1 into one gene and cannot resolve the experimental differences that we observed in those genes (Fig. 3e and Extended Data Fig. 6c, d). Third, our model for the SA-induction data pre-sets PRR7 at maximum expression even without SA treatment (i.e., Kd = 0) (Extended Data Fig. 9g). This is unlikely an accurate reflection of a real physiological state. Last, all our experiments and modelling were done under constant light conditions and the additive (acute) light activation terms are effectively 0 because the hypothetical protein responsible for light activation has decayed to 0. These additive light terms should not be affected by our assumption of non-competitive activation by NPR1. Uncovering the proper relationship between the light-dependent terms and the NPR1-dependent terms (i.e., competitive versus non-competitive activation) would require experiments under diurnal conditions. This is outside of the scope of the current paper.
Even though the modelling approach correctly predicted PRR7 and LHY as direct targets of NPR1, it had mixed results with ELF3, which is not a direct target. Our model predicted ELF3 to decrease after SA treatment and to increase in the npr1 mutant. The lack of induction in ELF3 by SA (Extended Data Fig. 6e) was consistent with the model prediction. However, the significantly decreased expression of ELF3 observed in npr1 (Extended Data Fig. 6h) was not in agreement with the model. This discrepancy suggests there are other links between NPR1 and the circadian clock that the current model cannot capture. A future model should be fitted to ELF3p:LUC, which would be an informative constraint.
Bacterial infection
Three-week-old plants grown in soil were pre-treated with water or 1 mM SA at ZT12 and infiltrated 24 hours later with Pseudomonas syringae pv. maculicola (Psm) ES4326 (OD600nm = 0.001) as previously described12. Briefly, 8 plants/genotype/treatment were inoculated with Psm ES4326 and bacterial growth was measured 3 days post inoculation.
Microarray analysis
To test time-of-day-specific sensitivity to SA, 3-week-old soil-grown plants were transferred to constant light condition one day before treatment. Water or 1 mM SA were applied in the subjective morning (ZT24) or evening (ZT36). The fifth and sixth leaves were sampled 0 and 3 hours after treatment. RNA was extracted, amplified, labelled and hybridised to ATH1 GeneChip (Affymetrix) as previously reported25. The arrays were normalized with RMA algorithm and centred to median. Two-way ANOVA (P < 0.05) and Student’s t-test with multiple comparison correction (P < 0.05, Fold changes > 2) were used to identify genes that were significantly more induced or more repressed by water or SA when treated at ZT24 or at ZT36. Athena program (http://www.bioinformatics2.wsu.edu/Athena) was used to identify cis-elements bound by CCA1/LHY including evening element, CCA1-binding site, CCA1 motif1 BS in CAB1 and CCA1 motif2 BS in CAB1. Hypergeometric distribution was used to determine statistical significance. Enriched gene ontology categories were identified using BiNGO (http://www.psb.ugent.be/cbd/papers/BiNGO/Home.html).
Fresh/dry weight measurement
Three-week-old soil-grown wild-type (Col-0) plants were transferred into constant dark condition or normal diurnal condition at dusk. After 36 h, water (control) or 1 mM SA was applied. Two days after treatment, pictures were taken and fresh/dry weight was measured.
Statistical analysis
Statistical analysis was performed using GraphPad Prism 6 (GraphPad Software). All the centre values shown in the figures are means of technical (Figs. 1a, 1b, 2d and Extended Data Fig. 1) or biological (all other figures where applicable) replicates. Experiments were repeated twice for Figs. 1a, 1b and CAB2p:LUC in 4g. All other experiments were repeated three times where applicable. Harmonic regression ( ) followed by ANOVA test was used to identify statistically significant oscillation. The null hypothesis is that all data across different time points are sampled from the same normal distribution. Student’s t-test with multiple comparison correction was performed to identify statistically significant differences between mock and treated samples. Two-way ANOVA was used to assess significant interactions between genotype and treatment or between time of treatment and treatment. Significant interactions suggest the effect of the treatment is dependent on genotype or time of treatment. Tukey’s multiple comparisons test was performed to identify the orders of samples that are significantly different from each other. All statistical tests are two-sided tests where applicable.
Extended Data
Extended Data Figure 1. Circadian oscillation of the NAPDH/NADP+ ratio.
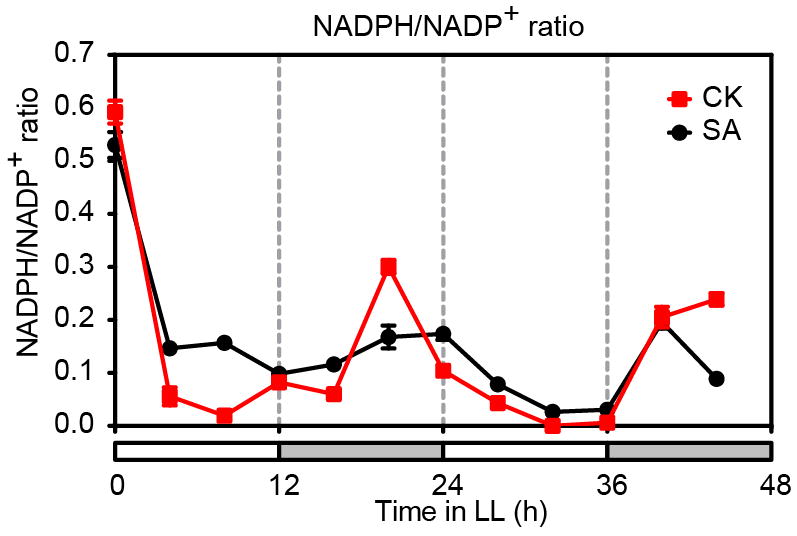
NADPH/NADP+ ratios in 3-week-old soil-grown plants derived from Fig, 1a, b. Water (CK) or 1 mM SA was applied at 0 h. Data are mean ± s.e.m. (n = 3). White bars represent subjective days and grey bars represent subjective nights. Harmonic regression analysis suggests significant circadian oscillation of water-treated NADPH/NADP+ ratio (P < 0.0001).
Extended Data Figure 2. The effects of exogenous and endogenous SA on TOC1 expression.

a, Luciferase activity measurements using the TOC1p:LUC plant extracts. Relative luciferase activity of the fifth and sixth leaves from 3-week-old soil-grown TOC1p:LUC plants. Water (CK) or 1 mM SA was applied at ZT24. LL, constant light. a.u., arbitrary unit. Data are mean ± s.e.m. (n = 6 biological replicates; t-test; ***, P < 0.001). b, TOC1p:LUC activity rhythms in 3-week-old soil-grown wild-type (WT) and sid2 plants treated with water (CK) or 1 mM SA at subjective dusk (black arrow) (mean ± s.e.m., n = 8 plants). White bars represent subjective days and grey bars represent subjective nights. The bar graphs represent the estimates of amplitude and average expression of TOC1p:LUC, respectively (mean ± s.e.m.). The letters above the bars indicate statistically significant differences between groups at P < 0.05 (Tukey’s multiple comparisons test). n.s., non-significant (two-way ANOVA, non-significant interaction between genotype and treatment). This experiment has been repeated three times with similar results.
Extended Data Figure 3. NPR1 regulates the amplitude and average expression of TOC1p:LUC.

a, TOC1p:LUC activity rhythms in 3-week-old soil-grown wild-type (WT) and npr1-3 plants treated with water (CK) or 1 mM SA at subjective dusk (black arrow) (mean ± s.e.m.; n = 6 plants). LL, constant light. a.u., arbitrary unit. White bars represent subjective days and grey bars represent subjective nights. The bar graphs show the estimates of amplitude and average expression level (mean ± s.e.m.; two-way ANOVA; *, P < 0.05; ****, P < 0.0001). b–d, Estimates of amplitude (b), average expression (c) and period (d) of TOC1p:LUC in wild-type (WT) and npr1-3. Data are mean ± s.e.m. (t-test; ****, P < 0.0001). These experiments have been repeated three times with similar results.
Extended Data Figure 4. The abundance of NPR1 monomer under constant light conditions.

NPR1 monomer (M) abundance in 3-week-old soil-grown plants without treatment (a) and after 1 mM SA treatment at 0 h (b) under constant light (LL) conditions. NPR1 protein were detected using western blot after non-reducing SDS-PAGE (a, b). NPR1 monomer protein was quantified using the non-specific band (*) as a loading control (b; mean ± s.e.m.; n = 3 biological replicates; a.u., arbitrary unit). O, NPR1 oligomer. White bars represent subjective days and grey bars represent subjective nights.
Extended Data Figure 5. Redox perturbations affect the amplitude and average expression of TOC1p:LUC in an NPR1-dependent manner.

a, TOC1p:LUC activity rhythms in 3-week-old soil-grown wild-type (WT) and trx-h3 trx-h5 (trx-h3 h5) (mean ± s.e.m., n = 6 plants). LL, constant light. a.u., arbitrary unit. White bars represent subjective days and grey bars represent subjective nights. The bar graphs show the estimates of amplitude and average expression (mean ± s.e.m.; t-test; ****, P < 0.0001). b, TOC1p:LUC activity rhythms in 3-week-old soil-grown wild-type (WT) and npr1 plants treated with water (CK) or 3 mM GSHmee at subjective dusk (black arrow) (mean ± s.e.m., n = 8 plants). The bar graphs represent the estimates of amplitude and average expression of TOC1p:LUC, respectively (mean ± s.e.m.). The letters above the bars indicate statistically significant differences between groups at P < 0.01 (Tukey’s multiple comparisons test). **, P < 0.01; ****, P < 0.0001 (two-way ANOVA). These experiments have been repeated three times with similar results.
Extended Data Figure 6. Model prediction and validation.

a, Comparison of best-fit solutions for the TOC1-only and the TOC1-and-PRR7 coupling in npr1. LL, constant light. White bars represent subjective days and grey bars represent subjective nights. b, Addition of PRR7 coupling improves the fitness and mostly rescues the short period phenotype of the TOC1-only model (mean ± s.e.m.; n = 715, n is degree of freedom derived from nonlinear regression). c–e, The transcript levels of CCA1 (c), LHY (d) and ELF3 (e) in wild-type plants after water (CK) or 1 mM SA treatment. f–h, The transcript levels of CCA1 (f), LHY (g) and ELF3 (h) in wild-type (WT) and npr1 plants. The expression was normalized to UBQ5 (c–h). The bar graphs show the estimates of amplitude and average expression level, respectively (c–h; mean ± s.e.m.; n = 3 biological replicates; t-test; *, P < 0.05; ***, P < 0.001; ****, P < 0.0001). i, j, Comparison of best-fit solutions for NPR1 activation of TOC1-only (i) and NPR1 activation of TOC1 and LHY/CCA1 (j) after SA treatment.
Extended Data Figure 7. Validation and analysis of microarray data.

a, b, The transcript levels of CML40 (a) and AT4G33960 (b) in 3-week-old soil-grown plants 0 or 3 hours (h) after application of 1 mM SA either in the subjective morning (ZT24) or in the subjective evening (ZT36) normalized to UBQ5 under constant light conditions. Data are mean ± s.e.m. (n = 3 biological replicates; two-way ANOVA; ***, P < 0.001; ****, P < 0.0001). c, d, Enrichment of cis-elements affecting time-of-day-specific sensitivity to induction. Promoter analysis of genes that were more induced by SA when treated at ZT24 (c) or more repressed by SA when treated at ZT36 (d). The heat maps show the average expression levels based on the microarray. Circadian correlation coefficients were extracted from Diurnal (http://diurnal.mocklerlab.org/diurnal_data_finders/new). Yellow represents a high value or a target of CCA1/LHY or TOC1. Blue represents low a value or not a target of CCA1/LHY or TOC1. ‘X’ represents a gene that was more induced by SA when treated at ZT24 (c) or more repressed by SA when treated at ZT36 (d). Arrows represent activation. Block arrows represent repression. P values were determined based on hypergeometric distribution.
Extended Data Figure 8. NPR1 senses and transduces redox signals to trigger transcriptional reprogramming.
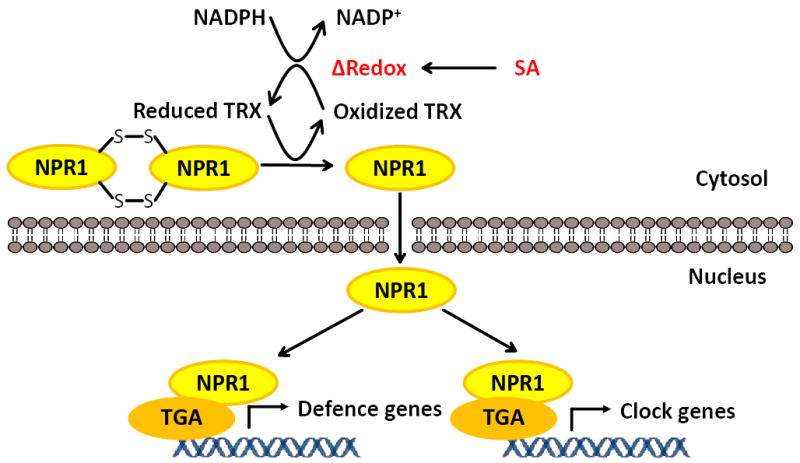
SA-triggered redox changes induce the oligomer-to-monomer switch of NPR1. The monomer then enters the nucleus and up-regulates both defence genes and clock genes through interaction with TGA TFs.
Extended Data Figure 9. Technical details for model fitting.

a, Normalized NPR1 monomer abundance in mock-treated samples. The blue line presents the mean values from Fig. 2b, where the value at 48 h (marked with an open star) was inferred to be the same as 0 h. The red line represents the smoothened values used for modelling by averaging over two days to create a one-day trace, which was then repeated over two days. The smoothened data were normalized, such that the time average of NPR1 was equal to 1. LL, constant light. a.u., arbitrary unit. White bars represent subjective days and grey bars represent subjective nights. b, SA-treated NPR1 monomer abundance. NPR1 monomer abundance after SA treatment from Extended Data Fig. 4b was normalized so that 0 h has the same value as the corresponding mock-treated NPR1 monomer level. Based on the assumption that the SA induction lasted for two days, the value of the last time point was inferred to be equal to the basal level (marked with an open star). c, Coefficient of variation (CV) of least squares residual Σ for 15 different, random initial parameters for the model fitting of npr1 data. d, CV of nb* for 15 different, random initial parameters for the model fitting of npr1 data. e, Optimal exhibit a linear relationship. log(Σ) was plotted as a function of na and Kd for mock-treated TOC1-only coupling (no query pairs). A “low”, linear Σ region is evident and is described by a simple analytical linear relationship. nb*=0.5689 h−1. f, CV of Σ for 15 different, random initial parameters for the model fitting of SA-treated data. g, The CV of Kd* for 15 different, random initial parameters for the model fitting of SA-treated data.
Extended Data Table 1.
Primer sequences
| Purpose | Primer name | Sequences |
|---|---|---|
| Transgenic plants | TOC1p_F | GGGGACAAGTTTGTACAAAAAAGCAGGCTTAGAGATCGCTCGGCTCAACAA |
| TOC1p_R | GGGGACCACTTTGTACAAGAAAGCTGGGTCATTGTTTTGTTTTGTCAATC | |
| TOC1p_Mut1 | ATATTTTCTCCAAGAGTCCGTGGCCTTTTCTC | |
| TOC1p_Mut2 | TTTTTATTGTCCACGGACTCTCCTTGGCCTAA | |
| CAT3p_F | GGGGACAAGTTTGTACAAAAAAGCAGGCTTACCCAAAGCTTCTGGCATTTTTTGACTTTTGTCG | |
| CAT3p_R | GGGGACCACTTTGTACAAGAAAGCTGGGTAGGTGATGATAGAAGGTTGATGATCCCCCAAATAGGCTT | |
| CAT2p_F | GGGGACAAGTTTGTACAAAAAAGCAGGCTTACAAGTAATCGATCATCCTTAAGTTTGGT | |
| CAT2p_R | GGGGACCACTTTGTACAAGAAAGCTGGGTAGGTTTGATGAGAAGAGAGCTTGGAGAGA | |
|
| ||
| Y1H | TOC1p_P4P1R_F | GGGGACAACTTTGTATAGAAAAGTTGGAGATCGCTCGGCTCAACAA |
| TOC1p_P4P1R_R | GGGGACTGCTTTTTTGTACAAACTTGATTGTTTTGTTTTGTCAATC | |
| TOC1p_Mut1 | ATATTTTCTCCAAGAGTCCGTGGCCTTTTCTC | |
| TOC1p_Mut2 | TTTTTATTGTCCACGGACTCTCCTTGGCCTAA | |
| TGA1_F | GGGGACAAGTTTGTACAAAAAAGCAGGCTTAATGAATTCGACATCGACACAT | |
| TGA1_R | GGGGACCACTTTGTACAAGAAAGCTGGGTCCGTTGGTTCACGATGTCGAGT | |
| TGA2_F | GGGGACAAGTTTGTACAAAAAAGCAGGCTTAATGGCTGATACCAGTCCGAGA | |
| TGA2_R | GGGGACCACTTTGTACAAGAAAGCTGGGTCCTCTCTGGGTCGAGCAAGCCA | |
| TGA3_F | GGGGACAAGTTTGTACAAAAAAGCAGGCTTAATGGAGATGATGAGCTCTTCT | |
| TGA3_R | GGGGACCACTTTGTACAAGAAAGCTGGGTCAGTGTGTTCTCGTGGACGAGC | |
| TGA4_F | GGGGACAAGTTTGTACAAAAAAGCAGGCTTAATGAATACAACCTCGACACAT | |
| TGA4_R | GGGGACCACTTTGTACAAGAAAGCTGGGTCCGTTGGTTCACGTTGCCTAGC | |
| TGA5_F | GGGGACAAGTTTGTACAAAAAAGCAGGCTTAATGGGAGATACTAGTCCAAGA | |
| TGA5_R | GGGGACCACTTTGTACAAGAAAGCTGGGTCCTCTCTTGGTCTGGCAAGCCA | |
| TGA6_F | GGGGACAAGTTTGTACAAAAAAGCAGGCTTAATGGCTGATACCAGTTCAAGG | |
| TGA6_R | GGGGACCACTTTGTACAAGAAAGCTGGGTCCTCTCTTGGCCGGGCAAGCCA | |
| TGA7_F | GGGGACAAGTTTGTACAAAAAAGCAGGCTTAATGATGAGTTCTTCTTCTCCA | |
| TGA7_R | GGGGACCACTTTGTACAAGAAAGCTGGGTCAGTTGGTTCTTGTGGACGAGC | |
|
| ||
| qPCR | TOC1_qP_F | AATAGTAATCCAGCGCAATTTTCTTC |
| TOC1_qP_R | CTTCAATCTACTTTTCTTCGGTGCT | |
| LHY_qP_F | CGCTGCTTCGGTCTGGCCTT | |
| LHY_qP_R | TGTAGCAGCGGCAATGGCAGT | |
| PRR7_qP_F | CAGTCCACGAGCGGTATCTC | |
| PRR7_qP_R | CCAGGGCCAGATCACAGTTT | |
| CCA1_qP_F | TGACCGGTCCTCGTGTGGCT | |
| CCA1_qP_R | ACTGCGGCGTGCATTGGACT | |
| ELF3_qP_F | TGGCAAAACTCGTCTGAAGGA | |
| ELF3_qP_R | GCCAAGTGAGATTCAGCTCCAT | |
| PR1_qP_F | CTCATACACTCTGGTGGG | |
| PR1_qP_R | TTGGCACATCCGAGTC | |
| WRKY40_qP_F | ACAACGTCTTGAGGAAGCAAC | |
| WRKY40_qP_R | TCCGTTGAGCTACTCTCCGA | |
| CML40_qP_F | GAGCCACCAAGGCAAGGTAT | |
| CML40_qP_R | GTCCTCGAGCTCCAACGATT | |
| AT4G33960_qP_F | CGTCCAGATTGTTATGCGGC | |
| AT4G33960_qP_R | TGGAGAAGGGTAAGAAGCGG | |
| UBQ5_qP_F | GACGCTTCATCTCGTCC | |
| UBQ5_qP_R | GTAAACGTAGGTGAGTCC | |
|
| ||
| ChIP | TOC1 ChIP promoter_F | TGTCCACGTCATCTCCTTGG |
| TOC1 ChIP promoter_R | AGCTTAATGGTGGGACTTGGG | |
| TOC1 ChIP coding region_F | GAGGCAAGACGAAGTCCCTG | |
| TOC1 ChIP coding region_R | GCTGCACCTAGCTTCAAGCA | |
Acknowledgments
We thank R. McClung for sharing the TOC1p:LUC, LHYp:LUC and CAB2p:LUC transgenic lines; S. H. Wu for providing the toc1-101 mutant; A. Millar for helpful discussion on the project and advice on the modelling; S. Spoel for suggestions on an experiment, P. Benfey for critiquing the manuscript. This work was supported by grants from NIH (1R01-GM099839-01, 2R01-GM069594-09) and by the Howard Hughes Medical Institute and the Gordon and Betty Moore Foundation (through Grant GBMF3032) to X. D. and a DARPA Biochronicity Grant (DARPA-BAA-11-66), NIH Director’s New Innovator Award (DP2 OD008654-01), and Burroughs Wellcome Fund CASI Award (BWF 1005769.01) to N.E.B.
Footnotes
Author Contributions
M.Z., W.W., M.M., and J.M. performed the experiments and statistical analysis. S.K. and N.E.B. identified additional links of NPR1 to the circadian clock through mathematical modelling. X.D. supervised the project. M.Z., W.W., S.K., N.E.B., and X.D. wrote paper. All authors discussed the results and commented on the manuscript.
The microarray data presented in this publication have been deposited in NCBI’s Gene Expression Omnibus and are accessible through GEO Series accession number GSE61059. The computer code is available upon request.
The authors declare no competing financial interests.
References
- 1.O’Neill JS, et al. Circadian rhythms persist without transcription in a eukaryote. Nature. 2011;469:554–558. doi: 10.1038/nature09654. [DOI] [PMC free article] [PubMed] [Google Scholar]
- 2.O’Neill JS, Reddy AB. Circadian clocks in human red blood cells. Nature. 2011;469:498–503. doi: 10.1038/nature09702. [DOI] [PMC free article] [PubMed] [Google Scholar]
- 3.Edgar RS, et al. Peroxiredoxins are conserved markers of circadian rhythms. Nature. 2012;485:459–464. doi: 10.1038/nature11088. [DOI] [PMC free article] [PubMed] [Google Scholar]
- 4.Peek CB, et al. Circadian clock NAD+ cycle drives mitochondrial oxidative metabolism in mice. Science. 2013;342:1243417. doi: 10.1126/science.1243417. [DOI] [PMC free article] [PubMed] [Google Scholar]
- 5.Ramsey KM, et al. Circadian clock feedback cycle through NAMPT-mediated NAD+ biosynthesis. Science. 2009;324:651–654. doi: 10.1126/science.1171641. [DOI] [PMC free article] [PubMed] [Google Scholar]
- 6.O’Neill JS, Maywood ES, Chesham JE, Takahashi JS, Hastings MH. cAMP-dependent signaling as a core component of the mammalian circadian pacemaker. Science. 2008;320:949–953. doi: 10.1126/science.1152506. [DOI] [PMC free article] [PubMed] [Google Scholar]
- 7.Lai AG, et al. CIRCADIAN CLOCK-ASSOCIATED 1 regulates ROS homeostasis and oxidative stress responses. Proceedings of the National Academy of Sciences of the United States of America. 2012;109:17129–17134. doi: 10.1073/pnas.1209148109. [DOI] [PMC free article] [PubMed] [Google Scholar]
- 8.McClung CR. The genetics of plant clocks. Advances in genetics. 2011;74:105–139. doi: 10.1016/B978-0-12-387690-4.00004-0. [DOI] [PubMed] [Google Scholar]
- 9.Nagel DH, Kay SA. Complexity in the wiring and regulation of plant circadian networks. Current biology : CB. 2012;22:R648–657. doi: 10.1016/j.cub.2012.07.025. [DOI] [PMC free article] [PubMed] [Google Scholar]
- 10.Pokhilko A, et al. The clock gene circuit in Arabidopsis includes a repressilator with additional feedback loops. Molecular systems biology. 2012;8:574. doi: 10.1038/msb.2012.6. [DOI] [PMC free article] [PubMed] [Google Scholar]
- 11.Zhong HH, McClung CR. The circadian clock gates expression of two Arabidopsis catalase genes to distinct and opposite circadian phases. Molecular & general genetics : MGG. 1996;251:196–203. doi: 10.1007/BF02172918. [DOI] [PubMed] [Google Scholar]
- 12.Mou Z, Fan W, Dong X. Inducers of plant systemic acquired resistance regulate NPR1 function through redox changes. Cell. 2003;113:935–944. doi: 10.1016/s0092-8674(03)00429-x. [DOI] [PubMed] [Google Scholar]
- 13.Pokhilko A, Mas P, Millar AJ. Modelling the widespread effects of TOC1 signalling on the plant circadian clock and its outputs. BMC systems biology. 2013;7:23. doi: 10.1186/1752-0509-7-23. [DOI] [PMC free article] [PubMed] [Google Scholar]
- 14.Kim WY, Salome PA, Fujiwara S, Somers DE, McClung CR. Characterization of Pseudo-Response Regulators in Plants. Method Enzymol. 2010;471:357–378. doi: 10.1016/S0076-6879(10)71019-3. [DOI] [PubMed] [Google Scholar]
- 15.Goodspeed D, Chehab EW, Min-Venditti A, Braam J, Covington MF. Arabidopsis synchronizes jasmonate-mediated defense with insect circadian behavior. Proceedings of the National Academy of Sciences of the United States of America. 2012;109:4674–4677. doi: 10.1073/pnas.1116368109. [DOI] [PMC free article] [PubMed] [Google Scholar]
- 16.Nawrath C, Metraux JP. Salicylic acid induction-deficient mutants of Arabidopsis express PR-2 and PR-5 and accumulate high levels of camalexin after pathogen inoculation. Plant Cell. 1999;11:1393–1404. doi: 10.1105/tpc.11.8.1393. [DOI] [PMC free article] [PubMed] [Google Scholar]
- 17.Fu ZQ, et al. NPR3 and NPR4 are receptors for the immune signal salicylic acid in plants. Nature. 2012;486:228–232. doi: 10.1038/nature11162. [DOI] [PMC free article] [PubMed] [Google Scholar]
- 18.Cao H, Glazebrook J, Clarke JD, Volko S, Dong XN. The Arabidopsis NPR1 gene that controls systemic acquired resistance encodes a novel protein containing ankyrin repeats. Cell. 1997;88:57–63. doi: 10.1016/s0092-8674(00)81858-9. [DOI] [PubMed] [Google Scholar]
- 19.Tada Y, et al. Plant immunity requires conformational changes [corrected] of NPR1 via S-nitrosylation and thioredoxins. Science. 2008;321:952–956. doi: 10.1126/science.1156970. [DOI] [PMC free article] [PubMed] [Google Scholar]
- 20.Jahan MS, et al. Deficient glutathione in guard cells facilitates abscisic acid-induced stomatal closure but does not affect light-induced stomatal opening. Bioscience, biotechnology, and biochemistry. 2008;72:2795–2798. doi: 10.1271/bbb.80407. [DOI] [PubMed] [Google Scholar]
- 21.Despres C, et al. The Arabidopsis NPR1 disease resistance protein is a novel cofactor that confers redox regulation of DNA binding activity to the basic domain/leucine zipper transcription factor TGA1. Plant Cell. 2003;15:2181–2191. doi: 10.1105/tpc.012849. [DOI] [PMC free article] [PubMed] [Google Scholar]
- 22.Mas P, Alabadi D, Yanovsky MJ, Oyama T, Kay SA. Dual role of TOC1 in the control of circadian and photomorphogenic responses in Arabidopsis. Plant Cell. 2003;15:223–236. doi: 10.1105/tpc.006734. [DOI] [PMC free article] [PubMed] [Google Scholar]
- 23.Millar AJ, Carre IA, Strayer CA, Chua NH, Kay SA. Circadian clock mutants in Arabidopsis identified by luciferase imaging. Science. 1995;267:1161–1163. doi: 10.1126/science.7855595. [DOI] [PubMed] [Google Scholar]
- 24.Zhang C, et al. Crosstalk between the Circadian Clock and Innate Immunity in Arabidopsis. PLoS Pathog. 2013;9:e1003370. doi: 10.1371/journal.ppat.1003370. [DOI] [PMC free article] [PubMed] [Google Scholar]
- 25.Wang W, et al. Timing of plant immune responses by a central circadian regulator. Nature. 2011;470:110–114. doi: 10.1038/nature09766. [DOI] [PMC free article] [PubMed] [Google Scholar]
- 26.Huang W, et al. Mapping the core of the Arabidopsis circadian clock defines the network structure of the oscillator. Science. 2012;336:75–79. doi: 10.1126/science.1219075. [DOI] [PubMed] [Google Scholar]
- 27.Wang D, Weaver ND, Kesarwani M, Dong X. Induction of protein secretory pathway is required for systemic acquired resistance. Science. 2005;308:1036–1040. doi: 10.1126/science.1108791. [DOI] [PubMed] [Google Scholar]
- 28.Shin J, Heidrich K, Sanchez-Villarreal A, Parker JE, Davis SJ. TIME FOR COFFEE represses accumulation of the MYC2 transcription factor to provide time-of-day regulation of jasmonate signaling in Arabidopsis. Plant Cell. 2012;24:2470–2482. doi: 10.1105/tpc.111.095430. [DOI] [PMC free article] [PubMed] [Google Scholar]
- 29.Baldwin IT, Meldau S. Just in time: circadian defense patterns and the optimal defense hypothesis. Plant signaling & behavior. 2013;8:e24410. doi: 10.4161/psb.24410. [DOI] [PMC free article] [PubMed] [Google Scholar]
- 30.Nozue K, et al. Rhythmic growth explained by coincidence between internal and external cues. Nature. 2007;448:358–361. doi: 10.1038/nature05946. [DOI] [PubMed] [Google Scholar]
- 31.Wang Y, et al. LIGHT-REGULATED WD1 and PSEUDO-RESPONSE REGULATOR9 form a positive feedback regulatory loop in the Arabidopsis circadian clock. Plant Cell. 2011;23:486–498. doi: 10.1105/tpc.110.081661. [DOI] [PMC free article] [PubMed] [Google Scholar]
- 32.Nakagawa T, et al. Development of series of gateway binary vectors, pGWBs, for realizing efficient construction of fusion genes for plant transformation. Journal of bioscience and bioengineering. 2007;104:34–41. doi: 10.1263/jbb.104.34. [DOI] [PubMed] [Google Scholar]
- 33.Clough SJ, Bent AF. Floral dip: a simplified method for Agrobacterium-mediated transformation of Arabidopsis thaliana. The Plant journal : for cell and molecular biology. 1998;16:735–743. doi: 10.1046/j.1365-313x.1998.00343.x. [DOI] [PubMed] [Google Scholar]
- 34.Queval G, Noctor G. A plate reader method for the measurement of NAD, NADP, glutathione, and ascorbate in tissue extracts: Application to redox profiling during Arabidopsis rosette development. Analytical biochemistry. 2007;363:58–69. doi: 10.1016/j.ab.2007.01.005. [DOI] [PubMed] [Google Scholar]
- 35.Deplancke B, Dupuy D, Vidal M, Walhout AJ. A gateway-compatible yeast one-hybrid system. Genome research. 2004;14:2093–2101. doi: 10.1101/gr.2445504. [DOI] [PMC free article] [PubMed] [Google Scholar]
- 36.Pruneda-Paz JL, Breton G, Para A, Kay SA. A functional genomics approach reveals CHE as a component of the Arabidopsis circadian clock. Science. 2009;323:1481–1485. doi: 10.1126/science.1167206. [DOI] [PMC free article] [PubMed] [Google Scholar]
- 37.Gendrel AV, Lippman Z, Yordan C, Colot V, Martienssen RA. Dependence of heterochromatic histone H3 methylation patterns on the Arabidopsis gene DDM1. Science. 2002;297:1871–1873. doi: 10.1126/science.1074950. [DOI] [PubMed] [Google Scholar]
- 38.Schmittgen TD, Livak KJ. Analyzing real-time PCR data by the comparative C(T) method. Nature protocols. 2008;3:1101–1108. doi: 10.1038/nprot.2008.73. [DOI] [PubMed] [Google Scholar]
- 39.Dodd AN, Dalchau N, Gardner MJ, Baek SJ, Webb AA. The circadian clock has transient plasticity of period and is required for timing of nocturnal processes in Arabidopsis. The New phytologist. 2014;201:168–179. doi: 10.1111/nph.12489. [DOI] [PubMed] [Google Scholar]
- 40.Finkenstadt B, et al. Reconstruction of transcriptional dynamics from gene reporter data using differential equations. Bioinformatics. 2008;24:2901–2907. doi: 10.1093/bioinformatics/btn562. [DOI] [PMC free article] [PubMed] [Google Scholar]
- 41.Edwards KD, et al. Quantitative analysis of regulatory flexibility under changing environmental conditions. Molecular systems biology. 2010;6:424. doi: 10.1038/msb.2010.81. [DOI] [PMC free article] [PubMed] [Google Scholar]
- 42.Farre EM, Harmer SL, Harmon FG, Yanovsky MJ, Kay SA. Overlapping and distinct roles of PRR7 and PRR9 in the Arabidopsis circadian clock. Current biology : CB. 2005;15:47–54. doi: 10.1016/j.cub.2004.12.067. [DOI] [PubMed] [Google Scholar]
- 43.Rand DA, Shulgin BV, Salazar D, Millar AJ. Design principles underlying circadian clocks. Journal of the Royal Society, Interface/the Royal Society. 2004;1:119–130. doi: 10.1098/rsif.2004.0014. [DOI] [PMC free article] [PubMed] [Google Scholar]