Abstract
Objective
No neurophysiological hypothesis currently exist addressing how and why periodic lateralized epileptiform discharges (PLEDs) arise in certain types of brain disease. Based on spectral analysis of clinical scalp EEG traces, we formulated a general mechanism for the emergence of PLEDs.
Methods
We retrospectively analyzed spectra of PLED time-series and control EEG segments from the opposite hemisphere in 25 hospitalized neurological patients. The observations led to the development of a phenomenological model for PLED emergence.
Results
Similar to that observed in our previous work (Kalamangalam et al. 2014) with afterdischarges, an analytic relationship is found between the spectrum of the baseline EEG and the PLED EEG, characterized by ‘condensation’ of the main baseline spectral cluster, with variable inclusion of higher harmonics of the condensate.
Significance
PLEDs may arise by synchronization of pre-existing local field potentials, through a variable combination of enhancement of excitatory neurotransmission and inactivation of inhibitory neurotransmission provoked by the PLED-associated disease process. Higher harmonics in the PLED spectrum may arise by recurrent feedback, possibly from entrained single units.
Significance
A mechanism is suggested for PLED emergence in certain diseased brain states, and the association of PLEDs with EEG seizures. The framework is a spatially extended version of that which we proposed underlies afterdischarge, and analogous to the cooperative behavior seen in a variety of natural multi-oscillator systems.
Keywords: Partial epilepsy, electroencephalogram, synchronization, Wiener-Winfree-Kuramoto model
Introduction
Introduced 50 years ago, the term periodic lateralized epileptiform discharge (PLED) (Chatrian et al. 1964) denotes a large (100–300 μV or higher), sharp, and repetitive (usually close to 1 Hz) potential on scalp EEG, usually seen in patients with serial seizures and acute structural brain lesions. A substantial literature has since accumulated on PLEDs describing their association with acute and chronic brain lesions (Westmoreland et al. 1986;Wheless et al. 1991;Raroque, Jr. and Purdy 1995;Gross et al. 1998;Westmoreland 2001;Garcia-Morales et al. 2002;Gurer et al. 2004;Kalamangalam et al. 2007), metabolic disturbance (Janati et al. 1986;Raroque, Jr. et al. 1993;Neufeld et al. 1997), and seizures (Schraeder and Singh 1980;Snodgrass et al. 1989;Baykan et al. 2000). Analysis of the EEG appearance of PLEDs have motivated several authors to propose morphological sub-varieties correlated to clinical prognosis (Chong and Hirsch 2005;Kim et al. 2006); for instance, the greater incidence of seizures with the so-called ‘PLEDs-plus’ pattern (Reiher et al. 1991). With regard to seizures, controversy continues regarding whether PLEDs should be considered EEG seizures in themselves (Assal et al. 2001;Ali et al. 2001;Bozkurt et al. 2002;Hughes 2010); recognizing this division of opinion, the recent Standardized Terminology of the American Clinical Neurophysiology Society (Hirsch et al. 2013) drops the word ‘epileptiform’ from the phrase altogether, replacing the PLED acronym with LPD (‘lateralized periodic discharge’). LPD is in fact the currently recommended terminology for PLED, though the latter has been retained in this paper for the purposes of continuity with the cited literature.
Missing from the literature however is a unifying proposal as to why PLEDs occur at all, apart from general agreement that they represent the EEG signature of an unstable brain state related to the combination of one or more of seizures, structural injury and metabolic derangement (Pohlmann-Eden et al. 1996). Such consensus, though accurate in detailing the brain and systemic substrates underlying PLEDs, fails to explain why PLEDs should be periodic, have large amplitude and sharp contour, and have an association with seizures – the very features that enable their visual diagnosis. In this work we present a phenomenological analysis on PLED dynamics, anticipating that the results would secondarily suggest mechanisms underlying PLED generation. Our strategy was essentially similar to our previous work on afterdischarges (ADs) observed during stimulation mapping of patients implanted with subdural grid electrodes (Kalamangalam et al. 2014). In the latter study we observed that the spectrum of the AD electrocorticogram (ECoG) was related to that of the baseline by two processes: (i) ‘condensation’ of the oscillatory mix comprising the baseline pre-stimulus ECoG towards a common average, with (ii) addition of harmonics of the condensed cluster. Those observations, in turn, led to our proposal of how and why ADs may arise following electrical stimulation: coalescence of neighbouring local field potentials (LFPs) from stimulus-induced depolarization of inhibitory interneurons and recurrent feedback from single unit discharges synchronous with LFP surges. With regard to PLEDs, their near-uniformity of morphology and repetition rate within patients, the consistency of the PLED waveform overall as a neurophysiological entity, and the visual similarity with ADs, suggested that their generative mechanisms – though provoked by entirely different processes - were similar to those underlying ADs. In other words, we hypothesized that PLEDs were effectively ‘large-scale’ ADs. A specific prediction that followed was that PLEDs would bear a similar relationship of their spectral structure to the baseline EEG that ADs bore to the baseline ECoG. Thus, if our hypothesis were true, the dynamic mechanisms giving rise to PLEDs - though different in their provenance - would be a ‘magnified’ version of those underlying ADs.
Methods
Data
Twenty-five patients (6 males, 19 females; age range 14–91 years, median age 64 years) encountered in our recent clinical practice were studied. All patients had EEG PLEDs diagnosed by the first author, a board-certified electroencephalographer, on one or more 20-minute routine recordings, or on prolonged (continuous) EEG monitoring. All patients were hospitalized in-patients with the usual range of conditions associated with PLEDs – acute brain lesions (commonly hemorrhage or tumor) or chronic brain lesions with seizures. One patient with a nonlesional MRI brain scan admitted to our epilepsy monitoring unit for characterization of refractory focal epilepsy exhibited a purely post-ictal pattern of PLEDs.
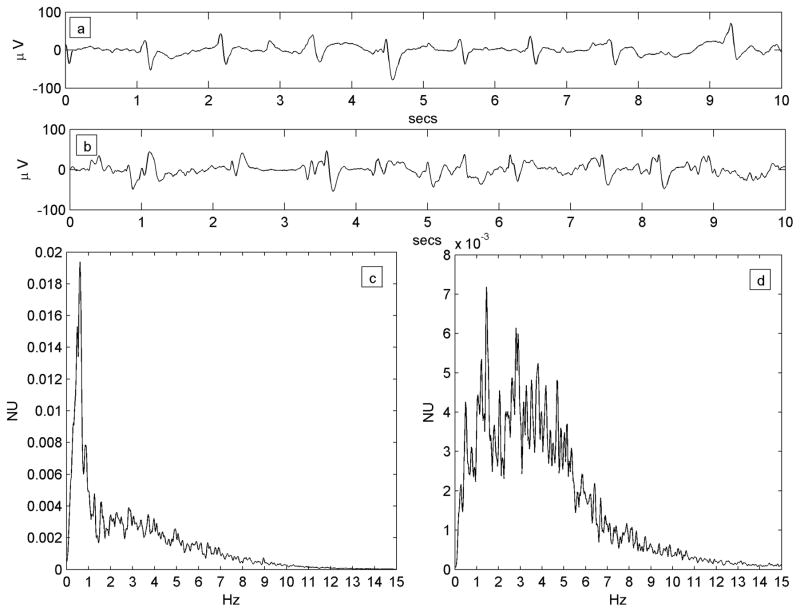
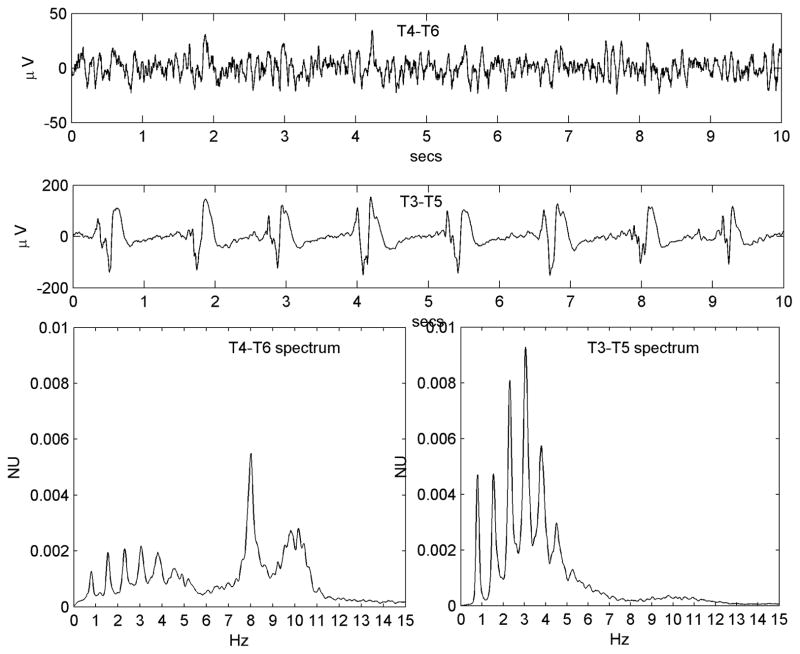
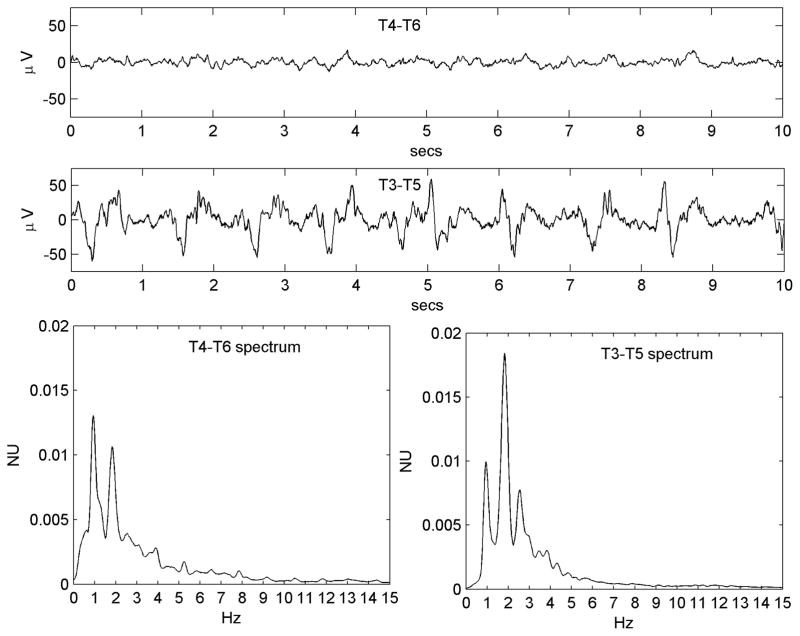
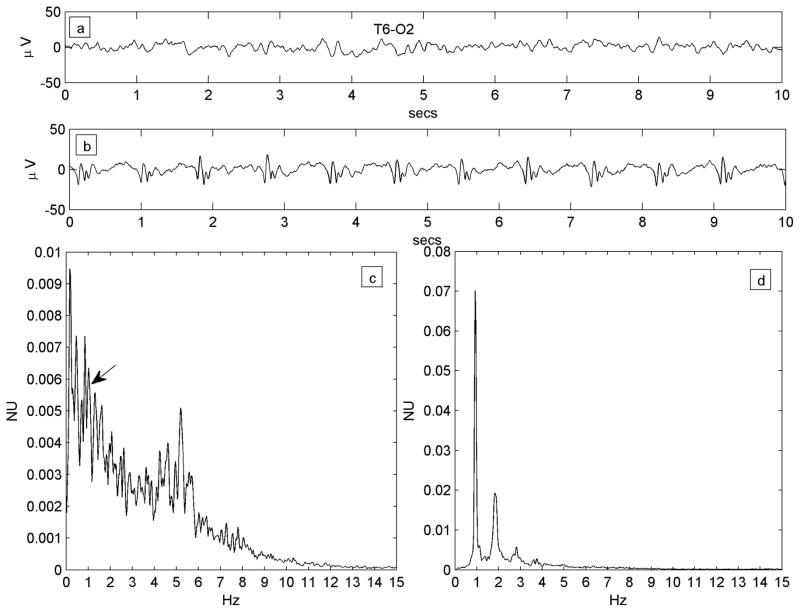
All available EEG data (Nihon-Kohden, Inc., Foothills Ranch, CA, USA; analog data hardware-filtered in the passband 0.5–70 Hz and digitized at 200 Hz or 500 Hz,) were reviewed offline in a longitudinal bipolar montage by the first author. A single 3–5 minute segment of data from each patient was chosen for analysis. Chosen epochs were at least 10 minutes prior to, or following, any seizures and judged to show the PLED abnormality clearly while incorporating a minimum of electrode or other artefact. Due to the subjective nature of visual EEG review, a control dataset of 25 EEG epochs of patients with non-PLED abnormalities were chosen randomly from our EEG database. All 50 data epochs data were randomly ordered, anonymized and presented for independent review to the second author, also a board-certified electroencephalographer and blinded to subject diagnoses. This author was instructed to classify any EEG abnormalities as he would in normal clinical practice, specifically indicating whether PLEDs were present or not and their laterality if present. Only data epochs diagnosed by both authors as PLEDs were analyzed further. Also, each PLED epoch was classified by visual review as regular or irregular: regular, if the PLED pattern was judged to occur with reasonably metronomic rhythm with <50% inter-PLED interval variation for < 50% of the discharges, and irregular if the inter-PLED interval varied significantly (>50% inter-PLED interval variation for >50% of the discharges). In practice, it was easier to identify and exclude irregular PLEDs by the presence of significantly variable stretches of background rhythms visible between discharges. Figure 1 shows an example each of regular and irregular PLEDs, along with their power spectra (see below).
Figure 1.
a) Regular PLED pattern in Patient #14 with serial seizures from leukemic involvement of the CNS. 10-second EEG epoch, x-axis: time (seconds; secs); y-axis: voltage (microvolts; μV).The PLED waveforms occur uniformly in time, yielding a spectrum c) that possesses a well-defined peak at just below 1 Hz, the fundamental period of the pattern. x-axis: frequency (Hz); y-axis: normalized units (NU) of power spectral density. b) An irregular PLED pattern in Patient #3 with seizures related to ventriculitis and CNS lymphoma. Frequent sharp discharges are present but variable in time, with polymorphic and variably long stretches of background between complexes. The spectrum d) has less structure, despite the appearance of local maxima at ~1 Hz, ~2 Hz and ~3 Hz.
Table 1 summarizes clinical details on the patient group and their individual PLED types.
Table 1.
Demographics and relevant clinical details on the PLED patient cohort.
| Patient # | Age/Sex | Neurological Diagnosis | Cranial MRI Diagnosis | Other Active Medical Conditions | PLED Types |
|---|---|---|---|---|---|
| 1. | 74/F | Lobar hemorrhage | L parieto-occipital hematoma | None | Reg |
| 2. | 56/F | Posterior reversible leukoencephalopathy (PRES) | Cortical and subcortical T2 hyperintensities, maximum posterior left temporal and occipital | Sepsis, renal failure, atrial fibrillation | Reg |
| 3. | 73/M | CNS lymphoma | Ventriculitis, R frontal CSF shunt | Sepsis, hyponatremia | Irr |
| 4. | 91/F | Subdural hematoma | L convexity SDH | Sepsis | Reg + Irr |
| 5. | 61/M | Intracerebral and subdural hemorrhage | L fronto-parietal parenchymal contusion; L convexity SDH | Aspiration pneumonia | Reg + Irr |
| 6. | 78/F | Serial seizures, previous ischemic stroke | Chronic L MCA territory encephalomalacia | Urinary tract infection | |
| 7. | 27/F | Bacterial meningitis, serial seizures, neurosarcoidosis | Multiple bihemispheric sarcoid granulomas, R frontal CSF shunt | None | Reg |
| 8. | 75/F | Serial seizures, previously resected gliobastoma | Old L frontal resection cavity | None | Reg |
| 9. | 75/F | Serial seizures, previous ischemic stroke | Chronic diffuse microvascular disease | None | Reg |
| 10. | 14/F | Serial seizures, lupus cerebritis | Multiple chronic bihemispheric infarcts | SLE, renal failure | Irr |
| 11. | 23/F | Focal epilepsy, R occipital | Nonlesional | None | Reg |
| 12. | 75/F | Serial seizures; old L convexity SDH | Chronic L temporal encephalomalacia | None | Reg |
| 13. | 79/F | Acute stroke, focal motor seizures | Hemorrhagic infarct R parietal lobe | Diabetes mellitus, urinary tract infection | Reg |
| 14. | 43/M | Serial seizures | Multiple bihemispheric foci of restricted diffusion | Acute lymphoblastic leukemia with CNS involvement | Reg |
| 15. | 90/M | SDH | R convexity SDH | Coagulopathy | Reg |
| 16. | 64/F | Status epilepticus | Nonlesional | Respiratory failure | Reg + Irr |
| 17. | 58/M | Status epilepticus | Diffuse bihemispheric gyral edema | Cirrhosis | Reg + Irr |
| 18. | 73/F | Serial seizures | Multiple chronic bihemispheric infarcts | Diabetes mellitus | Irr |
| 19. | 59/F | Serial seizures; previously resected AVM | Old L occipital resection cavity | None | Reg |
| 20. | 24/F | Serial seizures; previous TBI | R hemispheric encephalomalacia | Urinary tract infection | Reg |
| 21. | 51/F | Serial seizures | Chronic R frontoparietal encephalomalacia | Hypnoatremia | Reg |
| 22. | 24/F | Serial seizures; previous TBI | L hemispheric encephalomalacia | None | Reg |
| 23. | 77/F | Serial seizures | Multiple chronic bihemispheric infarcts | Hyponatremia | Reg |
| 24. | 77/F | SDH | L convexity SDH | None | Reg |
| 25. | 79/M | Serial seizures; old R ICH | Chronic R parieto-occipital encephalomalacia | None | Reg |
Abbreviations: L: left; R: right; Reg: regular; Irr: irregular; CNS: central nervous system; SDH: subdural hematoma; MCA: middle cerebral artery; CSF: cerebrospinal fluid; SLE: systemic lupus erythematosus; AVM: arteriovenous malformation; ICH: intracerebral haemorrhage; TBI: traumatic brain injury.
Analysis
Digital EEG data segments were imported into and processed in MATLAB (The Mathworks, Natick, MA, USA). The single channel from each patient showing the largest and clearest PLED waveform in a longitudinal bipolar montage was isolated, as also its contralateral homolog (thus, if the left mid-temporal derivation (T3–T5) showed the PLED best, that channel and its counterpart T4–T6 was isolated). The data were low-pass filtered below 30 Hz and power spectra computed by the periodogram method (Karl 1989). Spectra were smoothed with a 10-point moving average filter, normalized to unit area and visually inspected. The most prominent peak (the highest peak that possessed some distribution; i.e., the mode of the frequency distribution) was identified and the second and fourth moments of the distribution computed about the peak (that is, the variance and kurtosis of the distribution, but computed about the mode, not the mean). The results were tabulated (Table 2), and statistically significant differences between the means of the moments between the PLED and non-PLED EEG investigated (MATLAB Statistics Toolbox).
Table 2.
Columns 2–4: Details of the transformations of condensation, harmonics and low-pass filtering assessed visually between the PLED and normal (non-PLED) EEG spectra in the patient group (22 with regular PLEDs from the initial group of 25). Columns 5–8: Corresponding metrics of narrowness (standard deviation = √variance) and peaked-ness (kurtosis) of the spectra about the most prominent peak (the mode). Standard deviations are smaller and kurtosis larger in the patient group, both differences confirmed statistically significant (see text). L-P: low-pass; Mode-STD: standard deviation about the mode; Mode-Kurt: Kurtosis about the mode.
| Pt # | Condensation | Harmonics | L-P filtering | Mode-STD (PLED) | Mode-STD (non-PLED) | Mode-Kurt (PLED) | Mode-Kurt (non-PLED) |
|---|---|---|---|---|---|---|---|
| 1. | + | + | + | 4.8 | 5.5 | 6.32 | 4.12 |
| 2. | + | − | − | 3.38 | 2.98 | 12.23 | 14.4 |
| 3. | |||||||
| 4. | + | + | + | 3.75 | 4.95 | 7.02 | 4.53 |
| 5. | + | + | − | 3.02 | 2.98 | 10.91 | 11.63 |
| 6. | + | − | + | 2.05 | 2.03 | 23.65 | 16.78 |
| 7. | + | + | − | 3.37 | 2.94 | 11.48 | 8.15 |
| 8. | + | − | + | 3.06 | 4.05 | 10.46 | 3.10 |
| 9. | + | − | − | 3.43 | 4.4 | 10.66 | 7.15 |
| 10. | |||||||
| 11. | + | − | + | 3.93 | 4.82 | 9.21 | 5.93 |
| 12. | + | − | + | 3.03 | 3.62 | 6.23 | 4.66 |
| 13. | + | + | − | 3.32 | 3.23 | 10.58 | 9.19 |
| 14. | + | − | + | 3.73 | 5.36 | 4.31 | 3.97 |
| 15. | + | − | − | 2.46 | 2.99 | 9.91 | 7.02 |
| 16. | + | − | + | 3.27 | 4.47 | 7.62 | 5.7 |
| 17. | + | − | + | 4.65 | 5.03 | 4.83 | 3.81 |
| 18. | |||||||
| 19. | + | − | + | 3.92 | 4.24 | 10.48 | 7.28 |
| 20. | + | − | + | 4.16 | 6.46 | 8.68 | 3.53 |
| 21. | + | − | + | 4.54 | 5.25 | 6.01 | 4.87 |
| 22. | + | − | + | 3.78 | 5.49 | 5.65 | 3.92 |
| 23. | + | + | − | 4.16 | 5.31 | 7.21 | 5.03 |
| 24. | + | − | + | 4.22 | 6.07 | 4.35 | 3.14 |
| 25. | + | − | + | 3.49 | 6.15 | 6.82 | 3.74 |
| MEAN VALUES | 3.61 | 4.47 | 8.85 | 6.44 | |||
The study was approved by the Institutional Review Board of the University of Texas Health Science Center.
Results
Twenty-two patients were judged to have regular PLEDs; only these patients’ data were interpreted (see Discussion).
PLED spectra
Comparison of power spectra of regular PLEDs with those derived from length-matched non-PLED EEG epochs from the homologous channel revealed three types of relationship between the two spectra, not all obvious on visual review of the raw time-series.
(i) ‘Condensation’
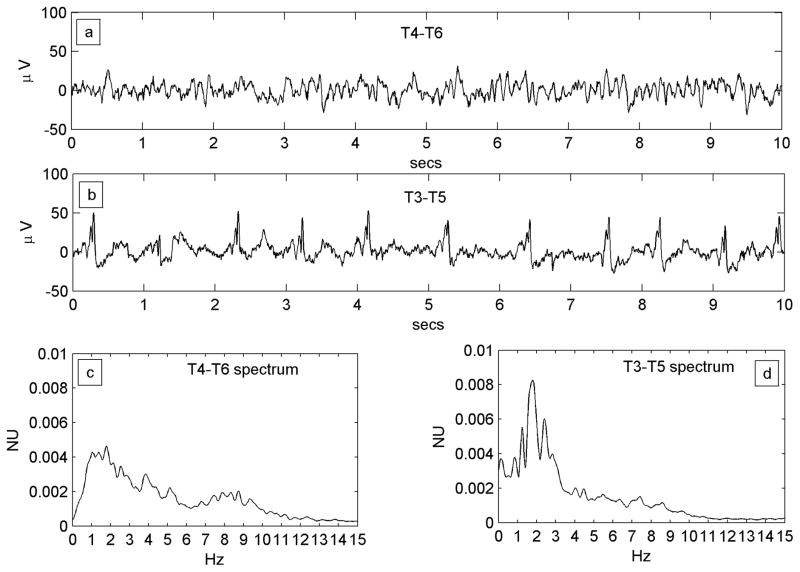
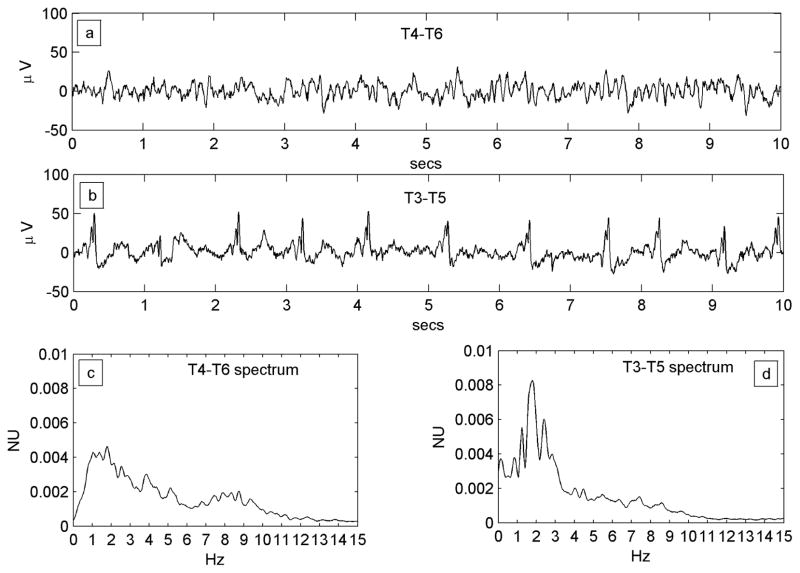
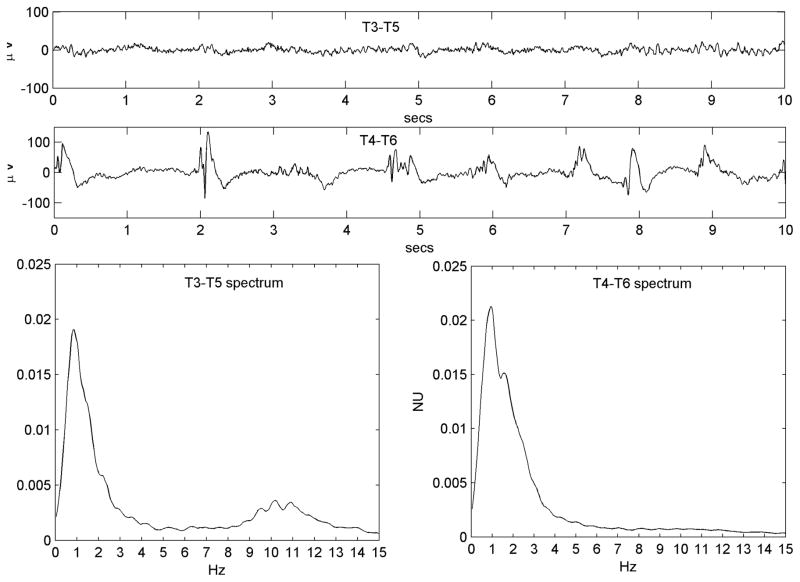
The major power peak in the contralateral spectrum was represented more prominently in the PLED spectrum, with less of a distribution around the mean, variable but modest shift of the mean itself, and relatively reduced power in frequencies away from the mean. In other words, the PLED power spectrum appeared as an accentuated version of the contralateral spectrum’s main power band, as though the latter had ‘condensed’ or ‘clumped’ together, with or without a minor shift to the left or right, to yield the PLED spectrum. Figure 2A shows a typical example.
Figure 2.
Figure 2A. A regular PLED in a patient with an acute left posterior quadrant lobar hemorrhage (Patient #1) illustrating condensation and low-pass filtering. a) A10-s EEG epoch from the normal right hemispheric mid-temporal derivation, showing a mix of polymorphic fast and slow rhythms and irregular larger amplitude transients b) A typical epoch of the homologous left mid-temporal chain showing PLEDs at frequency ~1 Hz. c) Power spectrum of the entire T4–T6 EEG epoch. The spectrum is wide-band with broad maxima in the δ and α Berger bands, the latter indicating a preserved posterior dominant rhythm. d) Power spectrum of the entire T3–T5 EEG epoch. Comparison of the spectra illustrates spectral condensation, with the broad δ band of the normal side appearing to coalesce into sharply defined peaks in the PLED spectrum. Indeed, the small local maximum on the normal side (at ~2 Hz) ‘grows’ in the same location into the dominant frequency component of the PLED. The two spectra also illustrate low-pass filtering, with the α-band frequencies on the normal side flattening out on the PLED side, in keeping with the visually-obvious absence of the α rhythm in the raw PLED time series.
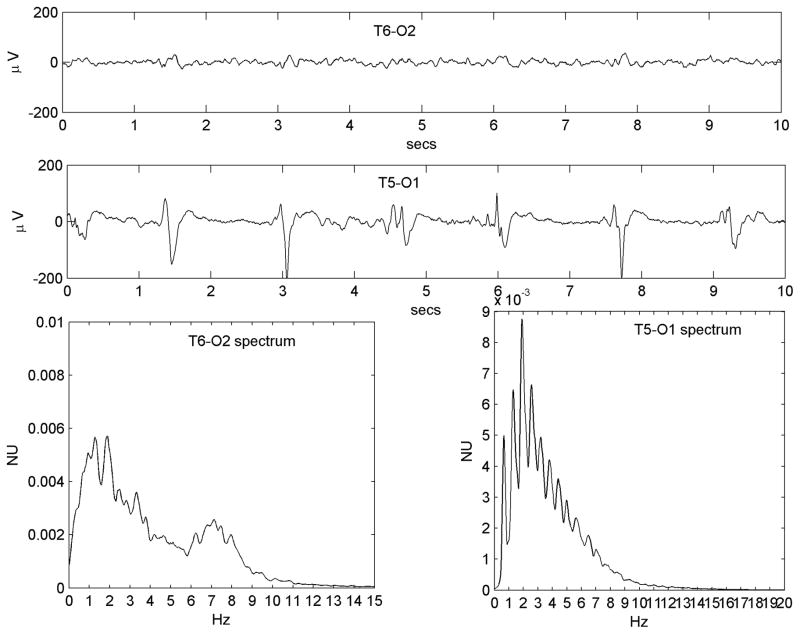
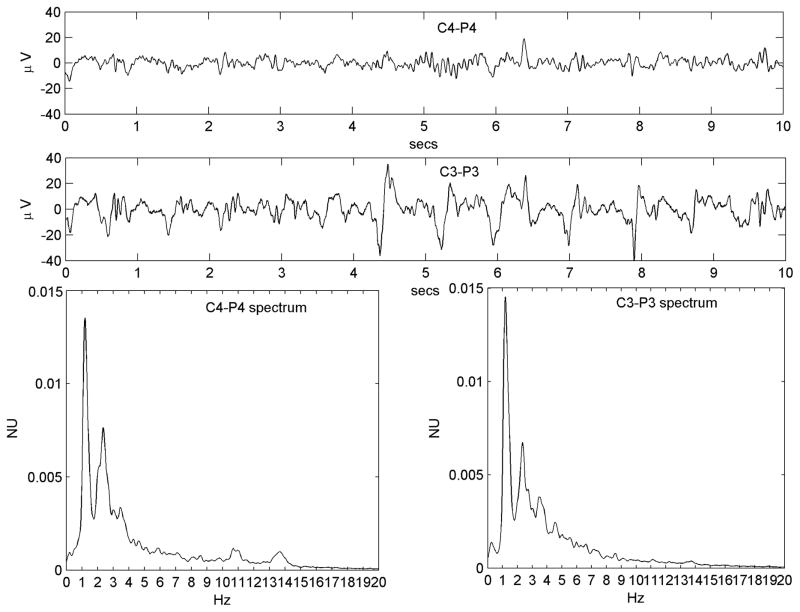
Figure 2B. Example of the condensation-plus-harmonics transformation in Patient #7 with serial seizures and a previously resected brain tumor. a) Continuous slowing on the normal (but encephalopathic) left side. b) Right-sided ~1 Hz PLED pattern. c) Left sided power spectrum shows a relatively narrow base with significant power only below ~4 Hz in keeping with the slowing seen in the time series. A prominent peak at ~2 Hz is however present. d) The PLED spectrum shows more discrete and condensed appearance, with three main peaks: a fundamental (at ~1 Hz), a second harmonic (at ~2 Hz) that corresponds to the maximum peak of the normal side, and a third harmonic (at ~3 Hz). A further smaller peak at ~3.5 Hz appears, of uncertain origin.
(ii) Condensation-plus-harmonics
In addition to the condensate corresponding to the contralateral spectrum’s major peak, the PLED spectrum showed significant harmonic content: additional peaks at integral multiples and/or submultiples of the fundamental peak. Figure 2B shows an example.
(iii) Low-pass filtering
The PLED spectrum showed a relative deficit of faster frequencies, as though the contralateral EEG had been put through a low-pass filter. Figure 2A illustrates this effect beyond ~6 Hz in the PLED and non-PLED spectra.
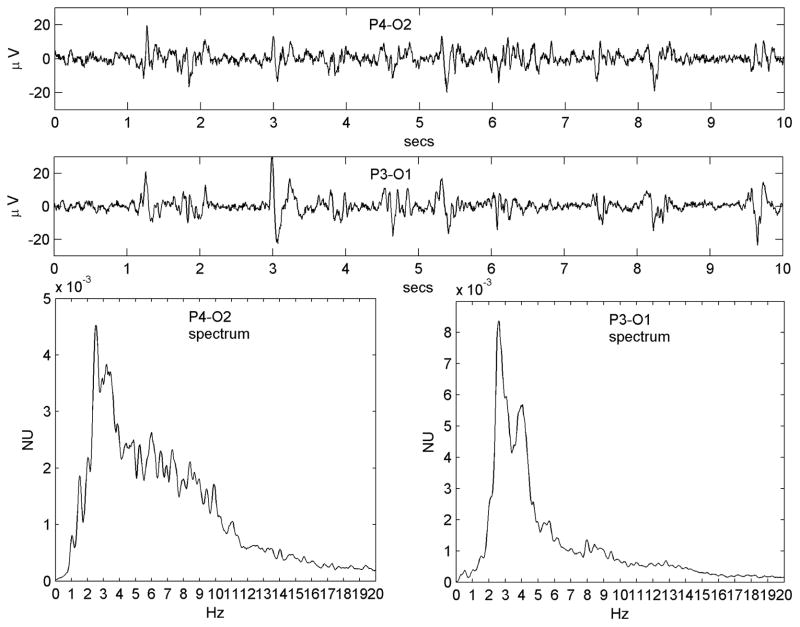
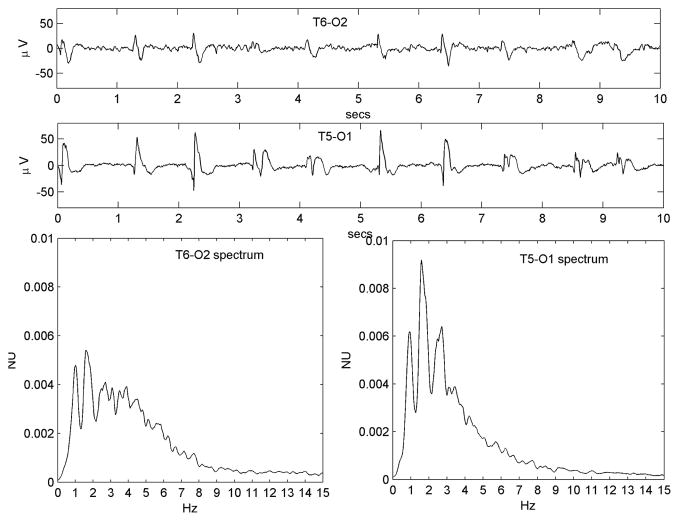
Figures 3A-H provide eight more examples from different patients that illustrate the three dynamic effects observed. Some variability is seen in the relative prominence of the three effects across patients. Table 2 provides a listing of these effects judged qualitatively for all 22 patients, in addition to quantitative metrics (mode-centered variance and kurtosis) for condensation.
Figure 3.
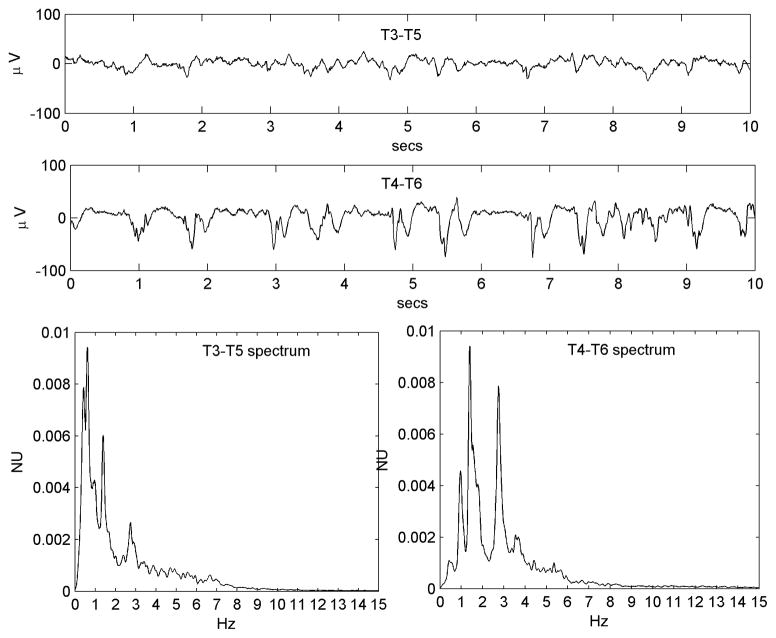
Figure 3A-H. Eight different examples (from Patients #4, #8, #9, #12, #13, #20, #21 and #23 respectively), illustrating the diversity of the condensation, harmonic generation and low-pass filtering dynamics observed. See Table 1 for clinical details. All three dynamic effects are appreciated in 3G; condensation and harmonic generation are particularly prominent in 3C, 3E and 3H; condensation and low-pass filtering are prominent in 3D and 3F (the former also has a fine superimposed toothcomb harmonic structure); low-pass filtering alone is prominent in 3A and 3B (in the latter, an incipient PLED waveform is seen on the ‘normal’ side as well).
Statistical analysis
These were directed to quantifying the changes of condensation, which we believe to be the central dynamic mechanism underlying the normalcy-to-PLED transition (see Discussion). In group analysis, the mode-centered variance was significantly less in the PLED group (one-way ANOVA, F = 8.16, p = 0.007); mode-centered kurtosis was significantly greater (one-way ANOVA, F = 4.19, p = 0.047).
Temporal behavior of PLED spectra
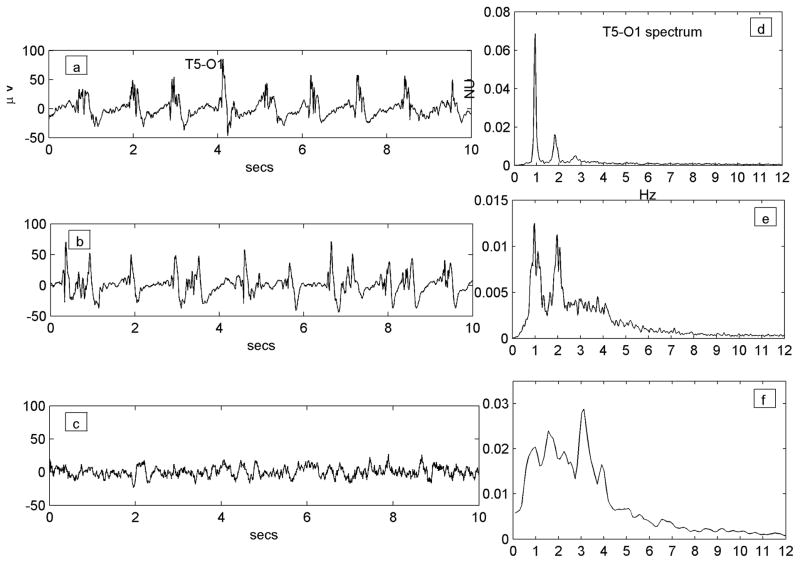
For most patients, the only EEG data available for review were those that showed PLEDs. However, three patients in the group underwent EEGs in the immediate convalescent phase of their acute illness that showed resolution of PLEDs. If the baseline EEG spectrum ‘transformed’ into a PLED spectrum by the processes of condensation, harmonic-generation and low-pass filtering due to disease pathology, we expected the reverse changes to occur in the post-PLED phase. Figure 4 illustrates type of this change in a patient (Patient #19) who underwent continuous EEG monitoring that was only discontinued after resolution of PLEDs.
Figure 4.
Resolution of the PLED waveform over time in a patient who received continuous monitoring (Patient #19, with an old left hemispheric structural lesion and status epilepticus). Traces a), b) and c) are all of the same T5-O1 channel (channel label marked only once for clarity); figures d), e) and f) are the corresponding power spectra. a) A robust regular PLED waveform, whose spectrum d) shows a clear 2-peaked structure of a fundamental (at ~0.9 Hz) and its second harmonic (at ~1.8 Hz) along with a small third harmonic (~2.7 Hz). b) The waveform later in the illness becomes somewhat irregular with some reduction of sharp components. The spectrum at this stage e) has broadened out and lost the third harmonic, though a clear two-peak structure remains. c) In the immediate post-recovery phase the EEG has returned to near baseline with continuous polymorphic slowing only; its spectrum f) is wide-band, but exists largely in the same domain (~0–4 Hz) that gave rise to the PLED peaks earlier. There is peak at ~3.1 Hz not present in the PLED waveforms that represents faster frequencies that were filtered out in the formation of the PLED; the remainder of the spectrum (< 3 Hz) does possess a small local maximum at ~0.9 Hz that condenses and accrues harmonics to yield the PLED.
Three patients also underwent EEG prior to subsequent EEGs that showed PLEDs. These EEGs more accurately represented the background or baseline state (see Discussion) that the PLEDs subsequently arose from, and were important to our PLED generation hypothesis. Figure 5 illustrates an example: this patient (Patient #11) was healthy apart from chronic focal epilepsy and was admitted for seizure monitoring. Her baseline EEG was recorded in her usual interical state; PLEDs only occurred in the post-ictal state after provocation of multiple seizures following intentional anticonvulsant medication withdrawal.
Figure 5.
Emergence of the PLED waveform from the normal background rhythms in Patient #11. a) A 10-s epoch in light sleep from the right occipital region shows well-formed polymorphic rhythms, composed of c) two broad spectral peaks centered at ~1 Hz and ~5.5 Hz. Following a cluster of seizures, the patient exhibited b) a PLED pattern. Its spectrum d) has a clear multi-peak, low-pass filtered structure. The fundamental (left-most peak; arrow) arises at ~1 Hz, which is approximately concordant with a local maximum of the baseline spectrum (arrow).
Analogy with ADs
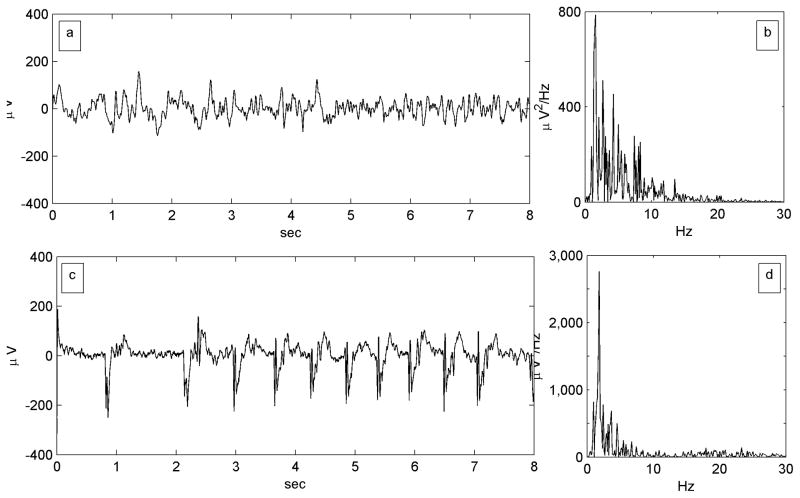
In previous work we described the same transformations – condensation and harmonic generation – underlying the genesis of ADs from the baseline ECoG (Kalamangalam et al. 2014). Figure 6, adapted from Figure 3 in that article, illustrates the feature of spectral condensation in AD generation. Of particular note, the AD in Figure 6 is repetitive and stereotyped in a fashion reminiscent of a PLED; indeed, it would be challenging to distinguish such a waveform from scalp PLED if the axes scales were missing.
Figure 6.
Spectral condensation in electrocorticographic afterdischarge (AD). Figure adapted from Figure 2 of Kalamangalam et. al. (2014). a) An 8-second epoch from a single channel of a lateral temporal subdural electrode contact in a patient undergoing cortical stimulation mapping, though prior to any stimulation. x-axis: time (seconds); y-axis: waveform amplitudes referenced to a common average (μvolts). b) The power spectrum of the baseline epoch is an irregular mix of components that is biased towards the lower frequencies. x-axis: frequency (Hz); y-axis: power spectral density (μV2/Hz). c) An 8-second afterdischarge elicited by a 6 mA stimulus at the same electrode. d) The AD’s power spectrum is a ‘condensed’ version of the baseline spectrum: less spread out, more sharply peaked, and of much greater amplitude at the maximum.
Discussion
A remarkable fact of clinical electroencephalography is the appearance of rhythms of almost geometric precision and regularity from, or accompanying, polymorphic and irregular activity, for instance, bursts of 3-Hz spike-wave activity that arise from the background in primary absence epilepsy, or the almost monomorphic sinusoidal posterior background rhythm in some normal subjects. The appearance of these structured rhythms suggests an abstract underlying organizing principle that may be initially probed without regard to precise physiological substrate(s). This was our approach in previous work with ADs (Kalamangalam et al. 2014), and considering the many qualitative similarities between ADs and PLEDs (compare Figures 1 and 6, for instance), it was our approach in this work too. Our results suggest that, at a phenomenological level, PLEDs arise from the baseline EEG in much the same way as ADs arise from the baseline ECoG: by (i) ‘condensation’ of the baseline oscillatory mix into a central ‘clump’, and (ii) the addition of harmonics of the clump. A third mechanism, (iii) low-pass filtering, was variably seen. We now consider each of these mechanisms in turn, first at the conceptual level, and then in terms of the putative neurophysiology.
If the baseline EEG is conceived of as a mixture of disparate oscillations (not just along the classical α, β, θ, δ bands but also the intrinsic variations in these frequencies that gives rise to the continuous EEG spectrum), then the emergence of a single dominant oscillation (i.e., the PLED) from the mixture implies the convergence of the oscillatory variation to a common average. Such convergence may be achieved by coupling – increasing connectivity between the oscillators, so that each begins to influence the other reciprocally. In the cerebral cortex, increasing coupling may be achieved by decreasing inhibition and/or increasing excitatory neurotransmission (Buzsaki 2006). As coupling strength increases, the oscillators begin to increasingly resemble each other, until at critical coupling, the entire ensemble synchronizes into a single coherent large scale structure. Such coalescence (or ‘condensation’) is consistent with the spontaneously synchronous behaviour of a variety of different systems in the natural world (Strogatz 1994;Strogatz 2003), and was in fact first proposed as a model of the human EEG alpha rhythm by the mathematician Norbert Wiener (Wiener 1961) in the 1950s. The intuition behind the spectral changes leading to a large-amplitude, stereotypic waveform in the time domain, and a mathematical model (the Wiener-Winfree-Kuramoto model) to illustrate these effects on synthetic data was presented in some detail in our previous work. With regard to the underlying physiology, the fact that the EEG exhibits a continuous spectrum has been long known. For instance, the ‘alpha’ rhythm denotes not a precise frequency, but a certain range, even within a single individual. Early intracranial recordings demonstrated the alpha rhythm in fact as a dynamic spatiotemporal mosaic over much of the neocortex (Grey Walter 1950); thus, it is more correct to speak of alpha ‘rhythms’ rather than ‘rhythm’ (Nunez and Srinivasan 2006). Such a moving mosaic is thought to be sustained by the cortex’s macrocolumnar architecture: excitatory interactions cause adjacent columns to coalesce temporarily to create bigger spatial domains; inhibitory neurotransmission shuts off intercolumnar crosstalk and splits domains into smaller subdomains (Buzsaki 2006). Thus, as cortical domains expand and contract ceaselessly in the living brain so do the frequencies of the alpha rhythms they sustain (Nunez et al. 2001). Such a scenario is presumably applicable to the slower (theta, delta) and faster (beta) rhythms too. Now if intercolumnar inhibition were to significantly weaken (or equivalently, excitatory interactions were to significantly increase), the functional parcellation of the cortex would break down as the oscillators developed coupling across previously separate spatial domains and across their intrinsic frequencies. Thus, the rhythms would merge into each other, the multifrequency mix giving way to global synchrony at some smaller set of intermediate frequencies. As in previous work, we call this phenomenon spectral ‘condensation’. Several acute pathologies may perturb the cortex’s structural and functional parcellation and yield PLEDs, such as intracerebral haemorrhage, herpes simplex encephalitis (HSE), and the post-ictal state (PIS). PLEDs in the latter are arguably our closest analogy to ADs (Patient #11). In our previous work on ADs, we hypothesized that ADs arose through selective interneuron exhaustion from repeated depolarizations induced by electrical stimulation. We based our hypothesis on evidence from animal models for the selective vulnerability of interneurons to electrical perturbation (Csicsvari et al. 1998), and such a mechanism is our hypothesis for PIS-related PLEDs too. Repeated or prolonged seizures involve firing (i.e., action potential generation) of principal units and interneurons for equivalent lengths of time. If interneurons took longer to recover from such intense depolarization because of their greater vulnerability, the postictal period would be characterized by a lack of inhibition between adjacent LFPs, allowing them to phase-lock and generate PLEDs.
We observe not just a single clumped condensate but also harmonics. The latter may arise as feedback to the LFP (Grenier et al. 2003): the large excursions of the LFP taking single-unit membrane potentials periodically beyond threshold and provoking synchronous firing that recurrently influences the LFP itself. The end result is a spectrum comprising a single peak and its harmonics; its time-domain appearance is therefore a repetitive, sharp, high-amplitude waveform: the electroencephalographic PLED. We emphasize the speculative nature of this mechanism. The PLED’s sharp contour could equally arise through an entirely different process, with the harmonics simply representing such a sharp waveform’s Fourier modes.
We propose that the low-pass filtering effect of the normal-to-PLED transition is merely a consequence of the large areas of cortex that PLEDs generally arise from. It is known from fundamental principles (Gloor 1985) that in general an inverse relation exists between the frequency of an electroencephalographic waveform and the volume of cortex it occupies. Thus, a region of cortex organized along multiple functional or structural spatial scales would be capable of sustaining rhythms at those equivalent frequencies. If however the cortical region were to become spatially homogeneous through disease, only the lower frequencies would survive. That is, the aggregate rhythm from that cortical area would look as though it was low-pass filtered when compared to the healthy baseline.
We re-emphasize that all the above proposed mechanisms are speculative. They are nevertheless unifying and based on novel observations with real data, and consistent with the known biology of the cerebral cortex, while offering for the first time a conceptual framework for understanding PLEDs. Confirmation of our ideas is unlikely to come from more human studies but rather will necessitate an animal model of PLEDs (Hartings et al. 2003) incorporating simultaneous single unit, field potential and surface EEG recordings.
We comment on a few data processing issues. Our method of demonstration of spectral condensation and harmonic generation was by comparing the PLED EEG with its homologous channel as a ‘control’. Yet, due to the acute illness of the majority of patients, EEG from the non-PLED side was almost never normal, and usually showed pathological slowing. While this was an inescapable limitation for the majority of records, we highlight the case of the single patient with postictal PLEDs (Patient #11) whose pre-PLED EEG was recorded during her interictal state of good health. The features of condensation and harmonics could be appreciated in the EEG of this patient too. Also, all our results have been interpreted with reference to the 22 ‘regular’ PLED patients from the set of initial set of 25 patient records. The spectrum of irregular PLEDs had no definite structure (Figure 1), but we believe that the lack of structure merely reflected the noise and irregularity of the data, and not different generative processes. For instance, Patients #4, #5, #16 and #17 (Table 1) exhibited both regular and irregular PLEDs, and given that both PLED types were seen in the same patient, it was unlikely that they arose from fundamentally different mechanisms.
Several questions remain open that, as we suggest above, may only be properly answered in the context of an experimental preparation. Aside from investigation of our proposals for PLEDs of the conventional variety, periodic discharges of different types occur in a variety of other neurological illnesses, and the question of whether similar dynamic mechanisms apply is raised. For instance, classic (‘myoclonic’) sporadic Creutzfeld-Jacob disease (sCJD) is associated with a periodic EEG abnormality (Sadowsky et al. 2008). It is unclear why and how this EEG abnormality arises, though it must ultimately arise as a consequence of the disease’s pathology. Similar considerations apply the generalized periodic patterns seen in severe diffuse encephalopathies, e.g. hypoxic-ischemic encephalopathy (Chong and Hirsch 2005). With reference to chronic focal epilepsy, it is unclear how (and whether) the processes of condensation and harmonic generation apply at much smaller spatial and temporal scales (e.g. areas of brain exhibiting high-frequency oscillations). What we do find intriguing however are reports of periodic discharge activity seen with microwire recordings (‘μPEDs’) that probe human cortex at length scales of < 1 mm (Schevon et al. 2008;Stead et al. 2010). We venture that a relation similar to that we have described between PLEDs and scalp EEG (and ADs and the ECoG) exists between μPEDs and the EEG ‘background’ at those length scales. If confirmed, this would imply a mechanism for synchrony in the brain that is consistent over a remarkable four orders of brain volume magnitude (~1 mm3 for a μPED to ~125 cm3 for a macroPLED with linear dimensions ~5 cm).
We conclude by reiterating the similarities we have observed between the dynamic mechanisms underlying periodic lateralized epileptiform discharges and afterdischarges, two well-known EEG phenomena at widely different spatial scales that have not previously been conceptualized together. We believe that our approach, though necessarily limited by the retrospective nature of data collected for purely clinical purposes, provides novel perspective and sufficient predictive hypotheses to inspire focused neurophysiological experimentation.
Acknowledgments
Funding source: National Institute of Neurological Disorders and Stroke Career Development Award (1K23NS079900-01) to GPK.
GPK thanks Bernd Pohlmann-Eden, MD, for his interest. We thank our patients for their willingness to allow their EEG data to be used for this analysis, and the technicians and nurses at the Memorial Hermann Hospital for their help in the collection of these data.
Footnotes
Conflicts of interest: None
References
- Ali II, Pirzada NA, Vaughn BV. Periodic lateralized epileptiform discharges after complex partial status epilepticus associated with increased focal cerebral blood flow. J Clin Neurophysiol. 2001;18:565–569. doi: 10.1097/00004691-200111000-00007. [DOI] [PubMed] [Google Scholar]
- Assal F, Papazyan JP, Slosman DO, Jallon P, Goerres GW. SPECT in periodic lateralized epileptiform discharges (PLEDs): a form of partial status epilepticus? Seizure. 2001;10:260–265. doi: 10.1053/seiz.2000.0506. [DOI] [PubMed] [Google Scholar]
- Baykan B, Kinay D, Gokyigit A, Gurses C. Periodic lateralized epileptiform discharges: association with seizures. Seizure. 2000;9:402–406. doi: 10.1053/seiz.2000.0435. [DOI] [PubMed] [Google Scholar]
- Bozkurt MF, Saygi S, Erbas B. SPECT in a patient with postictal PLEDs: is hyperperfusion evidence of electrical seizure? Clin Electroencephalogr. 2002;33:171–173. doi: 10.1177/155005940203300407. [DOI] [PubMed] [Google Scholar]
- Buzsaki G. Rhythms of the brain. Oxford University Press; 2006. Structure defines function; pp. 29–60. [Google Scholar]
- Chatrian GE, Shaw CM, Leffman H. The significance of periodic lateralized epileptiform discharges in EEG: An electrographic, clinical and pathological study. Electroencephalogr Clin Neurophysiol. 1964;17:177–193. doi: 10.1016/0013-4694(64)90149-x. [DOI] [PubMed] [Google Scholar]
- Chong DJ, Hirsch LJ. Which EEG patterns warrant treatment in the critically ill? Reviewing the evidence for treatment of periodic epileptiform discharges and related patterns. J Clin Neurophysiol. 2005;22:79–91. doi: 10.1097/01.wnp.0000158699.78529.af. [DOI] [PubMed] [Google Scholar]
- Csicsvari J, Hirase H, Czurko A, Buzsaki G. Reliability and state dependence of pyramidal cell-interneuron synapses in the hippocampus: an ensemble approach in the behaving rat. Neuron. 1998;21:179–189. doi: 10.1016/s0896-6273(00)80525-5. [DOI] [PubMed] [Google Scholar]
- Garcia-Morales I, Garcia MT, Galan-Davila L, Gomez-Escalonilla C, Saiz-Diaz R, Martinez-Salio A, de la Pena P, Tejerina JA. Periodic lateralized epileptiform discharges: etiology, clinical aspects, seizures, and evolution in 130 patients. J Clin Neurophysiol. 2002;19:172–177. doi: 10.1097/00004691-200203000-00009. [DOI] [PubMed] [Google Scholar]
- Gloor P. Neuronal generators and the problem of localization in electroencephalography. J Clin Neurophysiol. 1985;2:327–354. doi: 10.1097/00004691-198510000-00002. [DOI] [PubMed] [Google Scholar]
- Grenier F, Timofeev I, Crochet S, Steriade M. Spontaneous field potentials influence the activity of neocortical neurons during paroxysmal activities in vivo. Neuroscience. 2003;119:277–291. doi: 10.1016/s0306-4522(03)00101-5. [DOI] [PubMed] [Google Scholar]
- Grey Walter W. Normal rhythms: their development, distribution and significance. In: Hill D, Parr G, editors. Electroencephalography. McDonald; 1950. [Google Scholar]
- Gross DW, Quesney LF, Sadikot AF. Chronic periodic lateralized epileptiform discharges during sleep in a patient with caudate nucleus atrophy: insights into the anatomical circuitry of PLEDs. Electroencephalogr Clin Neurophysiol. 1998;107:434–438. doi: 10.1016/s0013-4694(98)00103-5. [DOI] [PubMed] [Google Scholar]
- Gurer G, Yemisci M, Saygi S, Ciger A. Structural lesions in periodic lateralized epileptiform discharges (PLEDs) Clin EEG Neurosci. 2004;35:88–93. doi: 10.1177/155005940403500207. [DOI] [PubMed] [Google Scholar]
- Hartings JA, Williams AJ, Tortella FC. Occurrence of nonconvulsive seizures, periodic epileptiform discharges, and intermittent rhythmic delta activity in rat focal ischemia. Exp Neurol. 2003;179:139–149. doi: 10.1016/s0014-4886(02)00013-4. [DOI] [PubMed] [Google Scholar]
- Hirsch LJ, LaRoche SM, Gaspard N, Gerard E, Svoronos A, Herman ST, Mani R, Arif H, Jette N, Minazad Y, Kerrigan JF, Vespa P, Hantus S, Claassen J, Young GB, So E, Kaplan PW, Nuwer MR, Fountain NB, Drislane FW. American Clinical Neurophysiology Society’s Standardized Critical Care EEG Terminology: 2012 version. J Clin Neurophysiol. 2013;30:1–27. doi: 10.1097/WNP.0b013e3182784729. [DOI] [PubMed] [Google Scholar]
- Hughes JR. Periodic lateralized epileptiform discharges: Do they represent an ictal pattern requiring treatment? Epilepsy Behav. 2010;18:162–165. doi: 10.1016/j.yebeh.2010.04.047. [DOI] [PubMed] [Google Scholar]
- Janati A, Chesser MZ, Husain MM. Periodic lateralized epileptiform discharges (PLEDs): a possible role for metabolic factors in pathogenesis. Clin Electroencephalogr. 1986;17:36–43. [PubMed] [Google Scholar]
- Kalamangalam GP, Diehl B, Burgess RC. Neuroimaging and neurophysiology of periodic lateralized epileptiform discharges: observations and hypotheses. Epilepsia. 2007;48:1396–1405. doi: 10.1111/j.1528-1167.2007.01048.x. [DOI] [PubMed] [Google Scholar]
- Kalamangalam GP, Tandon N, Slater JD. Dynamic mechanisms underlying afterdischarge: A human subdural recording study. Clin Neurophysiol. 2014;125:1324–1338. doi: 10.1016/j.clinph.2013.11.027. [DOI] [PMC free article] [PubMed] [Google Scholar]
- Karl JH. Introduction to digital signal processing. Academic Press; 1989. [Google Scholar]
- Kim YS, Choi SY, Kwag HJ, Kim JM. Classification and serial evolution of PLEDs. J Clin Neurol. 2006;2:179–185. doi: 10.3988/jcn.2006.2.3.179. [DOI] [PMC free article] [PubMed] [Google Scholar]
- Neufeld MY, Vishnevskaya S, Treves TA, Reider I, Karepov V, Bornstein NM, Korczyn AD. Periodic lateralized epileptiform discharges (PLEDs) following stroke are associated with metabolic abnormalities. Electroencephalogr Clin Neurophysiol. 1997;102:295–298. doi: 10.1016/s0013-4694(96)95726-0. [DOI] [PubMed] [Google Scholar]
- Nunez PL, Srinivasan R. Electric fields of the brain: The neurophysics of EEG. Oxford University Press; 2006. Spatio-temporal properties of the EEG; pp. 432–485. [Google Scholar]
- Nunez PL, Wingeier BM, Silberstein RB. Spatial-temporal structures of human alpha rhythms: theory, microcurrent sources, multiscale measurements, and global binding of local networks. Hum Brain Mapp. 2001;13:125–164. doi: 10.1002/hbm.1030. [DOI] [PMC free article] [PubMed] [Google Scholar]
- Pohlmann-Eden B, Hoch DB, Cochius JI, Chiappa KH. Periodic lateralized epileptiform discharges--a critical review. J Clin Neurophysiol. 1996;13:519–530. doi: 10.1097/00004691-199611000-00007. [DOI] [PubMed] [Google Scholar]
- Raroque HG, Jr, Gonzales PC, Jhaveri HS, Leroy RF, Allen EC. Defining the role of structural lesions and metabolic abnormalities in periodic lateralized epileptiform discharges. Epilepsia. 1993;34:279–283. doi: 10.1111/j.1528-1157.1993.tb02411.x. [DOI] [PubMed] [Google Scholar]
- Raroque HG, Jr, Purdy P. Lesion localization in periodic lateralized epileptiform discharges: gray or white matter. Epilepsia. 1995;36:58–62. doi: 10.1111/j.1528-1157.1995.tb01666.x. [DOI] [PubMed] [Google Scholar]
- Reiher J, Rivest J, Grand’Maison F, Leduc CP. Periodic lateralized epileptiform discharges with transitional rhythmic discharges: association with seizures. Electroencephalogr Clin Neurophysiol. 1991;78:12–17. doi: 10.1016/0013-4694(91)90013-t. [DOI] [PubMed] [Google Scholar]
- Sadowsky M, Verma A, Wisniewski T. Infections of the nervous system: Prion diseases. In: Bradley WG, Daroff RB, Fenichel GM, Jankovic J, editors. Neurology in clinical practice. Butterworth Heinemann Elsevier; 2008. pp. 1567–1581. [Google Scholar]
- Schevon CA, Ng SK, Cappell J, Goodman RR, McKhann G, Jr, Waziri A, Branner A, Sosunov A, Schroeder CE, Emerson RG. Microphysiology of epileptiform ectivity in human neocortex. J Clin Neurophysiol. 2008 doi: 10.1097/WNP.0b013e31818e8010. [DOI] [PMC free article] [PubMed] [Google Scholar]
- Schraeder PL, Singh N. Seizure disorders following periodic lateralized epileptiform discharges. Epilepsia. 1980;21:647–653. doi: 10.1111/j.1528-1157.1980.tb04318.x. [DOI] [PubMed] [Google Scholar]
- Snodgrass SM, Tsuburaya K, Ajmone-Marsan C. Clinical significance of periodic lateralized epileptiform discharges: relationship with status epilepticus. J Clin Neurophysiol. 1989;6:159–172. doi: 10.1097/00004691-198904000-00003. [DOI] [PubMed] [Google Scholar]
- Stead M, Bower M, Brinkmann BH, Lee K, Marsh WR, Meyer FB, Litt B, Van GJ, Worrell GA. Microseizures and the spatiotemporal scales of human partial epilepsy. Brain. 2010;133:2789–2797. doi: 10.1093/brain/awq190. [DOI] [PMC free article] [PubMed] [Google Scholar]
- Strogatz SM. Norbert Wiener’s brain waves. In: Levin SA, editor. Frontiers in mathematical biology. Springer-Verlag; 1994. pp. 122–138. [Google Scholar]
- Strogatz SM. Hyperion. 2003. SYNC: The emerging science of spontaneous order. [Google Scholar]
- Westmoreland BF. Periodic lateralized epileptiform discharges after evacuation of subdural hematomas. J Clin Neurophysiol. 2001;18:20–24. doi: 10.1097/00004691-200101000-00005. [DOI] [PubMed] [Google Scholar]
- Westmoreland BF, Klass DW, Sharbrough FW. Chronic periodic lateralized epileptiform discharges. Arch Neurol. 1986;43:494–496. doi: 10.1001/archneur.1986.00520050066024. [DOI] [PubMed] [Google Scholar]
- Wheless JW, Holmes GL, King DW, Gallagher BB, Murro AM, Flanigin HF, Smith JR. Possible relationship of periodic lateralized epileptiform discharges to thalamic stroke. Clin Electroencephalogr. 1991;22:211–216. doi: 10.1177/155005949102200409. [DOI] [PubMed] [Google Scholar]
- Wiener N. Cybernetics. MIT press; 1961. [Google Scholar]


